Embed Size (px)
Citation preview

Copyright
by
Arya Ansari
2013
The Thesis Committee for Arya Ansari Certifies that this is the approved version of the following thesis:
Young Minority Children’s Gains in Early Math, Literacy, and Behavior Skills: Associations with Teacher Instruction, Parent Learning
Support, and Parent Involvement
APPROVED BY SUPERVISING COMMITTEE:
Elizabeth T. Gershoff
Su Yeong Kim
Aprile D. Benner
Supervisor:

Young Minority Children’s Gains in Early Math, Literacy, and Behavior Skills: Associations with Teacher Instruction, Parent Learning
Support, and Parent Involvement
by
Arya Ansari, B.A.
Thesis
Presented to the Faculty of the Graduate School of
The University of Texas at Austin
in Partial Fulfillment
of the Requirements
for the Degree of
Master of Arts
The University of Texas at Austin May 2013

iv
Acknowledgements
I am eternally grateful for the endless love and support provided by my mother,
Farah, my father, Rohe, and my sister, Yasi. Without their continued enthusiasm and
encouragement throughout all my endeavors, I would not be where I am today. I am also
deeply indebted to Elizabeth Gershoff, my advisor, and Holly Sexton for their continued
guidance and encouragement in preparing this thesis. I would also like to thank Su Yeong
Kim and Aprile Benner for serving on my committee. To my close friends Latoya and
Anat, I cannot thank you enough for your friendship, which has helped me through this
process. Last but not least, thank you Shadie for always seeing the best in me, supporting
me every step of the way, and giving me the courage to succeed.

v
Abstract
Young Minority Children’s Gains in Early Math, Literacy, and Behavior Skills: Associations with Teacher Instruction, Parent learning
support, and Parent Involvement
Arya Ansari, M.A.
The University of Texas at Austin, 2013
Supervisor: Elizabeth T. Gershoff
There has been growing interest among parents, teachers, researchers, and
policymakers in better understanding children’s school readiness and the precise
mechanisms by which early care and education programs promote these early skills. Two
key, but understudied, mechanisms include preschool instruction and parenting practices.
The present study used the Family and Child Experiences Survey (FACES) 2006 cohort
and examined whether gains in young children’s (n = 2,308) math, literacy, and behavior
problems over the Head Start year were predicted by increased stimulation across
children’s homes and school using structural equation modeling. Net of all other factors,
parent learning support was uniquely associated with lower levels of behavioral problems
and greater math achievement. Although there were no direct effects of parent
involvement on child outcomes, the effects of parent involvement on children’s math and
behavior were mediated through parent learning support. Children also demonstrated

vi
reduced problem behaviors when they received greater teacher instruction. However, the
observed benefits for math achievement and reduced problem behaviors appear to be
stronger when young children receive stimulation across both the home and school
contexts. These findings have implications for children’s early problem behaviors and
achievement, suggesting that parenting practices and teacher instruction are important
avenues that can promote young children’s early skills. For optimal academic and
behavioral outcomes, however, greater effort needs to be coordinated across children’s
home and school settings.

vii
Table of Contents
List of Tables ......................................................................................................... ix!
List of Figures ......................................................................................................... x!
Chapter 1: Introduction .......................................................................................... 1!Teachers' Promotion of Children's Early Skills in Early Education
Programs ............................................................................................... 3 Parents' Encouragement and Support for Children's Learning ...................... 5
Children's Early Behavior Problems .............................................................. 7!Buffering Effects of the Home and School Contexts ..................................... 9
Children's Race as a Moderator ................................................................... 10!Hypotheses ................................................................................................... 11!
Chapter 2: Method ................................................................................................ 12!Participants ................................................................................................... 12!Measures ...................................................................................................... 14 Teacher Characteristics and Instruction .............................................. 15
Parent learning support ....................................................................... 16
Parent Involvement ............................................................................. 16
Children's Language, Literacy, and Pre-writing Skills ....................... 17 Children's Math Skills ......................................................................... 18
Children's Behavioral Problems .......................................................... 18
Family, Child, and Teacher Covariates ............................................... 19
Chapter 3: Results ................................................................................................. 20!Analytic Approach ....................................................................................... 20!Preliminary Descriptive Analyses ................................................................ 22
Distributions and Multivariate Normality .................................................... 23 Measurement Models ................................................................................... 23
Structural Models ......................................................................................... 27
Race as a Moderator of the Effects on Children's Achievement ................. 27

viii
Buffering Effects of Parenting and Teacher Instruction .............................. 28
Post Hoc Analyses ....................................................................................... 29
Chapter 4: Discussion ........................................................................................... 31!Measurement Equivalence ........................................................................... 32!Parent Involvement and Parent Learning Support ....................................... 33
Teacher Instruction ...................................................................................... 36 Buffering Effects of the Home and School .................................................. 37
Limitations ................................................................................................... 38
Conclusion ................................................................................................... 39
References ............................................................................................................. 51

ix
List of Tables
Table 1: Child and Family Demographics ......................................................... 40
Table 2: Teacher and Classroom Characteristics ............................................... 42
Table 3: Spring 2007 Parent Learning Support and Parent Involvement .......... 43
Table 4: Mean Child Outcome Gain Scores ...................................................... 44
Table 5: Measurement and Structural Model Invariance Tests ......................... 45
Table 6: Unstandardized and Standardized Regression Coefficients for Paths from
Latent Variables to Measured Indicators and Structural
Paths ................................................................................................. 46
!

x
List of Figures
Figure 1: Analytic Model ................................................................................... 47
Figure 2: Mean Plot Illustrating Children's Math Skills and the Interaction of
Teacher Instruction and Parent Learning Support ........................... 48
Figure 3: Mean Plot Illustrating Children's Problem Behaviors and the Interaction
of Teacher Instruction and Parent Involvement ............................... 49
Figure 4: Mean Plot Illustrating Children's Problem Behaviors and the Interaction
of Teacher Instruction and Parent Learning Support ....................... 50

1
Chapter 1: Introduction
Nearly half of all children in America are of minority backgrounds, yet many do
not reach basic proficiency in either math or literacy in elementary school (Kuenzi,
Matthews, & Mangan, 2008; U.S. Census Bureau, 2008). Government reports suggest
that approximately 50% of Black and Latino children in elementary school are scoring
below basic proficiency levels compared to roughly 20% of White children (National
Center for Educational Statistics [NCES], 2011). For early math achievement scores,
there are similar trends showing that approximately 34% of Black and 28% of Latino
children are scoring below basic proficiency levels compared to less than 10% of White
children (NCES, 2011). This is an alarming disparity given that early math and literacy
skills serve as the best predictors of later school achievement (Duncan et al., 2007).
These gaps in children’s achievement across racial/ethnic lines have been traced
back to very early causes that occur well before children enter kindergarten (Duncan et
al., 2007; Duncan & Magnuson, 2005). In particular, Duncan and Magnuson (2005)
found that on average, Black and Latino children are not doing as well as their White
peers upon kindergarten entry in important areas of early math and literacy. Once these
early gaps in achievement are established, minority children are less likely to catch up to
their White peers and less likely to do as well later in high school (Brooks-Gunn &
Duncan, 1997; Phillips, Crouse, & Ralph, 1998; Vandell, Belsky, Burchinal, Steinberg &
Vandergrift, 2010).
Many scholars have argued that the gaps in school achievement are rooted in a

2
range of persistent risk factors that minority children and their families face (Duncan &
Magnuson, 2005; Gormley, Gayler, Phillips, & Dawson, 2005; Huston & Bentley, 2010;
Mistry, Benner, Biesanz, Clarke, & Howes, 2010). These risk factors include but are not
limited to: low-income inequality, low levels of parental education, family structure (e.g.
single parent families), low parental age, parental stress, immigrant status, residential
instability, low-quality neighborhoods, and lack of access to high quality care (Duncan &
Magnuson, 2005; Gershoff, Aber, & Raver, 2003; Huston & Bentley, 2010; Raver,
Gershoff, & Aber, 2007). In particular, Dearing and colleagues (2009) examined early
math and literacy skills among school-aged children and found that young children’s
early skills are inhibited by the above-mentioned risk factors.
There is hope for these children, however. Quality early education programs have
been found to buffer children from early risk factors (e.g. low-quality home environment)
and at the same time to promote children’s early skill gains (Burchinal et al., 2000;
Crosnoe, 2006; Dearing et al., 2009; Gormley et al., 2005; Loeb et al., 2004, 2007;
Magnuson et al., 2004, 2007; Votruba-Drzal, Coley, & Lansdale, 2004; Winsler et al.,
2008). Along with the facilitation of early math and reading achievement, the benefits of
high-quality early education programs can last through middle school (Dearing et al.,
2009) and can impact other domains of development including children’s social skills and
behaviors (Winsler et al., 2008). It should be noted, however, that high quality (and
usually expensive) programs are often unavailable to immigrant and minority children
despite their being populations that could most benefit (Fuller et al., 1996; Magnuson et
al., 2006; NICHD, 2006; Wesley & Buysse, 2010).

3
Teachers’ Promotion of Children’s Early Skills in Early Education Programs
Most research and policy findings to date have emphasized that teachers’
educational attainment and teaching experience are key components that impact
children’s early skill gains (Loeb et al., 2004; NICHD ECCRN & Duncan, 2003).
However, recent studies have begun to question how predictive such factors really are
with regard to children’s early achievement (Barnett, 2003; Brown, Molfese, & Molfese,
2008) because scholars have failed to find clear evidence that greater teacher education,
in and of itself, results in greater gains in children’s early skills or that it improves
classroom quality (Early et al., 2006, 2007; Pianta et al., 2005). Teachers’ type of degree
attained (e.g. bachelors in child development versus bachelors in a field outside of early
education) has also been found not to matter in predicting child outcomes (Early et al.,
2006, 2007).
These emerging findings do not necessarily suggest that teacher education should
not or does not matter. What these findings do suggest, however, is an important issue
that needs to be addressed with regard to the recent push by policy makers emphasizing
preschool teachers’ educational attainment and qualifications. As noted by Early and
colleagues (2006, 2007), teachers’ education is just one component of the larger
educational system and children’s early skill gains are influenced by other factors such as
instructional practices, classroom setting, curricular support, hours in classroom, and
class size. Similarly, Pianta and colleagues (2005) note that features such as teachers’
education and qualifications do not impact children’s early skill gains as much when
compared to what teachers are actually doing in classrooms (e.g. teacher instruction).

4
Therefore, teachers’ education and qualifications cannot be the only benchmark used for
determining what constitutes a good teacher.
Surprisingly, there has been little empirical evidence to pinpoint specific
pathways, such as teachers’ instructional practices (e.g. the amount of time teachers
spend on literacy and math instruction/activities within the classroom), that might
promote early math, literacy, and behavior skills among minority children at an early age.
Instead, much of the prior literature on the gaps in math and/or literacy proficiency have
examined global measures of quality (Dearing et al., 2009) or have generally neglected
minority children (e.g. NICHD ECCRN) by using typically homogenous and White
samples (Dearing et al., 2009).
The work that has examined teacher instruction has generally examined the
quality of instructional climate (e.g. responsiveness, involvement, and sensitivity) and to
a lesser extent, the frequency of preschool literacy instruction (Connor, Morrison,
Slominski, 2006; Hamre & Pianta, 2005; Magnuson, Ruhm, & Waldfogel, 2007). It has
been found that children exhibit greater skill growth especially in areas of early language
skills when children had teachers who provided higher quality instruction (Hamre &
Pianta, 2005; Howes, et al., 2008, Burchinal, et al., 2008; NICHD, 2002). In particular,
Hamre and Pianta (2005) found that high quality and consistent teacher instruction in
early elementary school protected at-risk children from future academic
underachievement and children displayed similar levels of academic skills compared to
their low-risk peers. More importantly, emerging studies also suggest that teacher
instruction is just as important as, if not more important than, characteristics of centers

5
and classrooms (Howes, et al., 2008) and children who experience greater quality and
frequency of instruction are more likely to succeed upon elementary school entry when
compared to those children who do not experience quality instruction (Justice,
Kaderavek, Fan, Sofka, & Hunt, 2009; Magnuson et al., 2007). Of great concern,
however, is that children in preschool classrooms are not receiving the appropriate levels
or quality of teacher instruction (Justice, Mashburn, Hamre, & Pianta, 2008). Given the
lack of current research examining the type of instruction children receive, this proposed
study examined teachers’ instructional practices as a predictor of child outcomes.
Research question 1: To what extent does teacher instructional time in areas of
emergent literacy (pre-writing, receptive vocabulary, phonological awareness,
and letter recognition) and early mathematics (early math reasoning,
quantitative, and analytical skills) predict gains in children’s math and literacy
when controlling for teacher qualifications (refer to Figure 1)?
Parents’ Encouragement and Support for Children’s Learning
In addition to the role played by early education settings, there has been growing
support for parent involvement as significantly contributing to and promoting children’s
early development and skill gains (Arnold, Zeljo, Doctoroff, & Ortiz, 2008; Christenson,
2004; Dearing, Kreider, Simpkins, & Weiss, 2006; Fan & Chen, 2001; Fanutzzo,
McWayne, Perry, & Childs, 2004; Fantuzzo, Tighe, & Childs, 2000; Raver et al., 2007).
Even though both parenting and early childhood education programs promote children’s
early skill gains, parents play a more salient role in children’s early development and
have a far greater effect size when compared to early school settings (Belsky et al., 2007;

6
NICHD ECCRN, 2006).
Parent involvement can be separated into two larger domains (Fantuzzo et al.,
2000), the first consisting of involvement in children’s school setting (e.g. attending
parent-teacher conferences) and the second consisting of parent learning support at home
(e.g. practicing literacy and math activities with child). Research suggests that parents
who provide greater levels of learning support at home are also more likely to participate
in children’s school settings but that parent learning support in the home is the better
predictor of later school outcomes (Castro, Bryant, Peisner-Feinberg, & Skinner, 2004;
Fantuzzo et al., 2004). Even so, there are few studies that examine the links of parent
involvement both at school and at home with child outcomes in preschool, especially
within a sample of low-income minority children.
Research examining the socioeconomic contexts of children’s development has
found that children living in poverty experience less cognitive stimulation from their
parents at home and that parents are less likely to be involved in children’s school
settings compared to more privileged children (Arnold et al., 2008; Bradley, Corwyn,
McAdoo, & Coll, 2001). Specifically, Bradley and colleagues (2001) found that parents
from low-income families are less likely to spend time reading to their children,
practicing early math skills with their children, and helping their children with their
school work than more affluent parents. These parental practices are an influential part of
children’s early lives and have been found to have a positive impact on their early skill
gains (Fantuzzo, et al., 2004; Mistry et al., 2010; NICHD ECCRN, 2006); in the absence
of these practices, children have been found to underachieve at the age of seven

7
(Melhuish et al., 2008).
School involvement by parents has also been linked with gains in early academic
achievement and with lower-levels of behavioral concerns (Administration for Family
and Children [ACF], 2003; Arnold et al., 2008; Christenson, 2004; Dearing et al., 2006;
Fantuzzo et al., 2000, 2004; Marcon, 1999; Rimm-Kaufman, Pianta, Cox, & Bradley,
2003). In theory, parents who participate more in their children’s schools should exhibit a
greater capacity to support and encourage their children’s learning at home. Yet there
remains very little empirical evidence of parent involvement in preschool settings being
associated with children’s skill gains or whether learning support mediates the relation
between parent involvement and child outcomes. This is because most of the parental
involvement literature has focused on kindergarten and grade school or has focused on
less vulnerable groups. As posited by Arnold and colleagues (2008), parental
involvement in preschool is different from parental involvement in kindergarten due to
the differences in classroom characteristics and therefore trying to generalize findings
from kindergarten settings to preschool settings can be problematic. Clearly, much more
research is needed to get a better understanding of the processes through which early
education programs and parental practices influence children’s early skill gains.
Research question 2: To what extent does parent learning support in the areas of
early math and literacy at home and parent involvement in children’s school
settings promote gains in children’s early math and literacy skills independent
of teacher instruction (refer to Figure 1)?
Children’s Early Behavior Problems

8
The growing emphasis on early math and literacy skills, however, has also
generated concern over children’s socio-emotional skills and problem behaviors, which
some fear might be neglected in early school settings (Raver & Zigler, 2004). Many have
argued for the inclusion of children’s social skills and behavior problems in addition to
children’s achievement as a part of the definition for being ‘school ready’ (McClelland,
Cameron, Connor, Farris, Jewkes & Morrison, 2007; Raver & Zigler, 2004). Empirical
evidence, however, is mixed with regard to whether problem behaviors are an important
component of school readiness and whether problem behaviors predict future academic
achievement. Some studies have found that children with lower behavioral problems
appear to demonstrate greater future academic success (Fantuzzo, Bulotsky-Shearer,
Mcdermott, McWayne, & Perlman, 2007; McClelland et al., 2007), while others suggest
otherwise. Specifically, Duncan and colleagues (2007) found that even heighted problem
behaviors are a relatively insignificant predictor of later school performance especially in
comparison to children’s early achievement and attention skills. This study will attempt
to address the inconsistencies in the literature by examining whether problem behaviors
are an important component of children’s early school readiness.
Within the early education literature, teachers’ emotional support has been found
to predict young children’s achievement and behavior (Hamre & Pianta, 2005); however,
whether greater instructional support predicts reduced problem behaviors is relatively
unknown. Prior literature has found that parent involvement and parent learning support
predict a reduction in children’s problem behaviors in addition to future retention rates
and special education placement (Fantuzzo, et al., 2004; Miedel & Reynolds, 1999;

9
Nokali, Bachman, Votruba-Drzal, 2010). Of the two, parent learning support has been
found to be a stronger predictor of children’s behaviors compared to school-based
involvement (Fantuzzo et al., 2004). However, children’s behavioral problems have yet
to be examined across both the home and school context to determine whether the
benefits of stimulation across multiple settings are greater than parenting practices or
teachers’ instructional practices.
Research question 3: To what extent does parent learning support at home, parent
involvement in children’s school setting, and teacher instruction reduce
children’s behavior problems (refer to Figure 1)?
Buffering Effects of the Home and School Context
Further, not much is known about the interaction of classroom, family, and child
characteristics and whether parent learning support at home and involvement in
children’s school setting enhance the positive impact of teacher instructional practices in
preschool (NICHD ECCRN, 2006). Uncovering what features of parent involvement and
parent learning support are most important for children’s early education and examining
if parent learning support or parent involvement moderate the effect of teacher
instructional practices are two key issues this study will attempt to address. This study
will also examine the importance of parental practices within the home compared to
outside of the home to determine what processes are the most important pathways
through which children make gains in early academics and behavior.
Research question 4: Do parent learning support and parent involvement (both
separately and together) amplify (moderate) the effects of teacher instruction

10
on children’s early gains in math, literacy and behavior (refer to Figure 1)?
Children’s Race as a Moderator
There is a growing number of studies that question the validity of measures of child
assessments and parenting practices for children across different race/ethnic groups
(Brooks-Gunn & Markman, 2005; Raver et al., 2007). The early care and education
literature also suggests the benefits of preschool programs vary according to children’s
race/ethnicity (Currie & Thomas, 1995; Gormley et al., 2005). Specifically, researchers
find that Hispanic children are more likely to benefit from Head Start services compared
to Black youth (Currie & Thomas, 1995), while minority children are more likely to
benefit from universal pre-kindergarten programs compared to White children (Gormley
et al., 2005). Unfortunately, when examining teacher-child relationships and parenting
practices for young children, the role of ethnicity as a moderator has received little
attention. Accordingly, another approach to consider is whether there are potential
differences by demographic groups in the models with measures of parenting, teaching
practices, and child outcomes. Given the concerns about race, a final aim of this study is
to also better understand the extent to which paths from teacher instruction, parent
involvement, and parent learning support differ in predicting children’s early gains across
math, literacy, and behavior skills. It is important to note, however, that in this sample of
children and families, the data is limited to broader definitions of race/ethnicity (e.g.
Latino, Black, White) and I cannot take under consideration within race-group
differences (e.g. Cuban vs. Mexican).
Research question 5: Are Latino and Black children most likely to benefit from

11
teacher instructional time, parent involvement, and parent learning support?
Hypotheses
With regard to research question 1, I expect that more teacher instructional time in
areas of emergent literacy and mathematics will predict greater gains in children’s early
math and literacy skills when controlling for teacher qualifications (Early et al., 2006,
2007; Pianta et al., 2005). Second, given the prior literature which suggests that the home
learning environment is key for promoting children’s early skill gains (Bradley et al.,
2001; Melhuish et al., 2008; NICHD ECCRN, 2006), I hypothesize that greater parent
learning support will promote higher gains in children’s early math and reading skills
independent of teacher instruction compared to children who receive less parent learning
support. I also anticipate that greater parent involvement in children’s school settings will
predict gains in children early math and literacy skills but not as strongly as parent
learning support (Castro et al., 2004; Fantuzzo et al., 2004). Third, I hypothesize that all
three forms of stimulation (teacher instruction, parent learning support, and parent
involvement) will result in improved child behavior (Fantuzzo et al., 2007). With regard
to research question 4, I hypothesize that greater levels of parent learning support in areas
of early math and reading and/or parent involvement will amplify the effects of teacher
instruction on children’s early skill gains and behavior whereby children who experience
more frequent teacher instruction and also experience greater parenting at home and/or at
school will make the greatest gains (Magnuson et al., 2004; Votruba-Drzal et al., 2004).
Considering that children from Latino backgrounds have been found to benefit more from
Head Start services (Currie & Thomas, 1995), it is expected that Latino children would

12
exhibit stronger gains compared to White and Black children.

13
Chapter 2: Method
Participants/Procedures
To address these questions, the study is based on secondary data analyses of the
Head Start Family and Child Experiences Survey- 2006 Cohort (FACES-2006), which is
a nationally representative and longitudinal sample. The purpose of FACES-2006 was to
better understand how Head Start programs were helping low-income families receive
services and the effects of Head Start at the national level on children’s school readiness.
Head Start centers were randomly selected according to the proportion of three- and four-
year old children entering the facility. Within each center, newly enrolled children were
selected for participation with parental consent. It should be noted that FACES 2006
oversampled for three-year old children to compensate for attrition in the extra year of
follow-up and the sample did not include children who were in their second year of Head
Start. Data collection began in the fall of 2006 during children’s initial Head Start year
(wave 1) and children were then followed up during the following spring of their Head
Start year (wave 2) and finally during the spring of their kindergarten year (wave 3).
Children who entered Head Start at age three had an additional wave of data. Data was
collected from direct child assessments, center-director interviews, parent and teacher-
self reports, and classroom observations. It should be noted that for this study, only the
first two waves were used in data analyses.
Within the FACES-2006 sample, there were two cohorts of children enrolled in
125 different Head Start centers across the country. The first cohort of children were
those who participated at the age of three and subsequently may have experienced an

14
additional year of Head Start before they entered kindergarten and the second cohort
included children who only experienced one year of Head Start at the age of four. The
FACES sample consisted of 2,308 ethnically diverse (24% White, 40% Black, 36%
Latino) pre-school aged (M =45.26, SD = 6.64) children (refer to Table 1 for child and
family demographic information). It should be noted that because of the heterogeneity of
the Latino population (De Feyter & Winsler, 2009) and the fact that English-language
learners are more likely to be behind in school than English-speakers (Capps et al., 2005),
I divided the Latino population into two groups. The first group consisted of English-
speaking children (n = 306; defined as children whose home language is English and they
passed the language proficiency screener during testing) while the second group
consisted of Spanish-speaking children (n = 532; defined as those whose home language
was Spanish or they failed the language proficiency screener). Also, for this study only
White, Black, and Latino groups were used in data analyses.
The FACES sample was also relatively evenly split by gender (51% female) and
almost all children were born in the United States (96%). Upon Head Start entry, well
over half of all children (60%) in FACES-2006 were living below the federal poverty line
and approximately nine in ten children (89%) were living below or at 185% of the
poverty threshold. Poverty rates in this sample are relatively high due to Head Start
eligibility criteria. Additionally, only one in three children came from married households
(33%) or had mothers who did not have a high school diploma (35%). With regard to the
primary household language, the majority of families primarily spoke English (73%).
Measures

15
Teacher characteristics and instruction. Information for teachers’ qualifications
were gathered through teacher interviews at the beginning and end of the year when
teachers reported their highest level of education, the number of years they have been at
their current program, any technical certificates or any workshop trainings they have
attended, and basic job characteristics (refer to Tables 2 for teacher and center
information).
Teachers also reported on program information including their classroom
instructional practices (see Table 2) using a six-point Likert scale that assessed the
frequency with which teachers conducted different activities with children. Specifically, a
score of 1 indicated “never,” 2 indicated “once a month or less,” 3 indicated “two or three
times a month”, 4 indicated “once or twice a week”, 5 indicated “three or four times a
week”, and 6 indicated “every day”. Teacher literacy instruction includes 11 variables
that reflect different types of instruction and are indicated by questions that determine the
degree to which teachers: taught names of letters, discussed new words, worked on
phonics, and taught conventions of print. Items were averaged into a composite score
where higher scores indicate greater teacher instruction. The reliability of this composite
was good (! = .81). Similar to literacy instruction, teacher math instruction was created
from teachers’ responses to 10 items including the frequency of teachers who: counted
out loud, worked with geometric manipulatives, played math related games, and engaged
in activities with shapes and patterns. Math instruction items were also averaged into a
composite score and the reliability of this composite was acceptable (! = .77). Teacher
math and literacy instruction were highly correlated, r (2305) = .66, p < .001.

16
Accordingly, they were combined into latent factors using structural equation modeling
(SEM) via confirmatory factor analysis (CFA) and averaged scores for math and literacy
instruction were used. These procedures were also replicated for parent involvement.
Parent learning support. Parents’ behaviors were assessed through self-report
measures during interviews at each wave of the study (see Table 3). The parent learning
support scale was created from parents’ responses to eight questions from the Home
Observation for Measurement of the Environment scale (HOME; Caldwell & Bradley,
1984). Questions were scored as 0 = “no” or 1 = “yes.” Parent learning support is
indicated by questions that address the support for children’s learning, namely if parents:
told child a story, taught child letters, words, or numbers, played counting games, and
read to child at least three times in the past week. Reliability of this scale was low for
both age groups (! = .54), however, the scale was retained because the HOME Scale is
often used to measure parent learning support and is the only evaluation used in FACES-
2006. Because of low reliability, I was unable to create a latent factor for parent learning
support; instead, the average observed-score was used in all analyses.
Parent Involvement. During the spring of 2007 (wave 2) parents reported on
how often they participated in their children’s preschools since the start of the program
year (refer to Table 3). The parent involvement survey was based on a five-point Likert
scale for which a score of 1 indicates “not yet,” 2 indicates “once or twice,” 3 indicates
“several times,” 4 indicates “about once a month,” and 5 indicates “at least once a week.”
Parents indicated how often they: attended parent-teacher conferences, attended parent
education meetings or workshops, volunteered at the preschool, assisted with fieldtrips,

17
and attended fundraisers or other play groups. Reliability for the full parent involvement
scale was acceptable (! = .80). Note, however, that in these analyses the parent
involvement scale was divided into two averaged composites both of which had
acceptable reliability (social involvement ! = .70; classroom involvement ! = .74) and
were significantly correlated, r (2166) = .55, p < .001.
Children’s language, literacy, and pre-writing skills. Children’s receptive
vocabulary was tested using the Peabody Picture Vocabulary Test (PPVT; Dunn & Dunn,
1997). Spanish speaking children were administered both the PPVT and the Test de
Vocabulario en Imagenes Peabody (TVIP; Dunn, Padilla, Lugo, & Dunn, 1986). During
the fall of 2006, approximately 14% of children were administered all assessments in
Spanish and in the spring of 2007, roughly 6% of children completed all assessments in
Spanish. The PPVT and TVIP are norm-referenced assessments used to measure
children’s vocabulary knowledge and language ability with high-published reliabilities (!
= .93 & .95; Dunn & Dunn, 1997). All children were also assessed using subsets of the
Woodcock Johnson III (WJ III; Woodcock, McGrew, & Mather, 2001) to measure their
language and literacy skills including: letter-word identification, spelling, diction, oral
comprehension, phonological skills, and basic reading (see Table 4 for children’s
language, math, and behavioral gain scores). The Spanish version of the Woodcock
Johnson, the Woodcock-Muñoz (W-M III; Woodcock & Muñoz-Sandoval, 1996) was
available to children who failed the language screener or for children who missed three
consecutive items within a subscale. The Woodcock Johnson is also a norm-referenced
assessment with strong published reliabilities (! = .80 to .90; Woodcock, McGrew, &

18
Mather 2001). The Story and Print Concepts task (Mason & Stewart, 1989) was also
administered to evaluate children’s: comprehension of basic story concepts, knowledge
of how print is used to convey meaning, and mechanics of reading. Within the larger
FACES 2006 sample, the reliability for the Story and Print Concepts task was acceptable
(! = .70 to .78).
Children’s math skills. The Applied Problems subscale of the Woodcock
Johnson (Woodcock, McGrew, & Mather, 2001) was used to assess children’s early math
skills in preschool. Spanish versions of the assessment were again administered to
children who failed the language screener (Woodcock & Muñoz-Sandoval, 1996).
Assessed math skills include: applied problems, quantitative concepts, number series,
calculation, and counting. Published reliabilities of the math sections are high (! = .86;
Woodcock, McGrew, & Mather 2001). In addition to the Woodcock Johnson, preschool
children’s math skills were also evaluated directly through nationally normed
assessments that were developed for the Early Childhood Longitudinal Study, Birth
Cohort (ECLS-B; Snow et al., 2007). Twenty-three items were used from the ECLS-B
assessment including questions that evaluate children’s: classification, comparison,
pattern, and shape recognition skills. Published reliabilities of the ECLS-B assessments
are high (! = .89; Najarian, Snow, Lennon, & Kinsey, 2010).
Children’s behavioral problems. Teachers provided reports on children’s
negative behaviors in the fall and spring of the Head Start year. Assessment items were
drawn from the Behavioral Problems Index (Peterson & Zill, 1986), which is based on a
three-point likert scale (1 = never, 2= sometimes, 3= very often), where higher scores

19
represent more frequent problem behaviors. Ratings of children’s behaviors included
information on the frequency of children’s aggressive behavior (e.g. “hits/fights with
other children”), hyperactive behavior (e.g. “is very restless”) and anxious/withdrawn
behavior (e.g. “is unhappy”). Within the literature the BPI has been found to have high
internal consistency (! = .89; Berry, Bridges, & Zaslow, 2004) and the three subscales
were significantly correlated, r (2161) = .25-45, p < .001. Thus, for the purposes of this
study, the above subscales were used to create an overall latent factor for children’s
behavioral problems.
Family, child, and teacher covariates. Children’s age, gender, and immigrant
status were collected at each wave. Demographic information for both parents was also
collected at each wave including: age, gender, race/ethnicity, highest degree attained,
employment status, and marital status. Families also provided information on their
household characteristics including: family income, family structure/size, and the
language spoken at home (English, Spanish, Other). Family income, household size, and
the federal poverty line were used to compute a ratio-of-income to poverty composite. In
terms of school characteristics, teachers and administrators provided information on:
class sizes, child-teacher ratios, teacher’s education, teacher’s years of experience,
teachers’ race, and the frequency of mathematic and literacy instruction. Finally, based
on teachers’ and children’s race/ethnicity I created a child-teacher congruence variable (0
= not congruent, 1= congruent).

20
Chapter 3: Results
Analytic Approach
First, preliminary descriptive analyses were conducted (e.g. frequencies, mean,
median, standard deviation, confidence intervals, correlations, skew etc.) to summarize
the raw data that was used in more advanced statistical procedures. Next, demographic
information for all children and families were examined. I conducted ANOVAs for all
continuous variables (family income and parental education) by racial and ethnic lines
and Chi-Square analyses for all categorical variables (marital status, parent birth country,
and child gender). Outlier analyses were also conducted prior to main analyses and they
were checked for possible sources of error (e.g. coding). Further, for all measures, alpha
coefficients were also assessed to ensure that measurement reliabilities were similar to
the expected instrument reliabilities. Given that some of the constructs (e.g. teacher
instructional practices and parent learning support) in these analyses consisted of multiple
variables, if reliability permitted, I conducted confirmatory factor analyses to decide what
factors were related by determining latent factors.
Missing data were minimal for most variables; however, to account for missing
data I used full-information maximum likelihood estimation (FIML), which is the
preferred method over listwise and pairwise deletion because it is efficient and unbiased.
In particular, FIML estimation fits the covariance structure model to the data for each
individual participant. FIML is also the preferred methodological approach for
generalizing results to the population by using all available data and also assumes that
missing data are missing either completely at random (MCAR) or at random (MAR;

21
Arbuckle, 1996; Schafer & Graham, 2002). It should also be noted that within FACES-
2006, children and their families (Level 1) are embedded within classrooms (within the
sample there is only one classroom per center; Level 2). To take into account shared
variances, I clustered according to teacher ID in order to model classroom influences on
each child’s early math and literacy gains. Math and literacy gains across the Head Start
year were separately computed by subtracting children’s fall assessment scores from their
spring assessment scores. Multi-group analyses of ethnicity were also conducted whereby
a series of comparative models were created for English- and Spanish-speaking Latinos,
Blacks, and White children. All models were conducted using Mplus statistical package
version 6.1 (Muthen & Muthen, 2011).
Structural equation modeling (SEM) was used as the main analytic approach for
this proposed project. SEM has a few distinct advantages over traditional regression
analysis including: (1) the ability to use multiple variables to indicate latent constructs,
(2) the ability to examine multiple mediational pathways, and (3) the ability to model
measurement error for all variables, not just for a single error term for the model. The fit
of all models and their path coefficients was examined using the Comparative Fit Index
(CFI), the Root Mean Square Error of Approximation (RMSEA), and the Standardized
Root Mean Square Residual (SRMR) to determine the significance of the relations
between the exogenous variables (e.g. predictor variables: teacher instruction) and
endogenous variables (e.g. outcomes: child[ren]’s math skills and mediators; Bentler,
2007; McDonald & Ho, 2002). Alternative models were compared using chi-square
difference tests.

22
Preliminary Descriptive Analyses
Results from demographic analyses comparing children from different race groups
are reported in Table 1 and considering the relatively large sample, a more stringent level
of significance was set at (p " .001). Results suggest that Black children were more
likely to come from single-parent households (66%) while Spanish-speaking children
were more likely to be raised in traditional two-parent homes (48%). Although the
majority of children came from families with parents who had received less than or the
equivalent of high school education, children from Spanish-speaking Latino families
were more likely to have mothers (58%) and fathers (68%) who had dropped out of high
school compared children from other race groups. Latino children were also more likely
to come from larger families with older mothers (M= 29.94) and fathers (M= 32.77).
Further, even though all children were living in poverty, Blacks (27%) were more likely
to live below 50% of the poverty threshold while Spanish-speaking Latinos (47%) were
most likely to live between 50-100% of the poverty threshold. In terms of children’s
achievement, there were relatively few differences across race groups aside from Black
children who scored significantly lower on the ECLS-B Math section (M = 2.32, SD =
2.22) than Whites and Latinos (see Table 4).
Results also suggest that Black children were enrolled in slightly larger classrooms
(M = 18.02, SD = 2.03) than their counterparts (M= 17.14 to 17.53). Interestingly, the
majority of White (79%) and Black (68%) children were in racially congruent classrooms
while only half of Spanish and English-speaking Latino children (between 49-51%) were
taught by Latino teachers. Although White children were exposed to more educated

23
teachers (37% Bachelors; 16% some graduate school), they received the least literacy (M
= 5.15, SD = 0.62) and math (M = 5.07, SD = 0.64) instruction.
Distributions and Multivariate Normality
Multivariate non-normality violates SEM assumptions and under certain conditions
can bias fit statistics, parameter estimates, and standard errors (Kline, 2010). Although
there is no consensus for a cutoff to indicate unacceptable skew, many believe that a
value greater than or less than one is cause for concern; Kline (2010), however, suggests
that any value greater or less than three is an indication of unacceptable skew, but
otherwise is admissible. Further, with larger sample sizes and maximum likelihood
estimation with robust standard errors (MLR), non-normality becomes less of a concern
and has been found to have little-to-no effect on model estimates (Kline, 2010; Lei &
Lomax, 2005). Descriptive analyses suggest that a few of the variables were slightly
skewed (skew range of -1.43 to 1.61) but none fell above Kline’s recommended cutoff of
three and all seemed to be within a reasonable range. Because of the large sample size
and the use of MLR, analyses were conducted without transforming the data.
Measurement Models
A single measurement model, including a full set of covariates, was tested using
SEM for the five latent variables including: parent involvement, teacher instruction,
children’s standardized math and literacy achievement, and children’s behavioral
concerns. In all models, several correlations were included among the control, structural,
and measurement variables in order to improve fit. These correlations were included only
if they made theoretical sense. Further, all models nested children within their classrooms

24
during the spring of their Head Start year to adjust standard errors to account for shared
variances at the classroom level. Preliminarily, measurement equivalence for the full
model was tested comparing two separate models where either (a) all factor loadings
were free or (b) all factor loadings were fixed to be equivalent across the four-race/ethnic
groups. Due to the complex nature of data, I used the Satorra-Bentler mean-adjusted chi-
square test, a robust maximum likelihood estimation technique to compare model fit
(Satorra, 2000). I relied on both chi-square statistics and other measures of model fit that
are less sensitive to sample size including the comparative fit index (CFI), the root-mean
square error of approximation (RMSEA), and the standardized root-mean-square residual
(SRMR). CFI values greater than .95 and RMSEA/SRMR values less than .05 have been
recommended as cutoffs for good model fit (Hu & Bentler, 1998).
The Chi-square difference test comparing the fully constrained model to the fully
free model was significant (#$ = 85.29, df =39, p < .001) and fit statistics suggest that the
unconstrained model was best fitting (#CFI = .019, #RMSEA = .003, #SRMR= .004).
As a result, measurement invariance was tested for each individual path from the latent
variable to the measured indicators where pathways were either held equivalent or
unconstrained (see Table 5 for fit indices and Table 6 for factor loadings). Further, all
measurement models were tested twice either (a) holding latent variable variances
constant or (b) setting one factor loading to 1.0. Because results were comparable across
both sets of analyses, only measurement models with variances held constant will be
reported.

25
The measurement model (see Table 6 for factor loadings) for parent involvement
was represented by the observed variables of parents’ average social involvement and
classroom involvement, both of which had significant factor loadings. Compared to the
fully constrained model, however, measurement invariance tests indicate that both social
involvement (#$ = 23.98, df = 3, p < .001, #CFI = .012, #RMSEA = .002, #SRMR=
.002) and classroom involvement (#$ =23.99, df = 3, p < .001, #CFI = .007, #RMSEA =
.001, #=SRMR= .001) varied significantly across ethnic groups (see Table 5 for model fit
indices). Teacher instruction was also strongly predicted by teachers’ time spent on math
activities (% = .45, p < .001; for unstandardized coefficients and standard errors refer to
Table 6) and literacy activities (% ranged from .38 to .48, p < .001). Invariance testing
suggests that math instruction did not vary as a function of children’s race (#$ = .44, df =
3, p = .931, #CFI = -.002, #RMSEA = -.001, #SRMR= -.003); literacy instruction (#$ =
8.01, df = 3, p < .05, #CFI = .003, #RMSEA = .00, #SRMR= .00) did, however.
The latent construct for children’s math achievement was comprised of children’s
assessment scores on the Woodcock Johnson Applied Problems (WJAP) and the ECLS-B
math section. Again, both factor loadings loaded strongly on the latent factor for math
achievement with standardized coefficients ranging from .57 to .89 (p < .001). Invariance
testing suggested that, compared to the constrained model, both the ECLS-B math section
(#$ = 11.94, df = 3, p < .01) and the WJAP (#$ = 8.69, df = 3, p < .05) were not
equivalent across groups. Similarly, children’s literacy achievement was made up of the
Woodcock Johnson Spelling Word (WJSW), the Woodcock Johnson Letter-Word
(WJLW), the Peabody Picture Vocabulary Test (PPVT), and the Story and Prints

26
Concept. Although all four observed variables loaded strongly onto the latent construct
for literacy, neither the PPVT (#$ = 3.05, df = 3, p = .38, #CFI = .00, #RMSEA = .00,
#SRMR= .00), the Story and Prints Concept (#$ = 3.25, df = 3, p = .35, #CFI = .00,
#RMSEA = .00, #SRMR= .00), nor the WJSW (#$ = 7.88, df = 3, p =.08, #CFI =
.0001, #RMSEA = .00, #SRMR= .00) varied as a function of race. The WJLW (#$ =
60.68, df = 3, p < .001, #CFI = .005, #RMSEA = .00, #SRMR= .00) was inequivalent,
however.
The final latent variable testing children’s behavioral concerns, included
children’s hyperactivity (% = .74-.78, p < .001), disruptive behavior (% = .57-.65, p <
.001), and withdrawal symptoms (% = .39-.46, p < .001). Measurement invariance testing
of children’s hyperactivity (#$ = 5.85, df = 3, p = .12, #CFI = .002, #RMSEA = .00,
#SRMR= .00), disruptive behavior (#$ = 3.25, df = 3, p = .35, #CFI = .00, #RMSEA =
.00, #SRMR= .00), and withdrawn behavior (#$ = 1.16, df = 3, p = .76, #CFI = -.001,
#RMSEA = -.001, #SRMR= .00) resulted in a non-significant difference in chi-square
value, supporting the more parsimonious measurement model for children’s behavior
problems.
Accordingly, all the multi-group structural models below held the following paths
equal across race groups: teachers’ math instruction, children’s behaviors (withdrawal,
hyperactivity, disruption) and children’s literacy skills (WJSW, PPVT, Story and Prints
Concepts). In contrast, parents’ involvement (social and classroom), teachers’ literacy
instruction and children’s math skills (ECLS-B, WJAP) and the WJLW paths were
allowed vary freely across race groups.

27
Structural Models
Next, structural models were examined for the full sample of children, after
controlling for the other predictors, covariates, and also taking into account measurement
invariance (see Table 6). Results suggest that greater parent learning support within the
home was associated with improved child behavior (% = -.13, p < .01) and greater math
achievement (% = .07 p < .05). Literacy skills, however, were not predicted by parent
learning support (% = .02 p = .66). Parent involvement was also unrelated to children’s
math achievement (% = -.02, p = .61), literacy achievement (% = .03, p = .55), and
children’s behavior concerns (% = .07, p = .06). Although there were no direct effects for
teacher instruction with either math achievement (% = -.02, p = .48) or literacy
achievement (% = .02, p = .70), there was a direct effect for greater teacher instruction
with a reduction in children’s problem behaviors (% = -.13, p < .01).
In addition to direct effects, I was also interested in any possible indirect effects,
which were tested using the INDIRECT command in Mplus. Of great interest was
whether there were any indirect effects on children’s achievement and problem behavior
via parent learning support. Results suggest that parent involvement exerted an indirect
impact on children’s math achievement (% = .02, p < .01) and behavioral concerns (% =
.02, p < .01) by increasing parent learning support within the home (% = .30, p < .001).
Race as a Moderator of the Effects on Children’s Achievement
Another central research question was whether the relations among parent
involvement, parent learning support, teacher instruction, and child outcomes differed as
a function of children’s race/ethnicity. Two models were compared in which all structural

28
paths were either (a) held equivalent or were (b) free to vary. When comparing the two
models, there were no significant differences according to race (#$ =33.66, df =27, p <
.18, #CFI = .002, #RMSEA = .00, #SRMR= .001); thus, there was no evidence for race
as a moderator.
Buffering Effects of Parenting and Teacher Instruction
I also examined the interaction between the home and school contexts to
determine whether parent learning support and/or parent involvement enhance the impact
of instructional practices within the classroom. To compute the interaction terms I first
centered the variables of interest to avoid multicollinearity (Turrisi & Jaccard, 2003;
West & Aiken, 1991). Next, I multiplied the average of the variables of interest (parent
learning support and teacher-instruction; parent-involvement and teacher instruction) to
create the interaction terms. It should be noted that for these sets of analyses I used the
average score for teacher instruction across math and literacy activities and the averaged
score for parent classroom and social involvement. Before testing these interactions,
however, I re-ran the structural models with the above-observed variables and results
were comparable to when latent variables were used.
Next, following the steps put forth by Preacher, Curran, and Bauer (2006), I
calculated the simple slopes between child outcomes and the predictor variables. Again,
there was neither an interaction between parent involvement and teacher instruction (% =
.00, p = .94) nor parent learning support and teacher instruction (% = .01, p = .83) that
benefited children’s literacy skills. There was also no evidence for the interaction
between instruction and parent involvement as benefitting children’s math skills. There
29
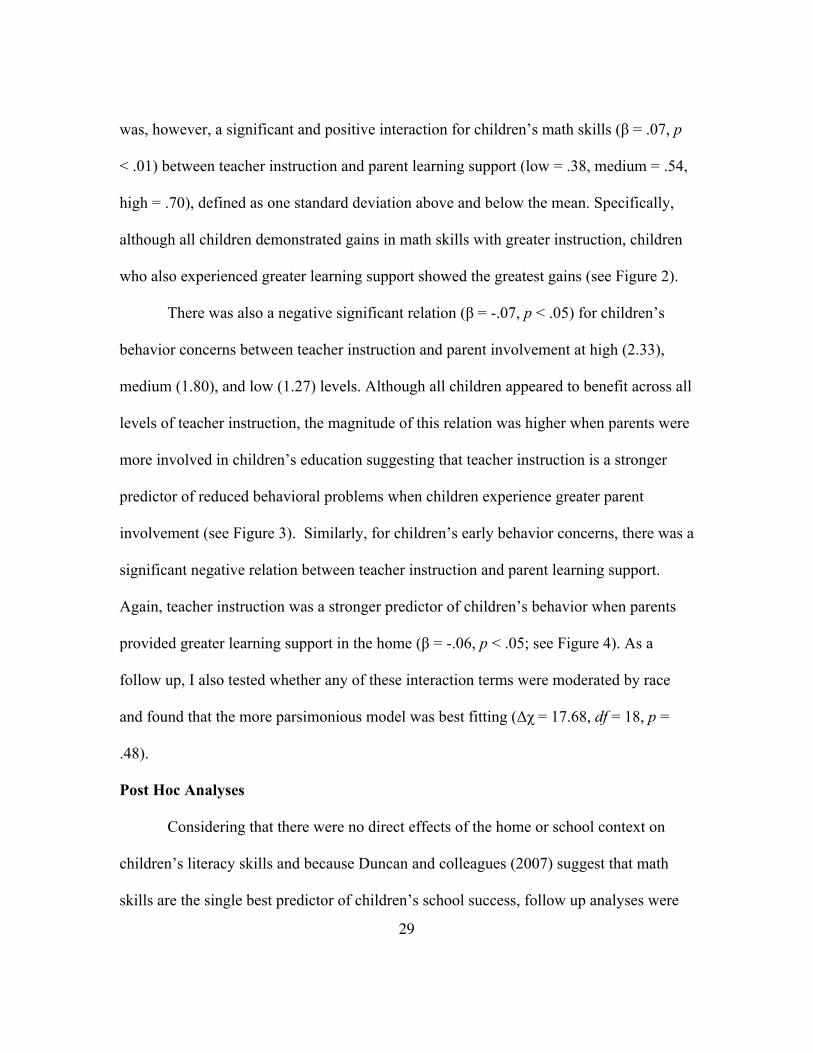
was, however, a significant and positive interaction for children’s math skills (% = .07, p
< .01) between teacher instruction and parent learning support (low = .38, medium = .54,
high = .70), defined as one standard deviation above and below the mean. Specifically,
although all children demonstrated gains in math skills with greater instruction, children
who also experienced greater learning support showed the greatest gains (see Figure 2).
There was also a negative significant relation (% = -.07, p < .05) for children’s
behavior concerns between teacher instruction and parent involvement at high (2.33),
medium (1.80), and low (1.27) levels. Although all children appeared to benefit across all
levels of teacher instruction, the magnitude of this relation was higher when parents were
more involved in children’s education suggesting that teacher instruction is a stronger
predictor of reduced behavioral problems when children experience greater parent
involvement (see Figure 3). Similarly, for children’s early behavior concerns, there was a
significant negative relation between teacher instruction and parent learning support.
Again, teacher instruction was a stronger predictor of children’s behavior when parents
provided greater learning support in the home (% = -.06, p < .05; see Figure 4). As a
follow up, I also tested whether any of these interaction terms were moderated by race
and found that the more parsimonious model was best fitting (#$ = 17.68, df = 18, p =
.48).
Post Hoc Analyses
Considering that there were no direct effects of the home or school context on
children’s literacy skills and because Duncan and colleagues (2007) suggest that math
skills are the single best predictor of children’s school success, follow up analyses were

30
conducted to determine whether there were any indirect effects on children’s literacy
gains via gains in math skills. Results suggest that parent learning support does in fact
indirectly influence children’s gains in literacy skills by improving math achievement (%
= .05, p < .05). Further, parent involvement indirectly impacted children’s literacy skills
via increasing parent learning support and children’s math achievement (% = .02, p < .05).
Finally, considering the literature on teacher-child racial congruence (Saft &
Pianta, 2001), I also tested a model in which the ethnic match between teachers and
children/families was added as a covariate of all key constructs. As noted earlier, the
majority of White (79%) and Black (68%) children were in racially congruent classrooms
while roughly half of Spanish and English-speaking Latino children (between 49-51%)
were in classrooms taught by Latino teachers. The model with racial congruence as a
covariate fit equally as well (#CFI = .000, #RMSEA = .000, #SRMR= .002). As
expected, parents of English- (% = .16, p < .001) and Spanish-speaking (% = .21, p < .001)
Latino children were more likely to be involved in classrooms when there was racial
congruence. With regard to child outcomes, there were no differences for children’s
literacy or behavior skills. White children, however, exhibit greater math achievement
when there was racial congruence (% = .14, p < .05) but this was not the case for Black,
Spanish-speaking Latino, or English-speaking Latino children. It should also be noted
that even after accounting for racial congruence, results were comparable to those
reported above (# % = +/- .007).

31
Chapter 4: Discussion
Although minority populations represent an important and growing segment of our
nation (U.S. Census Bureau, 2008), they are falling behind in important areas of early
math and literacy compared to their more affluent, White peers (NCES, 2011).
Accordingly, there has been growing interest among researchers, policy makers, and
practitioners to help close the gap between minority children and their White peers. At
the same time, there has been a growing emphasis on young children’s behavior problems
and a push towards its inclusion as part of the definition for being ‘school ready’ (Raver,
2002; Raver & Zigler, 2004). Understanding the role early contexts play in closing these
gaps in achievement and behaviors is of great interest. In particular, it is imperative to
determine whether promoting early math, literacy, and behavior skills as early as pre-
kindergarten can help to minimize the achievement gap between minority children and
their White peers.
There has been growing emphasis on teachers’ educational attainment and
qualifications as a means for promoting children’s academic skills in preschool (Loeb et
al., 2004; NICHD ECCRN & Duncan, 2003), yet information on what teachers are
actually doing in classrooms is limited (Early et al., 2007). Further, limited empirical
research exists on parent involvement in preschool settings (Arnold et al., 2008),
especially among low-income families who are less likely to provide cognitive
stimulation at home (Arnold et al., 2008; Bradley et al., 2001; Cooper, Crosnoe, Suizzo,
Pituch, 2010). Therefore, continued effort is necessary to better understand the processes
by which low-income children make strides in early school readiness.

32
The present study responds to the call for examining parental involvement and
learning-support in preschool settings (Arnold et al., 2008) in addition to teachers’
instructional practices in the classroom (Justice et al., 2008). Further, this study extends
the literature on classroom and home practices by examining the behavior and academic
growth of an ethnically diverse sample of children. The main purpose of this study was to
identify early practices in the home and school contexts and determine whether they
serve as predictors of children’s early skills and reduced problem behaviors. Through a
multi-group structural equation-modeling framework, I first examined whether these
measures fit the constructs of achievement, behavior, parenting, and teacher instruction
equivalently across race groups. Next, I was able to model and identify the influence of
both teacher instruction and parenting practices on child outcomes. I also assessed
whether these practices influence on children’s achievement and negative behaviors
varied as a function of children’s race before determining whether parent learning support
and/or involvement moderated the effects of teachers’ instructional practices.
Measurement Equivalence
Within the literature on early education, there has been a growing concern with
regard to the validity of measurement invariance and whether measures are valid for
children from different familial backgrounds (Raver et al., 2007). Results from this study
call into question the validity of child assessments for children from non-White
backgrounds. Specifically, invariance testing suggests that the Woodcock Johnson scales
(Applied Problems and Spelling-Word) and the ECLS-B assessment of children’s math
achievement are inequivalent and do not represent the constructs of math nor literacy in

33
similar ways across race groups. Therefore, we need to be more cautious with the results
that are generated from children’s school readiness assessments and the ensuing actions
and decisions based upon these tests. However, results do suggest that ratings of
children’s hyperactive, withdrawn, and disruptive behavior fit the construct of behavior
problems in similar ways across racial and ethnic lines.
Similarly, there has been concern regarding whether parenting measures are
equivalent across racial and ethnic groups (Brooks-Gunn & Markman, 2005). As put
forth by Brooks-Gunn and Markman (2005), many parenting practices exist and are
parallel across families of different backgrounds; however, the expression of these
activities might vary as a function of families’ race/ethnicity. This study demonstrated
that the two scales for parenting practices did not represent the constructs of parent
involvement in similar ways for low-income children from White, Black and Spanish-
and English-speaking Latino families. Unfortunately, due to low reliability of the HOME
scale, I was unable create a latent factor and assess the measurement validity of the parent
learning support scale. Continued investigation is necessary to determine whether
measures of parenting practices and school readiness are appropriate for children and
families from ethnically diverse backgrounds.
Parent Involvement and Parent Learning Support
It was hypothesized that children who experienced more frequent parent learning
support (Bradley et al., 2001; Melhuish et al., 2008; NICHD ECCRN, 2006) and parent
involvement (Castro et al., 2004; Fantuzzo et al., 2004) would exhibit greater math and
literacy skills, while also demonstrating reduced problem behaviors. Of the two, it was

34
believed that parent learning support would be the stronger predictor of child outcomes
(Cooper et al., 2010). Results were mixed, however. Consistent with expectations and the
prior literature, all children whose parents provided more frequent learning support were
more likely to demonstrate greater growth in areas of early math achievement (Cooper et
al., 2010) and a reduction in behavior problems. Surprisingly, even though there was a
high degree of parent learning support across all ethnic groups, there was no evidence for
it predicting children’s literacy outcomes. A possible explanation for this null finding is
that there are other important home factors including parental warmth and parental
expectations (Davis-Kean & Sexton, 2009; Cooper et al., 2010) that were not captured in
these models and need continued exploration especially with regard to the association
with children’s literacy performance. Indeed, there were no direct associations between
parent learning support and children’s literacy growth; however, learning support
indirectly predicted children’s literacy performance via children’s growth in early math
skills.
Although parent learning support was associated with young children’s math skills
and reduced behavior problems, I failed to find similar evidence for parent involvement.
These differences across different measures of parenting provide further evidence that
parenting practices are a multidimensional construct (Suizzo & Soon, 2006), which have
differing impacts on child outcomes. Even so, results are divergent from the prior
literature (Cooper et al., 2010; Miedel & Reynolds, 2000). One reason for the
discrepancy might be attributed to the fact that parent involvement was relatively low in
this sample especially when compared to other studies where the majority of parents

35
report either weekly or monthly involvement (Miedel & Reynolds, 2000). In this sample,
on average, parents report that they had participated in different activities only once or
twice since the beginning of the Head Start year. It might be that parents in this sample
were simply not exposed to enough involvement to produce any observable differences in
children’s achievement and/or behavior. Additionally, because parent involvement was
only assessed at one point in time, it would be valuable to test the longitudinal impacts of
parent involvement during the early years on both future parenting practices and child
outcomes.
Another plausible explanation, which there was support for, is that parent
involvement might not directly influence children’s outcomes but instead, influences
other parenting practices. Despite the low frequency of parent involvement, parents who
actively participated in children’s classrooms were more likely to demonstrate greater
support for children’s learning in the home. It is possible that parents’ school-based
involvement during these early years assists families with parenting skills, family
support, and at the same time, provides parents an opportunity to be better informed
about what their children are learning in the classroom. Engaging families in such
practices might allow parents to provide a more positive and supportive home
environment for their children, which in turn, predicts greater math achievement and a
reduction in problem behaviors. Therefore, although greater parent involvement does not
result in improved math or literacy performance, there is a positive impact on other
parenting processes, which is just as important in terms of helping close the achievement
gap, reduce behavioral problems, and prevent future underachievement (Bradley et al.,

36
2001; Melhuish et al., 2008).
It was interesting, though, that when the racial congruence between children and
their teachers was taken into account, net of everything else, both Spanish- and English-
Speaking Latino parents were more likely to be involved in their children' classrooms. In
fact, racial congruence was the single best predictor of Latino families’ involvement in
their children’s education. Therefore, taking into consideration racial congruence is
necessary and might serve as an explanation for why some of the prior literature has
found that minority Latino parents, at least in the classroom setting, are less likely to be
involved in their children’s education (Cooper et al., 2010; Turney & Kao, 2009). It
might be beneficial to employ Spanish-speaking teachers and/or Spanish-speaking
assistants to eliminate the barrier of cultural and language differences, which would
encourage more frequent parent involvement within the Latino community. This is
particularly concerning when considering that in this sample of Head Start children,
English- and Spanish-speaking Latinos were 35-50% less likely to be in racially
congruent classrooms compared to their White and Black peers.
Teacher Instruction
With regard to teacher instruction, it was hypothesized that, net of all other factors,
greater instruction would be associated with increased achievement (Early et al., 2006,
2007; Pianta et al., 2005). Again, there were mixed findings. For the full sample of
children, instruction was not predictive of math or literacy skills. Although difficult to
explain, it might be that young children first need to act in socially appropriate ways
before they can learn more (Raver & Knitzer, 2002). For some of these children this was

37
their first experience within a structured classroom, so it is plausible that this early
exposure to instruction first affects children’s socio-emotional and behavioral skills
before predicting children’s achievement. Interestingly, results from this study suggest
that the at-risk children show significant strides in problem behaviors when exposed to
greater instruction. Indeed, it is striking that instruction, focused exclusively on math and
literacy activities, only predicts improved behavioral skills; however, these results fit the
notions put forth by Raver and Knitzer (2002). Additionally, emerging research shows
that children with low behavioral regulation struggle in areas of early language skills
(Schmitt, Pentimonti, & Justice, 2012). This would suggest that the next logical step
would be to determine whether the pathways from instruction to children’s future
achievement are delivered through improvements in children’s behavior.
Buffering Effects of the Home and School
To my knowledge, this was one of the first studies (see Crosnoe, Leventhal, Wirth,
Pierce, & Pianta, 2010, for an exception) to examine whether parenting practices
moderate the relation between teacher’s instructional practices and child outcomes. It is
notable that under certain conditions all children display increased math achievement and
reduced behavioral concerns. Specifically, although children made some gains in math
across all levels of teacher instruction, children’s gains were over 50% greater when
parents provided high levels of learning support compared to low learning support.
Similarly, although teacher instruction was predictive of reduced problem behaviors,
these relations were much stronger when parents were either a) more involved in
children’s education or b) provided greater learning support in the home. Again, when

38
children received high classroom instruction and came from homes that provided either
greater learning-support or parent-involvement, they demonstrated over 50% more
behavioral improvements than children who came from households with low learning-
support/parent involvement. These results would appear to suggest that early education
programs are most effective when children come from supportive homes with parents
who provide ample learning-support and are involved in their children’s education.
Limitations
Even though I used a large and longitudinal dataset to examine the effects of
teaching and parenting practices on children’s early math, literacy, and behavior skills,
there are limitations that need to be taken into account when interpreting results. First, the
sample for this study was limited to children who took assessments in the same language
during the fall and spring. Therefore, it is unknown whether these findings would
generalize to the predominately Latino children who switched language of assessment
and were consequently excluded from this sample. It might be that children who switched
languages are more likely to exhibit greater math and literacy growth as a result of
teacher instruction and greater exposure to the English language. Thus, it is necessary for
future research to examine this segment of the population to determine how they fair in
Head Start. Similarly, the FACES sample consisted of children and families who were
living in poverty and as a result, was not nationally representative of all preschool
children.
I was also limited to the parent and teacher self-reports provided in the FACES-
2006 data, which were the basis for the factors of parent involvement, parent learning

39
support, and teacher instruction. As a result, I was unable to capture children’s entire
home and school experiences, which might be contributing to some of the null findings.
Specifically, these models did not account for either parents’ or teachers’ emotional
support for young children, which at least in later years, has been shown to be predictive
of achievement (Yan & Lin, 2005). Similar to other studies in the parenting literature
(Cooper et al., 2010), these measures for parenting and teacher instruction were also
limited to a single point in time. It would be beneficial to measure the trajectories and
patterns of parenting and teaching practices and their respective impacts on child
outcomes longitudinally.
Conclusion
In sum, results suggest that parental practices and teacher instruction before
school entry can help improve young children’s early academic achievement and problem
behaviors. Findings also lend support to recent findings by Crosnoe and colleagues
(2010) and suggest that targeting a single setting (e.g. classroom or the home) might not
be sufficient in improving young children’s early learning and behaviors. Instead, greater
stimulation across both the home and school contexts might be necessary for the most
optimal outcomes. To improve young children’s academic achievement and reduce
behavioral problems, a greater effort needs to be coordinated across children’s homes and
classrooms.

40
Table 1. Child and Family Demographics
White Black Latino (E.S.) Latino (S.S.) Overall
% % % % % X2 (df) Child Gender Male Female
n = 549 52.1% 47.9%
n = 921 51.5% 48.5%
n = 306 50.3% 49.7%
n = 532 49.4% 50.6%
n = 2,308 49.0% 51.0%
0.92 (3)
Parent Marital Status
Married Not Married Not two parent house
n = 532 37.6% a 16.4% a 46.1% a
n = 875 21.9% b 11.8% a 66.3% b
n = 294 32.7% a 17.3% a, b 50.0% a
n = 527 48.2% c 25.0% b 26.8% c
n = 2,228 33.3% 16.7% 50%
211.85 (6)*
Mother’s Education Less than High School High School or GED Some College BA/BS or Greater
n = 514 26.7% a, b 34.6% a 32.5% a 6.2% a
n = 853 26.0% b 37.5% a 29.1% a 7.4% a
n = 289 35.3% a 29.8% a, b 31.8% a 3.1% a
n = 517 58.0% c 24.6% b 11.8% b 5.6% a
n = 2,173 35% 32.7% 26.1% 6.1%
187.71 (9)*
Father’s Education Less than High School High School or GED Voc/Tech/Some College BA/BS or Greater
n = 258 28.7% a 44.2% a 19.8% a 7.4% a, b
n = 269 24.9% a 36.8% a, b 26.8% a 11.5% b
n = 133 47.4% b 27.8% b, c 20.3% a 4.5% a, b
n = 359 67.7% c 22.3% c 5.6% b 4.5% a
n = 1,019 43.9% 32.4% 16.7% 7.1%
165.06 (9)*
Mother’s Employment Working Full Time Working Part Time Not in Labor Force
n = 517 29.4% a 28.2% a 42.4% a
n = 860 44.4% b 19.5% b 36.0% a
n = 292 40.4% b 22.3% a, b 37.3% a
n = 519 26.4% a 18.3% b 55.3% b
n = 2,188 36.1% 21.7% 42.3%
83.27 (6)*
Note. Means in the same row that do not share subscripts differed at p ! .001 in post hoc Bonferroni multiple comparisons. Not two parent house means either separated or divorced. The ratio of poverty to income takes into account household size and income. Latino E.S. means Latino English Speakers and Latino S.S. means Latino Spanish Speakers. means
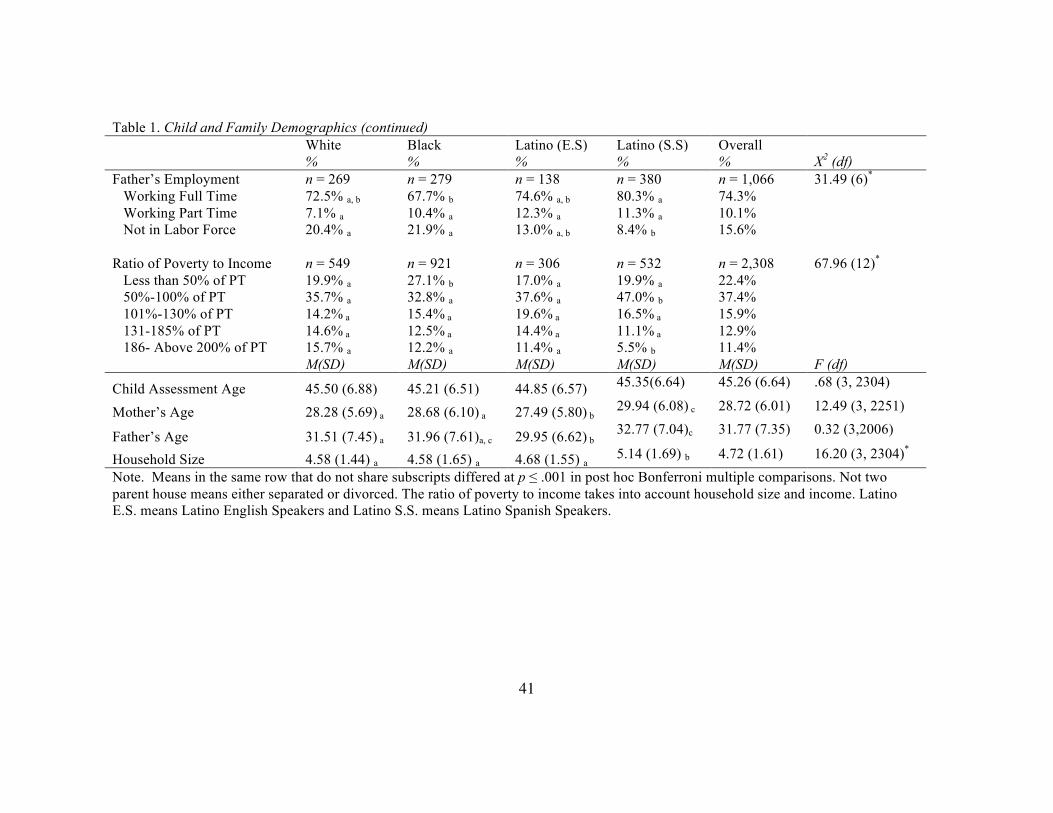
41
Table 1. Child and Family Demographics (continued) White Black Latino (E.S) Latino (S.S) Overall % % % % % X2 (df) Father’s Employment
Working Full Time Working Part Time Not in Labor Force
n = 269 72.5% a, b 7.1% a 20.4% a
n = 279 67.7% b 10.4% a 21.9% a
n = 138 74.6% a, b 12.3% a 13.0% a, b
n = 380 80.3% a 11.3% a 8.4% b
n = 1,066 74.3% 10.1% 15.6%
31.49 (6)*
Ratio of Poverty to Income Less than 50% of PT 50%-100% of PT 101%-130% of PT 131-185% of PT 186- Above 200% of PT
n = 549 19.9% a 35.7% a 14.2% a 14.6% a 15.7% a
n = 921 27.1% b 32.8% a 15.4% a 12.5% a 12.2% a
n = 306 17.0% a 37.6% a 19.6% a 14.4% a 11.4% a
n = 532 19.9% a 47.0% b 16.5% a 11.1% a 5.5% b
n = 2,308 22.4% 37.4% 15.9% 12.9% 11.4%
67.96 (12)*
M(SD) M(SD) M(SD) M(SD) M(SD) F (df)
Child Assessment Age 45.50 (6.88) 45.21 (6.51) 44.85 (6.57) 45.35(6.64) 45.26 (6.64) .68 (3, 2304)
Mother’s Age 28.28 (5.69) a 28.68 (6.10) a 27.49 (5.80) b 29.94 (6.08) c 28.72 (6.01) 12.49 (3, 2251)
Father’s Age 31.51 (7.45) a 31.96 (7.61)a, c 29.95 (6.62) b 32.77 (7.04)c 31.77 (7.35) 0.32 (3,2006)
Household Size 4.58 (1.44) a 4.58 (1.65) a 4.68 (1.55) a 5.14 (1.69) b 4.72 (1.61) 16.20 (3, 2304)* Note. Means in the same row that do not share subscripts differed at p ! .001 in post hoc Bonferroni multiple comparisons. Not two parent house means either separated or divorced. The ratio of poverty to income takes into account household size and income. Latino E.S. means Latino English Speakers and Latino S.S. means Latino Spanish Speakers.
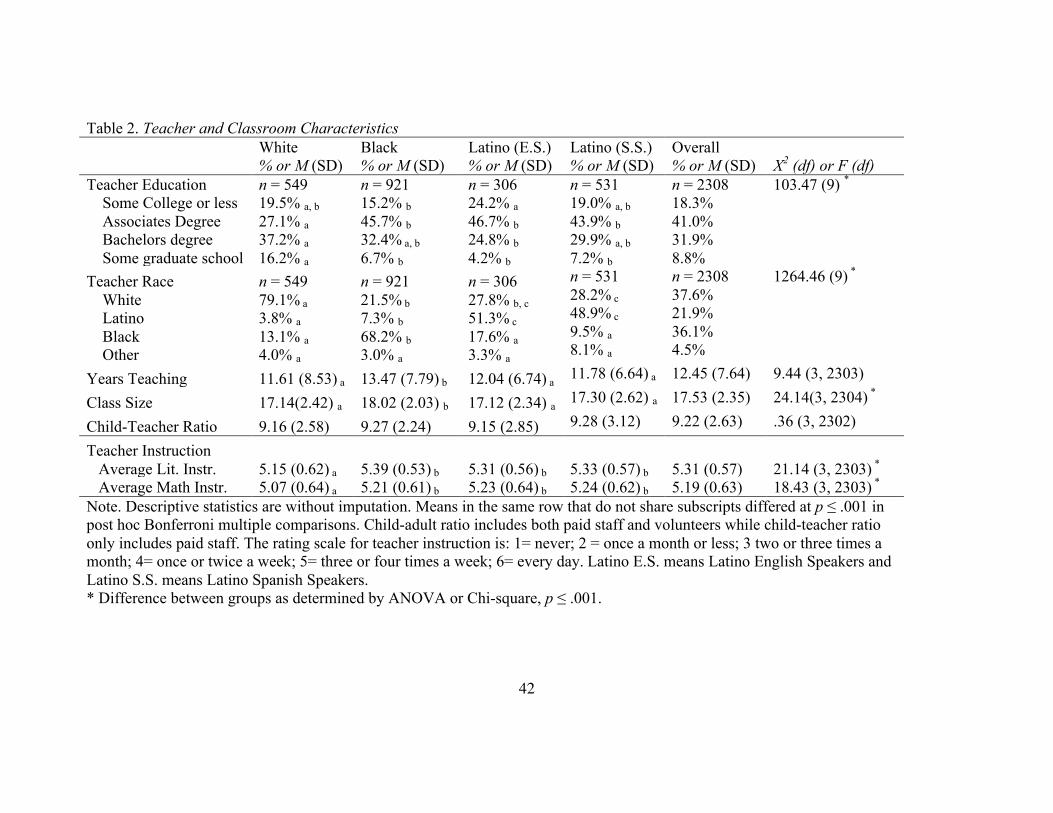
42
Table 2. Teacher and Classroom Characteristics White Black Latino (E.S.) Latino (S.S.) Overall % or M (SD) % or M (SD) % or M (SD) % or M (SD) % or M (SD) X2 (df) or F (df) Teacher Education Some College or less Associates Degree Bachelors degree Some graduate school
n = 549 19.5% a, b 27.1% a 37.2% a 16.2% a
n = 921 15.2% b 45.7% b 32.4% a, b 6.7% b
n = 306 24.2% a 46.7% b 24.8% b 4.2% b
n = 531 19.0% a, b 43.9% b 29.9% a, b 7.2% b
n = 2308 18.3% 41.0% 31.9% 8.8%
103.47 (9) *
Teacher Race White Latino Black Other
n = 549 79.1% a 3.8% a 13.1% a 4.0% a
n = 921 21.5% b 7.3% b 68.2% b 3.0% a
n = 306 27.8% b, c 51.3% c 17.6% a 3.3% a
n = 531 28.2% c 48.9% c 9.5% a 8.1% a
n = 2308 37.6% 21.9% 36.1% 4.5%
1264.46 (9) *
Years Teaching 11.61 (8.53) a 13.47 (7.79) b 12.04 (6.74) a 11.78 (6.64) a 12.45 (7.64) 9.44 (3, 2303)
Class Size 17.14(2.42) a 18.02 (2.03) b 17.12 (2.34) a 17.30 (2.62) a 17.53 (2.35) 24.14(3, 2304) *
Child-Teacher Ratio 9.16 (2.58) 9.27 (2.24) 9.15 (2.85) 9.28 (3.12) 9.22 (2.63) .36 (3, 2302)
Teacher Instruction Average Lit. Instr. 5.15 (0.62) a 5.39 (0.53) b 5.31 (0.56) b 5.33 (0.57) b 5.31 (0.57) 21.14 (3, 2303) * Average Math Instr. 5.07 (0.64) a 5.21 (0.61) b 5.23 (0.64) b 5.24 (0.62) b 5.19 (0.63) 18.43 (3, 2303) * Note. Descriptive statistics are without imputation. Means in the same row that do not share subscripts differed at p ! .001 in post hoc Bonferroni multiple comparisons. Child-adult ratio includes both paid staff and volunteers while child-teacher ratio only includes paid staff. The rating scale for teacher instruction is: 1= never; 2 = once a month or less; 3 two or three times a month; 4= once or twice a week; 5= three or four times a week; 6= every day. Latino E.S. means Latino English Speakers and Latino S.S. means Latino Spanish Speakers. * Difference between groups as determined by ANOVA or Chi-square, p ! .001.

43
Table 3. Spring 2007 Parent Learning Support and Parent Involvement White Black Latino (E.S.) Latino (S.S.) Overall n = 491 n = 862 n = 284 n = 498 n = 2136
Parent Learning Support M (SD) M (SD) M (SD) M (SD) M (SD) F (df) Told child a story .84 (0.36) .81 (0.39) .85 (0.36) .82 (0.38) .83 (0.38) 1.02 (3, 2132) Taught child letters, words, or numbers .97 (0.18) .97 (0.16) .96 (0.20) .95 (0.23) .96 (0.19) 2.65 (3, 2136) Taught child songs or music .86 (0.34) a, b .88 (0.32) a .89 (0.32) a .82 (0.39) b .86 (0.34) 4.56 (3, 2136) * Worked on arts/crafts with child .79 (0.41) a .71 (0.46) b .78 (0.42) s .55 (0.50) c .70 (0.46) 27.85 (3, 2133)* Played with toys/games indoors .98 (0.13) .98 (0.14) .98 (0.19) .98 (0.14) .98 (0.15) 1.41 (3, 2136) Played games, sports, or exercised .88 (0.33) .93 (0.26) .90 (0.30) .90 (0.30) .91 (0.29 2.88 (3, 2136) Played counting games .86 (0.35) a, c .93 (0.25) b .90 (0.30) a ,b ,c .85 (0.36) c .89 (0.31) 11.01 (3, 2135) * Read to child 3+ times this week .83 (0.38) a .74 (0.44) b .74 (0.44) b, c .68 (0.47) c .75 (0.44) 10.58 (3, 2136) * Average Score .88 (0.16) a .87 (0.15) a .87 (0.16) a .81 (0.18) b .86 (0.16) 14.98 (3, 2136) *
Parent Involvement Social Involvement How often P attended HS social events 1.88 (0.99) 1.81 (0.95) 1.89 (1.03) 1.76 (0.94) 1.82 (0.97) 1.61 (3, 2134) How often P helped with field trips 1.77 (0.97) 1.62 (0.95) 1.73 (1.02) 1.68 (0.97) 1.68 (0.97) 2.85 (3, 2134) How often P partic. in HS policy council 1.44 (0.90) 1.45 (0.87) 1.40 (0.79) 1.35 (0.71) 1.42 (0.83) 1.96 (3, 2135) How often P visited other HS parent 1.33 (0.74) 1.32 (0.70) 1.32 (0.77) 1.25 (.63) 1.31 (0.70) 1.52 (3, 2136) How often P prepared HS newsletters 1.20 (0.62) 1.25 (0.70) 1.28 (0.72) 1.21 (0.58) 1.23 (0.66) 1.62 (3, 2134) How often P at fundraising activities 1.40 (0.71) a 1.44 (0.80) a 1.59 (0.3) b 1.34 (0.73) a 1.43 (0.77) 6.45 (3, 2136) * Average Score 1.55 (0.45) 1.53(0.51) 1.57 (0.49) 1.46 (0.39) 1.52 (0.47) 2.86 (3, 2134) Classroom Involvement How often P volunteered in classroom 2.28 (1.29) 2.11 (1.19) 2.25 (1.31) 2.16 (1.28) 2.18 (1.25) 2.41 (3, 2134) How often P observed in classroom 2.38 (1.26) 2.32 (1.20) 2.46 (1.32) 2.51 (1.31) 2.39 (1.26) 2.73 (3, 2136) How often P attend parent/teacher conf. 2.42 (0.85) a 2.38 (0.93) a 2.45 (0.95) a 2.63 (1.00) b 2.46 (0.94) 7.61 (3, 2135) * How often P prepared food/materials 1.76 (1.00) a 1.98 (1.04) b 2.12 (1.14) b 1.82 (1.03) a 1.91 (1.05) 9.62 (3, 2134) * How often Head Start staff at P’s home 2.03 (0.80) a 1.91 (0.85) a, b 1.95 (0.78) a, b 1.84 (0.82) b 1.93 (.082) 4.54 (3, 2134) * How often P attended workshops 1.68 (1.01) a 1.84 (1.03) b 1.96 (1.13) b 1.93 (1.04) b 1.84 (1.05) 6.35 (3, 2133) * Average Score 2.05 (0.71) 2.04 (0.71) 2.16 (0.79) 2.12 (0.72) 2.08 (0.73) 4.54 (3, 2136) * Note. Means in the same row that do not share subscripts differed at p !.001 in post hoc Bonferroni multiple comparisons. The rating scale for all items is: 0= no; 1= yes. * Difference between groups as determined by ANOVA, p ! .001. Latino E.S. means Latino English Speakers and Latino S.S. means Latino Spanish Speakers.

44
Table 4. Mean Child Outcome Gain Scores White Black Latino (E.S.) Latino (S.S.) Overall M(SD) M(SD) M(SD) M(SD) M(SD) F (df) PPVT-IV 2.59 (12.73) 1.66 (10.67) 1.69 (10.68) 2.89 (12.13) 2.16 (11.52) 1.56 (3, 2123) Story/Print Concepts 1.07 (2.47) 1.08 (2.52) 1.29 (2.42) 1.39 (2.64) 1.17 (2.52) 1.66 (3, 1781) WJ-III Letter-Word 17.49 (21.59) 20.48 (22.27) 16.13 (21.47) 17.89 (22.34) 18.56(22.06) 3.54 (3, 1957) WJ-III Spelling 16.95 (34.34) 16.91 (33.06) 17.31 (36.38) 22.03 (32.54) 18.18(33.76) 2.77 (3, 2059) WJ-III Applied Probs. 18.96 (26.81) 14.64 (25.65) 13.84 (26.80) 15.32 (26.64) 15.77(26.38) 3.27 (3, 1884) ECLS-B Math 2.67 (2.27) a 2.32 (2.22) b 2.70 (2.36) a, b 2.74 (2.41) a 2.54 (2.29) 4.45 (3, 2007)* Withdrawn Behavior .14 (2.11) .05 (1.76) a -.04 (1.99) a, b -.07 (1.86) b .03 (1.91) 6.05 (3, 2159)* Hyperactive Behavior -.09 (2.43) -.32 (2.21) -.31 (2.16) -.41 (2.29) -.29 (2.28) 1.96 (3, 2166) Disruptive Behavior .07 (1.64) .03 (1.58) -.11 (1.45) -.30 (1.49) -.06 (1.56) 1.14 (3, 2159) Note. Descriptive statistics are without imputation. Means in the same row that do not share subscripts differed at p ! .001 in post hoc Bonferroni multiple comparisons. Latino E.S. means Latino English Speakers and Latino S.S. means Latino Spanish Speakers. * Difference between groups as determined by ANOVA, p ! .001.

45
Table 5. Measurement and Structural Model Invariance Tests !2(df) "!2(" df)a p value CFI RMSEA SRMR Measurement Model Paths Fully Fixed 1271.36 (1063) — — .947 .018 .039 Parent Involvement ! Social Involvement 1223.19 (1060) 23.98 (3) .001 .959 .016 .037 Parent Involvement ! Classroom Involvement 1239.61 (1060) 23.99 (3) .001 .954 .017 .038 Teacher Instruction ! Math Instruction 1275.72 (1060) .44 (3) .931 .945 .019 .041 Teacher Instruction ! Literacy Instruction 1255.04 (1060) 8.01 (3) .045 .950 .018 .039 Children’s Math Skills ! ECLSB 1261.27 (1060) 11.94 (3) .007 .949 .018 .039 Children’s Math Skills ! WJAP 1262.99 (1060) 8.69 (3) .034 .948 .018 .039 Children’s Literacy Skills ! WJLW 1250.32 (1060) 20.50 (3) .001 .952 .018 .039 Children’s Literacy Skills ! WJSW 1264.44 (1060) 7.88 (3) .078 .948 .018 .039 Children’s Literacy Skills ! PPVT 1268.39 (1060) 3.05 (3) .383 .947 .018 .039 Children’s Literacy Skills ! Story & Print 1268.11 (1060) 3.25 (3) .354 .947 .018 .039 Children’s Behavior ! Hyperactive Behavior 1264.74 (1060) 5.85 (3) .119 .948 .018 .039 Children’s Behavior ! Disruptive Behavior 1268.16 (1060) 3.25 (3) .354 .947 .018 .039 Children’s Behavior ! Withdrawn Behavior 1351.35 (1060) 1.16 (3) .763 .946 .019 .039 Fully Free 1184.16 (1020) 85.29 (39) .001 .966 .015 .035 Best Fitting Measurement Model 1169.32 (1045) 78.85 (21) .001 .968 .014 .039 Structural Model Paths Fully Fixed 1208.05 (1079) — — .967 .014 .040 Fully Free 1175.63 (1052) 32.68 (27) .208 .969 .014 .039 Note. Bold paths denote significant difference in model fit. a Satorra-Bentler scaled and adjusted chi-square comparisons.

46
Table 6. Unstandardized and Standardized Regression Coefficients for Paths from Latent Variables to Measured Indicators and Structural Paths White Black Latino E.S. Latino S.S. ! (SE) B ! (SE) B ! (SE) B ! (SE) B Measurement Model Paths a Parent Involvement ! Social Involvement .31 (.03) .72 .36 (.03) .72 .28 (.04) .60 .19 (.03) .52 Parent Involvement ! Classroom Involvement .51 (.04) .77 .60 (.04) .86 .57 (.07) .77 .61 (.08) .90 Teacher Instruction ! Math Instruction .45 (.05) .80 .45 (.05) .83 .45 (.05) .75 .45 (.05) .76 Teacher Instruction ! Literacy Instruction .46 (.05) .82 .38 (.04) .80 .44 (.05) .83 .48 (.08) .91 Children’s Math Skills ! ECLSB 1.68 (.15) .77 1.93 (.16) .88 1.91 (.24) .86 1.96 (.17) .86 Children’s Math Skills ! WJAP 1.45 (.11) .57 1.60 (.13) .62 1.45 (.14) .58 1.58 (.16) .61 Children’s Literacy Skills ! WJLW .74 (.11) .41 .84 (.12) .41 .68 (.12) .38 .69 (.10) .35 Children’s Literacy Skills ! WJSW .93 (.16) .33 .93 (.14) .30 .93 (.14) .31 .93 (.14) .32 Children’s Literacy Skills ! PPVT .35 (.05) .32 .35 (.05) .35 .35 (.05) .39 .35 (.05) .33 Children’s Literacy Skills ! Story & Prints Concept .54 (.09) .26 .51 (.09) .23 .51 (.09) .27 .51 (.09) .23 Children’s Behavior ! Hyperactive Behavior 1.63 (.10) .74 1.63 (.10) .75 1.63 (.10) .78 1.63 (.10) .74 Children’s Behavior ! Disruptive Behavior .90 (.06) .59 .90 (.06) .57 .90 (.06) .65 .90 (.06) .62 Children’s Behavior ! Withdrawn Behavior .79 (.07) .39 .79 (.07) .46 .79 (.07) .40 .79 (.07) .44
Structural Model Paths Parent learning support ! Behavioral Concerns -.46 (.19)* -.07 -.46 (.19)* -.07 -.46 (.19)* -.07 -.46 (.19)* -.08 Parent learning support ! Math Achievement .43 (.18)* .07 .43 (.18)* .06 .43 (.18)* .06 .43 (.18)* .07 Parent learning support ! Literacy Achievement .09 (.32) .01 .09 (.32) .01 .09 (.32) .01 .09 (.32) .01 Parent Involvement ! Behavioral Concerns .07 (.04)+ .07 .07 (.04)+ .07 .07 (.04)+ .07 .07 (.04)+ .07 Parent Involvement ! Math Achievement -.02 (.03) -.02 -.02 (.03) -.02 -.02 (.03) -.02 -.02 (.03) -.02 Parent Involvement ! Literacy Achievement .05 (.05) .04 .05 (.05) .04 .05(.05) .04 .05(.05) .04 Teacher Instruction ! Behavioral Concerns -.13 (.04)** -.14 -.13 (.04)** -.13 -.13 (.04)** -.14 -.13 (.04)** -.13 Teacher Instruction ! Math Achievement -.02 (.03) -.02 -.02 (.06) -.02 -.02 (.03) -.02 -.02 (.03) -.02 Teacher Instruction ! Literacy Achievement .02 (.06) .01 .02 (.06) .02 .02 (.06) .01 .02 (.06) .01 Parent Involvement !Parent learning support .04 (.00)*** .30 .04 (.00)*** .30 .04 (.00)*** .30 .04 (.00)*** .26
Note. Latino E.S. means Latino English Speakers and Latino S.S. means Latino Spanish Speakers. Bold paths denote freed paths. a All factor loadings for measurement models are significant at p < .001. *** p < .001, **p < .01, *p < .05, +p < .10

47
Parent Involvement
Teacher Instruction
Math Gains
Literacy Gains
Problem Behavior
Gains
Math Instr.
Lit. Instr.
Covariates: Language Flag, Child Age, Child Gender, Parent Marital Status, Mother’s Age, Father’s Age, Mother’s Education, Father’s Education, Mother’s Employment Status, Father’s Employment Status, Teachers’ Education, Teachers’ Years of
Experience, Class Size, Child-Teacher Ratios.
Social Invl.
Class Invl.
Teacher Instr. X Involvement
Teacher Instr. X Learning Support
WJAP
WJS
WJLW
PPVT
STORY
Parent Learning Support
ECLSB
Hyper
Disrupt.
Withdraw
Figure 1. Analytic Model

48
Figure 2. Mean plot illustrating children’s math skills and the interaction of teacher instruction and parent learning support
!"
!#$"
%"
%#$"
&"
&#$"
'"
'#$"
%" &" '" (" $" )"
!"#$%&"'(%)*+,-%
.,-/0-(*1%+2%3-"*$-,%4(5#,0*#'+(%
*+,"-./0123*0./1415"6788+/2"9:0/.50"-./0123*0./1415"6788+/2";45<"-./0123*0./1415"6788+/2"

49
Figure 3. Mean plot illustrating children’s problem behaviors and the interaction of teacher instruction and parent involvement
3$"3(#$"3("
3'#$"3'"
3&#$"3&"
3%#$"3%"
3!#$"!"
%" &" '" (" $" )"
6,+78-9%:-$";'+,%)*+,-%
.,-/0-(*1%+2%3-"*$-,%4(5#,0*#'+(%
*+,"-./012"=1:+>:0?012"
9:0/.50"-./012"=1:+>:0?012";45<"-./012"=1:+>:0?012"

50
Figure 4. Mean plot illustrating children’s problem behaviors and the interaction of teacher instruction and parent learning support
3$"3(#$"3("
3'#$"3'"
3&#$"3&"
3%#$"3%"
3!#$"!"
%" &" '" (" $" )"
6,+78-9%:-$";'+,%)*+,-%
.,-/0-(*1%+2%3-"*$-,%4(5#,0*#'+(%
*+,"-./0123*0./1415"6788+/2"9:0/.50"-./0123*0./1415"6788+/2";45<"-./0123*0./1415"6788+/2"

51
References
Administration for Family and Children [ACF], (2003). A whole-child perspective on
program performance, fourth progress report. Washington, DC: U.S. Department
of Health and Human Services.
Arbuckle, J.L., (1996). Full information estimation in presence of incomplete data. In G.
A. Marcoulides & R. E. Schumacker (Eds.), Advanced structural equation
modeling, issues and techniques ( pp. 243–77). Mahwah, NJ: Erlbaum.
Arnold, D. H., Zeljo, A., Doctoroff, G. L., & Ortiz, C. (2008). Parent involvement in
preschool: Predictors and the relation of involvement to preliteracy development.
School Psychology Review, 37, 74-90.
Barnett, W. S. (2003). Better teachers, better preschool: Student achievement linked to
teacher qualifications. Retrieved from:
http://nieer.org/resources/policybriefs/2.pdf
Bentler, P. M. (2007). On tests and indices for evaluating structural models. Personality
and Individual Differences, 42, 825– 829.
Belsky, J., Vandell., D., Burchinal., M., Clarke-Stewart, K.A., McCartney, K., Owen, M.,
et al., (2007). Are there long-term effects of early child care? Child Development,
78, 681-701.
Berry, D. J., Bridges, L. J., & Zaslow, M. J. (2004). Early childhood measures profiles.
Washington, DC: Child Trends.
Bradley, R.H., Corwyn, R.F., Burchinal, M., McAdoo, H., & Coll, C.G. (2001). The
home environments of children in the United States: Part I. Variations by age,

52
ethnicity, and poverty status. Child Development, 72, 1844-1867.
Brooks-Gunn, J., & Duncan, G. J. (1997). The effects of poverty on children. The Future
of Children, 7, 55-71.
Brooks-Gunn, J., & Markman, L. (2005). The contribution of parenting to ethnic and
racial gaps in school readiness. The Future of Children, 15, 139-168.
Burchinal., M.R., Howes, C., Pianta, R., Bryant, D., Early, D., Clifford, R., & Barbarin,
O., (2008). Predicting child outcomes at the end of kindergarten from the quality
of pre-kindergarten teacher-child interactions and instruction. Applied
Developmental Science, 12, 140-153.
Burchinal, M. R., Roberts, J. E., Riggins, R., Jr., Zeisel, S. A., Neebe, E., & Bryant, D.
(2000). Relating quality of center-based child care to early cognitive and language
development longitudinally. Child Development, 71, 339–357.
Caldwell, B. M., & Bradley, R. H., (1984). Home observation for measurement of the
environment. Little Rock, AR: University of Arkansas Press.
Christenson, S. L. (2004). The family-school partnership: An opportunity to promote
learning and competence of all students. School Psychology Review, 33, 83-104.
Commodari, E. (in press). Preschool teacher attachment, school readiness and risk of
learning difficulties. Early Childhood Research Quarterly.
Connor, C. N., Morrison, F. J., & Slominski, L., (2006). Preschool instruction and
children’s emergent literacy growth. Journal of Educational Psychology 98, 665-
689.
Cooper, C. E., Crosnoe, R., Suizzo, M. A., & Pituch, K. A. (2010). Poverty, race, and

53
parental involvement during the transition to elementary school. Journal of
Family Issues, 31, 859-883.
Crosnoe, R. (2006). Mexican roots, American schools: Helping Mexican immigrant
children succeed. Stanford, CA: Stanford University Press.
Crosnoe, R., Leventhal, T., Wirth, R. J., Pierce, K. M., & Pianta, R. C. (2010). Family
socioeconomic status and consistent environmental stimulation in early
childhood. Child development, 81(3), 972-987.
Currie, J., & Thomas, D. (1995). Does Head Start make a difference? American
Economic Review, 85, 341–364.
Davis-Kean, P. E., & Sexton, H. R. (2009). Race differences in parental influences on
child achievement: Multiple pathways to success. Merrill-Palmer
Quarterly, 55(3), 285-318.
Dearing, E., Kreider, H., Simpkins, S., & Weiss, H. B. (2006). Family involvement in
school and low-income children’s literacy: Longitudinal associations between and
within families. Journal of Educational Psychology, 98, 653–664.
Dearing, E., K. McCartney, K., & Taylor, B. A. (2009). Does higher quality early child
care promote low-income children's math and reading achievement in middle
childhood? Child Development, 80, 1329–1349.
Duncan, G. J., Dowsett, C. J., Claessens, A., Magnuson, K., Huston, A. C., Klebanov, P,
et al. (2007). School readiness and later achievement. Developmental Psychology,
43, 1428 – 1446.
Duncan, G. J., & Magnuson, K. A. (2005). Can family socioeconomic resources account

54
for racial and ethnic test score gaps? Future of Children, 15, 35–5.
Dunn, L. M., & Dunn, L.M. (1997). Peabody Picture and Vocabulary Test, Third
Edition. Examiner’s Manual and Norms Booklet. Circle Pines, MN: American
Guidance Service.
Dunn, L. M., Padilla, E. R., Lugo, D. E., & Dunn, L. M. (1986). Test de Vocabulario en
Imagenes Peabody. Circle Pines, MN: American Guidance Service.
Early, D., Bryant, D., Pianta, R., Clifford, R., Burchinal, M., Ritchie, S., et al. (2006).
Are teachers’ education, major, and credentials related to classroom quality and
children’s academic gains in pre-kindergarten? Early Childhood Research
Quarterly, 21, 174-195.
Early, D.M., Maxwell, K., Burchinal, M., Alva, S., Bender, R., Bryant, D., et al. (2007).
Teachers’ education, classroom quality, and young children’s academic skills:
Results from seven studies of preschool programs. Child Development, 78, 558–
580.
El Nokali, N. E., Bachman, H. J., & Votruba!Drzal, E. (2010). Parent involvement and
children’s academic and social development in elementary school. Child
Development, 81(3), 988-1005.
Fantuzzo, J., Bulotsky-Shearer, R., McDermott, P., McWayne, C., Frye, D., & Perlman,
S. (2007). Investigation of dimensions of social-emotional classroom behavior
and school readiness for low-income urban preschool children.
Fantuzzo, J., Tighe, E., & Childs, S. (2000). Family involvement questionnaire: A
multivariate assessment of family participation in early childhood education.

55
Journal of Educational Psychology, 92, 367–376.
Fantuzzo, J., McWayne, C., Perry, M. A., & Childs, S. (2004). Multiple dimensions of
family involvement and their relations to behavioral and learning competencies
for urban, low-income children. School Psychology Review, 33, 467–480.
Gershoff, E. T., Aber, J. L., & Raver, C. C. (2003). Child poverty in the United States:
An evidence-based conceptual framework for programs and policies. In 893 R. M.
Lerner, F. Jacobs, & D. Wertlieb (Eds.), Handbook of applied developmental
science: Promoting positive child, adolescent, and family development through
research, policies, and programs (pp. 269–324). Thousand Oaks, CA: Sage
Gormley, W. T., Gayler, T., Phillips, D., & Dawson, B. (2005). The effects of universal
pre-K on cognitive development. Developmental Psychology, 41, 872–884.
Hamre, B., & Pianta, R. C. (2005). Can instructional and emotional support in the first
grade classroom make a difference for children at risk of school failure? Child
Development, 76, 949–967.
Howes, C., Burchinal, M., Pianta, R.C., Bryant, D., Early, D., Clifford, R., & Barbarin,
O. (2008). Ready to learn?: Children’s pre-academic achievement in pre-
kindergarten programs. Early Childhood Research Quarterly, 23, 27–50.
Huston, A.C., & Bentley, A. (2010) Human development in societal context. Annual
Review of Psychology, 61, 411-437.
Justice, L. M., Kaderavek, J. N., Fan, X., Sofka, A., & Hunt, A. (2009). Accelerating
preschoolers‘ early literacy development through classroom-based teacher-child
storybook reading and explicit print referencing. Language, Speech, and Hearing

56
Services in Schools, 40, 67–85.
Justice, L. M., Mashburn, A., Hamre, B., & Pianta, R. (2008). Quality of language and
literacy instruction in preschool classrooms serving atrisk pupils. Early Childhood
Research Quarterly, 23, 51–68.
Kline, R. B. (2011). Principles and Practice of Structural Equation Modeling. New
York: Guilford Press
Kuenzi, J. J., Matthews, C., M., & Mangan, B. F. (2008). Science, technology,
engineering and mathematics (STEM) education: Background, federal policy and
legislative action. Washington DC: Congressional Research Service, the Library
of Congress.
Lei, M., & Lomax, R. G. (2005). The effect of varying degrees of nonnormality in
structural equation modeling. Structural Equation Modeling, 12, 1–27.
Loeb, S., Bridges, M., Bassok, D., Fuller, B., & Rumberger, R. (2007). How much is too
much? The influence of preschool centers on children’s development nationwide.
Economics of Education Review, 26, 52-66.
Loeb, S., Fuller, B., Kagan, S., & Carrol, B. (2004). Child care in poor communities:
Early learning effects of type, quality, and stability. Child Development, 75, 47-
65.
Magnuson, K. A., Lahaie, C., & Waldfogel, J. (2006). Preschool and school readiness of
children of immigrants. Social Science Quarterly, 87, 1241–1262.
Magnuson, K. A., Meyers, M., Ruhm, C. J., & Waldfogel, J. (2004). Inequality in
preschool education and school readiness. American Educational Research

57
Journal, 41, 115–157.
Magnuson, K. A., Ruhm, C., & Waldfogel, J. (2007). Does prekindergarten improve
school preparation and performance? Economics of Education Review, 26, 33–51.
Magnuson, K. A., Ruhm, C., & Waldfogel, J. (2007). The persistence of preschool
effects: Do subsequent classroom experiences matter? Early Childhood Research
Quarterly, 22, 18–38.
Marcon, R. (1999). Positive relationships between parent school involvement and public
school inner-city preschoolers’ development and academic performance. School
Psychology Review, 28, 395–412.
Mason, J. M., & Stewart, J. (1989). The CAP early childhood diagnostic instrument
(prepublication edition), American Testronics.
McClelland, M. M., Cameron, C. E., Connor, C. M., Farris, C. L., Jewkes, A. M., &
Morrison, F. J. (2007). Links between behavioral regulation and preschoolers'
literacy, vocabulary, and math skills. Developmental psychology,43(4), 947.
McDonald, R. P., & Ho, M. H. R. (2002). Principles and practice in reporting structural
equation analyses. Psychological Methods, 7, 64 – 82.
Melhuish, E. C., Phan, M. B., Sylva, K., Sammons, P., Siraj-Blatchford, I. & Taggart, B.
(2008). Effects of the Home Learning Environment and Preschool Center
Experience upon Literacy and Numeracy Development in Early Primary School.
Journal of Social Issues, 64, 95–114.
Miedel, W. T., & Reynolds, A. J. (2000). Parent involvement in early intervention for
disadvantaged children: Does it matter?. Journal of School Psychology,37(4),

58
379-402.
Mistry, R. M., Benner, A. D., Biesanz, J. C., Clark, S. L., Howes, C. (2010). Family and
social risk, and parental investments during early childhood years as predictors of
low-income children’s school readiness outcomes. Early Childhood Research
Quarterly, 25, 432-449.
Muthén, L. K., & Muthén, B. O. (1998-2011). Mplus User's Guide. Sixth Edition. Los
Angeles, CA: Muthén & Muthén.
Najarian, M., Snow, K., Lennon, J., & Kinsey, S., (2010). Early childhood longitudinal
study, birth cohort (ECLS-B), preschool-kindergarten 2007 psychometric report.
NCES 2010-009. Washington, DC: U.S. Department of Education, National
Center for Education Statistics, Institute of Education Sciences. Retrieved from:
http://www.niusileadscape.org/docs/FINAL_PRODUCTS/LearningCarousel/ECL
S_07.pdf
National Center for Education Statistics (2011). The Nation’s Report Card: Mathematics
2011 (NCES 2012–458). Washington, DC: Institute of Education Sciences, U.S.
Department of Education. Retrieved from:
http://nces.ed.gov/nationsreportcard/pdf/main2011/2012458.pdf
National Center for Education Statistics (2011). The Nation’s Report Card: Reading 2011
(NCES 2012–457). Washington, DC: Institute of Education Sciences, U.S.
Department of Education. Retrieved from:
http://nces.ed.gov/nationsreportcard/pdf/main2011/2012457.pdf
NICHD Early Child Care Research Network & Duncan, G. J. (2003). Modeling the

59
impacts of child care quality on children's preschool cognitive development. Child
Development, 74, 1454-1475.
NICHD Early Child Care Research Network. (2002). Early child care and children’s
development prior to school entry: Results from the NICHD study of early child
care. American Educational Research Journal, 39, 133–164.
NICHD Early Child Care Research Network. (2006). Child care effect sizes for the
NICHD study of early child care and youth development. American
Psychologist, 61, 99–116.
Phillips, M., Crouse, J., & Ralph, J. (1998). Does the Black–White test score gap widen
after children enter school? In C. Jencks and M. Phillips (Eds.), The Black White
test score gap (pp. 229-272) Washington, DC: The Brookings Institution.
Pianta, R., Howes, C., Burchinal, M., Bryant, D., Clifford, R., Early, D., et al. (2005).
Features of pre-kindergarten programs, classrooms and teachers: Do they predict
observed classroom quality and child-teacher interactions? Applied
Developmental Science, 9, 144–159.
Preacher, K. J., Curran, P. J., & Bauer, D. J. (2006). Computational tools for probing
interaction effects in multiple linear regression, multilevel modeling, and latent
curve analysis. Journal of Educational and Behavioral Statistics, 31, 437-448.
Raver, C. C., Gershoff, E. T., & Aber, J. L. (2007). Testing equivalence of mediating
models of income, parenting, and school readiness for White, Black, and Hispanic
children in a national sample. Child Development, 78, 96-115.
Raver, C. C., & Knitzer, J. (2002). Ready to enter: What research tells policymakers

60
about strategies to promote social and emotional school readiness among three-
and four-year-old children. New York: National Center for Children in Poverty.
Saft, E. W., & Pianta, R. C. (2001). Teachers' perceptions of their relationships with
students: Effects of child age, gender, and ethnicity of teachers and
children. School Psychology Quarterly, 16, 125.
Satorra, A. (2000). Scaled and adjusted restricted tests in multi-sample analysis of
moment structures. In Heijmans, R.D.H., Pollock, D.S.G. & Satorra, A. (eds.),
Innovations in multivariate statistical analysis. A Festschrift for Heinz Neudecker
(pp.233-247). London: Kluwer Academic Publishers.
Schafer, J., L., & Graham, J. W., (2002). Missing data: Our view of the state of the art.
Psychological Methods, 7, 147-177.
Snow, K., Thalji, L., Derecho, A., Wheeless, S., Lennon, J., Kinsey, S., Rogers, J. et al.
(2007). Early childhood longitudinal study, birth cohort (ECLS-B): Data file
user’s manual (2005-06). Washington, DC: National Center for Education
Statistics.
Turney, K., & Kao, G. (2009). Barriers to school involvement: Are immigrant parents
disadvantaged?. The Journal of Educational Research, 102(4), 257-271.
U.S. Census Bureau (2008). 2008 national population projections. U.S. Department of
Commerce Economics and Statistics Administration.
Vandell, D.l., Belsky, J., Burchinal, M., Steinberg, L., Vandergrift, N., & NICHD Early
Child Care Research Network (2010). Do effects of early child care extend to age

61
15 years? Results From the NICHD Study of Early Child Care and Youth
Development. Child Development, 81, 737–756.
Votruba-Drzal, E., Coley, R. L., & Chase-Lansdale, P. L. (2004). Child care and low-
income children’s development: Direct and moderated effects. Child
Development, 75, 296 –312.
Wesley, P. W., & Buysse, V. (2010). Changing times and the quest for quality. In P.W.
Wesley & V. Buysse (Eds.), The quest for quality: Promising innovations for
early childhood programs (pp. 1-19). Baltimore, MD: Brookes.
West, S. G., & Aiken, L. S. (1991). Multiple regression: Testing and interpreting
interactions. Sage Publications, Incorporated.
Winsler, A., Tran, H., Hartman, S., Madigan, A.L., Manfra, L., & Bleiker, C. (2008).
School readiness gains made by ethnically-diverse children in poverty attending
center-based childcare and public school pre-kindergarten programs. Early
Childhood Research Quarterly, 23, 314-329.
Woodcock, R. W., McGrew, K. S., & Mather, N. (2001). Woodcock-Johnson III tests of
achievement. Itasca, IL: Riverside Publishing.
Woodcock, R. W., & Muñoz-Sandoval, A. F. (1996). Bateria Woodcock-Muñoz Pruebas
de Aprovechamiento-Revisada. Chicago: Riverside.

![[XLS]mteducare.commteducare.com/images/government/A - Final Format III.xlsx · Web viewAnsari Kulsum Md. Alam Ansari Laiba Ansari Mantasha Ansari Md Nooh Rizwan Ah Ansari Md. Aarish](https://img.pdfslide.us/doc/110x75/5b034e867f8b9a2e228c3181/xls-final-format-iiixlsxweb-viewansari-kulsum-md-alam-ansari-laiba-ansari.jpg)