Embed Size (px)
Citation preview

©Copyright 2018
William Henry Alexander Schneble

Federated Learning for Intrusion Detection Systems in Medical
Cyber-Physical Systems
William Henry Alexander Schneble
A thesissubmitted in partial fulfillment of the
requirements for the degree of
Master of Science in Computer Science and Software Engineering
University of Washington
2018
Committee:
Geetha Thamilarasu, Chair
Dong Si
Wooyoung Kim
Program Authorized to Offer Degree:Computing and Software System

University of Washington
Abstract
Federated Learning for Intrusion Detection Systems in Medical Cyber-Physical Systems
William Henry Alexander Schneble
Chair of the Supervisory Committee:Geetha Thamilarasu
Computing and Software Systems
Medical Cyber-Physical Systems (MCPS) are networked systems of medical devices with
seamless integration of physical and computation components. MCPS are increasingly used
in healthcare environments to deliver high quality care by enabling continuous monitoring
and treatment. However, security breaches can compromise privacy, integrity, and avail-
ability for medical devices while circumventing traditional approaches such as cryptography.
This can lead to severe repercussions for both the patient and hospital in terms of injury
and liability. We implement a massively distributed, machine-learning-based IDS for MCPS
based on Federated Learning – FLIDS. We evaluate our design with real patient data and
against Denial of Service (DoS), data modification, and data injection attacks. Our approach
transmits 3.8 times fewer bytes than collecting the data at a central location which saves
bandwidth. We also achieve a detection accuracy of greater than 99.0% and a False Positive
Rate (FPR) of 1.0%. Lastly, we show that FLIDS can cope with unevenly distributed data
and is a scalable solution that leverages the computing resources of many mobile devices.

TABLE OF CONTENTS
Page
Chapter 1: Introduction . . . . . . . . . . . . . . . . . . . . . . . . . . . . . . . . 1
1.1 Proposal . . . . . . . . . . . . . . . . . . . . . . . . . . . . . . . . . . . . . . 2
Chapter 2: Related Work . . . . . . . . . . . . . . . . . . . . . . . . . . . . . . . . 4
2.1 Threats . . . . . . . . . . . . . . . . . . . . . . . . . . . . . . . . . . . . . . 10
Chapter 3: Design . . . . . . . . . . . . . . . . . . . . . . . . . . . . . . . . . . . . 12
3.1 Architecture . . . . . . . . . . . . . . . . . . . . . . . . . . . . . . . . . . . . 12
3.1.1 Clustering of Patients . . . . . . . . . . . . . . . . . . . . . . . . . . . 15
3.1.2 Training the Federated Learning Intrusion Detection System (FLIDS) 16
3.2 Threat Generation . . . . . . . . . . . . . . . . . . . . . . . . . . . . . . . . 19
3.3 Assumptions . . . . . . . . . . . . . . . . . . . . . . . . . . . . . . . . . . . . 21
Chapter 4: Results . . . . . . . . . . . . . . . . . . . . . . . . . . . . . . . . . . . 22
4.1 Experimental Setup . . . . . . . . . . . . . . . . . . . . . . . . . . . . . . . . 22
4.1.1 Data . . . . . . . . . . . . . . . . . . . . . . . . . . . . . . . . . . . . 22
4.1.2 Metrics . . . . . . . . . . . . . . . . . . . . . . . . . . . . . . . . . . 23
4.1.3 Hardware and Software . . . . . . . . . . . . . . . . . . . . . . . . . . 24
4.2 Experimental Results . . . . . . . . . . . . . . . . . . . . . . . . . . . . . . . 25
Chapter 5: Conclusion . . . . . . . . . . . . . . . . . . . . . . . . . . . . . . . . . 35
5.0.1 Limitations & Future Work . . . . . . . . . . . . . . . . . . . . . . . 36
Bibliography . . . . . . . . . . . . . . . . . . . . . . . . . . . . . . . . . . . . . . . . 37
i

1
Chapter 1
INTRODUCTION
Medical Cyber-Physical Systems (MCPS) are networked systems of medical devices with
seamless integration of physical and computational components. MCPS are increasingly used
in healthcare environments to deliver high-quality care by enabling continuous monitoring
and treatment. However, security breaches can compromise the privacy, integrity, and avail-
ability of medical devices while circumventing traditional approaches such as cryptography.
For instance, data modification attacks change sensor measurements that can prevent the
administration of drugs to the patient. This can have severe repercussions for both the
patient and hospital in terms of injury and liability.
A leading cause of vulnerabilities in MCPS is that, although they are designed to be
isolated, they are increasingly connected with other systems and networks [9]. Compounding
with MCPSs already heterogeneous and ad-hoc nature, security solutions are often absent
or lacking in interoperability. In addition to the potential for injury and liability, these
vulnerabilities may also lead to exposure of sensitive patient information as they make nodes
susceptible to being entry points into the rest of the network.
A traditional security approach is to deploy an Intrusion Detection Systems (IDS) that
looks for abnormal behavior. Two common approaches include misuse and anomaly de-
tection. Misuse designs use signatures to match incoming behavior with known malicious
behavior. These tend to perform well in detection accuracy and have a low False Positive
Rate (FPR). However, this approach is not able to detect new attacks, since the attack’s sig-
nature will not be in the list of known attacks. Anomaly detection takes a baseline of normal
behavior and checks for deviations, such as unexpected correlations or abnormally high/low
values and raises an alarm when found. While an anomaly approach can catch new attacks,

2
they also have a high FPR, normal data is erroneously flagged as abnormal. This results
in inefficient use of hospital staff and resources who must respond to false positives. For
example, Salem et al. implemented an anomaly-based IDS using decision trees and Support
Vector Machines (SVM). They were able to achieve a True Positive Rate (TPR) of 100%, but
their FPR was greater than 6.5% [24]. Additionally, both approaches are difficult to scale
in the MCPS environment and often need manual tweaking and specification. For exam-
ple, Mitchell and Chen developed a Behavior Rule Specification-based IDS that performed
well but was dependent on machine state coverage that was created directly from expert
knowledge [19]. This makes the approach difficult when dealing with complex devices and
systems, such as distributed and ad-hoc systems, because the amount of time to complete
the specification is high and the odds of missing some machine states is likely. With these
limitations in mind, our goal is to implement an IDS that has high accuracy, low FPR, that
has low communication cost, and that is flexible and scalable for the MCPS environment.
1.1 Proposal
This project uses Federated Learning as proposed by McMahan [18] and Konecny [14]. The
benefits of federated learning for MCPS include the flexibility to deal with unbalanced, sparse,
and non-representative data at each mobile device. This is important in the healthcare space
because of the variability among patients and their physiological data. The data is also
highly distributed, and the approach achieves scalability by leveraging the computing power
of many devices. Additionally, our scheme is flexible and can trade communication cost
for computation and vice versa. The benefit of privacy is also achieved because instead of
transmitting personally identifiable information we only communicate the machine learning
weights.
We propose a Federated Learning Intrusion Detection System (FLIDS) for MCPS to
detect anomalous behavior. We define the MCPS environment as consisting of sensors and
actuators, we’ll refer to these collectively as nodes, that are placed around a patient’s body.
These nodes communicate, using Bluetooth or Zigbee, to a local mobile device that collects

3
node information, such as sensor readings. The mobile device uses Wi-Fi to connect to a
local gateway that has an Internet connection. Using their mobile device, patients register
with a hospital server that groups patients based on their medical history, such as age and
whether the patient smokes or not. The groups separate patients that have different expected
patterns, a young and healthy patient has a different expected pattern than an old and sick
patient. Once grouped, the mobile device downloads the FLIDS for their group.
The patient’s mobile device uses the FLIDS model and can either be in training or testing
mode. During training mode, the patient collects baseline information and their local device
updates the current FLIDS model. Once training is completed, the mobile device sends the
updated model back to the server. The hospital server takes an average of all contributing
updates to produce a new FLIDS model. The newly learned model is then pushed to that
patient group so that they can use the newest and most accurate IDS. In testing mode, the
mobile device does not contribute toward training the FLIDS and instead is strictly used to
detect anomalous behaviors.
The outline of this paper has the following format: Section 2 reviews related work on
security in MCPS. Section 2.1 discuses threats and what attacks are used in the project.
Section 3 covers the network architecture and the proposed design and Section 3.3 defines
the assumptions used during design. Experimental setup including data selection, hardware,
and software used is detailed in Section 4.1. The metrics used to evaluate the proposed
design are listed in Section 4.1.2. Experimental results covering detection accuracy, FPR,
training time, energy consumption, communication cost, and more are detailed in Section 4.
Lastly, we summarize our results, their impact, discuss the limitations, and provide future
work in Section 5.

4
Chapter 2
RELATED WORK
Wearable and implantable medical devices continue to gain popularity for their non-
intrusiveness, personalized and persistent monitoring and diagnosis capabilities. Humayed
et al. provide a clear abstraction of Medical Cyber-Physical Systems (MCPS) by identify-
ing three major components: communication, computation and control, and monitoring and
manipulation (cyber, cyber-physical, and physical respectively) [9]. These devices contain
a physical component, such as a sensing or actuator and a networking component for com-
munication. Together this creates a Wireless Body Area Network (WBAN) or collection of
sensors and actuators placed around a subject’s body that communicate with each other
and, typically, with a controller. Unlike the resource constrained sensor nodes, the controller
has modest storage and computational capabilities and can be more easily recharged. Col-
lectively these devices makeup the domain called Medical Cyber-Physical Systems (MCPS).
While MCPS has become invaluable in persistent healthcare monitoring, they also pose
a significant security risk given the highly sensitive and valuable information they measure
and transmit. Humayed et al. argue that CPS are designed to be isolated but have been
increasingly connected with other systems and networks [9]. This has contributed to CPS
components being more integrated than designed and it is at these weak points between
isolated systems that most attacks occur. There are three major trends in the literature
for providing security to MCPS: cryptographic, trust frameworks, and Intrusion Detection
Systems (IDS).
Cryptographic solutions focus on the problems of data confidentiality, privacy and au-
thentication. Because of the resource constrained nature of the sensors most of the literature
is focused on symmetric key cryptography for encryption/decryption and asymmetric cryp-

5
tography for the key exchange [7, 8, 22]. To authenticate two untrusting parties, such as a
sensor and controller, Kerberos-like solutions have been proposed where the parties register
with a trusted third party that handles the exchange of session keys [22]. This design also
helps reduce the problem of the number of keys needed to be kept at the sensor as it only
needs the public key of the trusted third party but does increase the communication over-
head. Park et al. also use smart cards to store physician credentials because of the low trust
in the controller but smart cards have been shown to be very susceptible to side channel
attacks and thus leaking information [4, 12, 13]. Hu et al. considered that the controller
cannot be trusted and that it should only have access to encrypted sensor data and by using
Attribute Based Encryption (ABE) could still respond to queries from a remote sever about
sensor data [7]. This scheme limits the amount of network traffic, in the form of queries, that
sensors need to respond to and can lead to significant energy savings when traffic volume is
high. Conversely for low traffic volume, the cost of encrypting the sensor data (symmetric
encryption) may exceed other approaches such as certificate-based schemes and thus ABE
may not be applicable to an entire WBAN. However, this approach could also be problematic
if network or other optimizations and applications at the controller need the sensor data for
nominal operation.
Cryptographic solutions in the literature focuses on preventing outsider attackers from
compromising data integrity and privacy of the system. However, if the attacker has access
to an authorized device, or is an insider with legitimate access to such a device, then these
solutions are not enough to provide security. For example, Humayed et al. focus on the
connectivity vulnerabilities in CPS because these systems are more integrated than designed
for networks [9]. This leads them to conclude that encryption can be used for securing
data between devices, authenticating and prevent attacks such as replaying of commands.
This does not consider the scenario where a legitimate user, a physician for example, uses
the system to perform some malicious activity such as stealing patient information. For
instance, ABE is resistant against collusion attacks, a ciphertext with attributes A and B
cannot be decrypted with one private key with attribute A and another key with B, but if the

6
physical has a key with attributes A and B then they can decrypt the ciphertext. Because the
physician has legitimate credentials, encryption does not prevent this type of attacker from
retrieving and later distributing or selling patient information. In our design, we maintain
privacy by sending model update information to the server. Because the update does not
directly encode any sensitive patient information, there is no risk in accidental or malicious
information disclosure. This also has the additional benefit of saving network bandwidth
due to the size of the update being independent of the training data size. If a user generates
a large amount of data, the data stays at the device and is trained on and only a vector of
weights needs to be communicated with the hospital sever.
Trust based solutions use a trust value computed by some function or group of functions
to determine how trustworthy or reliable an interaction with a node in the network is. Bui
et al. proposed a trust framework where quality attributes and opinions from other nodes
are used to determine if a sensor is acting as expected [2]. Each quality attribute had to be
specified for each sensor which makes this method tedious for the WBAN environment where
even two similar sensors may need different quality attribute functions due to differences in
manufacturing and vendors. This approach also did not address jamming, denial of service,
replay, data modification, and spoofing attacks. For example, an attacker jams node A’s
packets so A cannot respond to node B who then incorrectly infers that node A is unreliable.
Kumar et al. use a similar approach but are also susceptible to forwarding, DoS and replay
attacks due to the one-hop visibility of each node [15]. An attack at two hops from node A
can directly influence A’s perception of node B who is one hop away from A by flooding B
and thus slowing down the node to the point where A believes B is an unreliable.
The major drawback of trust based solutions is their focus on routing metrics to determine
and evaluate trust [2, 15, 28] because communication is just one of several layers of attack
surface exposed to vulnerabilities. The proposed solution can use both sensor measurements
and relayed commands as well as network information as features for the machine learning
model. Some trust based approaches also examine the data for abnormalities such as Zhang et
al. but their approach assumes a uniform distribution and for non-uniform data this metric

7
is simply left out [28]. Our solution assumes that the data is not uniformly distributed.
This means different devices can generate different amounts of data and the data can be
non-representative of the overall population. This makes our solution very flexible which is
needed for the MCPS environment.
IDS look for abnormal behavior which can be done in two ways; through misuse or
anomaly detection. Misuse designs use signatures to match incoming behavior with known
malicious behavior and tend to perform well. However, misuse is not able to detect new
attacks because the attack’s signature will not be in the list of known attacks. Behavior-
Specification based Intrusion Detection (BSID) proposed by Mitchell et al. uses a set of
behavior states for specifying acceptable behavior of the device [19]. The BSID design takes
device behavior rules as input and detects for deviation against the expected behavior and
thus does not rely on knowledge of attacker patterns such as in a signature approach. To get
from a behavior rule to state machine, attacks are first identified, and a monitor is assigned
per component and then the state components and ranges can be derived and finally the
state space can be created. For each state a probability of a transition is assigned in the
presence of perror and the type of attacker. A compliance metric is also used for evaluating
the extent to which a device behaves securely with values of 1 indicating secureness and 0
insecure. The authors use various distance-based metrics to determine compliance such as
Hamming and Euclidean distance. This approach is both accurate and has a low FPR but
requires domain knowledge to create the behavior rules and performance is heavily correlated
to rule coverage. If a behavior state is not identified and it is an unsafe state, then the model
will not be able to detect this exploit and will have to be updated.
Anomaly detection takes a baseline of normal behavior and checks for deviations, raising
alarms when a threshold is crossed. Anomaly approaches can catch new attacks but have
a high False Positive Rate (FPR) which means a lot of normal data is erroneously flagged
as abnormal. Thus, much of the literature has focused on the combination of an anomaly
detection component with other models or components to reduce the FPR. Salem et al. use
a Support Vector Machine (SVM) to first find abnormal behavior and then use a Logistic

8
Regression (LR) model to find an expected value. When the expected value is exceeded k
number of times then an alarm is triggered. This helps the model be less sensitive to noise
and imprecise devices/measurements [24]. LR would not for non-numerical measurements
such as categorical data like permissions, color, or sex and thus this approach may have
low interoperability. The authors also claim this scheme would help reduce faulty sensors
from contributing to the FPR, but this is only true if the sensor has lost accuracy. An
inaccurate but precise sensor will continuously measure an abnormal value and thus reach
the k threshold for generate an alarm. Thus, this approach is good for noise suppression but
is not an ideal solution for isolating faulty sensors in the network. Coppolino et al. use a
local agent on the sensor to detect anomalous behavior which is then sent to a central agent
(presumably on the controller) for a final decision [3]. If communication with the central
agent is lost, then the node will cycle through neighbors before finally making the local agent
decision persistent. Thus, a targeted attacker could jam or denial of service a node to force
the node to make an ill-informed decision.
The IDS may also be implemented in a centralized or decentralized manner. The cen-
tralized IDS uses a server or cloud back-end to store and train the model before distributing
it out to the sensors. Yang et al. proposed a Non-contact Health Monitoring System Based
that monitored user facial expressions and performed feature extraction, recognition and
classification at a centralized server [26]. This approach was convenient to users but was
time consuming and complex due to the input devices and needed threshold. Centralized
approaches have the benefit of increased space for memory and storage as well as com-
putation, but they also require an Internet connection and can be vulnerable to routing
attacks [3]. Preventing data coming in for training or a model from reaching a sensor can
lead to undetected attacks. Decentralized models run at the sensor nodes and thus tend to
be extremely lightweight in resource consumption and have limited visibility or potentially
inconsistent views of the network. For this reason decentralized models often employ other,
centralized components such as in [3,25]. Odesile et al. use mobile agents to perform misuse
detection at the sensor and if the results are inconclusive the agent request a detective agent

9
from the current cluster head [20]. The detective agent makes a scan of the cluster and
performs anomaly detection to determine if a new attack has occurred. The flexibility of the
mobile agents to move around the network to where data is stored or to computation rich
devices makes this approach very attractive. However, cluster heads have greater authority
and power in their ability to spawn sensor and detective agents which may make attackers
lurk in the network until they become or compromise the cluster head.
Machine-learning-based IDS solutions are promising but have several major hurdles such
as data fusion and preprocessing, resource consumption and gathering a appropriate baseline.
In addition to the many different types of sensors from different vendors, MCPS generates a
lot of data such as an ECG application with 288 kbps or 1 Mbps for audio applications [27].
Because of the breadth of sensors that may be within a single WBAN, most researchers focus
on a specific environment setup to prove their proposal or framework. Thus, the practicability
and scalability of proposed solutions are often left as open-ended questions. Some solutions
use a voting scheme such as Haque et al. where each model can be personalized to each
sensor and individual and an overall decision is made from the output of each model, but
resource constraints are a major factor for this scheme as you need to train and test many
more models or voters [5, 6]. There are several more examples, such as [21, 23], where the
question of scalability is ignored and the model is trained at a single workstation with all
of the computing and data resources available. While these papers provide insight into
possible solutions, they do not accurately reflect the target environment and are thus not
generalizable.
The original federated learning paper [14] was applied to the MNIST digit recognition
dataset [17], a traditional machine learning classification problem, but can also be applied
to IDS problems. A detailed explanation of federated learning can be found in Section 3.1.2.
Simply stated, federated learning is the averaging of several models over time until conver-
gence. In this way, machine learning models can be trained at end nodes without moving
around data. A centralized node, or server, computes the average of all the clients’ models
and then pushes the averaged model back to the clients. The clients use the new model as a

10
starting point for training and then each client learns a new model. This process repeats until
convergence. We propose that federated learning can be applied to the MCPS environment
to create an IDS solution that is scalable, accurate, and reduces network bandwidth.
2.1 Threats
The MCPS environment’s security is particularly sensitive given the high value of the medical
record data and potentially severe repercussions on patient health. The goal of an Intrusion
Detection System (IDS) is to identify malicious activity from normal activity without rais-
ing many false alarms (erroneously flagging normal activity as abnormal). Malicious users
can use packet header information and payload data to launch attacks that are network
or host-based. Attacks within the MCPS environment can include denial of service, data
modification, Sybil, and eavesdropping.
Denial of Service (DoS): Mitchel et al. describe a compromised actuator that may ignore
control inputs, resulting in a black hole attack [19]. This can lead to a denial of service
type attack where the patient cannot receive medical intervention, such as a dose of insulin.
Jamming and resource depletion are also ways for malicious attackers to prevent normal
communication and operation.
Data Modification: Mitchel and Kumar et al. describe a data modification attack that can
lead to a missed or false positive diagnosis [16,19]. Data modification can be used to fake an
arrhythmia, in order to mis-allocate and disrupt medical resources as well as deny a patient
treatment. Black hole attacks can also be seen under this category where modification to
packet header information causes rerouting to attacker controller nodes [11]. Biggio et al.
have showed that data modification can also be used to fool biometric recognition systems
and thereby let an attacker gain access to other systems or impersonate an authoritative
figure [1].
Data Injection: The attacker is able to provide untrusted input to the system. This
input could be the sensor readings, packet header information, or part of a command or
query that gets interpreted by the application and alters the normal course of execution.
11
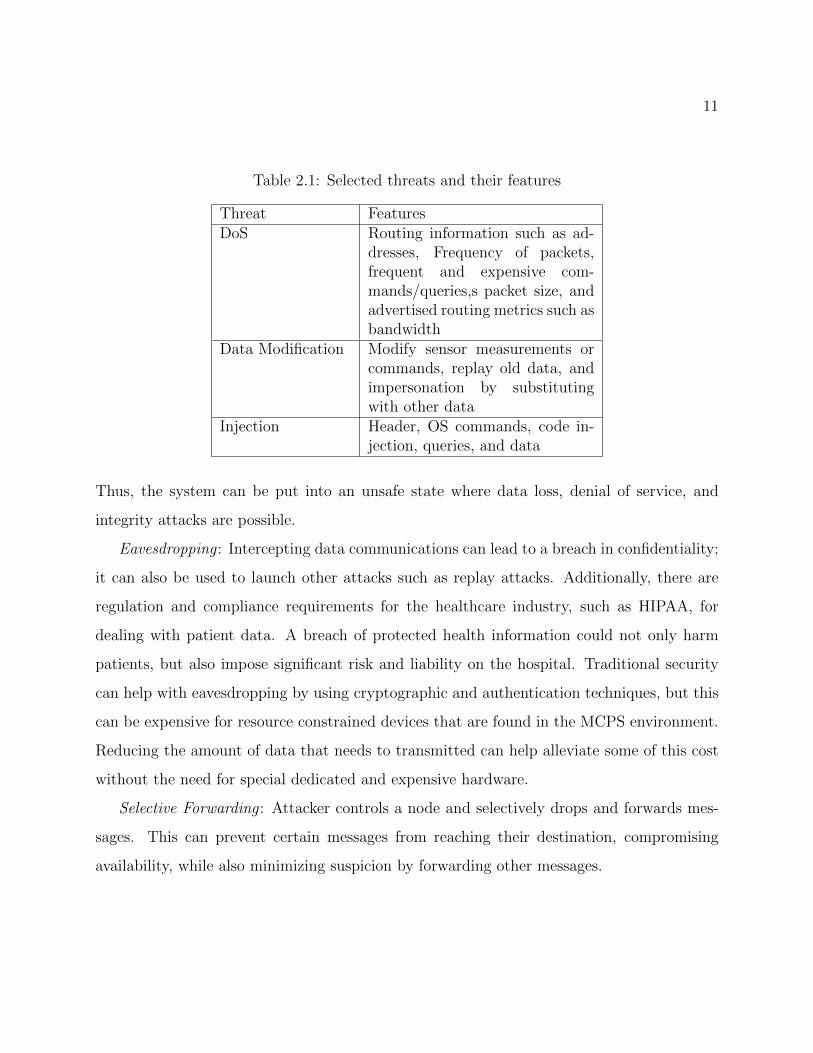
Table 2.1: Selected threats and their features
Threat FeaturesDoS Routing information such as ad-
dresses, Frequency of packets,frequent and expensive com-mands/queries,s packet size, andadvertised routing metrics such asbandwidth
Data Modification Modify sensor measurements orcommands, replay old data, andimpersonation by substitutingwith other data
Injection Header, OS commands, code in-jection, queries, and data
Thus, the system can be put into an unsafe state where data loss, denial of service, and
integrity attacks are possible.
Eavesdropping : Intercepting data communications can lead to a breach in confidentiality;
it can also be used to launch other attacks such as replay attacks. Additionally, there are
regulation and compliance requirements for the healthcare industry, such as HIPAA, for
dealing with patient data. A breach of protected health information could not only harm
patients, but also impose significant risk and liability on the hospital. Traditional security
can help with eavesdropping by using cryptographic and authentication techniques, but this
can be expensive for resource constrained devices that are found in the MCPS environment.
Reducing the amount of data that needs to transmitted can help alleviate some of this cost
without the need for special dedicated and expensive hardware.
Selective Forwarding : Attacker controls a node and selectively drops and forwards mes-
sages. This can prevent certain messages from reaching their destination, compromising
availability, while also minimizing suspicion by forwarding other messages.

12
Chapter 3
DESIGN
This chapter first introduces the network architecture is described including the system’s
components, communication between the components, and the Intrusion Detection System
(IDS). Then we give specific details on the clustering process and the Federated Learning
Intrusion Detection System (FLIDS) including parameters and algorithms. Next, we cover
threats in MCPS and how these threats are generated for the system. Lastly, we cover the
assumptions made during the design phase.
3.1 Architecture
The network architecture can be seen in Figure 3.1 and is made up two major components, the
hospital server and the patient’s mobile device. The topology of the system can be described
as client-server with the clients being the mobile devices. This allows for scalability as adding
more or new mobile devices increases message traffic and logic at the server linearly.
The mobile device acts as a base station for the Wireless Body Area Network (WBAN)
which consists of sensors and actuators (nodes) placed around the patient’s body. These
Figure 3.1: Network architecture
13
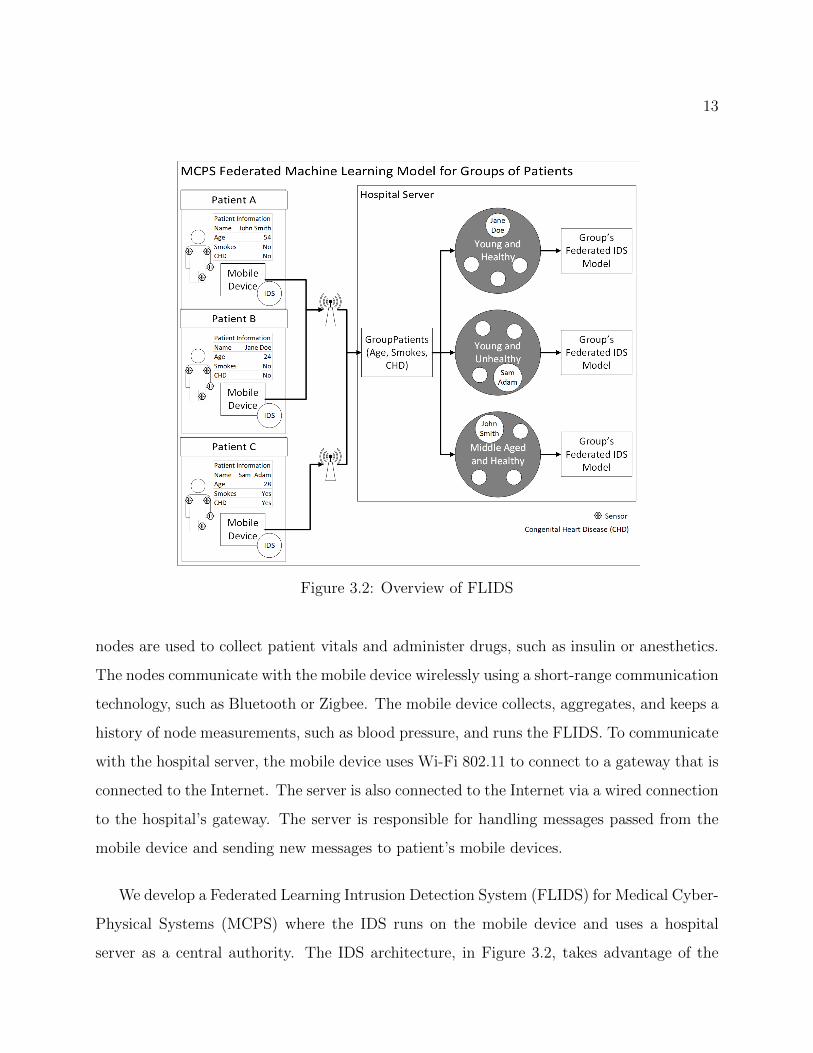
Figure 3.2: Overview of FLIDS
nodes are used to collect patient vitals and administer drugs, such as insulin or anesthetics.
The nodes communicate with the mobile device wirelessly using a short-range communication
technology, such as Bluetooth or Zigbee. The mobile device collects, aggregates, and keeps a
history of node measurements, such as blood pressure, and runs the FLIDS. To communicate
with the hospital server, the mobile device uses Wi-Fi 802.11 to connect to a gateway that is
connected to the Internet. The server is also connected to the Internet via a wired connection
to the hospital’s gateway. The server is responsible for handling messages passed from the
mobile device and sending new messages to patient’s mobile devices.
We develop a Federated Learning Intrusion Detection System (FLIDS) for Medical Cyber-
Physical Systems (MCPS) where the IDS runs on the mobile device and uses a hospital
server as a central authority. The IDS architecture, in Figure 3.2, takes advantage of the

14
mobile devices’ resources while the server handles the registering of the mobile devices,
calculating the federated model, and storing the model. The system begins with a mobile
device registering with the server where they are clustered into a group depending on their
patient history. Each group has a federated model stored on the server. The mobile device
then downloads the federated model from the server and uses it as a starting point to learn
a new model with the patient’s data. The mobile device can then start to detect attacks
and waits for any updates from the server. If an update containing a new model is received,
then the mobile device learns a new model, starts detecting attacks, and checks for updates
from the server again. If the mobile device is chosen to contribute to the federated model,
then the device sends its local IDS model weights back to the server (more details in Section
3.1.2). In this case, after the mobile device has downloaded and learned a new model then
the model’s weights are sent back to server. The mobile device then enters the same waiting
state as described before, detecting attacks and waiting for updates from the server.
With the latest IDS, new samples are fed into the IDS and are determined to be either
normal or abnormal behavior. A data sample comprised of node values or features, such as
heart rate. If the node values are within an expected range and there is no major change
in correlation to other node values, then the sample is defined as normal behavior. For
example, if blood oxygen saturation expected to be between 95% and 97% then a normal
sample with this feature will have a value between this range. Similarly, if blood oxygen
saturation and pulse have a strong and positive correlation then the expected behavior is
that when the patient’s pulse increases then the patient’s blood oxygen saturation increases
as well. Abnormal behavior is thus readings outside of the expected range or unexpected
correlations with other node measurements. A data modification attack may change a node
value to below an expected value. Data injection may have correct node values but different
correlations between the features, such as the pulse increases but blood oxygen saturation
decreases. If an abnormal sample is found, then an alert is generated at the mobile device
so that medical staff can intervene.
The server has three major responsibilities: registering and grouping patients, calculat-

15
ing and storing the federated models, and distributing the federated model. As previously
described, when a patient registers with the server they are clustered into a group who share
a single IDS model. Figure 3.4 shows that the server is also in charge of selecting a subset of
the model’s patients used for each iteration of the federated learning process (as described
later in algorithm 1). This subset is chosen randomly and uniformly for a given range. For
example, if there are 8 patients registered to group A and if we do not want only one patient
used for an iteration then we can use the range [0.25, 1] to determine how many patients will
be used. After determining the number of patients to use, the server selects patients from the
group at random and without replacement. This subset of patients then receives messages
on their devices to send their IDS weights to the server. The server collects all the weights,
uses them to calculate the next federated model, and saves the model. The server then sends
the newly learned model to all registered patients for the group. This process repeats until
the model converges: the weights do not change significantly between an iteration.
3.1.1 Clustering of Patients
Clustering of the mobile devices (see Figure 3.2) is also introduced to separate patients,
such as a young healthy person and an elderly person with arrhythmia, who do not share
similar behavioral patterns. These differences between groups can prevent convergence of
the IDS which decreases detection accuracy and increases training time. The clustering of
users should put similar individuals with each other and thus allow for quicker convergence
and more accurate and personalized models. Clustering can be done with features such as
age, common medical conditions, medications, and history such as smoking/nonsmoking.
The clustering process occurs during registration of a mobile device with the hospital
sever as seen in Figure 3.2. After a mobile device has been assigned to a group, the device
only receives and contributes to that groups model via updates as detailed in Section 3.1.2
and algorithm 1. Determining the correct number of clusters will depend on several factors
including the number of mobile devices in the network and the number of parameters used
for the clustering process. If the network has a limited number of mobile devices, then it may

16
not be reasonable to use a high number of clusters. For instance, if only 12 patients are in the
network then using four clusters may mean there are groups of only one, two, or three mobile
devices. This is problematic because, in the case of a single patient in a group, no benefit of
the federated learning process can be claimed. For smaller groups, such as three patients, the
entire set of mobile devices will need to be used for each communication round (the federated
learning training process, see Section 3.1.2) which can be resource taxing. Furthermore, the
fewer patients that are assigned to a group the less data the overall federated model gets to
train on which can decrease the model’s generalizability in the long term when new patients
enter the group. Thus, determining the correct number of clusters for FLIDS is largely an
empirical one that depends on the system and its constraints.
3.1.2 Training the Federated Learning Intrusion Detection System (FLIDS)
Federated Learning is a distributed machine learning algorithm that builds a global model by
averaging weights w across many devices over several communication rounds t. An example
of the weights is shown for a single layer, feed forward neural network in Figure 3.3. Each
neuron in the hidden layer has a transfer function, denoted by f , that takes each feature
in a sample (In1...Ini) and multiplies it by its weight (IW1,1...IWi,1) plus a bias (B1). The
weights are a learnable parameter and are modified at the end of calculating a single step
during training. In the remainder of this document, when we refer to weights we mean all
weights and bias (both matrices in Figure 3.3).
We have adopted the original federated learning algorithm from [14] for MCPS. Our
modified federated learning algorithm at the server, algorithm 1, uses parameter K as the
number of clients for a given group and wk is the mobile device k’s model weights. During
each round (a single iteration of the while loop), the server randomly selects a subset of
patients from the group. Parameter C denotes the fraction of patients to use for an iteration
with C = 0 being a random value between [cmin, 1] where cmin is the minimum fraction of
patients to use for a single round. For example, if C = 0.5 and eight patients were in the
group then four patients would be selected at random for the round. If C = 0, cmin = 0.25,

17
Input 1
Input 2
Input i
Neuron 1
Neuron 2
Neuron 3
Neuron 4
Output 1
Neuron n
Output j
Input Bias
Layer Bias
Input Layer
Hidden Layer
Output Layer
aN1=f(In1*IW1,1 + In2*IW2,1 + Ini*IWi,1+B1)
IW1,2
IW1,3
IW1,4
IW1,n
B1IW2,1
IW2,n
B2IW2,2
IW2,3
IW2,4
IWi,1
IWi,2
IWi,3
IWi,4
IWi,n Bn
B3
B4
N1
N2
N3
N4
Nn
In1 In2 Ini
IW1,1
IW1,2
IW1,3
IW1,4
IW1,n
B1IW2,1
IW2,n
B2IW2,2
IW2,3
IW2,4
IWi,1
IWi,2
IWi,3
IWi,4
IWi,n Bn
B3
B4
N1
N2
N3
N4
Nn
In1 In2 Ini
IW1,1
LW1,1
LW1,j
B1LW2,1
Bj
LW3,1 LW4,1 LWn,1
LW2,j LW3,j LW4,j LWn,j
O1
O j
N1 N2 N3 N4 Nn
LW1,1
LW1,j
B1LW2,1
Bj
LW3,1 LW4,1 LWn,1
LW2,j LW3,j LW4,j LWn,j
O1
O j
N1 N2 N3 N4 Nn
Figure 3.3: Single layer, feed forward network with weights and bias.
and eight patients were in the group then a random subset of patients between two and eight
will be selected per round.
The mobile devices of the subset are then sent a message by the serer to send their model’s
weights to the server. The server keeps a record of each mobile device’s weights and at an end
of a communication round calculates the next federated model wt+1. The federated model is
calculated by summing all the patients’ weights and dividing by the number of patients used
for the round. If a patient was not able to send its weights to the server then weight matrices
of zeros are added to the sum and the number of patients used for the round, parameter K,
is decreased by one (repeat for each missing patient). These new weights are then sent to
all mobile devices registered to the group and the process repeats until a specified number
of iterations or the change in model’s weights at the server are insignificant.
The IDS’s primary function is to detect abnormalities and attacks but this also needs to
be balanced with the False Positive Rate (FPR). A false positive is created when the IDS

18
input : Sclients - set of clients maintained by the hospital server
w - the federated model weights
t - the communication round identifier
C - fraction of clients to use in round
output: wt+1 - the next communication round’s model weights
initialize w
while True doSrclients = selectRandomSubset(Sclients, C)
K = size(Srclients)
for each client in Srclients dowt+1
k = getClientUpdate(w)
end
wt+1 = ΣKk=1w
t+1k /K
for each client in Sclients doclient.send(wt+1)
end
t = t + 1end
Algorithm 1: Federated Learning algorithm at hospital server
generates an alert for a normal sample, and thus the FPR represents the rate, or proportion,
of alerts generated that are erroneously made. False positives are expensive for the hospital
because resources are spent on responding to the false alerts, intrusive for patients, and
cumbersome for medical staff. After a mobile device gets the most recent model from the
server it performs a short training session with local patient data to better personalize the
IDS for that mobile device, decreasing the FPR while maintaining recall.
The mobile device with the newly learned IDS can be in one of two modes: training or
testing. If the mobile device is in training mode, then a patient can make predictions and
provide updates back to the hospital server to contribute to the global IDS model. Otherwise,
the device is set to test mode where only predictions on new samples are made. Test mode
saves some cost in communication as the IDS weights do not need to be sent to the server,
but the mode is primarily for when the mobile device cannot satisfy the assumption that a
baseline can be collected securely (see Section 3.3).

19
Figure 3.4: The updating process
Resource management can also be performed by using parameter C because using fewer
devices decreases the traffic between the server and the devices. Also, using fewer mobile
devices decreases the total amount of computation used per round without impacting indi-
vidual training time or detection accuracy. However, training time at the mobile device can
be controlled by changing the number of iterations performed, parameter E, and the batch
size given by parameter B. The number of iterations is the number of times the gradient
is estimated, and the parameters of the model updated. The batch size is the number of
samples used per iteration. Lowering the batch size also decreases the computation required
to compute the gradient but may increase the number of iterations needed to converge. In-
creasing the number of iterations would cost more computation power but this can be offset
by increasing the number of communication rounds in the federated learning process. Al-
together with varying the number of mobile devices used per round, this makes the system
highly configurable as device computation and network communication can be traded for
each other.
3.2 Threat Generation
The threats used for detection and evaluation are the Denial of Service (DoS), data mod-
ification, and data injection attacks. To generate any of the attacks we first take normal

20
samples from the mobile device with one sample composed of a sensor measurement from
each sensor connected to the mobile device for a given time. Thus, the data set, X, for a
mobile device with n sensors over time t can be represented as:
X =
X0 X1 X2 Xn
t1 x0,t1 x1,t1 x2,t1 xn,t1
t2 x0,t2 x1,t2 x2,t2 xn,t2...
......
......
t x0,t x1,t x2,t xn,t
DoS attacks can occur when a sensor is being jammed or exhausted for resources. If the
sensor is flooded queries or commands, then it may lead to slower performance or resources
like battery may get depleted. While the attacker may not have direct access to a sensor
or actuator they may be able to deny diagnosis, intervention, and treatment to a patient
by preventing important sensor measurements from being processed by, for instance, the
Intensive Care Unit (ICU) monitoring equipment. A DoS attack is created by changing a
random sensor value in a normal sample to zero or Not a Number (NaN) to represent a
missing sensor measurement.
A different scenario could be that the patient wants more drugs such as anesthetics. To
accomplish this the patient could use a data modification attack to change sensor readings
that could be preventing the administration of the drug such as blood pressure and heart
rate. In this scenario not only are medical supplied misused but the patient’s welfare is
also jeopardized, potentially causing dependence developments, addiction, or overdose. Data
modification attacks are generated by taking a normal sample and multiplying it by a random
scalar between [0.5, 0.8]. For example, if the original sample was a blood pressure and heart
rate reading of 110 mmHg and 85 bpm respectively and our random scalar is 0.7 then the
new sample is 77 mmHg and 60 bpm.
A similar motivation could be behind data injection attacks, but here code or expected

21
data is injected to an otherwise normal sample to lead the system into a vulnerable state.
For example, let us say that a certain range of values for a sensor caused the system to
request user input for further processing. An attacker injects a value within this range into
an otherwise normal sample and causes this path of execution. The attacker now performs
a buffer overflow attack to start a shell to run arbitrary code to launch more attacks and
inflict greater damage. In this scenario the system received expected sensor readings and
followed the expected path of execution but has given the attacker the ability to run code at
the device. Data injection attack samples are generated by taking a random value for each
sensor measurement between that sensor’s normal range. For example, if the sensor value is
a percentage and the normal range is between 96% and 100%, then a data injection attack
for this sensor is a value between this range selected at random. This process is done for
each sensor comprising an entire sample.
3.3 Assumptions
Assumptions made during the design process include:
� Normal and abnormal behavior are statistically different from each other. If the nor-
mal and abnormal behaviors of a system are not distinguishable then they cannot be
detected by the IDS.
� Mobile devices generate the same amount of data as each other, but the data generated
can be non-representative of the overall population. For example, all devices generate
the same number of bytes of data, but the correlation of the features differ from device
to device.
� When patients are grouped together, the minimum number to form a group is two
patients.
� A baseline reading can be done securely. This means an attack cannot poison the
global model by giving the hospital server bad update data.

22
Chapter 4
RESULTS
4.1 Experimental Setup
In this section we describe the data used for the experiment, what metrics are used for
evaluation, and the hardware and software setup.
4.1.1 Data
The MIMIC dataset from PhysioNet is used for evaluation of the IDS [10]. This dataset
has six features, which are typically displayed on an ICU monitor, including elapsed time,
arterial blood pressure, heart rate, pulse, respiratory rate, and blood oxygen concentration.
The dataset has 121 records with each record having about 35-40 hours of monitored activ-
ity. Only one hour was taken for creating our training, attack, and validation sets. These
numerics were derived from the raw signals which can found in the MIMIC Database home
page. The raw signals include ECG signals that measure the voltage across leads placed on
the body. For example, the heart rate numeric is derived from this signal by measuring the
Figure 4.1: ECG signal with peaks marked. R-R peaks represent heart rate.

23
time between R-R peaks which can be seen in Figure 4.1. Thus, these data can be used to
simulate WBAN devices in the medical environment.
The original data can be used as a baseline, without anomalies unless specified in the
accompanying annotations file. Data modification attacks can be done by adding noise or
a scalar to the features. DoS attacks result in dropped of missing values for some of the
features. Injection attacks are implemented as a completely crafted sample that is added
to the input stream. All of these attacks can also vary depending on the attacker’s stance,
random or aggressive as described in Section 2.1.
4.1.2 Metrics
The following metrics are used to determine overall performance of the IDS model:
� Detection Accuracy: How many samples were correct out of the total sample popula-
tion.
Acc =TP + TN
ΣP + ΣN(4.1)
� False Positive Rate: The rate at which alerts are generated for normal samples.
FPR =FP
FP + TN= 1 − Precision (4.2)
� False Negative Rate: The rate at which attacks are missed.
FPR =FN
FN + TP= 1 −Recall (4.3)
� Recall: Fraction of relevant instances over the total amount of relevant instances.
Recall =TP
TP + FN(4.4)

24
� F1 Score: Weighted average of the precision and recall.
F1 = 2 ∗ Precision ∗RecallPrecision+Recall
(4.5)
� Two-tailed t-test to determine if federated approach makes a statistically significant
impact on machine learning classifier’s detection accuracy, FPR, recall, and F1 scores.
We will use a significance value α = 0.10 and take the mean and standard deviation of
five trails for eight degrees of freedom and a critical value of Z = 1.86.
� Time to train the machine learning model versus the number of mobile devices that
contributed to the model. We expect linear or better scaling.
� Cost of communication measured by number of packets multiplied by their size. Ex-
pected to be a constant, for a single layer network the following formula can be used.
Updatesize = ((Inputsize+Ouptutsize+1)∗NumNeurons+Outputsize)∗sizeof(float)
+ 5 ∗ sizeof(uint8) (4.6)
4.1.3 Hardware and Software
The hardware used to simulate the mobile clients is the Raspberry Pi 3 B. These devices run
the Raspbian operating system and are connected to a gateway via Wi-Fi. The server was
simulated with a Windows 10 PC. The implementation of the proposed design for this paper
was done in Python with the following dependencies: Python 3.0 or greater, SciPy, Pandas,
Numpy, libatlas, Lasagne, Theano 0.9, scikit-neuralnetwork, and scikit-learn. If the version
is not specified then the latest version can be installed.

25
4.2 Experimental Results
Performance evaluation is measured with four metrics: detection accuracy, False Positive
Rate (FPR), recall, and F1. Parameter C, or how many of the mobile devices in the network
were used for each training round, varies figure to figure. Examples include when C = 1
means the entire set of patients in network used for training, C = 0.5 means that half of the
patients were used, and C = 0 means a random number of patients were used per round (a
single while loop iteration) of algorithm 1.
Figure 4.2 shows the performance using the patients validation set for the federated
algorithm and different numbers of patients used in the network for training. These metrics
were averaged over five runs and the error bars represent the standard deviation. Increasing
the number of patients in the network increases all metrics and reduces the distribution
or variance of said metrics. Calculating the two-sample t test with a significance level of
0.10 we get a critical value of 1.860 and t = 1.95 for the detection accuracy in Figure
4.2a. Because t is greater than the critical value we can reject the null hypothesis that the
two distributions are the same and this means that the federated learning algorithm made a
statistically significant and positive change to the classifiers accuracy. The detection accuracy
was increased by 0.0025 or 0.25% and the standard deviation was decreased by 0.002 or 0.2%
which means the classifier is more accurate and stable. FPRs t = 2.34 and F1s t = 1.95
which is greater than the critical value which means we can also reject the null hypothesis
for FPR and F1. As seen in Figure 4.2b, the FPR was reduced by 0.002 or 0.2% when using
eight patients to generate the federated model compared to a single patient. Comparing
the recall of a single patient and eight patients gives us t = 0.72 and thus we cannot reject
the null hypothesis for recall. However, the standard deviation for using more clients did
reduce the standard deviation of the federated model as seen in Figure 4.2c. Recall is also
related to the False Negative Rate (FNR) that represents the number of attacks missed by
the IDS, Figure 4.2b. Again, the decrease in FPR does not increase the FNR of FLIDS
which means the system generates fewer false positives, allowing for efficient use of hospital

26
(a) (b)
(c) (d)
Figure 4.2: IDS evaluation with different number of patients used in the network and allpatients used per training round (C = 1). Scores were averaged over five runs of the systemwith the error bars representing the standard deviation.
resources, without missing attacks on the system. Overall these results show that by adding
more patients to the network we can increase the machine learnings performance in terms
of detection accuracy, FPR, and F1 score while also reducing variability of the model, the
standard deviation, for all metrics.
Previously we used C = 1 which uses all currently registered patients for each training
round. Figure 4.3 shows using different values for C such as 0.5 or half of the patients and
C = 0 which represents a random number of patients chosen for each round with a minimum
27
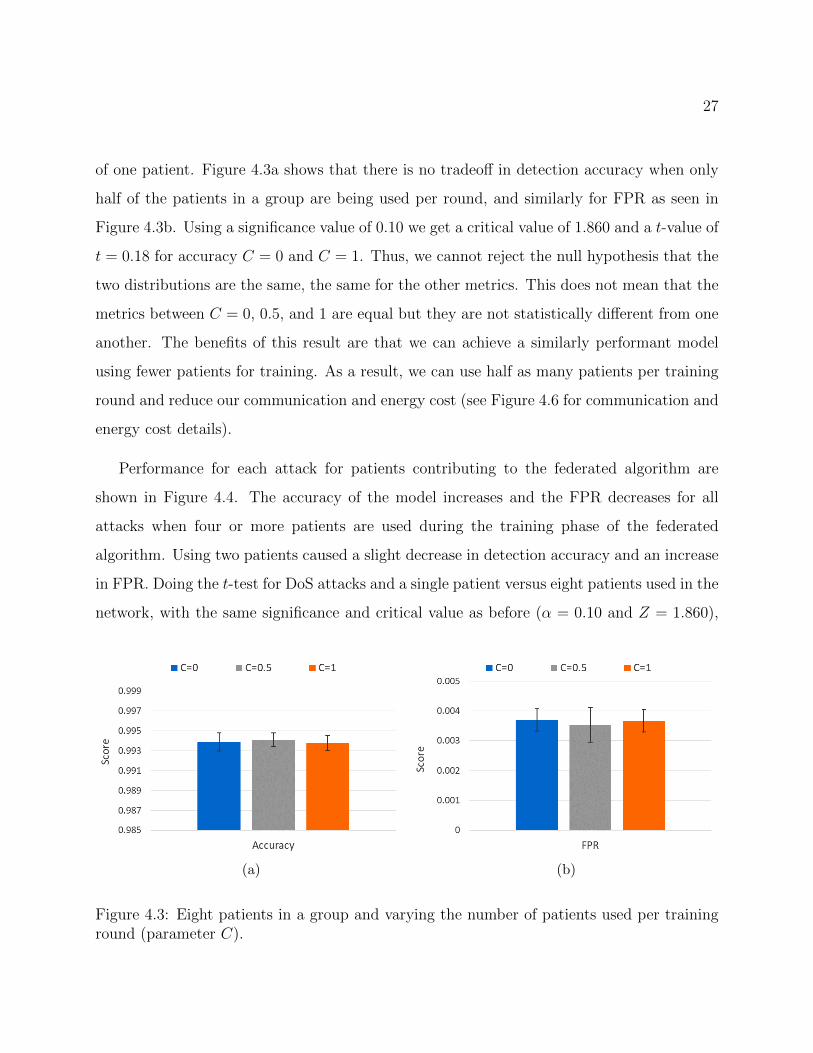
of one patient. Figure 4.3a shows that there is no tradeoff in detection accuracy when only
half of the patients in a group are being used per round, and similarly for FPR as seen in
Figure 4.3b. Using a significance value of 0.10 we get a critical value of 1.860 and a t-value of
t = 0.18 for accuracy C = 0 and C = 1. Thus, we cannot reject the null hypothesis that the
two distributions are the same, the same for the other metrics. This does not mean that the
metrics between C = 0, 0.5, and 1 are equal but they are not statistically different from one
another. The benefits of this result are that we can achieve a similarly performant model
using fewer patients for training. As a result, we can use half as many patients per training
round and reduce our communication and energy cost (see Figure 4.6 for communication and
energy cost details).
Performance for each attack for patients contributing to the federated algorithm are
shown in Figure 4.4. The accuracy of the model increases and the FPR decreases for all
attacks when four or more patients are used during the training phase of the federated
algorithm. Using two patients caused a slight decrease in detection accuracy and an increase
in FPR. Doing the t-test for DoS attacks and a single patient versus eight patients used in the
network, with the same significance and critical value as before (α = 0.10 and Z = 1.860),
(a) (b)
Figure 4.3: Eight patients in a group and varying the number of patients used per traininground (parameter C).

28
(a) (b)
Figure 4.4: Evaluation of federated model for patients used in training federated network.Figure 4.4a is the detection accuracy of attacks and Figure 4.4b is the FPR.
we get a t = 2.98 which is greater than our critical value. Thus, we have made a statistically
significant decrease in the model’s FPR for DoS attacks. Repeating for modification attacks
we get t = 2.45 and t = 2.32 for injection attacks, all greater than Z. Comparing the
detection accuracy for the same number of patients in the network (one versus eight), we
get t = 1.48 for DoS, t = 1.99 for modification, and t = 1.73 for injection. The only t-
test to result in a value greater than Z was for modification attacks. Therefore, we can
only conclude that we made a statistically significant and positive impact of the detection
accuracy for modification attacks.
Previously we evaluated the IDS’s detection accuracy and FPR after the mobile device
performed its final training phase as described in Section 3.1.2. The IDS’s accuracy and
final training round’s time is dependent on how close the federated weights are to the local
optimum for that patient. In other words, if we are far away from the solution we must do
more work than if we were closer. In Figure 4.5 we evaluate the federated model without any
additional training and on holdout patient records. The holdout records are sensor data from
patients that were never part of the federated learning process. Thus, the FLIDS has never
seen or trained on these data and these results show the generalizability of the federated
model to find weights close to an optimal solution. This helps decrease training time and

29
(a) (b)
Figure 4.5: Evaluation of federated model using holdout patient records and no final trainingphase on the federated model: raw generalizability of the model on new patients. Figure4.5a is the detection accuracy of attacks and Figure 4.5b is the FPR.
FPR while also increasing detection accuracy.
Performance evaluation of each attack type using the new patient data is shown in Figure
4.5. Detection accuracy increases and FPR decreases as the number of patients used to train
the federated model increases. Standard deviation also decreased except for data injection’s
detection accuracy where it stayed at about the same. Using the same significance and
critical value as before (α = 0.10 and Z = 1.860) for comparing the accuracy of the single
and eight patient models we get t = 4.58 for DoS, t = 4.32 for modification, and t = 3.31
for injection. Comparing the FPR we get t = 4.64 for DoS, t = 4.58 for modification, and
t = 4.60 for injection. All the t-values are greater than our critical value Z and thus we
have made a significant increase in detection accuracy and decrease in FPR for all attacks
for unseen patient data. These results emphasize that the FLIDS learns better weights as
the number of patients used increases, and this means that both the overall accuracy of the
IDS increases, as seen in Figure 4.4, and the final training time for mobile devices decreases.
The communication cost of the federated algorithm is measured by the number of bytes
transmitted to and from the mobile device. Most of the communication cost is derived from
the transmission of the weights which is calculated with the equation 4.6. With 20 neurons,

30
(a) (b)
Figure 4.6: Figure 4.6a compares the amount of data transmitted via mobile devices versusamount of data used at the device for training. Figure 4.6b shows the energy used to trainand test the federated algorithm. Final training refers to the last training round’s time andthe time for a new patient entering the network.
7 features, and binary output, we get a total size of 1,621 bytes. During a training round, a
contributing patient trains its model and sends the updated weights to the server, and then
receives the averaged weights for a total of two transmissions of size 1,621 for a total of 3,242
bytes per round. There is an additional nine bytes of command information received by all
patients for each round.This brings the total amount of bytes communicated per round to
3,251 and FLIDS used eight rounds for a total transmission of 26,008 bytes. Figure 4.6a
shows a comparison of the number of bytes communicated versus the number of bytes of
data used to train the local patient model. The average size of data at a patients device is
equal to 98,034 bytes which, for eight communication rounds, we saved transmitting 72,026
bytes or we reduced the communication cost by a factor of 3.8.
The energy consumption of the federated algorithm is detailed in Figure 4.6b. Energy
consumption was calculated by taking the Watts consumed, measured via a USB e-meter,
multiplied by the number of seconds spent in each phase. The total amount of Joules used
for training of the federated model was 265 J with a baseline, the amount of energy used
if nothing was running on the device, of 218 J. Thus, the total energy cost of training the
federated model was 46 J, a new patient joining the network uses 5.5 J, and testing new

31
(a) (b)
(c) (d)
Figure 4.7: Comparison against of non-federated algorithms for training time and detectionaccuracy of attacks. Figures 4.7a and 4.7b contains models trained on a single patient record.Figures 4.7c and 4.7d contains models trained on eight patients. Federated algorithm chosenfor comparison was trained with eight mobile devices and C = 0.
samples uses 5.24 mJ. Thus, FLIDS consumes 17.5% more energy while training and 3.4%
more energy than idling when making predictions.
Training time for non-federated algorithms can be seen in Figure 4.7 with K-Nearest
Neighbor (KNN), Decision Trees (DT), Stochastic Gradient Descent (SGD), Support Vector
Machine (SVM), Neural Network (NN), and the Federated Learning (FL) algorithm for
comparison. Figure 4.7c shows the training time for non-federated models trained with
eight patient records on a single patient device. The results show that KNN, DT, and SGD
classifiers are much more time performant than SVM, neural networks, and the federated

32
algorithm. However, for a new patient entering the federated network, the final training time
is about equal to the SGD classifier and 26.8 times faster than the non-federated NN. The
detection accuracy for the attacks of the non-federated algorithms training on eight patient
records can be seen in Figure 4.7d with NN leading at 90.6% averaged across all attacks.
KNN is both accurate and time performant in this scenario with 89.3% and 5.6 times faster
than the final federated training round. However, KNN’s accuracy is still significantly worse
than the federated algorithm that has an additional 7.3% score. Additionally, FLIDS was
6% more accurate on average against the non-federated NN (the best overall non-federated
algorithm for detection accuracy). Thus, FLIDS provides the highest detection accuracy
while being comparable or better in training time against non-federated algorithms.
The time to train on a single patient record is seen in Figure 4.7a and the accuracy results
in Figure 4.7b. The non-federated algorithms are faster to train in this scenario, NN are
twice as fast to train as FLIDS, but detection accuracy is significantly worse than FLIDS
with a -0.32 difference on average. KNN is 16% faster to train on a single record, but also
suffers in detection accuracy against FLIDS by -0.06 for DoS and modification and -0.16
for injection attacks. Using less data to train the IDS with the non-federated algorithms
does decrease training time but comes at a significant cost to detection accuracy and model
generalizability.
Figure 4.8 show the training time of the federated algorithm with varying the number of
patients used in the network against the models accuracy. The federated algorithm converges
faster with more patients, around 70 seconds, but adding additional patients (past four)
seems to slow down the overall training phase. This may be due to several factors including
the sequential code execution at the server and Amdahls law. Amdahls law says that the
total speedup of a system is limited by the fraction of the code that is sequentially executed.
The law can be formulated as follows:
Speedup =1
(1 − p) + ps

33
Figure 4.8: Accuracy versus training time for different number of patients in network for thefederated learning algorithm.
With p being the fraction of execution being executed in parallel and s representing the
expected speedup (8 nodes equal 8 times speedup). As s goes to infinity, the 1(1−p)
term
remains which means that the fraction of sequentially executed code becomes the limiting
factor. This means the code at the server, which executes sequentially, is the limiting factor
on the speedup we can achieve. Referring to Figure 4.8, eight clients take roughly twice as
long to reach the same round (or epoch) as a federated network with two patients. Compared
to a neural network training on all eight records at a single device (see Figure 4.7a) the eight-
patient federated model is faster by a factor of 4.64. Compared to the same neural network
training on a single patient record, the federated model is only twice as slow at 201 seconds
versus 99 seconds. However, a new patient entering the federated network only spends about
34 seconds which provides a 2.9 times speedup over a neural network training with a single
record and 26.8 times speedup against the neural network training on eight records.
Lastly, the scalability of our design was evaluated using the same design, data, and a
similar neural network in MATLAB. We recorded the time spent by clients per training

34
Figure 4.9: MATLAB simulation results for C=0
round and not the elapsed time at the server. The results can be seen in Figure 4.9 with the
models varying in detection accuracy from 0.9 to 0.98, but all models converge around the
same time of 15 seconds. The two patient model took 16.7 seconds to reach round eight while
the 64 patient model took 16.9 seconds to reach the same round. Unlike in Figure 4.8 where
additional clients increased training time, in Figure 4.9 the addition of more clients does not
increase the training time. Thus, these results support our conclusions that additional time
in Figure 4.8 is due to Amdahl’s Law and the sequential server code. The detection accuracy
variability between each model is likely due to no hyper-parameter optimization, but the
models generally fall within the expected range of 0.95 that we saw in Figure 4.8. Overall,
the addition of more patients increases time linearly at the server only while avoiding an
increase in a single round’s duration or training time.

35
Chapter 5
CONCLUSION
Using Federated Learning, we implemented a distributed machine learning technique
that provided a flexible and scalable solution for deploying an Intrusion Detection System,
FLIDS, to a Medical Cyber-Physical System (MCPS). Training time for the federated model
was comparable or better than using a single machine learning instance and training on
the same amount of data. Training time for new patients registering with a group were
shown to be up to 26.8 times faster than non-federated algorithms. We also showed that
adding more patients to the federated model did not increase a round’s training time, but
only increases the computation cost at the server linearly. Thus, our FLIDS can train on
more data, increasing accuracy and lowering FPR, while decreasing the amount of time and
computation needed of an individual mobile device.
We also showed that each mobile device can contribute to the overall model even if the
local data used for training is non-representative of the overall population. The detection
accuracy and False Positive Rate (FPR) were increased by a statistically significant margin
by using the federated learning algorithm. Additionally, the False Negative Rate (FNR)
remained the same, under 0.5%, which means FLIDS can successfully detect attacks without
generating excessive false positives. This means that the proposed design can cope with the
ad-hoc nature of MCPS and variability in the patient data without sacrificing accuracy or
FPR. The low FPR ensures that hospitals spend their staff and resources efficiently while
maintaining high quality care for patients.
We were able to achieve our privacy goals because instead of transmitting personally
identifiable information of the patient across the network only an update vector needs to
be communicated. Additionally, the size of the update was independent of the data size

36
at the mobile device which saved network bandwidth by a factor of 3.8. The amount of
communication and computation at each mobile device can also be configured through several
parameters, such as the fraction of patients used per round (parameter C). This gives the
scheme more flexibility for more memory restrictive or low bandwidth networks by allowing
for trading of one for the other.
5.0.1 Limitations & Future Work
Future work includes tackling problems of poising attacks where erroneous baseline readings
are fed to a local model to poison the global model. Possible solutions could include a
validation check at the server of the update sent by the client. If the update performs worse
by a certain degree, then the update could be rejected and not used in the calculation of the
next server model. This would limit the amount of damage an attacker could inflict on the
global model because their attack must still perform to an expected degree versus being able
to upload any new updates as they can currently.
Additional parameters and optimization can also significantly increase accuracy and de-
crease training time. For example, adding a weight to each mobile device’s update that is
proportional to the number of training iterations the device performed (currently all updates
are treated equally, weight of one). For a two-device problem, this means that if device A
took ten times as many iterations to converge for a given round than device B, then the de-
vice A’s update is worth ten times that of B’s. This helps reduce the amount of computation
a device needs to move the federated model and thus improves training time and resource
consumption.
Another area for the future is addressing replay, Sybil, and routing attacks. These may
still be perpetrated due to data centric focus we used to limit the scope and burden of
implementing the design. Introducing network features into the IDS model may be able to
resolve these types of attacks.

37
BIBLIOGRAPHY
[1] Battista Biggio, Giorgio Fumera, Paolo Russu, Luca Didaci, and Fabio Roli. Adversar-ial biometric recognition: A review on biometric system security from the adversarialmachine-learning perspective. IEEE Signal Processing Magazine, 32(5):31–41, 2015.
[2] Vinh Bui, Richard Verhoeven, Johan Lukkien, and Rafal Kocielnik. A Trust EvaluationFramework for Sensor Readings in Body Area Sensor Networks. 2013.
[3] Luigi Coppolino and Luigi Romano. Open Issues in IDS Design for Wireless BiomedicalSensor Networks BT - Intelligent Interactive Multimedia Systems and Services. SmartInnovation, Systems and Technologies, 6:231–240, 2010.
[4] Karine Gandolfi, Christophe Mourtel, and Francis Olivier. Electromagnetic Analysis:Concrete Results. Number May. 2001.
[5] Shah Haque, Mustafizur Rahman, and Syed Aziz. Sensor Anomaly Detection in WirelessSensor Networks for Healthcare. Sensors, 15(4):8764–8786, 2015.
[6] Shah Ahsanul Haque and Syed Mahfuzul Aziz. False Alarm Detection in Cyber-physicalSystems for Healthcare Applications. AASRI Procedia, 5:54–61, 2013.
[7] Chunqiang Hu, Student Member, Hongjuan Li, and Yan Huo. Secure and EfficientData Communication Protocol for Wireless Body Area Networks. IEEE Transactionson Multi-Scale Computing Systems, 2(2):94–107, 2016.
[8] Jin-xin Hu, Chin-ling Chen, Chun-long Fan, and Kun-hao Wang. An Intelligent andSecure Health Monitoring Scheme Using IoT Sensor Based on Cloud Computing. 2017,2017.
[9] Abdulmalik Humayed, Jingqiang Lin, Fengjun Li, and Bo Luo. Cyber-Physical SystemsSecurity – A Survey. IEEE Internet of Things Journal, 4(6):1802–1831, 2017.
[10] Alistair E.W. Johnson, Tom J. Pollard, Lu Shen, Li Wei H. Lehman, Mengling Feng, Mo-hammad Ghassemi, Benjamin Moody, Peter Szolovits, Leo Anthony Celi, and Roger G.Mark. MIMIC-III, a freely accessible critical care database. Scientific Data, 3:1–9, 2016.

38
[11] Georgios Kambourakis, Eleni Klaoudatou, and Stefanos Gritzalis. Securing medicalsensor environments: The CodeBlue framework case. Proceedings - Second InternationalConference on Availability, Reliability and Security, ARES 2007, pages 637–643, 2007.
[12] Paul Kocher, Joshua Jaffe, Benjamin Jun, and Pankaj Rohatgi. Introduction to differ-ential power analysis. Journal of Cryptographic Engineering, 1(1):5–27, 2011.
[13] Paul C. Kocher, Joshua Ja, Benjamin Jun, Joshua Jaffe, Benjamin Jun, Joshua Ja,and Benjamin Jun. Differential Power Analysis. Journal of Cryptographic Engineering,pages 1–10, 2011.
[14] Jakub Konecny, H. Brendan McMahan, Daniel Ramage, and Peter Richtarik. FederatedOptimization: Distributed Machine Learning for On-Device Intelligence. In NIPS, pages1–38, 2015.
[15] G Senthil Kumar and K Tamilarasi. A Trust Based Security System for Mobile HealthCare. In Proceedings of the Int. Conf. on Information Science and Applications ICISA2010, number February, 2010.
[16] Pardeep Kumar and Hoon-Jae Lee. Security Issues in Healthcare Applications UsingWireless Medical Sensor Networks: A Survey. Sensors, 12(12):55–91, 2011.
[17] Yann LeCun and Corinna Cortes. MNIST handwritten digit database. 2010.
[18] H. Brendan McMahan, Eider Moore, Daniel Ramage, Seth Hampson, and BlaiseAguera y Arcas. Communication-Efficient Learning of Deep Networks from Decen-tralized Data. AISTATS, 54, 2017.
[19] Robert Mitchell and Ing-ray Chen. Behavior Rule Specification-based Intrusion De-tection for Safety Critical Medical Cyber Physical Systems. IEEE Transactions onDependable and Secure Computing, 12(1):16–30, 2015.
[20] Adedayo Odesile and Geethapriya Thamilarasu. Distributed Intrusion Detection UsingMobile Agents in Wireless Body Area Networks. IEEE, 2017.
[21] Girik Pachauri and Sandeep Sharma. Anomaly Detection in Medical Wireless SensorNetworks using Machine Learning Algorithms. Procedia Computer Science, 70:325–333,2015.
[22] Chang Seop Park. Security Mechanism Based on Hospital Authentication Server forSecure Application of Implantable Medical Devices. BioMed Research International,2014, 2014.

39
[23] Osman Salem, Alexey Guerassimov, Ahmed Mehaoua, Anthony Marcus, and BorkoFurht. Sensor Fault and Patient Anomaly Detection and Classification in Medical Wire-less Sensor Networks. IEEE ICC, pages 4373–4378, 2013.
[24] Osman Salem, Alexey Guerassimov, Ahmed Mehaoua, Anthony Marcus, and BorkoFurht. Anomaly Detection in Medical Wireless Sensor Networks using SVM and LinearRegression Models. International Journal of E-Health and Medical Communications(IJEHMC), 5(1):20–45, 2014.
[25] T V P Sundararajan and A Shanmugam. A Novel Intrusion Detection System forWireless Body Area Network in Health Care Monitoring. 6(11):1355–1361, 2010.
[26] Suwimon Vongsingthong and Sucha Smanchat. Internet of Things : a Review of Appli-cations and Technologies. Suranaree Journal of Science & Technology, 21(4):359–374,2014.
[27] Nasriah Zakaria, Muhammad Imran Sarwar, Norlia Mustaffa, Keikhosrokiani P,TC Wan, and K Azimi. Wireless Networks in Mobile Healthcare. Number January2016. Springer, 2016.
[28] Zhihua Zhang, Hongliang Zhu, Shoushan Luo, Yang Xin, and Xiaoming Liu. IntrusionDetection Based on State Context and Hierarchical Trust in Wireless Sensor Networks.IEEE, 5, 2017.