Embed Size (px)
Citation preview

Copy r igh t © 2013 , SAS Ins t i t u t e I nc . A l l r i gh t s res erved .
LOGISTIC REGRESSION

Copy r igh t © 2013 , SAS Ins t i t u t e I nc . A l l r i gh t s res erved .
OVERVIEW

Copy r igh t © 2013 , SAS Ins t i t u t e I nc . A l l r i gh t s res erved .
REMEMBER? APPLICATIONS: PREDICTION VS. EXPLANATORY ANALYSIS
• The terms in the model, the values of their coefficients, and their statistical significance are of secondary importance.
• The focus is on producing a model that is the best at predicting future values of Y as a function of the Xs. The predicted value of Y is given by this formula:
• The focus is on understanding the relationship between the dependent variable and the independent variables.
• Consequently, the statistical significance of the coefficients is important as well as the magnitudes and signs of the coefficients.
kkXXY ˆˆˆˆ110 kkXXY ˆˆˆˆ
110

Copy r igh t © 2013 , SAS Ins t i t u t e I nc . A l l r i gh t s res erved .
LOGISTIC REGRESSION ПРИМЕРЫ ЗАДАЧ
Target Marketing
Attrition Prediction
Credit Scoring
Fraud Detection

Copy r igh t © 2013 , SAS Ins t i t u t e I nc . A l l r i gh t s res erved .
LOGISTIC REGRESSION REGRESSION AND OTHER MODELS
Type of Predictors
Type of Response Categorical Continuous Continuous and
Categorical
Continuous Analysis of Variance (ANOVA)
Ordinary Least Squares (OLS)
RegressionAnalysis of Covariance
(ANCOVA)
CategoricalContingency Table Analysis or Logistic
RegressionLogistic Regression Logistic Regression

Copy r igh t © 2013 , SAS Ins t i t u t e I nc . A l l r i gh t s res erved .
LOGISTIC REGRESSION TYPES OF LOGISTIC REGRESSION

Copy r igh t © 2013 , SAS Ins t i t u t e I nc . A l l r i gh t s res erved .
LOGISTIC REGRESSION SUPERVISED (BINARY) CLASSIFICATION
y x2 x3 x4 x5 x6 ... xk
1
2
3
5...
n
4
x1
......
......
......
...
...
...
...
...
...
...
...
Input Variables
Cases
(Binary) Target

Copy r igh t © 2013 , SAS Ins t i t u t e I nc . A l l r i gh t s res erved .
LOGISTIC REGRESSION ЗАДАЧА И ДАННЫЕ
Other product usage in a three month period
Demographics
Did customer purchase variable annuity product?
1= yes0= no
~32’000 obs47 vars

Copy r igh t © 2013 , SAS Ins t i t u t e I nc . A l l r i gh t s res erved .
LOGISTIC REGRESSION ЗАДАЧА И ДАННЫЕ
Variable Label N N Miss
AcctAge Age of Oldest Account 30194 2070
DDA Checking Account 32264 0
DDABal Checking Balance 32264 0
Dep Checking Deposits 32264 0
DepAmt Amount Deposited 32264 0
CashBk Number Cash Back 32264 0
Checks Number of Checks 32264 0
DirDep Direct Deposit 32264 0
NSF Number Insufficient Fund 32264 0
NSFAmt Amount NSF 32264 0
Phone Number Telephone Banking
28131 4133
Teller Teller Visits 32264 0
Sav Saving Account 32264 0
SavBal Saving Balance 32264 0
ATM ATM 32264 0
ATMAmt ATM Withdrawal Amount 32264 0
POS Number Point of Sale 28131 4133
POSAmt Amount Point of Sale 28131 4133
POSAmt Amount Point of Sale 28131 4133
CD Certificate of Deposit 32264 0
CDBal CD Balance 32264 0
IRA Retirement Account 32264 0
IRABal IRA Balance 32264 0
LOC Line of Credit 32264 0
LOCBal Line of Credit Balance 32264 0
Inv Investment 28131 4133
InvBal Investment Balance 28131 4133
ILS Installment Loan 32264 0
ILSBal Loan Balance 32264 0
MM Money Market 32264 0
MMBal Money Market Balance 32264 0
MMCred Money Market Credits 32264 0
MTG Mortgage 32264 0
MTGBal Mortgage Balance 32264 0
CC Credit Card 28131 4133
CCBal Credit Card Balance 28131 4133
CCPurc Credit Card Purchases 28131 4133
SDB Safety Deposit Box 32264 0
SDB Safety Deposit Box 32264 0
Income Income 26482 5782
HMOwn Owns Home 26731 5533
LORes Length of Residence 26482 5782
HMVal Home Value 26482 5782
Age Age 25907 6357
CRScore Credit Score 31557 707
Moved Recent Address Change 32264 0
InArea Local Address 32264 0
Cumulative
Cumulative
Frequency Percent
0 21089 65.36 21089 65.36
1 11175 34.64 32264 100.00
InsFrequen
cy Percent

Copy r igh t © 2013 , SAS Ins t i t u t e I nc . A l l r i gh t s res erved .
ANALYTICAL CHALLENGES

Copy r igh t © 2013 , SAS Ins t i t u t e I nc . A l l r i gh t s res erved .
ANALYTICAL CHALLENGES
OPPORTUNISTIC DATA
Operational / Observational
Massive
Errors and Outliers
Missing Values
Analytical data preparation step:
• BENCHMARK: 80/20• [MY] LIFE: 99/1

Copy r igh t © 2013 , SAS Ins t i t u t e I nc . A l l r i gh t s res erved .
ANALYTICAL CHALLENGES
MIXED MEASUREMENT SCALES
12
sales, executive, homemaker, ...
88.60, 3.92, 34890.50, 45.01, ...
0, 1, 2, 3, 4, 5, 6, ...
F, D, C, B, A
27513, 21737, 92614, 10043, ...
M, F

Copy r igh t © 2013 , SAS Ins t i t u t e I nc . A l l r i gh t s res erved .
ANALYTICAL CHALLENGES
HIGH DIMENSIONALITY
13

Copy r igh t © 2013 , SAS Ins t i t u t e I nc . A l l r i gh t s res erved .
ANALYTICAL CHALLENGES
RARE TARGET EVENT
14
Eventrespond
churndefaultfraud
No Eventnot respond
staypay off
legitimate

Copy r igh t © 2013 , SAS Ins t i t u t e I nc . A l l r i gh t s res erved .
ANALYTICAL CHALLENGES
NONLINEARITIES AND INTERACTIONS
15
LinearAdditive
NonlinearNonadditive
E(y) E(y)
x1 x2x1 x2

Copy r igh t © 2013 , SAS Ins t i t u t e I nc . A l l r i gh t s res erved .
ANALYTICAL CHALLENGES
MODEL SELECTION
16
Underfitting
IIIIIIII II IIII IIIIIIIIIII
I
III IIIIIIIIIIIIIIIIIIIIIIIIIIIIIIIII
II
IIIIIIII
I
I
I
II
II
I
I
I
II
III
I
I
I
III
II
I
IIII
I
II
I
I IIII
II
IIIIIIIIIII IIIIIIIIIIII III IIIIIIIIIIII IIIIIIIIIIIIIIIIIIIIIIIIIIIIIIIIIIII
Overfitting
Just Right

Copy r igh t © 2013 , SAS Ins t i t u t e I nc . A l l r i gh t s res erved .
THE MODEL & ITS INTERPRETATION

Copy r igh t © 2013 , SAS Ins t i t u t e I nc . A l l r i gh t s res erved .
LOGISTIC REGRESSION WHY NOT LINEAR?
• If the response variable is categorical, then how do you code the response numerically?
• If the response is coded (1=Yes and 0=No) and your regression equation predicts 0.5 or 1.1 or -0.4, what does that mean practically?
• If there are only two (or a few) possible response levels, is it reasonable to assume constant variance and normality?
OLS Reg: Yi=0+1X1i+i
• Probabilities are bounded, but linear functions can take on any value. (Once again, how do you interpret a predicted value of -0.4 or 1.1?)
• Given the bounded nature of probabilities, can you assume a linear relationship between X and p throughout the possible range of X?
• Can you assume a random error with constant variance?
• What is the observed probability for an observation?
Linear Prob. Model: pi=0+1X1i

Copy r igh t © 2013 , SAS Ins t i t u t e I nc . A l l r i gh t s res erved .
LOGISTIC REGRESSION FUNCTIONAL FORM
kikii xxp 110)logit(
posterior probability
parameterinput

Copy r igh t © 2013 , SAS Ins t i t u t e I nc . A l l r i gh t s res erved .
LOGISTIC REGRESSION THE LOGIT LINK FUNCTION
e
pp
pp i
i
ii 1
11
ln)logit(
smaller larger
pi = 1
pi = 0

Copy r igh t © 2013 , SAS Ins t i t u t e I nc . A l l r i gh t s res erved .
LOGISTIC REGRESSION THE FITTED SURFACE

Copy r igh t © 2013 , SAS Ins t i t u t e I nc . A l l r i gh t s res erved .
LOGISTIC REGRESSION LOGISTIC PROCEDURE
proc logistic data=develop plots(only)=(effect(clband x=(ddabal depamt checks res)) oddsratio (type=horizontalstat)); class res (param=ref ref='S'); model ins(event='1') = dda ddabal dep depamt cashbk checks res / stb clodds=pl;
units ddabal=1000 depamt=1000 / default=1; oddsratio 'Comparisons of Residential Classification' res / diff=all cl=pl;run;

Copy r igh t © 2013 , SAS Ins t i t u t e I nc . A l l r i gh t s res erved .
LOGISTIC REGRESSION PROPERTIES OF THE ODDS RATIO
Группа в знаменателе имеет более высокие шансы наступления события
Группа в числителе имеет более высокие шансы
No Association
0 1
Estimated logistic regression model:logit(p) = .7567 + .4373*(gender)
where females are coded 1 and males are coded 0
Estimated odds ratio (Females to Males):odds ratio = (e-.7567+.4373)/(e-.7567) = 1.55
𝑂𝑑𝑑𝑠=𝑝𝑒𝑣𝑒𝑛𝑡( 𝐴)𝑝𝑒𝑣𝑒𝑛𝑡 (𝐵)

Copy r igh t © 2013 , SAS Ins t i t u t e I nc . A l l r i gh t s res erved .
LOGISTIC REGRESSION RESULTS FROM ODDSRATIO
oddsratio 'Comparisons of Residential Classification' res / diff=all cl=pl;
Label Estimate
Comparisons of Residential Classification Res R vs S 0.954 0.897 1.015
Comparisons of Residential Classification 2 Res R vs U 0.991 0.933 1.053
Comparisons of Residential Classification 3 Res U vs S 0.963 0.911 1.017
Odds Ratio Estimates and Profile-Likelihood Confidence Intervals95% Confidence
Limits

Copy r igh t © 2013 , SAS Ins t i t u t e I nc . A l l r i gh t s res erved .
LOGISTIC REGRESSION RESULTS FROM PLOTS = (EFFECT(…
plots(only)=(effect(clband x=(ddabal depamt checks res))
Effect Unit Estimate
DDABal 1000.0 1.074 1.067 1.082
DepAmt 1000.0 1.018 1.012 1.025
Odds Ratio Estimates and Profile-Likelihood Confidence Intervals
95% Confidence Limits

Copy r igh t © 2013 , SAS Ins t i t u t e I nc . A l l r i gh t s res erved .
LOGISTIC REGRESSION LOGISTIC DISCRIMINATION

Copy r igh t © 2013 , SAS Ins t i t u t e I nc . A l l r i gh t s res erved .
OVERSAMPLING

Copy r igh t © 2013 , SAS Ins t i t u t e I nc . A l l r i gh t s res erved .
OVERSAMPLING SAMPLING DESIGNS
(x,y),(x,y),(x,y),(x,y),(x,y),(x,y),(x,y),(x,y),(x,y),(x,y),(x,y),...
{(x,y),(x,y),(x,y),(x,y)}
x,x,x,x,x,x,x,x,x,x,x,...
y = 0 y = 1
{(x,0),(x,0),(x,1),(x,1)}x,x,x,x,x,x,x,x,x,x,x,...
Joint
Separate

Copy r igh t © 2013 , SAS Ins t i t u t e I nc . A l l r i gh t s res erved .
OVERSAMPLING THE EFFECT OF OVERSAMPLING

Copy r igh t © 2013 , SAS Ins t i t u t e I nc . A l l r i gh t s res erved .
OVERSAMPLING OFFSET
01
10ln
𝜋 1 ,𝜋 0𝜌1 ,𝜌 0
- в действительности- в выборке
Два способа корректировки1. Включить параметр «сдвига» в
модель
2. Скорректировать вероятности на выходе модели
Adjusted Probability:
𝑝1𝑎𝑑𝑗=
𝑝1 𝜋 1𝜌0𝑝1 𝜋1 𝜌0+(1−𝑝1 )𝜋 0𝜌 1
model … / offset=X

Copy r igh t © 2013 , SAS Ins t i t u t e I nc . A l l r i gh t s res erved .
OVERSAMPLING КОРРЕКТИРОВКА ВЕРОЯТНОСТЕЙ
/* Specify the prior probability *//* to correct for oversampling */%let pi1=.02;
/* Correct predicted probabilities */proc logistic data=develop; model ins(event='1')=dda ddabal dep depamt cashbk checks; score data = pmlr.new out=scored priorevent=&pi1;run;

Copy r igh t © 2013 , SAS Ins t i t u t e I nc . A l l r i gh t s res erved .
PREPARING THE INPUT VARIABLES

Copy r igh t © 2013 , SAS Ins t i t u t e I nc . A l l r i gh t s res erved .
MISSING VALUES DOES PR(MISSING) DEPEND ON THE DATA?
14
67
?
33
18
6
31
51
2
1
3
1
2
0
3
1
2
4
1
7
1
1
8
8
• Noo MCAR (missing completely at random)
• Yeso that unobserved valueo other unobserved valueso other observed values (including the target)
Copy r igh t © 2013 , SAS Ins t i t u t e I nc . A l l r i gh t s res erved .
MISSING VALUES COMPLETE CASE ANALYSIS
Cas
es
Input Variables
...

Copy r igh t © 2013 , SAS Ins t i t u t e I nc . A l l r i gh t s res erved .
MISSING VALUES COMPLETE CASE ANALYSIS
Cas
es
Input Variables

Copy r igh t © 2013 , SAS Ins t i t u t e I nc . A l l r i gh t s res erved .
MISSING VALUES NEW MISSING VALUES
321 4.189.072.1.2)ˆlogit( xxxp
Fitted Model:
New Case: 5.?,,2,, 321 xxx
7.)(89.144.1.2)ˆlogit( p
Predicted Value:

Copy r igh t © 2013 , SAS Ins t i t u t e I nc . A l l r i gh t s res erved .
MISSING VALUES MISSING VALUE IMPUTATION
6.5 2.3 .33 66
C99
01
0.8 0 C99
6.5 63
12 04 1.8 0 0.5 86 65 C14
01 4.8 37 C00
8 01 2.1 1 4.8 37 64 C08
6 01 2.8 1 9.6 22 66
3 2.7 0 1.1 28 64 C00
2 02 2.1 1 5.9 21 63 C03
10 03 2.0 0 63
7 01 2.5 0 5.5 62 67 C12
01 2.4 0 0.9 29 C05
6 03 2.6 0 8.3 42 66 C03

Copy r igh t © 2013 , SAS Ins t i t u t e I nc . A l l r i gh t s res erved .
MISSING VALUES IMPUTATION + INDICATORS
3463.22265418.4720
Median = 30
34633022265418304920
0010000100
CompletedData
MissingIndicator
IncompleteData

Copy r igh t © 2013 , SAS Ins t i t u t e I nc . A l l r i gh t s res erved .
MISSING VALUES IMPUTATION + INDICATORS
data develop1; /* Create missing indicators */ set develop; /* name the missing indicator variables */ array mi{*} MIAcctAg MIPhone … MICRScor; /* select variables with missing values */ array x{*} acctage phone … crscore; do i=1 to dim(mi); mi{i}=(x{i}=.); end;run;proc stdize data=develop1 reponly method=median /* Impute missing values with the median */ out=imputed; var &inputs;run;

Copy r igh t © 2013 , SAS Ins t i t u t e I nc . A l l r i gh t s res erved .
MISSING VALUES CLUSTER IMPUTATION [AT LATER LECTURES]
X1 =
X2 = ?

Copy r igh t © 2013 , SAS Ins t i t u t e I nc . A l l r i gh t s res erved .
CATEGORICAL INPUTS

Copy r igh t © 2013 , SAS Ins t i t u t e I nc . A l l r i gh t s res erved .
CATEGORICAL INPUTS DUMMY VARIABLES
000011001...
010000000...
001100010...
100000100...
DA DB DC DD
DBCCAADCA...
X

Copy r igh t © 2013 , SAS Ins t i t u t e I nc . A l l r i gh t s res erved .
CATEGORICAL INPUTS SMARTER VARIABLES
75100150150150 75100150100 . . .
111011101...
121133213...
HomeVal Local
998019962299523995239973799937995339952399622 . . .
ZIP ...Urbanicity

Copy r igh t © 2013 , SAS Ins t i t u t e I nc . A l l r i gh t s res erved .
CATEGORICAL INPUTS QUASI-COMPLETE SEPARATION
28
16
94
23
7
0
11
21
A
B
C
D
0 1
1
0
0
0
0
1
0
0
0
0
1
0
DA DB Dc
0
0
0
1
DD

Copy r igh t © 2013 , SAS Ins t i t u t e I nc . A l l r i gh t s res erved .
CATEGORICAL INPUTS CLUSTERING LEVELS
2 =
A
B
C
D
0 1
28
16
94
23
7
0
11
21
31.7
Merged:
100%
...

Copy r igh t © 2013 , SAS Ins t i t u t e I nc . A l l r i gh t s res erved .
CATEGORICAL INPUTS CLUSTERING LEVELS
2 =
A
B
C
D
0 1
28
16
94
23
7
0
11
21
31.7
Merged:
100%
B & C
30.7
28
110
23
7
11
21
0 1
97%
...

Copy r igh t © 2013 , SAS Ins t i t u t e I nc . A l l r i gh t s res erved .
CATEGORICAL INPUTS CLUSTERING LEVELS
2 =
A
B
C
D
0 1
28
16
94
23
7
0
11
21
31.7
Merged:
100%
B & C
30.7
28
110
23
7
11
21
0 1
97%
A & BC
28.6
138
23
18
21
0 1
90%
...

Copy r igh t © 2013 , SAS Ins t i t u t e I nc . A l l r i gh t s res erved .
CATEGORICAL INPUTS CLUSTERING LEVELS
A
B
C
D
0 1
28
16
94
23
7
0
11
21
B & C
30.7
28
110
23
7
11
21
0 1
97%
A & BC
28.6
138
23
18
21
0 1
90%
161 39
0 1
2 = 31.7
Merged:
100%
ABC & D
00%
Greenacre (1988, 1993) PROC MEANS – PROC CLUSTER – PROC TREE -… HOME WORK

Copy r igh t © 2013 , SAS Ins t i t u t e I nc . A l l r i gh t s res erved .
VARIABLE CLUSTERING

Copy r igh t © 2013 , SAS Ins t i t u t e I nc . A l l r i gh t s res erved .
VARIABLE CLUSTERING REDUNDANCY

Copy r igh t © 2013 , SAS Ins t i t u t e I nc . A l l r i gh t s res erved .
VARIABLE CLUSTERING
Credit Card Balance
Mortgage Balance Number of
ChecksTeller Visits
Checking Deposits
Age
PROC VARCLASS [LATER LECTURE]

Copy r igh t © 2013 , SAS Ins t i t u t e I nc . A l l r i gh t s res erved .
VARIABLE SCREENING UNIVARIATE SCREENING

Copy r igh t © 2013 , SAS Ins t i t u t e I nc . A l l r i gh t s res erved .
VARIABLE SCREENING UNIVARIATE SMOOTHING

Copy r igh t © 2013 , SAS Ins t i t u t e I nc . A l l r i gh t s res erved .
EMPIRICAL LOGITS
where
mi= number of events
Mi = number of cases
2
2lni
ii
ii
MmM
Mm
Copy r igh t © 2013 , SAS Ins t i t u t e I nc . A l l r i gh t s res erved .
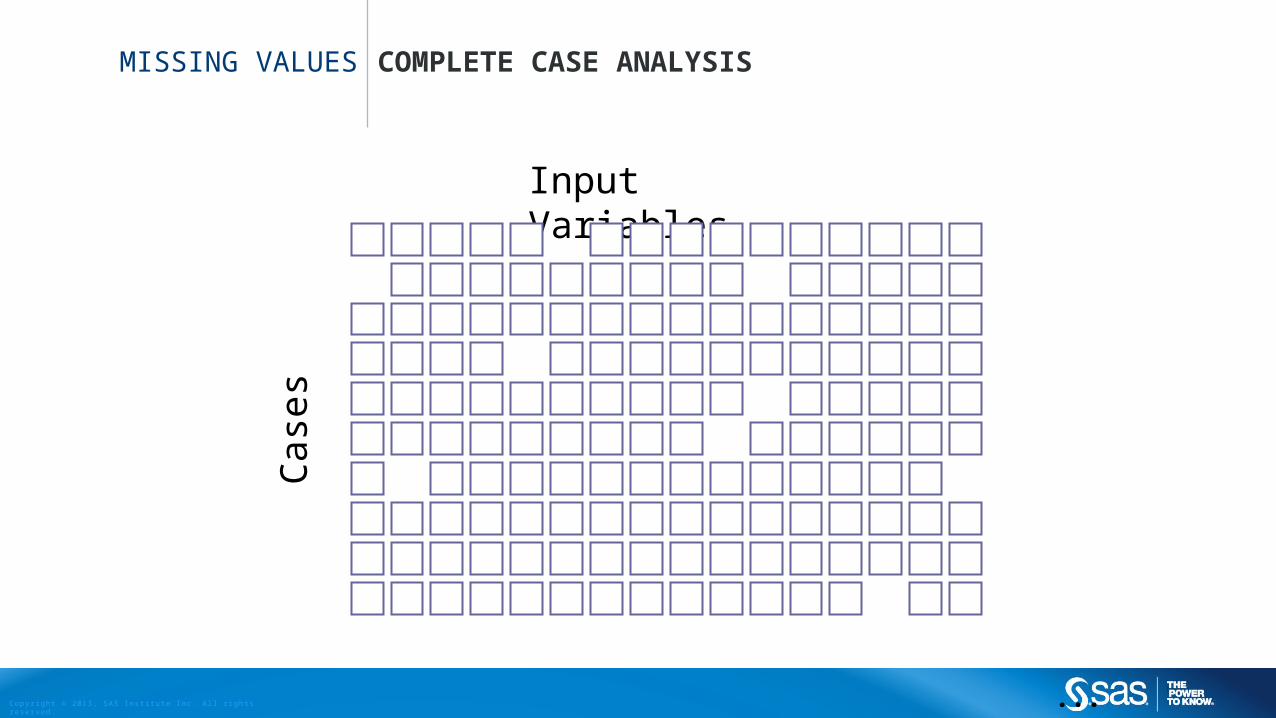
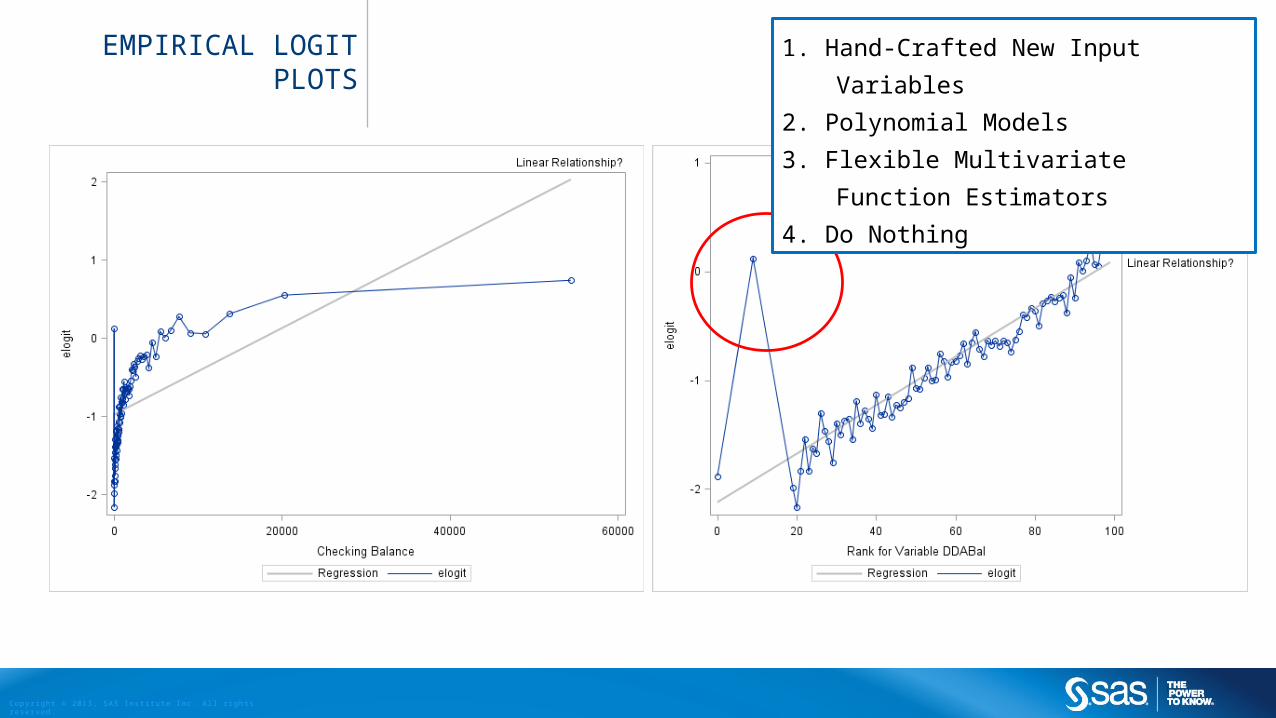
EMPIRICAL LOGIT PLOTS
1. Hand-Crafted New Input Variables
2. Polynomial Models
3. Flexible Multivariate Function Estimators
4. Do Nothing

Copy r igh t © 2013 , SAS Ins t i t u t e I nc . A l l r i gh t s res erved .
SUBSET SELECTION

Copy r igh t © 2013 , SAS Ins t i t u t e I nc . A l l r i gh t s res erved .
SUBSET SELECTION SCALABILITY IN PROC LOGISTIC
25 50 75 100 150 200
Number of Variables
AllSubsets
Stepwise
Fast Backward
Tim
e

Copy r igh t © 2013 , SAS Ins t i t u t e I nc . A l l r i gh t s res erved .
MEASURING CLASSIFIER PERFORMANCE

Copy r igh t © 2013 , SAS Ins t i t u t e I nc . A l l r i gh t s res erved .
HONEST ASSESSMENT THE OPTIMISM PRINCIPLE
x2
x1
black gray
Training
Accuracy = 70%
x2
black gray
Test
Accuracy = 47%

Copy r igh t © 2013 , SAS Ins t i t u t e I nc . A l l r i gh t s res erved .
HONEST ASSESSMENT DATA SPLITTING
Validation
Test
Training

Copy r igh t © 2013 , SAS Ins t i t u t e I nc . A l l r i gh t s res erved .
HONEST ASSESSMENT OTHER APPROACHES
A B C D E
Train
BCDE
ACDE
ABDE
ABCE
ABCD
Validate
A
B
C
D
E
1)
2)
3)
4)
5)

Copy r igh t © 2013 , SAS Ins t i t u t e I nc . A l l r i gh t s res erved .
MISCLASSIFICATION CONFUSION MATRIX
TrueNegative
FalsePositive
FalseNegative
TruePositive
ActualNegative
PredictedNegative
PredictedPositive
ActualPositive
Predicted Class
Act
ual C
lass 0
1
0 1

Copy r igh t © 2013 , SAS Ins t i t u t e I nc . A l l r i gh t s res erved .
SENSITIVITY AND POSITIVE PREDICTED VALUE
TruePositive
PredictedPositive
ActualPositive
Predicted Class
Act
ual C
lass 0
1
0 1

Copy r igh t © 2013 , SAS Ins t i t u t e I nc . A l l r i gh t s res erved .
ROC CURVE

Copy r igh t © 2013 , SAS Ins t i t u t e I nc . A l l r i gh t s res erved .
OVERSAMPLED TEST SET
29 21
17 33
Predicted
Act
ual 0
1
0 1
46 54
50
50
56 41
1 2
Predicted
0 1
57 43
97
3
Sample Population

Copy r igh t © 2013 , SAS Ins t i t u t e I nc . A l l r i gh t s res erved .
ADJUSTMENTS FOR OVERSAMPLING
0·Sp 0(1—Sp)
1(1—Se) 1·Se
Predicted Class
Act
ual C
lass 0
1
0 1
0
1

Copy r igh t © 2013 , SAS Ins t i t u t e I nc . A l l r i gh t s res erved .
ALLOCATION RULES CUTOFFS

Copy r igh t © 2013 , SAS Ins t i t u t e I nc . A l l r i gh t s res erved .
ALLOCATION RULES PROFIT MATRIX
57 18
1 24
66 9
4 21
70 5
9 16
Total Profit
24*99 - 18 = $2358
21*99 - 9 = $2070
16*99 - 5 = $1579
$0 -$1
$0 $99
PredictedA
ctua
l 0
1
0 1

Copy r igh t © 2013 , SAS Ins t i t u t e I nc . A l l r i gh t s res erved .
ALLOCATION RULES PROFIT MATRIX
Act
ual C
lass
Decision
TN
FN TP
FPTP FN
TN FP
1
1
P
Bayes Rule:
Decision 1 if
0
1
0 1

Copy r igh t © 2013 , SAS Ins t i t u t e I nc . A l l r i gh t s res erved .
ALLOCATION RULES CLASSIFIER PERFORMANCE

Copy r igh t © 2013 , SAS Ins t i t u t e I nc . A l l r i gh t s res erved .
ALLOCATION RULES USING PROFIT TO ASSESS FIT
Copy r igh t © 2013 , SAS Ins t i t u t e I nc . A l l r i gh t s res erved .
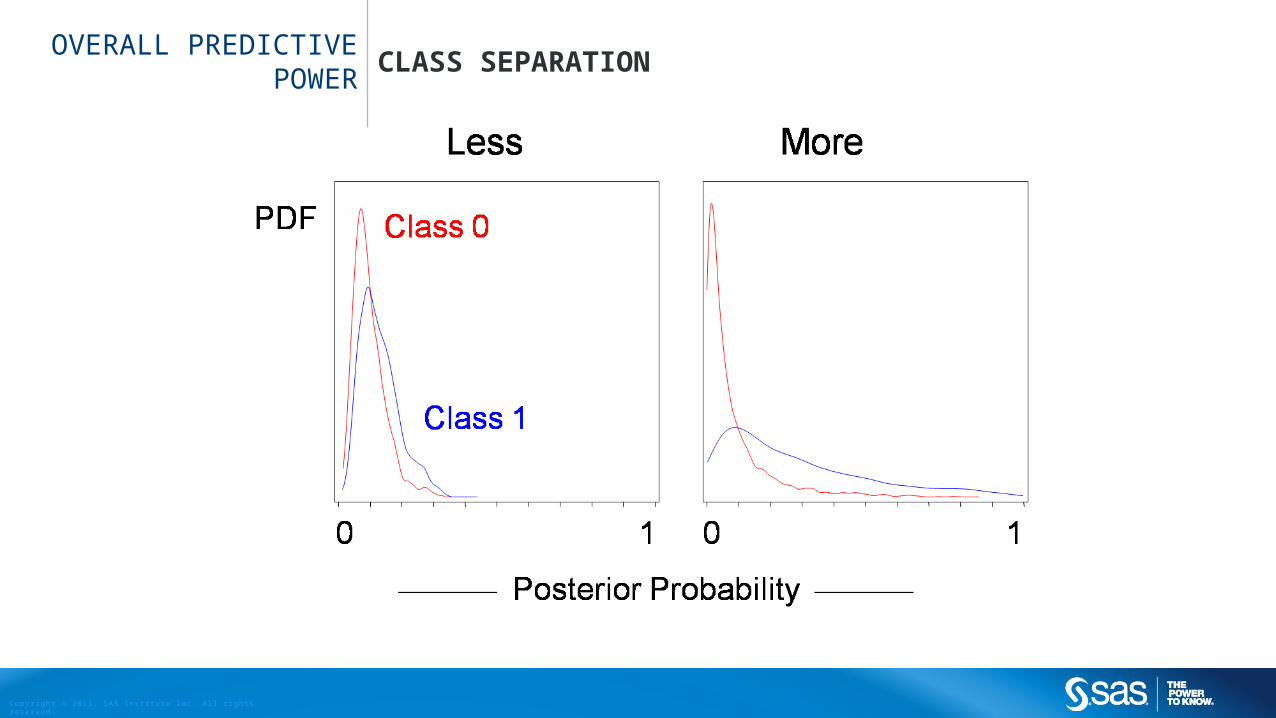
OVERALL PREDICTIVE POWER
CLASS SEPARATION

Copy r igh t © 2013 , SAS Ins t i t u t e I nc . A l l r i gh t s res erved .
OVERALL PREDICTIVE POWER
K-S STATISTIC

Copy r igh t © 2013 , SAS Ins t i t u t e I nc . A l l r i gh t s res erved .
OVERALL PREDICTIVE POWER
AREA UNDER THE ROC CURVE

Copy r igh t © 2013 , SAS Ins t i t u t e I nc . A l l r i gh t s res erved .
ROC AND ROCCONTRAST STATEMENTS
ROC <'label'> <specification> </ options>; ROCCONTRAST <'label'><contrast></ options>;
ROC <'label'> <specification> </ options>; ROCCONTRAST <'label'><contrast></ options>;