Embed Size (px)
Citation preview

Copyright © 2013 Pearson Education, Inc. Publishing as Prentice Hall. 1
Job Costing
Chapter 3

Copyright © 2013 Pearson Education, Inc. Publishing as Prentice Hall. Copyright © 2009 Pearson Education, Inc. Publishing as Prentice Hall. 2
Objective 1Distinguish between job costing and
process costing
Copyright © 2013 Pearson Education, Inc. Publishing as Prentice Hall. 3
Process Costing
• Mass production• Similar items• Total costs are averaged over all units• Examples
– Paint manufacturers– Oil refineries– Cereal manufacturers

Copyright © 2013 Pearson Education, Inc. Publishing as Prentice Hall. 4
Job Costing
• Unique, custom products or small batches• Total costs are accumulated by job• Examples
– Hospitals– Custom home builders– Advertising agencies

Copyright © 2013 Pearson Education, Inc. Publishing as Prentice Hall.
Now turn to S3-1
5

Copyright © 2013 Pearson Education, Inc. Publishing as Prentice Hall. 6
a. A manufacturer of fiberglass insulation
b. A residential plumbing contractor
c. A manufacturer of fiber optic cable
d. A custom home builder
e. A hospital
S3-1: Examples of Process and Job Costing
Process costing
Job costing
Job costing
Job costing
Process costing

Copyright © 2013 Pearson Education, Inc. Publishing as Prentice Hall. Copyright © 2009 Pearson Education, Inc. Publishing as Prentice Hall. 7
Objective 2Understand the flow of production and how direct materials and direct
labor are traced to jobs

Copyright © 2013 Pearson Education, Inc. Publishing as Prentice Hall. 8
Flow of Inventory Through a Manufacturing System
Raw Materials
Storeroom
Work in process
Production department
Finished Goods
Ready for sale
Cost of Goods Sold
Sold

Copyright © 2013 Pearson Education, Inc. Publishing as Prentice Hall. 9
Exhibit 3-3: Production Schedulefor the Month of December
Job Model Number Stock or Customer Quantity Scheduled
Start DateScheduled End date
603 X4 Cross-Trainer For stock 50 12/2 12/6
604 T5-0 Treadmill For stock 60 12/7 12/17
605 Custom T6-C Treadmill Bears 15 12/18 12/21
606 Custom S3-C Stair-Climber Bears 12 12/22 12/24
FACTORY CLOSED FOR HOLIDAYS and ANNUAL MAINTENANCE 12/25 12/31

Copyright © 2013 Pearson Education, Inc. Publishing as Prentice Hall. 10
Exhibit 3-4: Bill of Materials
Part Number Description Quantity Needed
HRM50812 Heart rate monitor 50
LCD620 LCD entertainment screen 50B4906 Front and rear rolling base 100HG2567 Hand grips 100FP689 Foot platform 100
Etc.

Copyright © 2013 Pearson Education, Inc. Publishing as Prentice Hall. 11
Purchasing Process
Purchasing determines
ordering needs
Shipping and receiving prepares receiving
report
Accounting matches
invoice with purchase order
Purchasing issues
purchase order
Accounting pays the invoice

Copyright © 2013 Pearson Education, Inc. Publishing as Prentice Hall. 12
Job Cost RecordJob Number: 603Customer: For stockJob Description: 50 units of X4 Elliptical Cross-TrainersDate Started: Dec. 2 Date Completed: _________
Manufacturing Cost Information: Cost SummaryDirect Materials $Direct Labor $Manufacturing Overhead $Total Job Cost $Number of Units ÷ 50 unitsCost per Unit $
Shipping Information:Date Quantity Shipped Units Remaining Cost Balance
Exhibit 3-7: Job Cost Record

Copyright © 2013 Pearson Education, Inc. Publishing as Prentice Hall.
Exhibit 3-8: Work in Process Inventory
13
JOB 560-Direct MaterialsDirect LaborMOH Total Job Cost
Life FitnessBalance SheetNovember 30
Assets: Liabilities and Owners Equity: Cash Accounts Payable Accounts Receivable Wages and Salaries Payable Raw Materials Inventory Other Liabilities Work in Process Inventory Finished Goods Inventory Common Stock
Retained Earnings Property and EquipmentTotal Assets Total Liabilities and Owner’s
Equity
JOB 561-Direct MaterialsDirect LaborMOH Total Job Cost
JOB 562-Direct MaterialsDirect LaborMOH Total Job Cost
JOB 563-Direct MaterialsDirect LaborMOH Total Job Cost
The job cost records on incomplete jobs sum to the total Work in Process Inventory shown on the balance sheet

Copyright © 2013 Pearson Education, Inc. Publishing as Prentice Hall. 14
Exhibit 3-9: Materials Requisition
Materials RequisitionNumber: #7568
Date: 12/2Job: 603
Part Number Description Quantity Unit Cost AmountHRM50812 Heart rate monitor 50 $60 $3,000
LCD620 LCD entertainment screen 50 $100 5,000
B4906 Front and rear rolling base 100 $5 500
Total $8,500
Copyright © 2013 Pearson Education, Inc. Publishing as Prentice Hall.
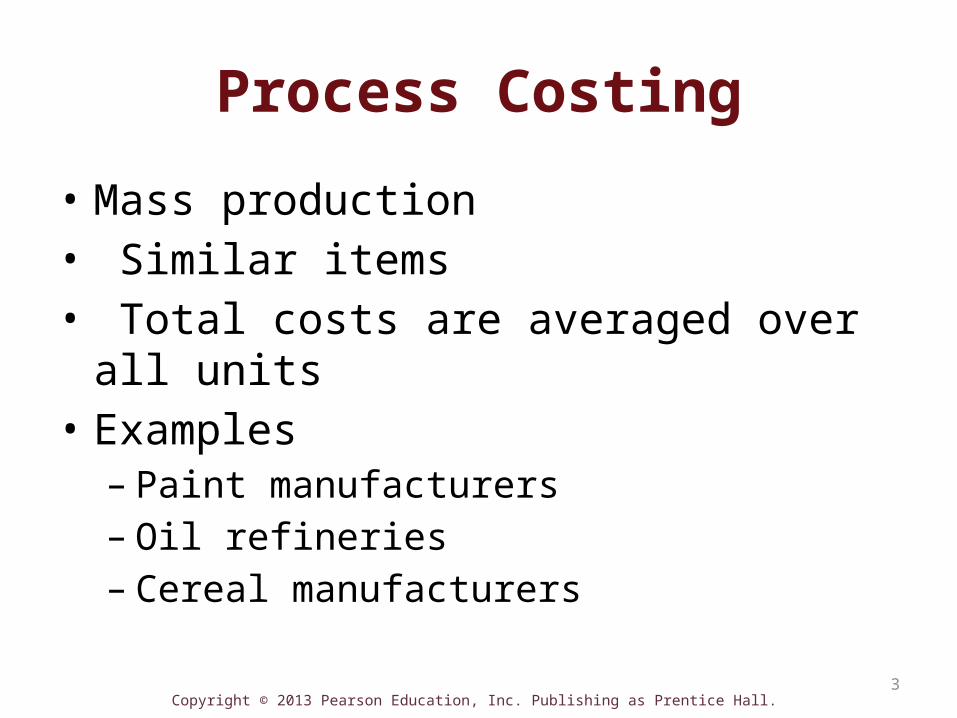
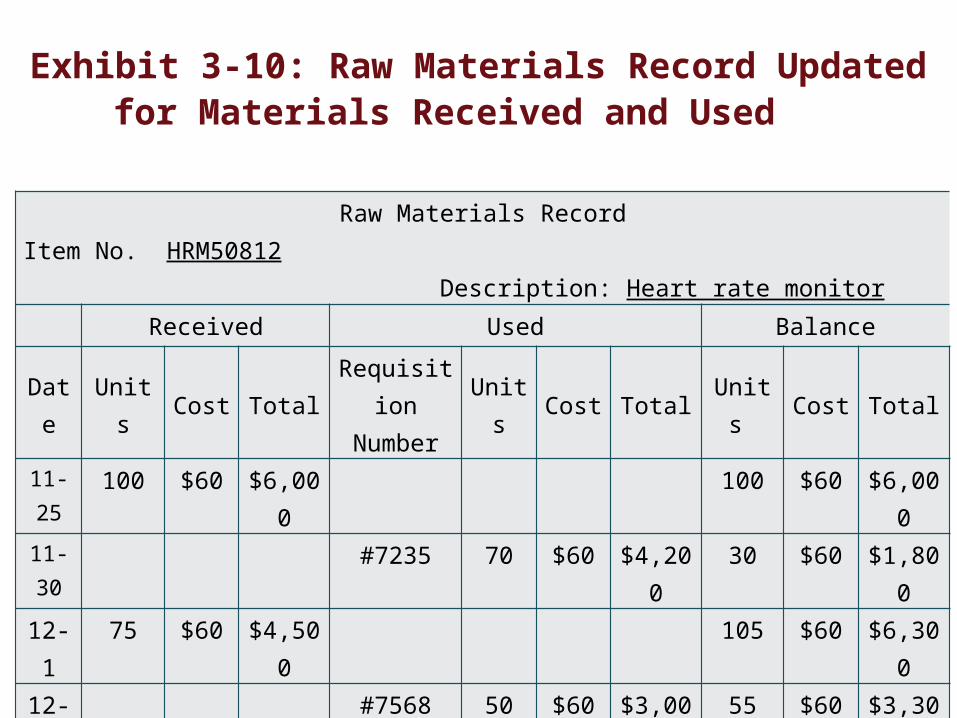
Exhibit 3-10: Raw Materials Record Updated for Materials Received and Used
15
Raw Materials RecordItem No. HRM50812 Description: Heart rate monitor
Received Used Balance
Date Units Cost Total RequisitionNumber Units Cost Total Units Cost Total
11-25 100 $60 $6,000 100 $60 $6,000
11-30 #7235 70 $60 $4,200 30 $60 $1,800
12-1 75 $60 $4,500 105 $60 $6,30012-2 #7568 50 $60 $3,000 55 $60 $3,300

Copyright © 2013 Pearson Education, Inc. Publishing as Prentice Hall. 16
Direct Labor Costs Are Traced to Individual Jobs
Labor Time RecordEmployee: Hannah Smith Week: 12/2- 12/9Hourly Wage Rate: $20 Record #: 324
Date Job Number
Start Time
End Time Hours Cost
12/2 602 3 $ 6012/2 603 5 $ 10012/3 603 8 $ 16012/4 etc.
Copyright © 2013 Pearson Education, Inc. Publishing as Prentice Hall.
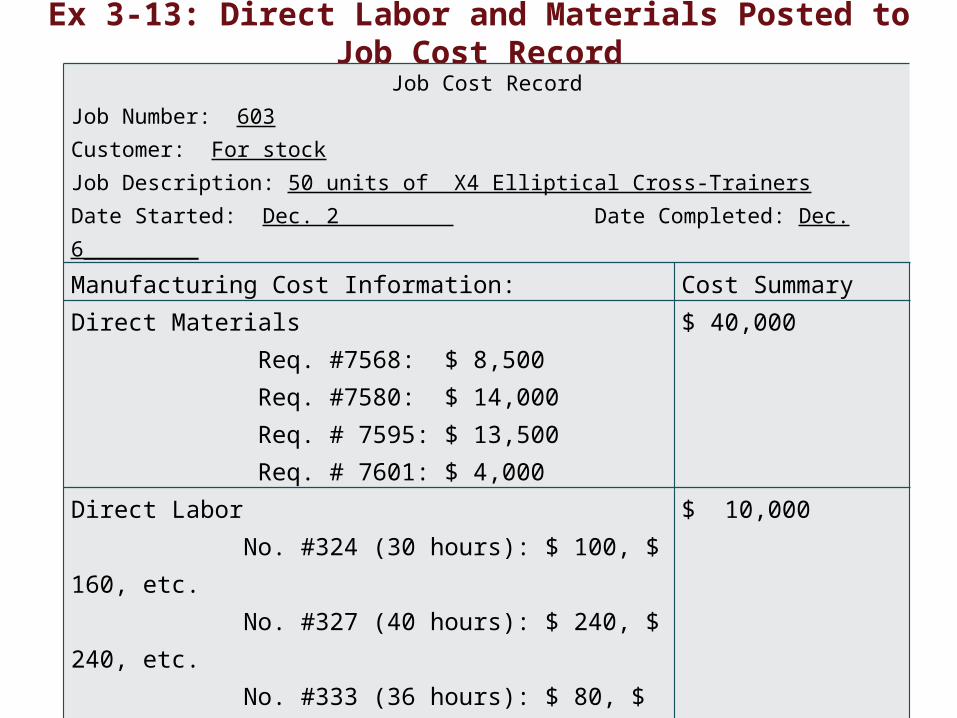
Ex 3-13: Direct Labor and Materials Posted to Job Cost Record
17
Job Cost RecordJob Number: 603Customer: For stockJob Description: 50 units of X4 Elliptical Cross-TrainersDate Started: Dec. 2 Date Completed: Dec. 6_________
Manufacturing Cost Information: Cost SummaryDirect Materials Req. #7568: $ 8,500 Req. #7580: $ 14,000 Req. # 7595: $ 13,500 Req. # 7601: $ 4,000
$ 40,000
Direct Labor No. #324 (30 hours): $ 100, $ 160, etc. No. #327 (40 hours): $ 240, $ 240, etc. No. #333 (36 hours): $ 80, $ 120, etc.Etc. (a total of 500 direct labor hours)
$ 10,000
Manufacturing Overhead $ Total Job Cost $ Number of Units ÷ 50 unitsCost per Unit $

Copyright © 2013 Pearson Education, Inc. Publishing as Prentice Hall. Copyright © 2009 Pearson Education, Inc. Publishing as Prentice Hall. 18
Objective 3Compute a predetermined
manufacturing overhead rate and use it to allocate MOH to jobs

Copyright © 2013 Pearson Education, Inc. Publishing as Prentice Hall. 19
Calculating Predetermined Manufacturing Overhead Rate
POHR*= Total estimated mfg overhead costsTotal estimated amount of allocation base
*POHR stands for “Predetermined Manufacturing Overhead Rate”

Copyright © 2013 Pearson Education, Inc. Publishing as Prentice Hall. 20
Allocating Manufacturing Overhead (MOH) to Individual Jobs
Allocated MOH =POHR x Amount of cost allocation activity used
*POHR stands for “Predetermined Manufacturing Overhead Rate”

Copyright © 2013 Pearson Education, Inc. Publishing as Prentice Hall. 21
Allocating MOH to Individual Job (Example)
POHR = $1,000,000 estimated overhead costs62,500 direct labor hours
= $16 per direct labor hours
Example:Total estimated manufacturing overhead costs = $1,000,000Cost allocation base is direct labor hours (DLH)Total estimated direct labor hours for the year = 62,500 DLHsJob #603 used 500 DLHs
*POHR stands for “Predetermined Manufacturing Overhead Rate”

Copyright © 2013 Pearson Education, Inc. Publishing as Prentice Hall. 22
Allocating MOH to Individual Job (continued from prior slide):
• Allocated MOH for Job #603
= $16 x 500 DLHs
= $8,000
*POHR stands for “Predetermined Manufacturing Overhead Rate”

Copyright © 2013 Pearson Education, Inc. Publishing as Prentice Hall.
Exhibit 3-14: Completing the Job Cost Record
23
Job Cost RecordJob Number: 603Customer: For stockJob Description: 50 units of X4 Elliptical Cross-TrainersDate Started: Dec. 2 Date Completed: _________Manufacturing Cost Information: Cost SummaryDirect Materials Req. #7568: $ 8,500 Req. #7580: $ 14,000 Req. # 7595: $ 13,500 Req. # 7601: $ 4,000
$ 40,000
Direct Labor No. #324 (30 hours): $ 100, $ 160, etc.No. #327 (40 hours): $ 240, $ 240, etc. No. #333 (36 hours): $ 80, $ 120, etc.Etc. (a total of 500 direct labor hours)
$ 10,000
Manufacturing Overhead $16/ DL hour × 500 DL hours= $8,000
$ 8,000
Total Job Cost $ 58,000Number of Units ÷ 50 unitsCost per Unit $1,160

Copyright © 2013 Pearson Education, Inc. Publishing as Prentice Hall. 24
When Is Manufacturing Overhead Allocated?
Work in Process
Cost of GoodsSold
Labor
Materials
Ind
irec
t
FinishedGoods
FactoryOverhead
Direct
Direct
Allocate
Ind
irec
t

Copyright © 2013 Pearson Education, Inc. Publishing as Prentice Hall. 25
Cost Flow
Work in Process
FinishedGoods
Cost of GoodsSold
DirectMaterials
Direct Labor
ManufacturingOverhead

Copyright © 2013 Pearson Education, Inc. Publishing as Prentice Hall. Copyright © 2009 Pearson Education, Inc. Publishing as Prentice Hall. 26
Objective 4Determine the cost of a job and use it
to make business decisions

Copyright © 2013 Pearson Education, Inc. Publishing as Prentice Hall. 27
Reasons Why Management Needs Product Cost
1. Reduce future job costs2. Assess and compare profitability of models3. Pricing decisions4. Discounts on high-volume sales5. Bids for custom orders6. Financial statement preparation

Copyright © 2013 Pearson Education, Inc. Publishing as Prentice Hall.
Sustainability and Job Costing• Job cost record captures the essential
resources required to manufacture a product• Job cost record can be enhanced with
information about– Product/production’s effect on the environment– Employees involved in manufacturing process– Future consumers – Future disposal
• Subcategories • Extended Producer Responsibility (EPR)
28

Copyright © 2013 Pearson Education, Inc. Publishing as Prentice Hall. 29
Now turn to E3-18A

Copyright © 2013 Pearson Education, Inc. Publishing as Prentice Hall. 30
E3-18A
1. What is Raymond’s predetermined manufacturing overhead rate based on direct labor cost?
Total direct labor cost = $35 x 22,000 hours = $770,000
POHR = $485,100 ÷ $770,000 = 63% of direct labor cost

Copyright © 2013 Pearson Education, Inc. Publishing as Prentice Hall. 31
E3-18A (cont.)
2. Calculate the manufacturing overhead to be allocated based on direct labor cost to Job 371.
Direct labor hours used = 180 x $35 per hour = $6,300 direct labor cost
POHR = 63% x $6,300 = $3,969
Allocated MOH for Job 371 = $3,969

Copyright © 2013 Pearson Education, Inc. Publishing as Prentice Hall. 32
E3-18A (cont.)
3. What is the total cost of Job 371?
Direct materials used $14,500Direct labor cost (180 x $35) 6,300Manufacturing overhead allocated 3,969Total cost of Job 371 $24,769

Copyright © 2013 Pearson Education, Inc. Publishing as Prentice Hall. Copyright © 2009 Pearson Education, Inc. Publishing as Prentice Hall. 33
Objective 5Compute and dispose of
overallocated or underallocated manufacturing overhead
Copyright © 2013 Pearson Education, Inc. Publishing as Prentice Hall.
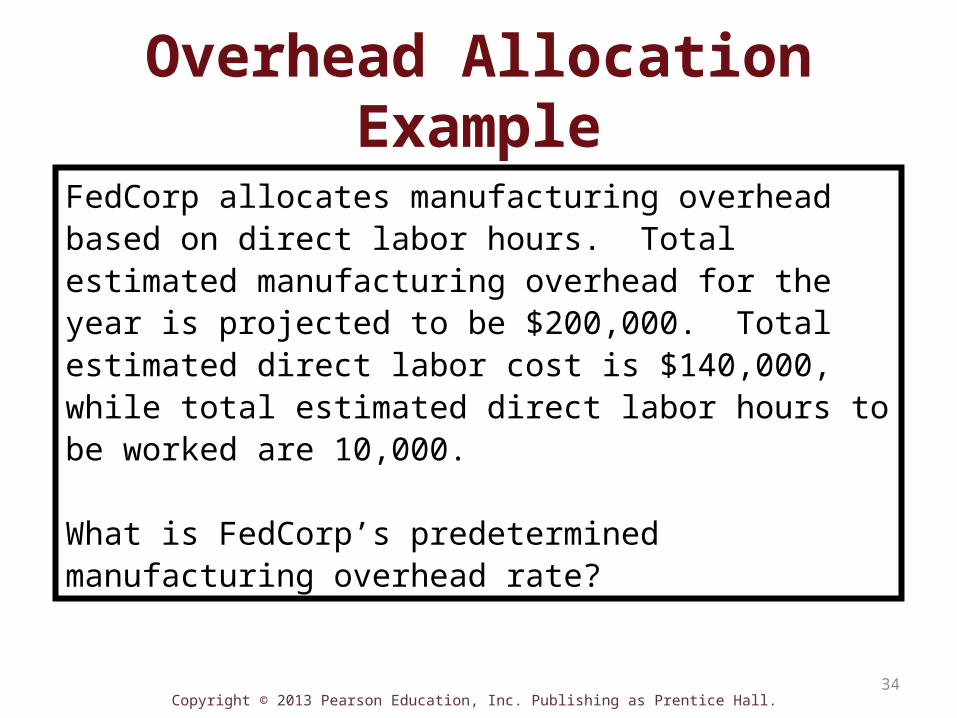
Overhead Allocation Example
FedCorp allocates manufacturing overhead based on direct labor hours. Total estimated manufacturing overhead for the year is projected to be $200,000. Total estimated direct labor cost is $140,000, while total estimated direct labor hours to be worked are 10,000.
What is FedCorp’s predetermined manufacturing overhead rate?
34

Copyright © 2013 Pearson Education, Inc. Publishing as Prentice Hall.
FedCorp allocates manufacturing overhead based on direct labor hours. Total estimated manufacturing overhead for the year is projected to be $200,000. Total estimated direct labor cost is $140,000, while total estimated direct labor hours to be worked are 10,000.
What is FedCorp’s predetermined manufacturing overhead rate?
POHR = $200,000 ÷ 10,000 = $20 per DLH35
Overhead Allocation Example (cont.)

Copyright © 2013 Pearson Education, Inc. Publishing as Prentice Hall.
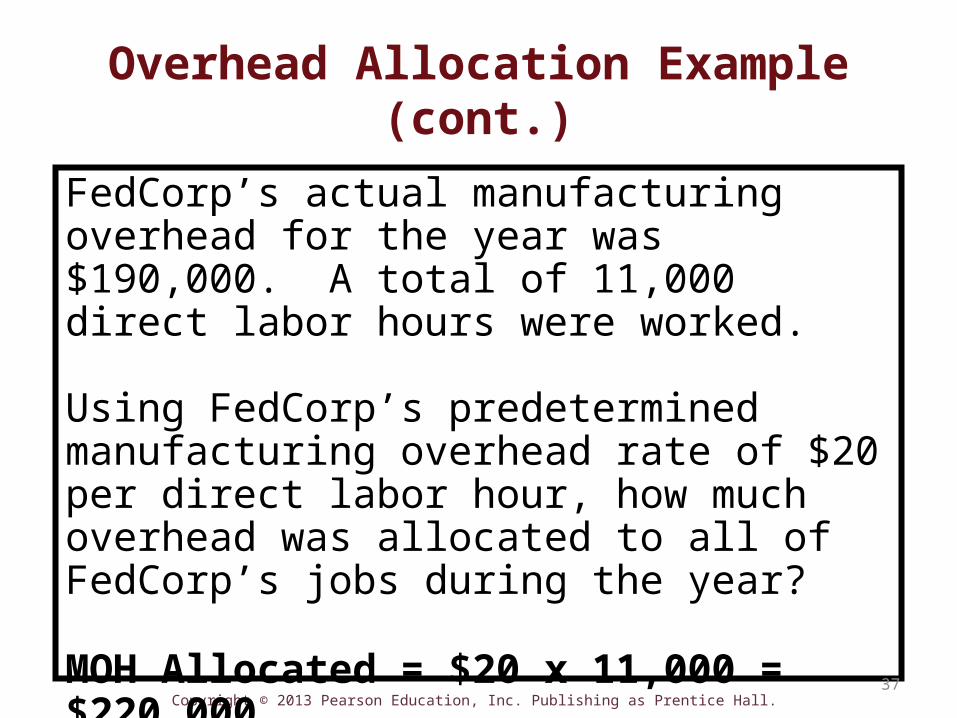
Overhead Allocation Example (cont.)
FedCorp’s actual manufacturing overhead for the year was $190,000. A total of 11,000 direct labor hours were worked.
Using FedCorp’s predetermined manufacturing overhead rate of $20 per direct labor hour, how much overhead was allocated to all of FedCorp’s jobs during the year?
36
Copyright © 2013 Pearson Education, Inc. Publishing as Prentice Hall.
Overhead Allocation Example (cont.)
FedCorp’s actual manufacturing overhead for the year was $190,000. A total of 11,000 direct labor hours were worked.
Using FedCorp’s predetermined manufacturing overhead rate of $20 per direct labor hour, how much overhead was allocated to all of FedCorp’s jobs during the year?
MOH Allocated = $20 x 11,000 = $220,000
37

Copyright © 2013 Pearson Education, Inc. Publishing as Prentice Hall.
Now we look at what to do if (WHEN) actual MOH does not
equal allocated MOH
Continuing same example (FedCorp)
38

Copyright © 2013 Pearson Education, Inc. Publishing as Prentice Hall. 39
Overhead Allocation Example (cont.)
FedCorp’s actual overheadFedCorp’s allocated overheadDifference
$190,000
“Target” was $190,000; actually allocated $220,000.
Overapplied by $30,000.
$220,000$ 30,000

Copyright © 2013 Pearson Education, Inc. Publishing as Prentice Hall. 40
Underallocated or Overallocated Manufacturing Overhead
• Underallocated (undercosted) – Not enough allocated to jobs – Too little expense
• Overallocated (overcosting) – Too much allocated to jobs – Too much expense

Copyright © 2013 Pearson Education, Inc. Publishing as Prentice Hall. 41
Underallocated or Overallocated Manufacturing Overhead
• Why/How?• Estimated manufacturing overhead costs were higher
or lower than actual• Used more or less of the estimated allocation base than
projected
• Two Solutions• Adjust cost of goods sold OR• Prorate between Cost of Goods Sold, Work in Process
Inventory, Finished Goods Inventory

Copyright © 2013 Pearson Education, Inc. Publishing as Prentice Hall. 42
How Do Manufacturers Treat Non-Manufacturing Costs?
• GAAP – only inventoriable product costs added to the cost of assets (inventory)
• Internal decision-making – management wants to know the total cost of the product across the value chain

Copyright © 2013 Pearson Education, Inc. Publishing as Prentice Hall.
Now turn to E3-24A
43

Copyright © 2013 Pearson Education, Inc. Publishing as Prentice Hall.
E3-24A (cont.)
Req 1: Predetermined manufacturing overhead rate = $650,000 / 81,250 = $8/machine hour
Req 2: Allocated MOH = 54,500 machine hours x $8 per machine hour = $436,000
44
Copyright © 2013 Pearson Education, Inc. Publishing as Prentice Hall. 46
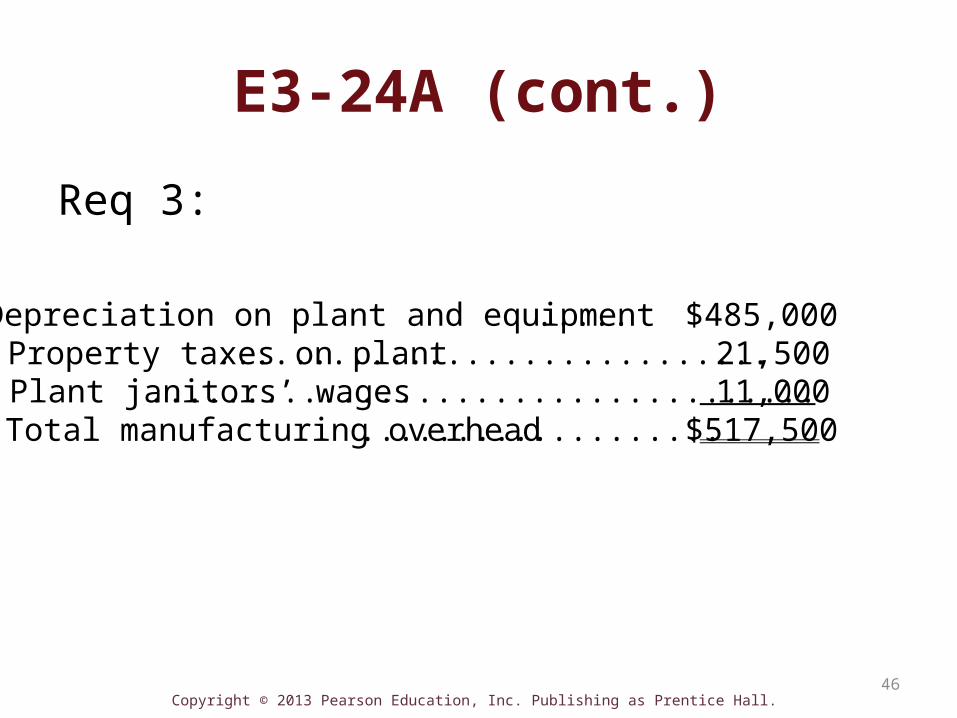
E3-24A (cont.)
Req 3:
Depreciation on plant and equipment..... $485,000Property taxes on plant............................. 21,500Plant janitors’ wages................................... 11,000Total manufacturing overhead................... $517,500

Copyright © 2013 Pearson Education, Inc. Publishing as Prentice Hall. 47
E3-24A, pp.
Req 4:
Actual manufacturing overhead…............ $517,500Allocated manufacturing overhead.......... 436,000Underallocated manufacturing overhead $ 81,500

Copyright © 2013 Pearson Education, Inc. Publishing as Prentice Hall. Copyright © 2009 Pearson Education, Inc. Publishing as Prentice Hall. 48
Objective 6Prepare the journal entries for a
manufacturer’s job costing system

Copyright © 2013 Pearson Education, Inc. Publishing as Prentice Hall.
Purchase of Raw Materials
• Raw Materials Inventory 90,000• Accounts Payable
90,000• (to record purchase of raw materials)
49

Copyright © 2013 Pearson Education, Inc. Publishing as Prentice Hall.
Use of Direct Materials
Work in Process Inventory 112,000Raw Materials Inventory
112,000(to record the use of direct materials on jobs)
50

Copyright © 2013 Pearson Education, Inc. Publishing as Prentice Hall.
Use of Indirect Materials
Manufacturing Overhead 2,000Raw Materials Inventory 2,000
(to record the use of indirect materials in the factory)
51

Copyright © 2013 Pearson Education, Inc. Publishing as Prentice Hall.
Use of Direct Labor
Work in Process Inventory 30,000Wages Payable
30,000(to record the use of direct labor on jobs)
52

Copyright © 2013 Pearson Education, Inc. Publishing as Prentice Hall.
Use of Indirect Labor
Manufacturing Overhead 13,000Wages Payable
13,000(to record the use of indirect labor in the factory)
53

Copyright © 2013 Pearson Education, Inc. Publishing as Prentice Hall.
Incurring Other MOH Costs
Manufacturing Overhead 10,000Accounts Payable (for electric bill) 3,000Accumulated Depreciation - Plant and Equipment 4,000Prepaid Plant Insurance (for expiration of prepaid insurance) 1,000Plant Property Taxes Payable (for taxes to be paid) 2,000
(to record other indirect manufacturing costs incurred during the month)
54

Copyright © 2013 Pearson Education, Inc. Publishing as Prentice Hall.
Allocating MOH to Jobs
Job 603: $16 per DL hour x 500 DL hours = $8,000Job 604: $16 per DL hour x 1,000 DL hours = $16,000
Work in Process Inventory ($8,000+$16,000) 24,000Manufacturing Overhead
24,000(to allocate manufacturing overhead to specific jobs)
55

Copyright © 2013 Pearson Education, Inc. Publishing as Prentice Hall.
Completion of Jobs
56
Job 604: Treadmills
Direct Materials $ 72,000
Direct Labor 20,000
Manufacturing Overhead 16,000
Total Job Cost $108,000
Number of Units ÷ 60
Cost per Unit $ 1,800
Finished Goods Inventory 166,000Work in Process Inventory 166,000
(to move the completed jobs out of the factory and intoFinished Goods)

Copyright © 2013 Pearson Education, Inc. Publishing as Prentice Hall.
Sale of Units
Accounts Receivable (40x$1,425)+(60x$2,500) 207,000Sales Revenue
207,000(to record the sale of 40 cross-trainers and 60 treadmills)
Cost of Goods Sold (40x$1,160)+(60x$1,800) 154,400Finished Goods Inventory
154,400(to reduce finished goods inventory and record CGS)
57

Copyright © 2013 Pearson Education, Inc. Publishing as Prentice Hall.
Operating Expenses
Salaries and Commission Expense 20,000Rent Expense 3,300Marketing Expenses 9,400
Salaries and Commissions Payable 20,000
Rent Payable 3,300
Accounts Payable 9,400
(to record all non-manufacturing costs incurred during the month)
58

Copyright © 2013 Pearson Education, Inc. Publishing as Prentice Hall.
Closing Manufacturing Overhead
Cost of Goods Sold 1,000Manufacturing Overhead 1,000
(to close the manufacturing overhead account)
59

Copyright © 2013 Pearson Education, Inc. Publishing as Prentice Hall.
Income Statement, Exhibit 3-18Life Fitness
Income StatementDecember 31
Sales Revenue $207,000
Less: Cost of Goods Sold 155,400
Gross Profit 51,600
Less: Operating Expenses 32,700
Operating Income $ 18,900
60

Copyright © 2013 Pearson Education, Inc. Publishing as Prentice Hall. Copyright © 2009 Pearson Education, Inc. Publishing as Prentice Hall. 61
Objective 7(Appendix) Use job costing at
a service firm as a basis for billing clients

Copyright © 2013 Pearson Education, Inc. Publishing as Prentice Hall. 62
Job Costing at a Service Firm
• Similar to job costing at a manufacturer
• Main difference is that company is allocated indirect period costs to each client rather than manufacturing costs
• Since no inventory, no journal entries necessary

Copyright © 2013 Pearson Education, Inc. Publishing as Prentice Hall. Copyright © 2009 Pearson Education, Inc. Publishing as Prentice Hall.
End of Chapter 3
63