Embed Size (px)
Citation preview
Copyright 2013 John Wiley & Sons, Inc.
Chapter 4
Process Improvement: Minimizing Variation Through Six Sigma
4-2
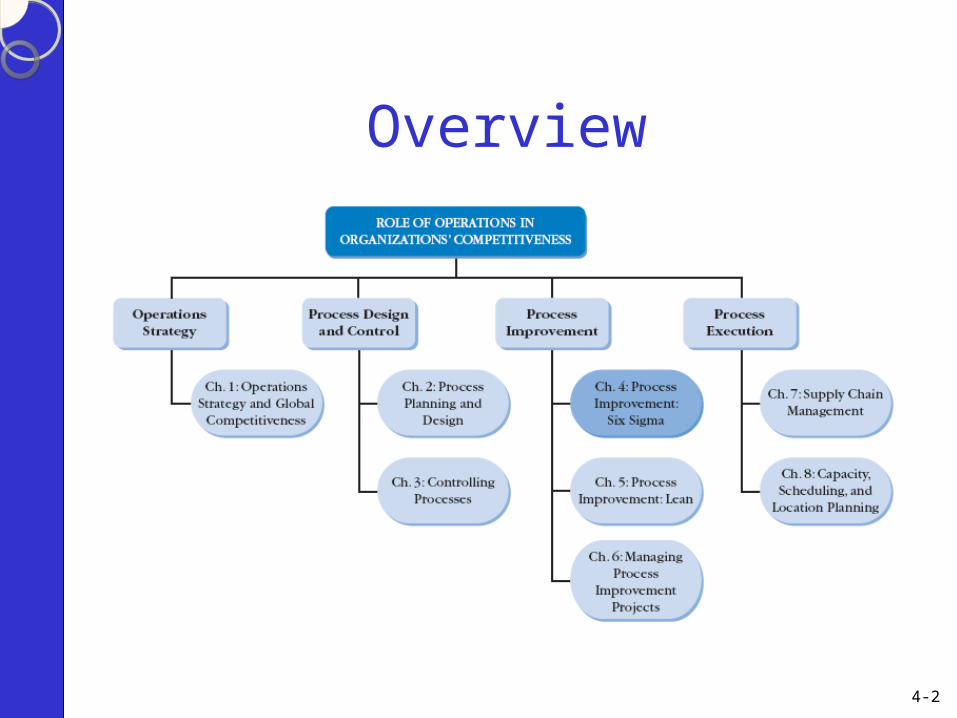
Overview

4-3
Hewitt Associates
• Hewitt Associates provides HR outsourcing services
• Customer service (CS) representatives are frontline employees delivering the outsourced HR services
• CS reps need substantial training• Key challenge was close to 100 percent
turnover
4-4
Hewitt Associates (Continued)
• Hewitt initiated a Six Sigma project to address turnover– DMAIC methodology and multiple Six Sigma tools
• Determined they needed to quantify cost of turnover– Costing $14.5 million annually
• Further analysis identified key factors:– Opportunities for growth, pay, recognition, work activities,
management
• Pay was found to be key• Increasing pay cost $600,000 but saved $1.9 million
4-5
Introduction
• Six Sigma is applicable to a wide variety of organizations
• Six Sigma can yield significant gains by improving processes
• Six Sigma improvements translate directly into helping organization become more competitive
• People with a background in Six Sigma are in high demand
4-6
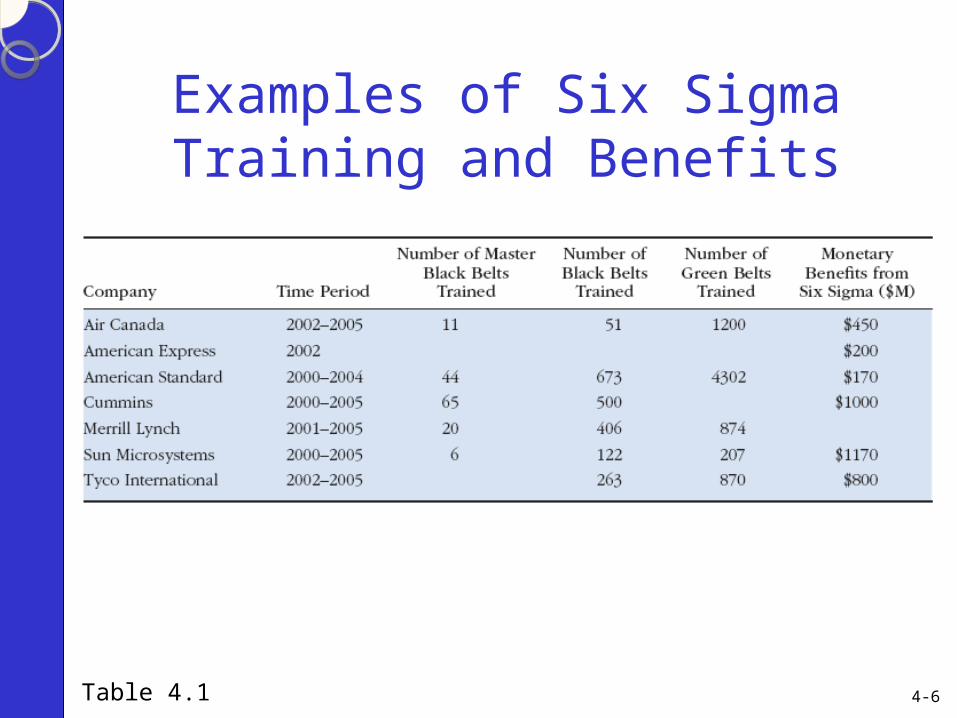
Examples of Six Sigma Training and Benefits
Table 4.1
4-7
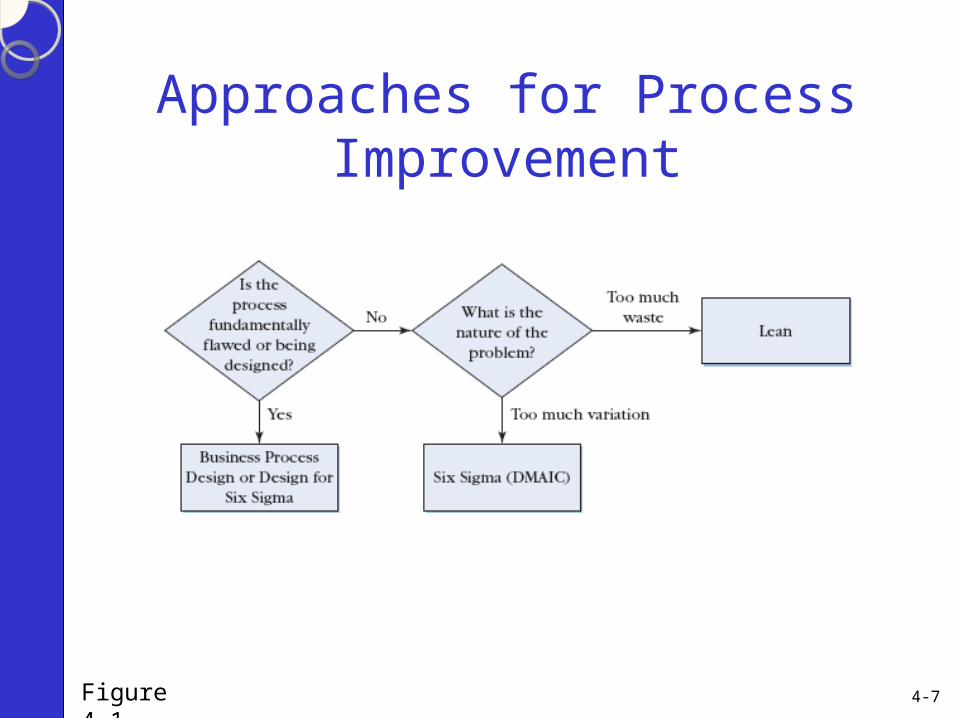
Approaches for Process Improvement
Figure 4.1
4-8
Business Process Design (Reengineering)
• Appropriate strategy for processes that require improvements beyond incremental enhancements
• Also useful in new processes• Often needed when there is a major
advance in technology or customer requirements
• Often called reengineering
4-9
BPD Themes
• Primary objective is improved customer service
• A concern with making quantum improvements in performance
• The central role of technology
4-10
BPD Keywords
• Radical
• Redesign
• Process
• Dramatic
Slide on each of these
4-11
Radical
• Profoundly change the way work performed
• Not concerned with making superficial changes
• Get to root
• Get rid of old
• Reinventing, not improving
4-12
Redesign
• BPD is about designing how work is done
• The way work is accomplished can be designed
• Smart, capable, well trained, highly motivated employees mean little if the way work is performed is poorly designed
4-13
Process
• All organizations perform processes
• Customers not interested in individual activities but rather overall results
• Few of them are organized on the basis of processes
• Thus, processes tend to go unmanaged
• Team approach one way this addressed
4-14
Dramatic
• Quantum leaps in performance
• Not marginal or incremental improvements
• Breakthroughs in performance
4-15
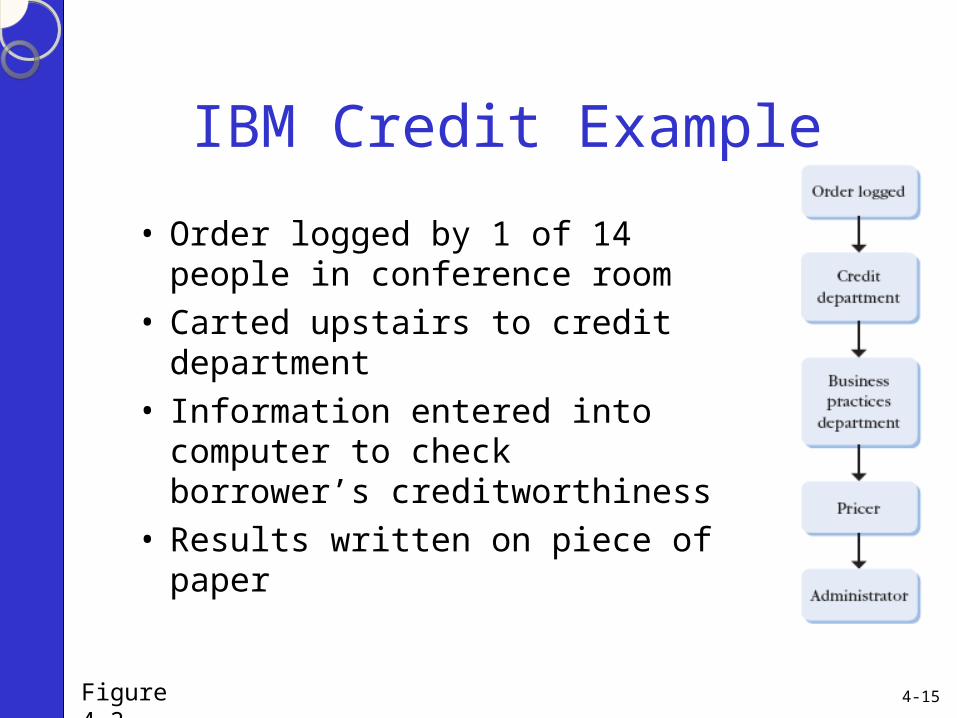
IBM Credit Example
• Order logged by 1 of 14 people in conference room
• Carted upstairs to credit department• Information entered into computer
to check borrower’s creditworthiness
• Results written on piece of paper
Figure 4.2

4-16
IBM Credit Example (Continued)
• Business practices department modified standard loan covenant in response to customer requests
• Used its own computer system• Pricing department keyed data into PC
to determine appropriate interest rate• Administrator produced a quote letter
for field sales rep

4-17
IBM Credit Example (Continued)
• Average time to process a request was six days • Could take as long as two weeks• Actual processing time 90 minutes• Combined all steps into one job called a deal
structurer– Turnaround time reduced to four hours
– Number of deals processed increased 100 times with small reduction in head count

4-18
Six Sigma and the DMAIC Improvement Process
• The Six Sigma concept was developed by Bill Smith, a senior engineer at Motorola, in 1986 as a way to standardize the way defects were tallied
• Sigma is the Greek symbol used in statistics to refer to standard deviation which is a measure of variation
• Adding “six” to “sigma” combines a measure of process performance (sigma) with the goal of nearly perfect quality (six)
4-19
Six Sigma Defined
A comprehensive and flexible system for achieving, sustaining and maximizing business success. Six Sigma is uniquely driven by close understanding of customer needs, disciplined use of facts, data, and statistical analysis, and diligent attention to managing, improving, and reinventing business processes
4-20
The Six Sigma DMAIC Approach for Process Improvement
• Define
• Measure
• Analyze
• Improve
• Control
Slide on each of these
4-21
Define (the Following…)
• Goals for process improvement
• The customer
• Project scope
• The problem/opportunity
4-22
Measure
• Identify appropriate performance measures
• Collect data
• Evaluate current process performance
4-23
Analyze and Improve
• Analyze– Develop and test theories related to root
causes of problems– Identify cause-and-effect relationships
• Improve– Develop, evaluate, and implement solutions
to reduce gap between desired process performance and current performance
4-24
Control
• Monitor process to sustain improved performance
• Ensure that problems do not resurface
4-25
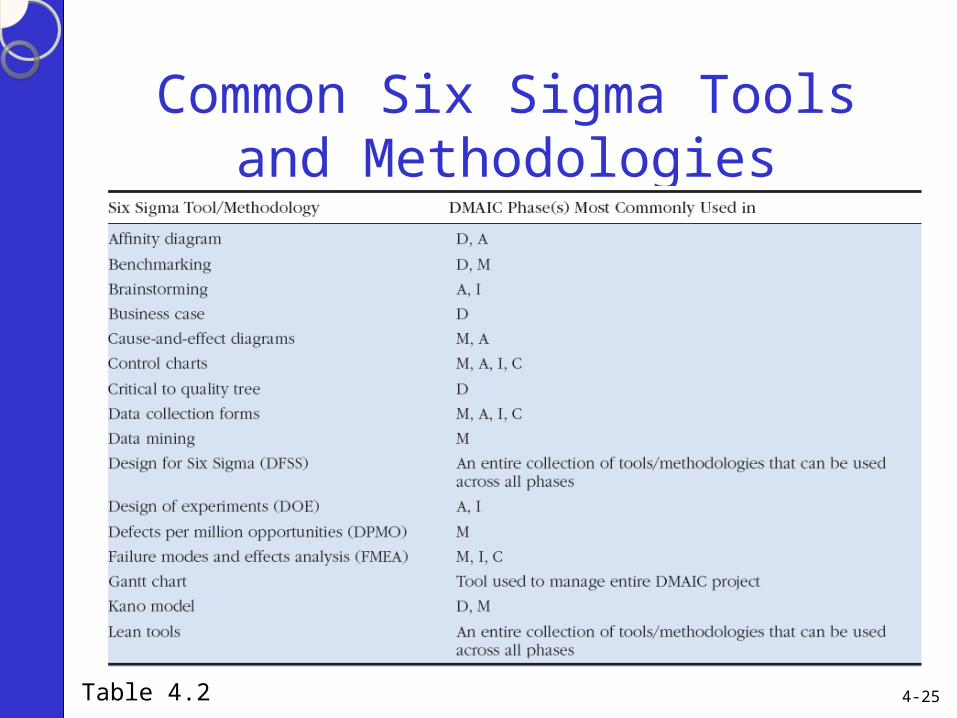
Common Six Sigma Tools and Methodologies
Table 4.2

4-26
Common Six Sigma Tools and Methodologies (Continued)
Table 4.2 Continued

4-27
The Define Phase
• Clearly specifying the problem or goal• Determining the goals for the process
improvement project• Identifying the scope of the project• Identifying the customers and their
requirements• Two common tools in this phase:
1. Benchmarking2. Quality function deployment (QFD)
4-28
Benchmarking
• Benchmarking involves comparing an organization's processes with best practices
• Used for a variety of purposes:– Comparing an organization's processes with the
best– Comparing an organization's products and services
with those of other organizations– Identifying the best practices– Projecting trends in order to be able to respond
proactively

4-29
Quality Function Deployment (QFD)
• Two key drivers of an organization’s long-term competitive success are the extent to which its new products or services meet customers’ needs, and having the organizational capabilities to develop and deliver such new products and services
• Tools for helping translate customer desires directly into product service attributes
4-30
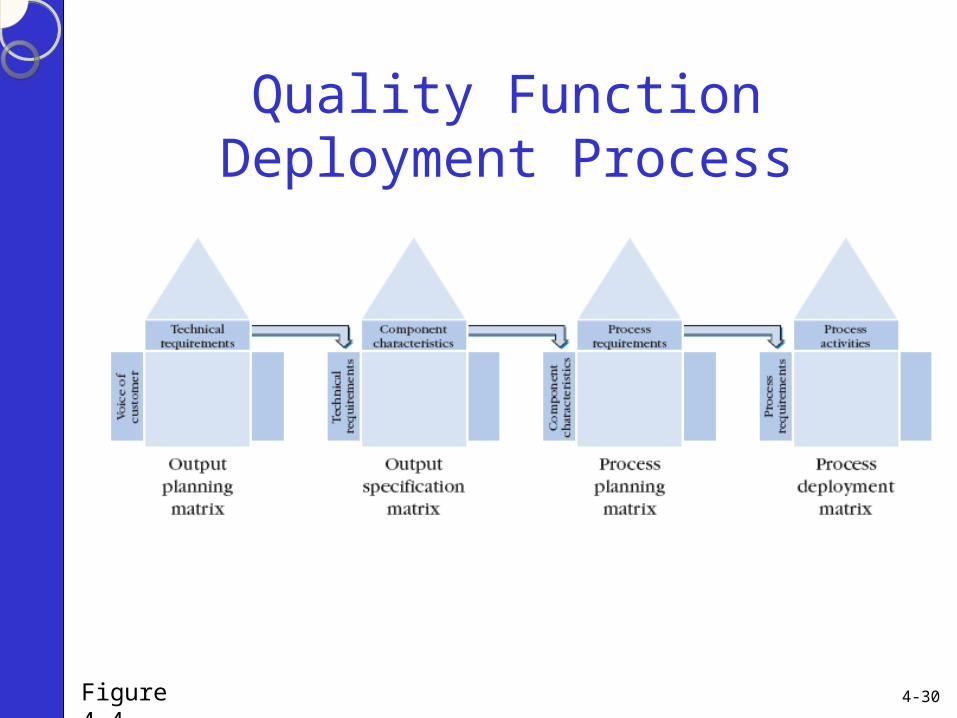
Quality Function Deployment Process
Figure 4.4
4-31
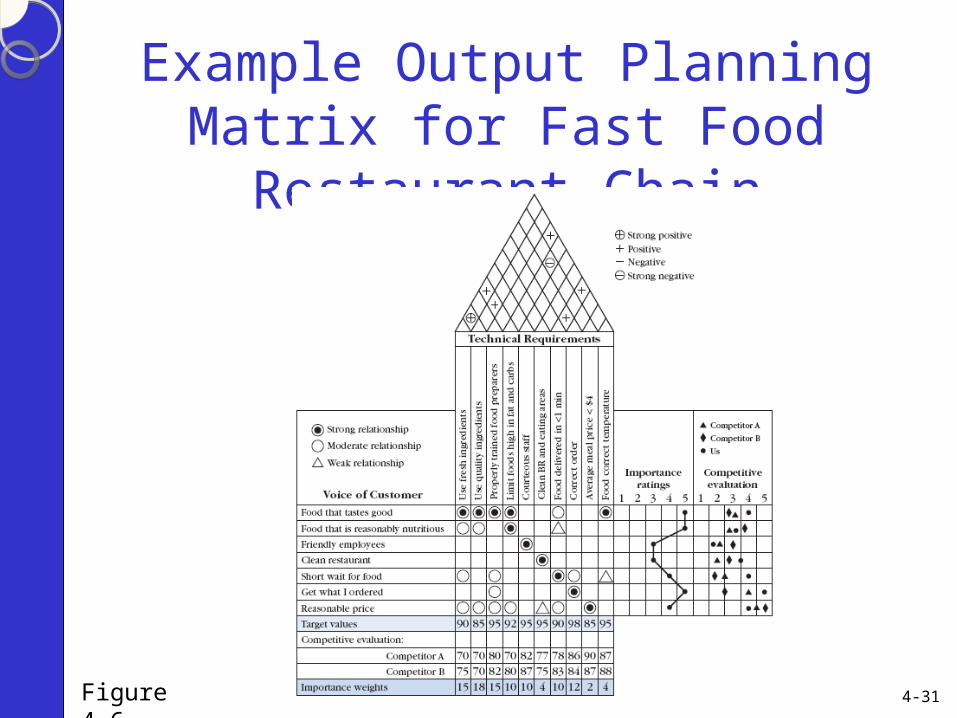
Example Output Planning Matrix for Fast Food Restaurant Chain
Figure 4.6
4-32
The Measure Phase
• The measure phase begins with the identification of the key process performance metrics
• Once the key process performance metrics have been specified, related process and customer data is collected
• Two commonly used process performance measures, namely, Defects per Million Opportunities (DPMO) and Process Sigma
4-33
Defects Per Million Opportunities
• Earlier it was noted that a literal interpretation of Six Sigma is 3.4 defects per million opportunities (DPMO)
• This may have caused some confusion for more statistically inclined readers
• Motorola assumed that the means of the process can shift
4-34
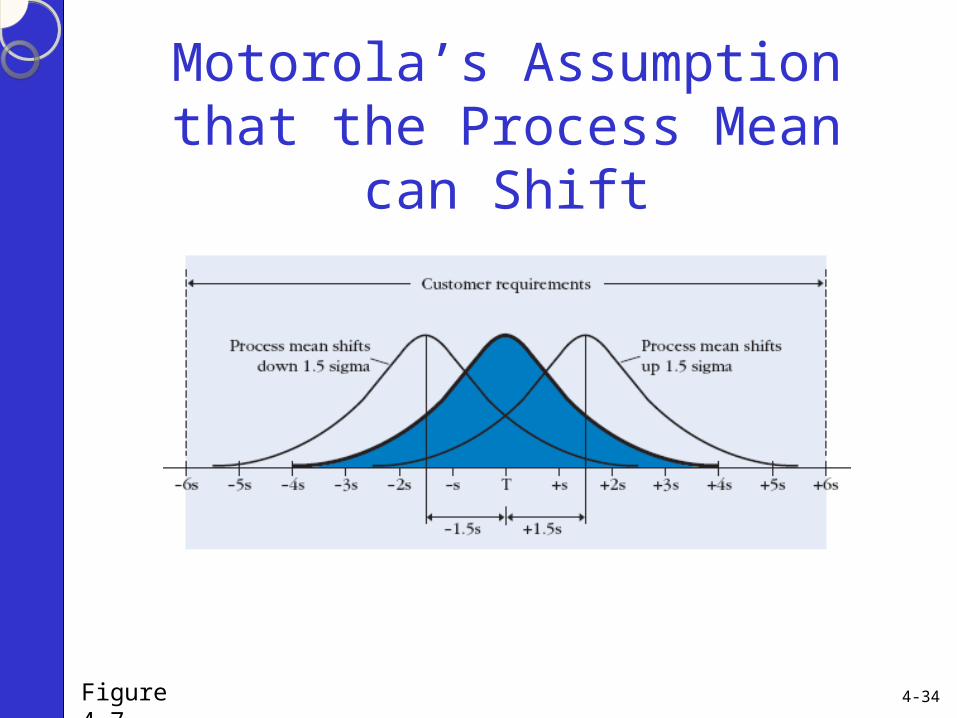
Motorola’s Assumption that the Process Mean can Shift
Figure 4.7

4-35
Process Sigma
• Sigma corresponds to a measure of process performance
• Sigma itself can be used to measure the performance of a process
• One way to measure the performance of a process is to calculate the number of standard deviations the customer requirements are from the process mean or target value
4-36
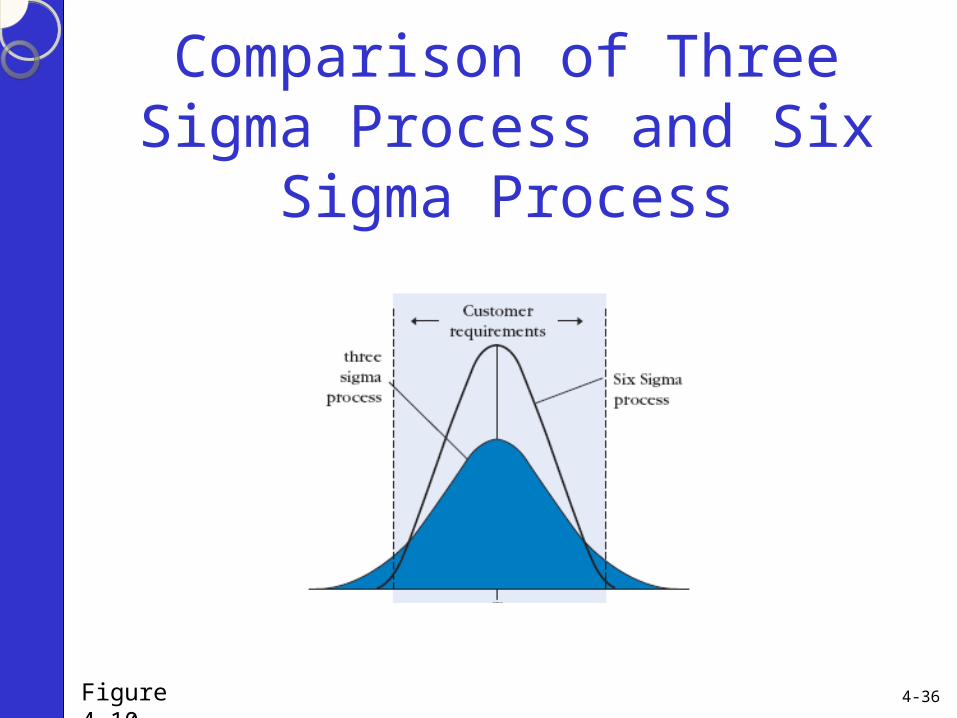
Comparison of Three Sigma Process and Six Sigma Process
Figure 4.10

4-37
DPMO for Alternative Process Sigma Levels
Table 4.3
4-38
Measurement System Analysis
• Measures of variation may not accurately reflect the two variation
• Measure errors may introduce another source of variation– σ2
T = σ2p + σ2
m
• Measurement error can be broken down into repeatability and reproducibility– σ2
m = σ2e + σ2
o
• Measurement systems analysis looks at variation introduced by measurement
4-39
Measurements to Access Impact Measurement has on Mean
1. Bias– The difference between the average of a
number of observations and the true value
2. Linearity– The accuracy of the measurement system
across the entire range of possible values
3. Stability– Ability to get consistent results over time
4-40
The Analyze Phase
• Objective is to utilize the data that has been collected to develop and test theories related to the root causes of existing gaps between the process’ current performance and its desired performance
• Ultimately, wish to identify key cause-and-effect relationships that can be leveraged to improve the overall performance of the process
4-41
Tools
• There are a number of tools that are useful in the analysis phase
• The three biggest are:1. Brainstorming
2. Cause-and-effect diagrams
3. Process capability analysis
Slide on each of these

4-42
Brainstorming
1. Do not criticize ideas during the brainstorming session
2. Express all ideas no matter how radical, bizarre, unconventional, ridiculous, or impractical they may seem
3. Generate as many ideas as possible
4. Combine, extend, and/or improve on one another’s ideas
4-43
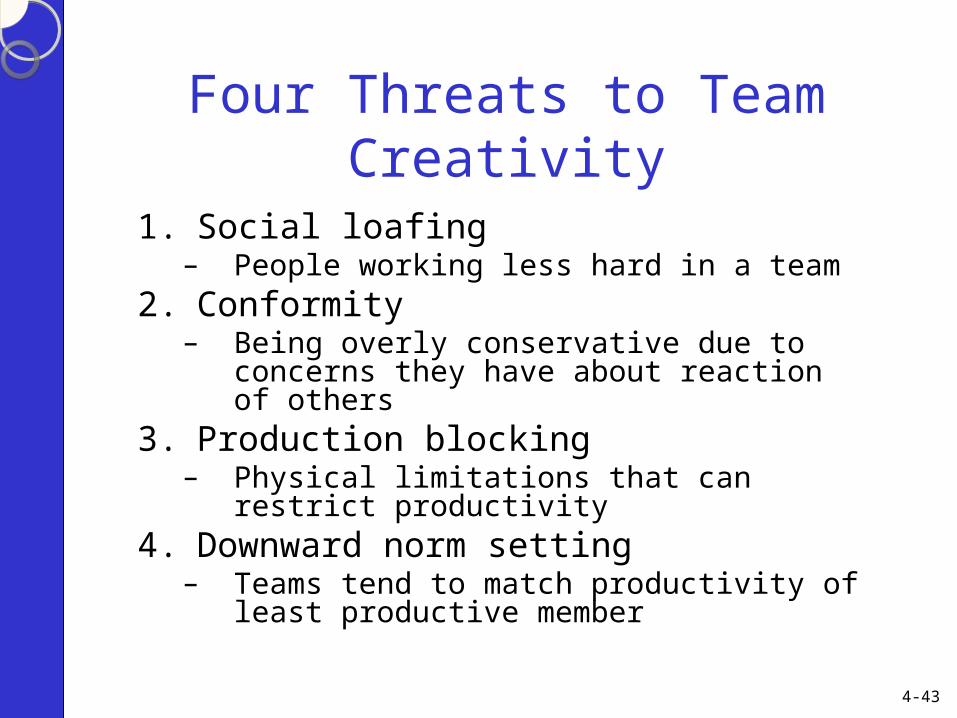
Four Threats to Team Creativity
1. Social loafing– People working less hard in a team
2. Conformity– Being overly conservative due to concerns they
have about reaction of others3. Production blocking
– Physical limitations that can restrict productivity4. Downward norm setting
– Teams tend to match productivity of least productive member

4-44
Actions to Enhance Team Creativity
• Create diversified teams
• Use analogical reasoning
• Use brainwriting
• Use the nominal group technique
• Record team ideas
4-45
Actions to Enhance Team Creativity (Continued)
• Use trained facilitators to run the brainstorming session
• Set high standards
• Change the composition of the team
• Use electronic brainstorming
• Make the workplace a playground
4-46
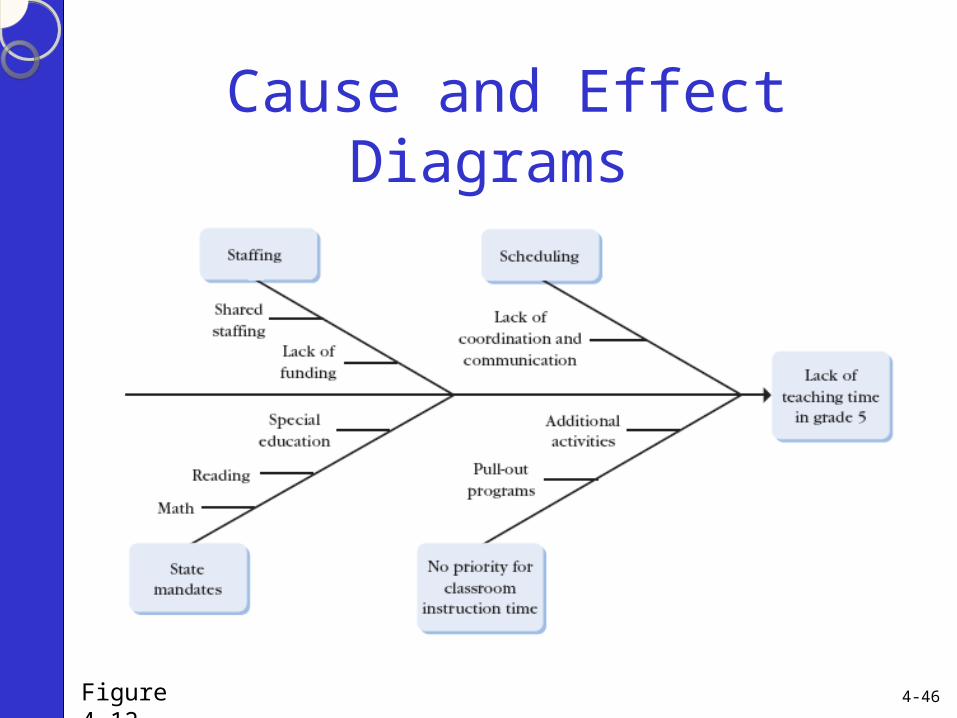
Cause and Effect Diagrams
Figure 4.12
4-47
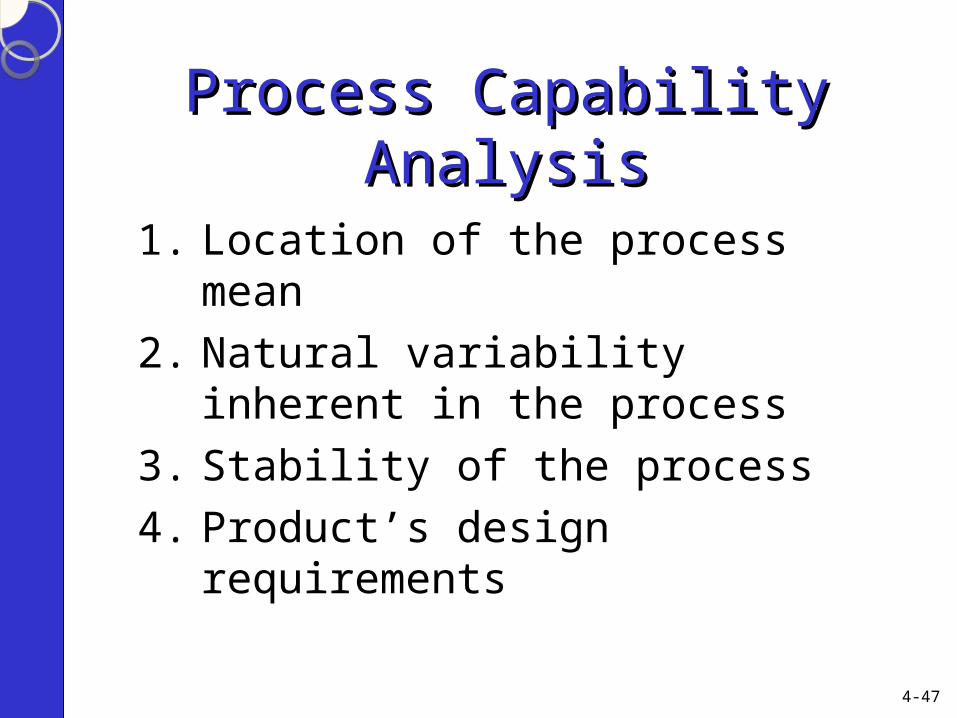
Process Capability AnalysisProcess Capability Analysis
1. Location of the process mean
2. Natural variability inherent in the process
3. Stability of the process
4. Product’s design requirements

4-48
Natural Variation in a Production System Versus Specifications
A. Well matched
B. Natural variation greater than design requirements
C. Wider design specifications than natural variation
D. Means out of sync
Figure 4.13
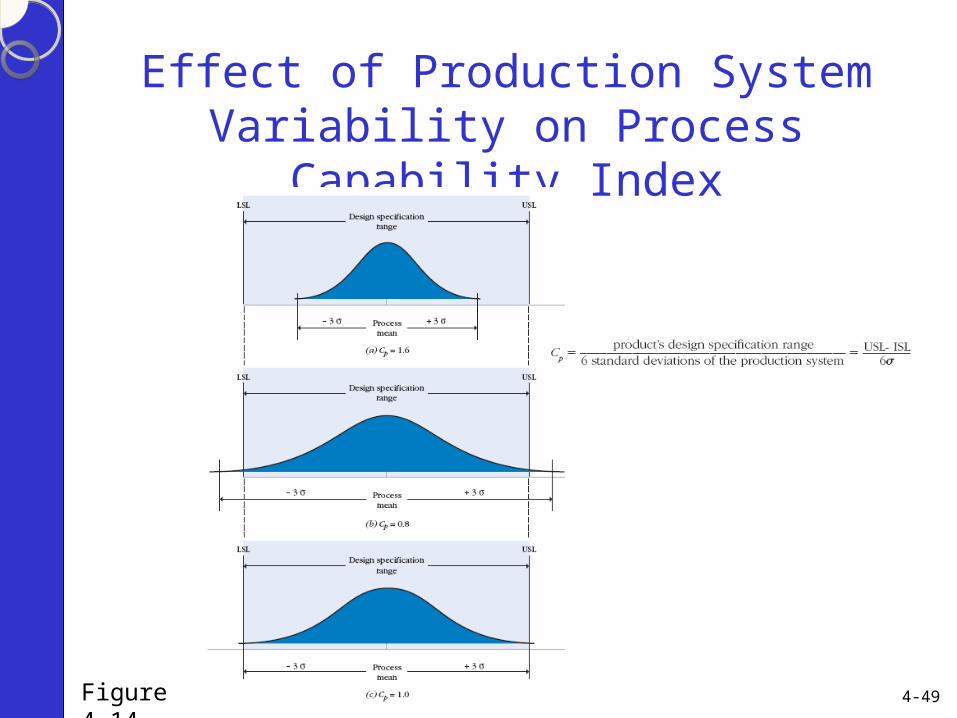
4-49
Effect of Production System Variability on Process Capability Index
Figure 4.14
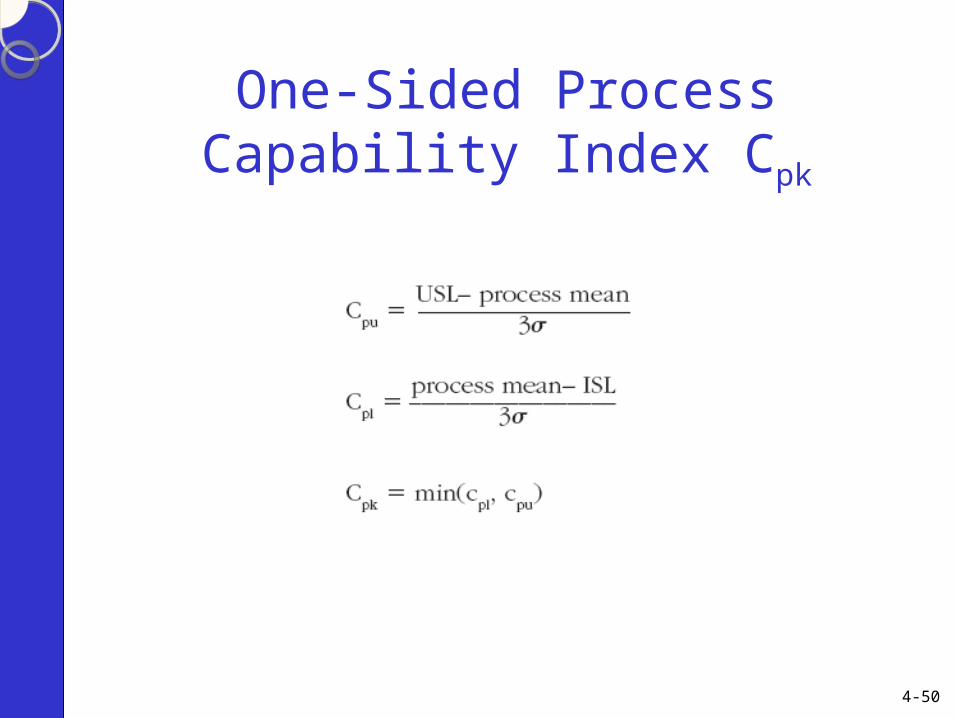
4-50
One-Sided Process Capability Index Cpk
4-51
The Improvement Phase
• First define the problem• Next, measure the current performance• Then, analyze the process• Now, identify and test options for
improving the process• Will focus on the use of design of
experiments (DOE) as an improvement tool
4-52
Design of Experiments (DOE)
• Common approach is to analyze one factor at a time (OFAT or 1FAT)
• This suffers from several important shortcomings:– Not typically possible to test one factor at a time
and hold all the other factors constant.– Not possible to account for interactions or joint
variation between variables• One approach for overcoming shortcomings is
to use design of experiments (DOE) techniques

4-53
Major Considerations Associated with DOE
• Determining which factors to include in the experiment
• Specifying the levels for each factor
• Determining how much data to collect
• Determining the type of experimental design

4-54
Six Sigma Roles
• Master black belts– Combine an advanced knowledge of Six Sigma
tools with deep understanding of business• Black belts
– Solid background in the Six Sigma tools– Training and leading improvement projects
• Green belts– Less knowledge than black belts
• Yellow belts– Completed awareness training