Embed Size (px)
Citation preview

© Copyr i gh t 2012 OSIso f t , LLC. 1

Presented by
© Copyr i gh t 2012 OSIso f t , LLC.
Requirements & Benefits of an
Energy Management System in the
Chemical Industry
Dr. Gerhard Then

© Copyr i gh t 2012 OSIso f t , LLC.
Abstract• Energy performance in the chemical industry has a long history and much has been
achieved over the last 20 years. However there is still enough potential in reducing the specific energy intensity of chemical production processes. We describe an Energy Efficiency Management System which is applicable to all asset intense industry.
• This system links the current energy consumption to the energy optimum of the existing process and finally to the theoretical energy optimum. It is a real energy management system from shop floor to board and the only system commercially available having the vision what is achievable by aiming for the theoretical energy optimum.
• This System has been developed by Bayer MaterialScience and is being introduced in more than 60 of our most energy intense units globally. The data collection and processing on a central server will be explained. By end of 2011 we have achieved about 200 000 tons of CO2 reductions, 600 GWh energy (electricity steam and natural gas) savings and more than € 35 million through increasing the energy performance of our processes.
• Detailed technical examples will be given. With this system Bayer MaterialScienceachieved the DIN 16001 certification.
3

© Copyr i gh t 2012 OSIso f t , LLC.
Agenda
�Key Figures Bayer and Bayer MaterialScience
�Requirements of an Energy Efficiency Management System
�STRUCTese™ – an Energy Management System
�Examples
�Summary
4

© Copyr i gh t 2012 OSIso f t , LLC.
Bayer – A leader in its markets
5
29.7%
19.9%
47.0%
3.4%
Sales 2011: €36.5bn
CropScience (BCS)Agrochemicals and seeds & traits, global #2 in agrochemicals
MaterialScience (BMS)Polyurethanes and polycarbonates,global #1 or 2
HealthCare (BHC)Pharmaceuticals,leading positions in key categoriesConsumer Health, OTC products,blood glucose meters and veterinary medicines, global #2-4
Corporate Center, Service Companies

© Copyr i gh t 2012 OSIso f t , LLC.
Bayer MaterialScience links oil and petro-chemicals to key consumer markets
i.e. benzene, toluene,
phenol , acetone, …
Petro-chemicals
i.e. salt, energy,…Other input
+
Electrical /Electronics /IT
Furniture /Wood
Automotive / Transport
Construction
Chemicals
Carpenter
BMS’ core products and solutionsi.e. polyurethane rigid (MDI) and flexible foams (T DI), polycarbonate (PCS) granules, sheets and films, raw materials for coatings and adhesives (CAS), ….
6
© Copyr i gh t 2012 OSIso f t , LLC.
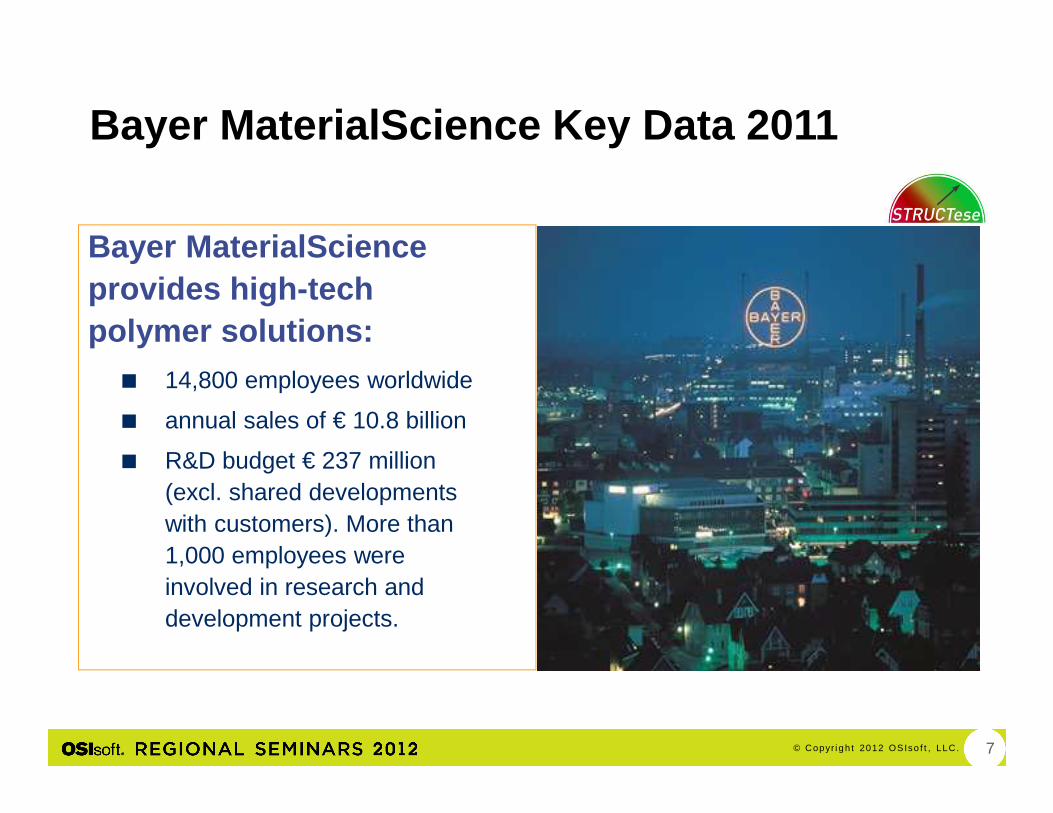
Bayer MaterialScience Key Data 2011
Bayer MaterialScience provides high-tech polymer solutions:
7
� 14,800 employees worldwide
� annual sales of € 10.8 billion
� R&D budget € 237 million(excl. shared developments with customers). More than 1,000 employees were involved in research and development projects.

© Copyr i gh t 2012 OSIso f t , LLC.
�Key Figures Bayer and Bayer MaterialScience
�Requirements of an Energy Efficiency Management System
�STRUCTese™ – an Energy Management System
�Examples
�Summary
Agenda
8

© Copyr i gh t 2012 OSIso f t , LLC.
Bayer‘s annual energy use is ~ 24 TWh , 2/3 of it at BMS
BMS
Steam purchase
1%
Electricity purchase
29%
Primary energy conversion
60%
Recycle Heat from flash steam
10%
Primary Energy Use 14.3 TWh*
Total Energy Use 24 TWh*
� BMS has reduced its direct and indirect GHG emissions by 37% between 1990 and 2007
� Annual R&D budget € 85 Million improving climate relevant production technologies and products
� BMS has invested € 620 Million in in optimized technologies and Infrastructure between 2008 and 2010
� Most of the electricity and steam is co-generated in highly efficient CHP unit and waste incineration is utilized
* Source: Bayer Sustainability Report 2010
Bayer
Bayer
Other, e. g H2
4%Coke 34%
Natural Gas62%
9

© Copyr i gh t 2012 OSIso f t , LLC.
Energy management is key to sustainable savings
Technology
Solutions Management
Energy-Efficiency
� EcoCommercialBuilding
� Light Materials� Insulations*
� Monitoring� Reporting� Benchmarking
� Gas phase phosgenation� Oxygen Depletion Cathode� Combined Heat and Power
Aktueller Verbrauch
Sub-optimaler Betrieb
…TeillastSub-optimales Equipment
Perfekter Betrieb (bester
Prozess) Verlust-Kategorien
Three Dimensions of Energy Savings
* PUR insulation saves 60x the energy used to produce it
10

© Copyr i gh t 2012 OSIso f t , LLC.
Agenda
�Key Figures Bayer and Bayer MaterialScience
�Requirements of an Energy Efficiency Management System
�STRUCTese™ – an Energy Management System
�Examples
�Summary
11

© Copyr i gh t 2012 OSIso f t , LLC.
Closing the awareness gap is a challenge for chemical companies
Maximum implementation speed Lost potential
Initiative 1 Initiative 2Initiative 3
� Individual energy savings initiatives cannot sustai n high awareness level over time
� Total savings fall short of maximum potential, past lapses cannot be compensated for
Best possible energy consumption
Time
Specific energy consumption
Implement an Energy Efficiency Management system
Awareness Gap
12

© Copyr i gh t 2012 OSIso f t , LLC.
Goal
Increase the energy performance by at least 10% in about 70 chemical production
units by implementing a sustainable Energy Efficiency Management System
(as opposed to only energy monitoring and some graphical output)
13

© Copyr i gh t 2012 OSIso f t , LLC.
How do you build a global, sustainableBMS Energy Management System ?
BelgienANTWERPEN
SpanienTARRAGONA
China
CAOJING
ThailandMAP TA PHUT
DORMAGEN UERDINGEN LEVERKUSEN
BRUNSBÜTTEL
TotalMaterialScience
600BAYER
RZF, FIL, NMV,NEW, SCH
Other SitesBrasilienBELFORD ROXO
USABAYTOWN Japan
NIIHAMA
9
3
15
5
3
100
25
10
4
6
20Energy costsin Mio € (approx.)
Number ofChemical Plants
14

© Copyr i gh t 2012 OSIso f t , LLC.
STRUCTese™ applies a three step approach to realize energy saving and energy conscious behavior
1
3
2
Energy-Efficiency Check &
Improvement Plan
Energy Loss Cascade &
Performance Indicators
Online Monitoring &
Daily Energy Protocol
� Identification of saving potential
� Categorization of measures
� Implementation of measures
� Visualization of energy losses
� Reporting of losses and reasons
� Target setting
� Visualization of BDP deviations
� Energy optimal operation
� Implementation of awareness
Evaluation of the Potential following E²-Methology
17
18
1
11
1430
19
20
10
3
13
6
31
8
5
412 26
25
7
223
28
22
21
29
27
9
difficult easy
non-
prof
itabl
e
pr
ofita
ble
AC1
C2C3
Portfolio CategoriesA = feasible and profitable B = likely feasible and profitable, needs further evaluationC1 = technically (currently) not feasible but profitable C2 = technically feasible but not profitable C3 = technically not feasible & not profitable
SteamSteam B
ElectricityElectricity B
B-Measures areunderlined in addition
TEO PEO OEO CEC
Spe
cific
Con
sum
ptio
n C
O2
eq.
PE
/t
15

© Copyr i gh t 2012 OSIso f t , LLC.
The Energy Efficiency Check considers a wide range of optimization opportunities
Energy Efficiency Check
� is a systematic screening
� identifies measures for energy & CO2 emission reduction
� results in improvement suggestions
16

© Copyr i gh t 2012 OSIso f t , LLC.
All improvement ideas are evaluated and prioritized
All improvement ideas are evaluated with regard to�Technical feasibility �Savings potential (CO2e and costs)�Costs for implementation (rough estimate)�Profitability (rough estimate)
and displayed in a portfolio:
CategoriesA = feasible and profitable B = likely feasible and profitable,
needs further evaluationC1 = technically difficult
but profitable C2 = technically feasible
but not profitable C3 = technically difficult
& not profitable
Steam
Electricity
Coolants
Gases
Bubble Size = Savings Potential
Profitability
3 years ROI
difficult easy
notprofitable
profitable
AC1
C3 C2
Technical Feasibility
B
17

© Copyr i gh t 2012 OSIso f t , LLC.
STRUCTese™ Energy-Loss Cascade links current energy consumption to the true minimum
Current Consumption
Operational Optimum
Plant Optimum
Perfect unit
Spe
c. C
onsu
mpt
ion
kWh
PE
/ tP
rodc
t
Strategic decision Improvement Measures (Investment)
Operational Parameters(Online Monitoring)
Measured consumption
Ideally operatedIdeally rebuiltIdeal
process
Static Losses Dynamic Losses
� In total 10 different energy loss categories � (Monthly) calculation creates transparency for oper ations and management� Loss cascade demystifies energy consumption
18

© Copyr i gh t 2012 OSIso f t , LLC.
Global BMS Energy Management
BelgienANTWERPEN
SpanienTARRAGONA
China
CAOJING
ThailandMAP TA PHUT
DORMAGEN UERDINGEN LEVERKUSEN
BRUNSBÜTTEL
RZF, FIL, NMV,NEW, SCH
Other SitesBrasilienBELFORD ROXO
USABAYTOWN Japan
NIIHAMA
Energy costsin Mio € (approx.)
Number ofChemical Plants
9
3
15
5
3
25
10
4
6
20
TotalMaterialScience
600BAYER
100
Central E2-server and data base19

© Copyr i gh t 2012 OSIso f t , LLC.
A 3-stage server architecture guarantees globally consistent data and models
Glamour Data BaseGlamour Data Base
PI - data
Daily averages
Load, CEC, Fouling, etc.
CEC,PM,PL,DT,OP,LS
E²: PI - Server
E²-Tool
PI – Performance Equations
General calculations
Cascade modules
Local PI ServerLocal PI Server
20

© Copyr i gh t 2012 OSIso f t , LLC.
Global data are collected on a central server• E2 data and process flow
Validation
Currenta energy
data
General energy
data (globally)
Process- and energy data
Announcing demand for processed energy data
Processed energy dataGlamour database
PI Processbook
Central E2-server and data base� Ecomon-Server� Processing plant and user data� Processing energy data� List of projects� Data Validation and storage� Trouble shooting� Cascade generation
SharePoint Server
Approve cascade
PI Processbook
Approved cascade
Plant and user master data
IntranetE2 Glamour
Production and energy
data
21

© Copyr i gh t 2012 OSIso f t , LLC.
Modular concept and functional structure
Kaskaden
darstellung
Glamour Datenbank
Currenta Energiedaten
allgeeine Energie-
Daten(weltweit)
Betriebs PI-Server
Validierung
Microsoft OfficeSharePoint Server
Web-Portal
Prozess- / Energiedaten
Evtl aufbereitete Energiedaten
Stammdaten: Benutzer
Stammdaten: Betrieb
Freigegebene Kaskadendaten
SQL-
DB
PI
-Interface
PI-
Server
PI-D
B-
Interface
Holen
PIProcessbook Kaskade freigeben
GlamourProduktions-
daten incl.Energiedaten
Excel
Emailor
FTP
EcoMon-and
E2-Server
Datenablage
Kaskadenerstellung
Aufbereitung der Energiedaten
Projektliste
Fehlerhandling
Validierung Ein-/Ausgangsdaten
Umsetzung Stammdaten
Kaskaden-daten E2-Glamour
PIProcessbook
22

© Copyr i gh t 2012 OSIso f t , LLC.
Spe
cific
Ene
rgy
Con
sum
ptio
n[ t
Ste
am/ t
Pro
duct
]
% Load
Medium
�
�
�
�� �
�
�
�
�
�
�
�
�
�
��
�
�
�
�
�
�
��
� �
�
� �
�
�
��
�
�
� �
�
�
�
�
�
�
� �
�
�
�
�
�
��
�
�
� �
�
�
�
�
�
��
�
�
�
� ��
�
�
�
��
�
�
� �
�
�
�
�
�
��
�
��
� � �
�
�
��
�
�
��
�
��
� �
��
�
�
�
����
���
���� �
�
�� ��
� ����
��
�����
������
�� ��
�����
��
�� ��
��� �
�
���
�
��� �
��
�
��
�
��
�
�
��
�
���
�� ��
� ��
�� �
�
�� ��
�����
���
��� ��
��
� � ��
��
�������� �
�
�� ��
�� ������ �
���
��
�
�
�
��
�
�
�
40 60 80 100
BDP
Losses
Current LoadBDP, Targets
Online Monitor
Better understanding of plant performancethrough trending with PI Processbook
23

© Copyr i gh t 2012 OSIso f t , LLC.
The Energy Cascade as a management tool can be used for target setting and benchmarking
Objective:develop energy-efficiency-performance indicators
� Enable meaningful target setting for improvement of energy-efficiency at all organizational levels
� Enable energy-efficiency benchmarking for different technologies (companies?)
24
471
271
140100
PEO EL ESTEO CP IS IO OEO PM PL DT OP LS CEC

© Copyr i gh t 2012 OSIso f t , LLC.
PE2
TE2
DE2SE2
Performance Indicators are designed to focus on different management tasks
TE2: Theoretic Energy EfficiencyPE2: Plant Energy EfficiencySE2: Strategic Energy EfficiencyDE2: Design Energy Efficiency OE2: Operational Energy Efficiency
471
271
140100
PEO EL ESTEO CP IS IO OEO PM PL DT OP LS CEC
471
271
140100
PEO EL ESTEO CP IS IO OEO PM PL DT OP LS CEC
471
271
140100
PEO EL ESTEO CP IS IO OEO PM PL DT OP LS CEC
471
271
140100
PEO EL ESTEO CP IS IO OEO PM PL DT OP LS CEC
471
271
140100
PEO EL ESTEO CP IS IO OEO PM PL DT OP LS CEC
OE2
25

© Copyr i gh t 2012 OSIso f t , LLC.
Loss Cascade is complemented by Daily Energy Protocol and Online Monitoring
Daily EnergyProtocol
�Shows 24-hour average energy consumption of selected equipment compared with target level
�Unit supervision's tool to push for improvements in every morning meeting
�Example (plant A): daily use over two years led to 15% energy reduction without any investments
�Shows online energy consumption of selected equipment against best demonstrated practice consumption
�Operator's tool to influence energy usage�Example (plant B): operation of energy efficient
processes led to 12% energy reduction within two months without any investments
STRUCTese™
STRUCTese™
STRUCTese™
OnlineMonitoring
26

© Copyr i gh t 2012 OSIso f t , LLC.
STRUCTese™ is an integrated energy management system with tools for all levels of the organizatio n
STRUCTese™ PYRAMID
Frequency and ObjectiveTarget Group
• Annual review and target setting
• Shareholder reporting• Top management
• Monthly tracking• Production Head, Department Head
• Daily monitoring• Plant Manager
• Continuousoperation
• Operator/Supervisor
Targets
Specific reports(Daily Energy Protocol)
Online monitoring of energy consumption(Real-Time Monitoring)
Standard reports(Loss Cascade)
AppropriateSTRUCTese™
element
Core element of STRUCTese™
27

© Copyr i gh t 2012 OSIso f t , LLC.
BMS is certified having implemented the Energy Management System STRUCTese™
�STRUCTeseTM is the sole commercial EMS, linking the current energy consumption to the theoretical optimum
�STRUTeseTM shows the way to the true potential
28

© Copyr i gh t 2012 OSIso f t , LLC.
STRUCTese™® methodology enables the management to define the track ahead
BMS target for specific CO2 reduction until 2020 is 40%.
Actual consump-
tion
Suboptimal operation
…Partial load
Sub-optimal equipment
Perfect unit (best process)
Loss categories
Strategic
Operative
Ben
chm
arki
ng
Opt
imiz
atio
n
Targets
Specific reports*
(Daily Energy Protocol)
Online monitoring of energy consumption*
(Real-Time Monitoring)
Standard reports
(Loss Cascade)
The rear view mirror confirms your position
The energy cascades leads the path to go
Source: Web presence of view.stern.de-Fotocommunity and thinkware (www.itechnews.net)
Top-Down / Bottom-Up Target Setting
29

© Copyr i gh t 2012 OSIso f t , LLC.
Agenda
�Key Figures Bayer and Bayer MaterialScience
�Requirements of an Energy Efficiency Management System
�STRUCTese™ – an Energy Management System
�Examples
�Summary
30

© Copyr i gh t 2012 OSIso f t , LLC.
Energy Loss Cascade Software
31

© Copyr i gh t 2012 OSIso f t , LLC. 32
Software was developed with MEGLA GmbH and Bayer Technology Services

© Copyr i gh t 2012 OSIso f t , LLC.
Chlorine Production: Taking out 30% of energy
33
ODC* technology revolutionizes chlorine production by hydrochloricacid electrolysis
Advantages:� 30 % less electrical energy
� Closed chlorine recycling during isocyanate production
Annual capacity:� in Germany: 20,000 t chlorine� in China: 215,000 t chlorine
Annual CO2 reduction: 250,000t
* Oxygen depletion cathode

© Copyr i gh t 2012 OSIso f t , LLC.
TDI Production: Taking out energy and reducing emissions
Gas-phase phosgenation for TDI production based on the principle of the fuel cellAdvantages:
� 80 % less solvent
� Up to 60 % less energy
� 60,000 tons fewer CO2 emissions per world-scale plant of same size (250,000 t p.a.)
� 20 % lower investment costs
Annual capacity:
� China: 250,000 t TDI in 2011
� Europe: 300,000 t TDI in 2014
Annual CO2e Reduction: 250 000 t
34

© Copyr i gh t 2012 OSIso f t , LLC.
Nitric Acid Production: NOx emissions close to zero
� Nitric Acid production volume in Dormagen is 580 000 t/y
� NOx emissions reduced by 98 – 99% with EnviNOx® catalysis
� Reduction of 220.000 tons CO2e
� Corresponding to 100.000 cars with a 15 000 km p.a.
35

© Copyr i gh t 2012 OSIso f t , LLC.
Buildings: Toward zero emissions
EcoCommercial building
� Rigid polyurethane foam for high- andlow-temperature insulation
� Lightweight, stable and transparent polycarbonate sheets
� Components for durable, efficient photovoltaics
� Raw materials for low- and zero-VOC paints, coatings and adhesives
� Building a network of specialists
� 3 buildings: Dormagen (Germany), Pittsburgh (USA) and Greater Noida (India)
36

© Copyr i gh t 2012 OSIso f t , LLC.
Communication activities strengthenthe awareness for energy efficiency
37
E² poster campaign
■ The central theme is energy efficiency and how employees can contribute■ The posters inform about the BMS energy policy, climate goals, and the energy
management system E²■ 5 different motives to be published one after the other, every 3 months■ The posters will be published at all German sites in both, plants and offices

© Copyr i gh t 2012 OSIso f t , LLC.
A web based training was developed for all BMS AG employees.
38

© Copyr i gh t 2012 OSIso f t , LLC.
Agenda
�Key Figures Bayer and Bayer MaterialScience
�Requirements of an Energy Efficiency Management System
�STRUCTese™ – an Energy Management System
�Examples
�Summary
39

© Copyr i gh t 2012 OSIso f t , LLC.
Designed to Sustain Energy Excellence in BMS: Global Production Portfolio to Reach Long Term CO2 Reduction Targets
40
�45 BMS plants out of 60 are analyzed with STRUCTese™
�The 60 plants cover more than 85% of BMS’s total Energy Consumption
Identified Energy Savings:
A-Measures: 7 %, (economical and technical feasible)
B-Measures: 10 %, (Economics or technical feasibility challenging)
Identified CO 2e emissions Savings (A-Measures): ~ 350 000 t CO2e p.a.
Realized savings until 2011: - 175 000 t CO2 - 585 000 MWh
Results of STRUCTese™ ® in BMS’s Global Production World
� BMS committed itself to reduce the specific CO2 emissions by 40 %per metric ton sold product until 2020 (base year 2005)
� The Bayer Climate Check guarantees a systematic identification of Energy Efficiency improvement potentials visualized in an Energy and CO2 Savings portfolio
� STRUCTese™® as an Energy Management System focuses on the sustained realization of savings opportunities and links current consumption to the true minimum
� STRUCTese™® is established in the BMS Operational Excellence Processes and is going to be implemented globally at 60 production plants until end 2012

Brought to you by
© Copyr i gh t 2012 OSIso f t , LLC.