Embed Size (px)
Citation preview

Copyright © 2012, Oracle and/or its affiliates. All rights reserved. 1

Copyright © 2012, Oracle and/or its affiliates. All rights reserved. 2
A Day of Real World Performance
The Real-World Performance Group
Andrew Holdsworth, Tom Kyte, Graham Wood

Copyright © 2012, Oracle and/or its affiliates. All rights reserved. 3
Program Agenda
Introductions
Think Different
Coffee
Analyzing SQL
Lunch
OLTP Basics
Coffee
Set Based Programming Concepts
Running out of Memory

Copyright © 2012, Oracle and/or its affiliates. All rights reserved. 4
Introductions

Copyright © 2012, Oracle and/or its affiliates. All rights reserved. 5
Introductions
25 Years at Oracle
Vice President Real World Performance
– Good performance is rarely an accident
– Most people get the systems they deserve
– Good enough rarely is, aspire for excellence not good enough.
Andrew Holdsworth

Copyright © 2012, Oracle and/or its affiliates. All rights reserved. 6
Tom Kyte
Been with Oracle since 1993
User of Oracle since 1987
The “Tom” behind AskTom in Oracle
Magazine
www.oracle.com/oramag
Expert Oracle Database
Architecture
Effective Oracle by Design
Expert One on One Oracle
Beginning Oracle

Copyright © 2012, Oracle and/or its affiliates. All rights reserved. 7
Graham Wood
Architect
Server Technologies

Copyright © 2012, Oracle and/or its affiliates. All rights reserved. 8
Think Different ( About Performance !
Copyright © 2012, Oracle and/or its affiliates. All rights reserved. 9
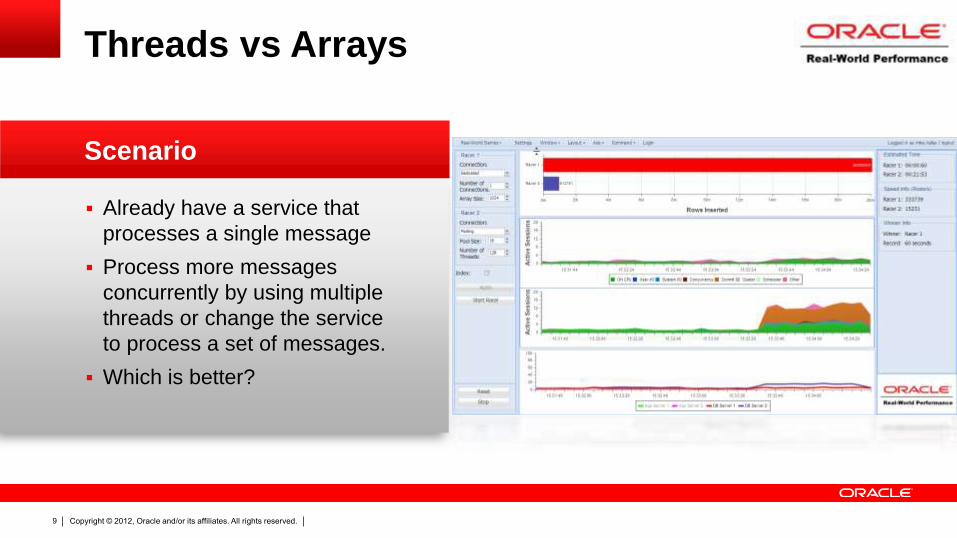
Already have a service that
processes a single message
Process more messages
concurrently by using multiple
threads or change the service
to process a set of messages.
Which is better?
Threads vs Arrays
Scenario

Copyright © 2012, Oracle and/or its affiliates. All rights reserved. 10
Not much of a contest
Array takes 1minute
Threads takes 22 minutes
With higher load on server
But still resource available
Larger pool size for threads?
Threads vs Arrays
Analysis
Copyright © 2012, Oracle and/or its affiliates. All rights reserved. 11
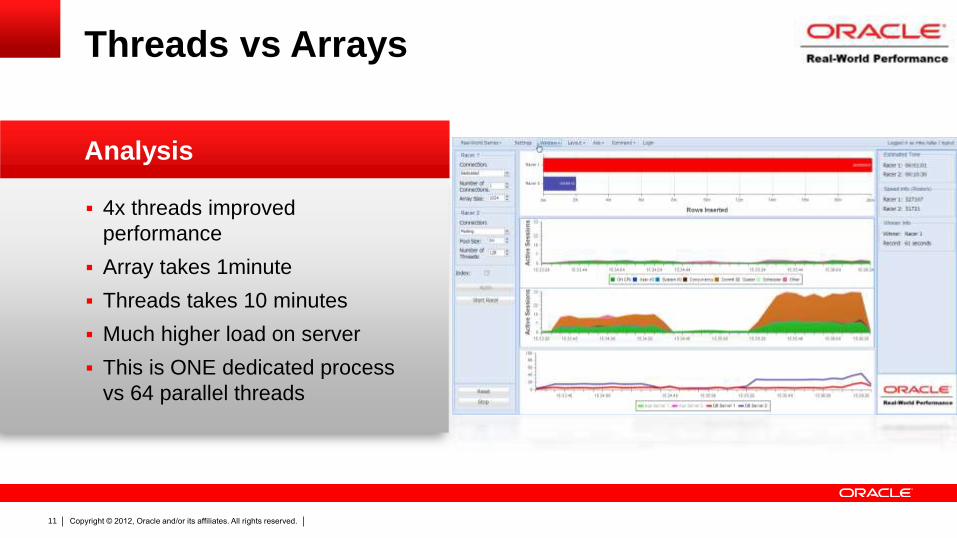
4x threads improved
performance
Array takes 1minute
Threads takes 10 minutes
Much higher load on server
This is ONE dedicated process
vs 64 parallel threads
Threads vs Arrays
Analysis

Copyright © 2012, Oracle and/or its affiliates. All rights reserved. 12
What happens when we add an
index to both systems?
Threads vs Arrays
Scenario

Copyright © 2012, Oracle and/or its affiliates. All rights reserved. 13
Both systems slowed by index
Multiple threads suffers from
contention, buffer busy wait, TX
index contention
Threads vs Arrays
Analysis

Copyright © 2012, Oracle and/or its affiliates. All rights reserved. 14
Index Contention Performance Data
Transaction rate: 4,500 TPS
Response time: 13 ms
Dominant wait events:
buffer busy waits and
enq:TX–index contention

Copyright © 2012, Oracle and/or its affiliates. All rights reserved. 15
Index Contention Reverse Key Index
Transaction rate: 10,000
TPS Response time: 5 ms
Contention eliminated while the
history table remains small.
CPU increases with workload.

Copyright © 2012, Oracle and/or its affiliates. All rights reserved. 16
Index Contention Reverse Key Index
Transaction rate: 3,000 TPS
Response time: 30 ms
Contention shifts to I/O
subsystem when the history
table grows larger

Copyright © 2012, Oracle and/or its affiliates. All rights reserved. 17
Index Contention Hash Partition Index
Transaction rate: 10,000 TPS
Response time: 5 ms
Contention eliminated by hash
partitioned history table index

Copyright © 2012, Oracle and/or its affiliates. All rights reserved. 18
Index Contention Add RAC node
Transaction rate: 13,000 TPS
Response time: 10 ms
RAC appears not to scale well
with contention in cluster waits

Copyright © 2012, Oracle and/or its affiliates. All rights reserved. 19
Index Contention Composite Key Index
Transaction rate: 20,000 TPS
Response time: 5 ms
RAC configuration scales well
with no contention or gc waits

Copyright © 2012, Oracle and/or its affiliates. All rights reserved. 20
Devices ship files.
Files read and processed by
multiple application servers
Each application server uses
multiple threads that connect to
database through a connection
pool which is distributed by a
scan listener over two
instances.
Is Load Balancing Slowing Your System? Scenario

Copyright © 2012, Oracle and/or its affiliates. All rights reserved. 21
It’s too slow
It’s a problem with the database
– Look at all those waits
Need to be able to process an
order of magnitude more data
Obviously need to move to
Hadoop
Is Load Balancing Slowing Your System? Problem

Copyright © 2012, Oracle and/or its affiliates. All rights reserved. 22
Only small amount of data
being processed.
Both instances essentially idle
with most processes waiting in
RAC and concurrency waits.
Is Load Balancing Slowing Your System? Analysis

Copyright © 2012, Oracle and/or its affiliates. All rights reserved. 23
Remove all of those RAC waits
by running against a single
database instance.
Is Load Balancing Slowing Your System?
Solution

Copyright © 2012, Oracle and/or its affiliates. All rights reserved. 24
Throughput up by factor of 10x
RAC waits gone
CPU time actually visible
High concurrency waits
– Buffer busy
– Tx index contention
Is Load Balancing Slowing Your System?
Analysis

Copyright © 2012, Oracle and/or its affiliates. All rights reserved. 25
Reduce contention waits by
processing a file entirely within
a single application server
Is Load Balancing Slowing Your System?
Solution

Copyright © 2012, Oracle and/or its affiliates. All rights reserved. 26
More throughput
Log file sync predominant event
CPU usage close to core count
Is Load Balancing Slowing Your System?
Analysis

Copyright © 2012, Oracle and/or its affiliates. All rights reserved. 27
Reintroduce RAC to add more
CPU resource
Implement separate service for
each instance
Connect application server to
one instance
Is Load Balancing Slowing Your System?
Solution
Copyright © 2012, Oracle and/or its affiliates. All rights reserved. 29
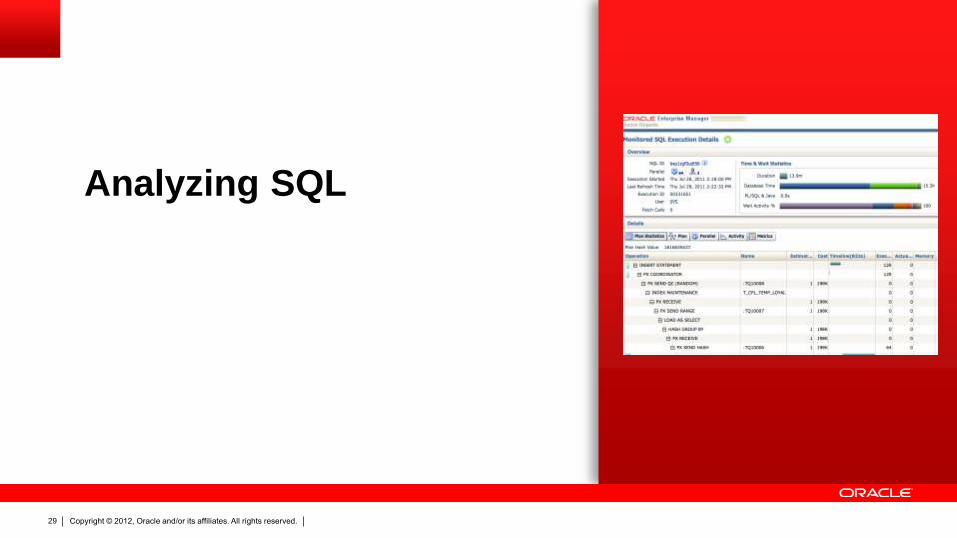
Analyzing SQL

Copyright © 2012, Oracle and/or its affiliates. All rights reserved. 30
Why is My SQL Slow ?

Copyright © 2012, Oracle and/or its affiliates. All rights reserved. 31
Problem Query
Table has 1.2B rows
and is 64 GB.

Copyright © 2012, Oracle and/or its affiliates. All rights reserved. 32
Problem Query
Query 1 consists of two
subqueries. The first
subquery finds all of the
Ferraris.

Copyright © 2012, Oracle and/or its affiliates. All rights reserved. 33
Problem Query
The second subquery finds all
of the Ferrari 458s.

Copyright © 2012, Oracle and/or its affiliates. All rights reserved. 34
Problem Query
Outer query joins the results
of the subqueries.
Outer query performs
aggregations.

Copyright © 2012, Oracle and/or its affiliates. All rights reserved. 35
Problem Query
Query 2 is the same but has
different predicate values.

Copyright © 2012, Oracle and/or its affiliates. All rights reserved. 36
Default Statistics
Copyright © 2012, Oracle and/or its affiliates. All rights reserved. 37
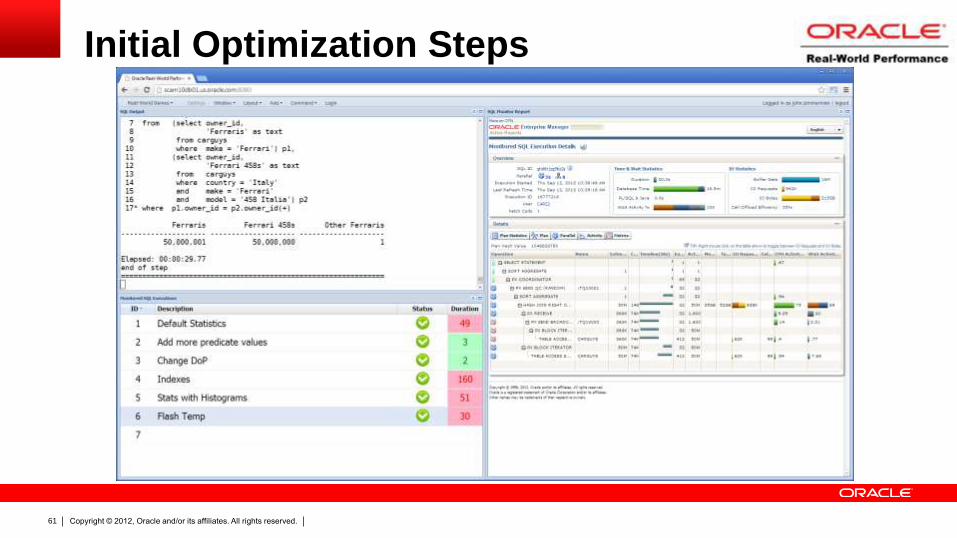
1. Default Statistics
Baseline Performance for Query 1
Query 1 exceeds target
Initial Optimization Steps

Copyright © 2012, Oracle and/or its affiliates. All rights reserved. 38
Initial Optimization Steps
Query 1 takes 49
seconds with default
statistics

Copyright © 2012, Oracle and/or its affiliates. All rights reserved. 39
Initial Optimization Steps

Copyright © 2012, Oracle and/or its affiliates. All rights reserved. 40
Add more predicate values

Copyright © 2012, Oracle and/or its affiliates. All rights reserved. 41
2. Development Findings
Query runs faster just by changing the list of values
in the select list
Plan changed from a broadcast to a hash distribution
due to the higher but inaccurate cardinality estimate
Get correct plan with wrong cardinality estimate—
can lead to inconsistent plans and performance
Initial Optimization Steps

Copyright © 2012, Oracle and/or its affiliates. All rights reserved. 42
Initial Optimization Steps
Increase the list of
predicate values
Now query takes 3
seconds

Copyright © 2012, Oracle and/or its affiliates. All rights reserved. 43
Initial Optimization Steps

Copyright © 2012, Oracle and/or its affiliates. All rights reserved. 44
Change Degree of Parallelism

Copyright © 2012, Oracle and/or its affiliates. All rights reserved. 45
3. Development Findings
Just changing DoP from 32 to 128 improves
performance and meets the target; 4X more
resources yields a 25X performance improvement
Plan has changed from a broadcast distribution to a
hash distribution due to DoP change
DoP is a resource management technique, not a
query tuning tool
Initial Optimization Steps

Copyright © 2012, Oracle and/or its affiliates. All rights reserved. 46
Initial Optimization Steps
Change DoP
from 32 to 128 Now query takes 2
seconds

Copyright © 2012, Oracle and/or its affiliates. All rights reserved. 47
Initial Optimization Steps

Copyright © 2012, Oracle and/or its affiliates. All rights reserved. 48
Indexes

Copyright © 2012, Oracle and/or its affiliates. All rights reserved. 49
4. Indexes
Indexes on columns:
owner_id
country
make
model
country, make, model
Initial Optimization Steps

Copyright © 2012, Oracle and/or its affiliates. All rights reserved. 50
4. Indexes
Not understanding the big/little data challenge
Indexes are not efficient for operations on a large
numbers of rows
Full table scan is faster with predictable performance
Initial Optimization Steps

Copyright © 2012, Oracle and/or its affiliates. All rights reserved. 51
To Index or Not
Indexing is an OLTP technique for operations on a small number of
rows
A table scan may consume more resources but it will be predictable
no matter how many rows are returned
Indexes impact DML operations
If I/O bandwidth went from 70MB/sec to 70GB/sec would you
change your optimization/execution strategy?

Copyright © 2012, Oracle and/or its affiliates. All rights reserved. 52
To Index or Not
Index driven query retrieving 1,000,000 rows
– Assume the index is cached and the data is not.
1,000,000 random IOPS @ 5ms per I/O
This would require 5000 Seconds ( or over 1 hour ) to Execute
– How much data could you scan in 5000 Seconds with a fully sized I/O
system able to scan 25 GB/Sec ?
Over 100 TB !

Copyright © 2012, Oracle and/or its affiliates. All rights reserved. 53
Initial Optimization Steps
Add Indexes and
query takes longer—
160 seconds!

Copyright © 2012, Oracle and/or its affiliates. All rights reserved. 54
Initial Optimization Steps
Index lookups on
millions of rows is
slow

Copyright © 2012, Oracle and/or its affiliates. All rights reserved. 55
Histograms

Copyright © 2012, Oracle and/or its affiliates. All rights reserved. 56
5. Histograms
Re-gathered stats to automatically create histograms
Frequency histograms on country, make and
model columns
No change in plan—query still exceeds target
Initial Optimization Steps

Copyright © 2012, Oracle and/or its affiliates. All rights reserved. 57
Initial Optimization Steps
Rerun stats to get
histograms—no change in
plan or run time
Copyright © 2012, Oracle and/or its affiliates. All rights reserved. 58
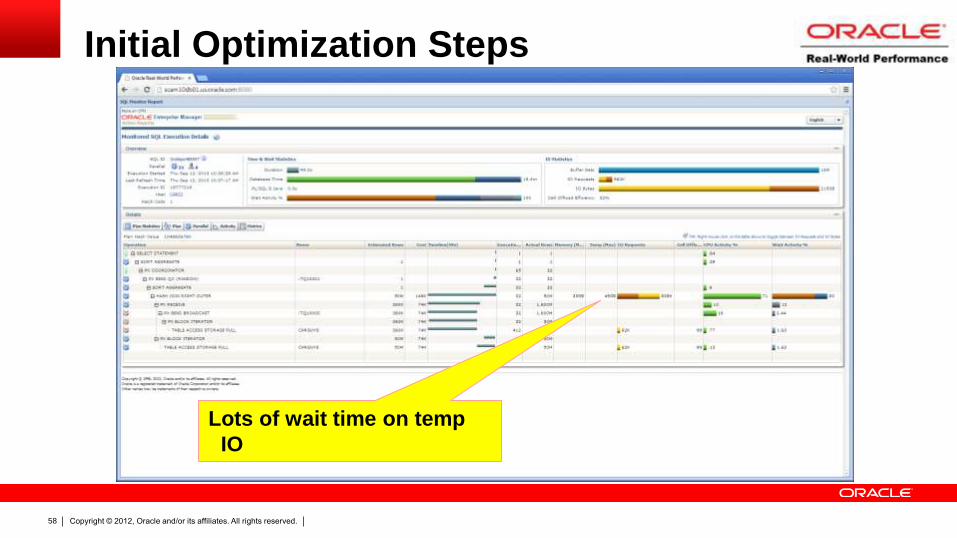
Initial Optimization Steps
Lots of wait time on temp
IO

Copyright © 2012, Oracle and/or its affiliates. All rights reserved. 59
Flash Temp

Copyright © 2012, Oracle and/or its affiliates. All rights reserved. 60
6. Flash Temp
Most of the wait time was spent performing IO on
temp, so move temp to flash disks
Improved performance but still does not meet target
Not a good use of flash
Incorrect use of tools/products
Initial Optimization Steps
Copyright © 2012, Oracle and/or its affiliates. All rights reserved. 61
Initial Optimization Steps

Copyright © 2012, Oracle and/or its affiliates. All rights reserved. 62
Initial Optimization Steps
Move temp to flash and
now IO accounts for a
smaller percentage of
database time

Copyright © 2012, Oracle and/or its affiliates. All rights reserved. 63
Manual Memory Parameters

Copyright © 2012, Oracle and/or its affiliates. All rights reserved. 64
7. Manual Memory Parameters
Set sort_area_size and hash_area_size to 2G
Eliminated temp usage but still did not meet target
Memory is allocated per parallel server process,
which can quickly exceed resources
Moving to a solution before understanding the
problem
Initial Optimization Steps

Copyright © 2012, Oracle and/or its affiliates. All rights reserved. 65
Initial Optimization Steps

Copyright © 2012, Oracle and/or its affiliates. All rights reserved. 66
8. Cardinality Hint
SQL Monitor showed poor cardinality estimates
Cardinality hint gives optimizer the correct number of
rows for the table scan
Plan changed from a broadcast to hash distribution
Query time now meets target
Now temp is not an issue
Optimization Steps

Copyright © 2012, Oracle and/or its affiliates. All rights reserved. 67
Optimization Steps

Copyright © 2012, Oracle and/or its affiliates. All rights reserved. 68
Optimization Steps
Use cardinality hint to specify
correct number of rows
Plan switches from a broadcast
to a hash distribution

Copyright © 2012, Oracle and/or its affiliates. All rights reserved. 69
Disable Broadcast Distribution

Copyright © 2012, Oracle and/or its affiliates. All rights reserved. 70
9. Disable Broadcast Distribution
Googling reveals a hidden parameter to disable
broadcast distribution
Plan and run times are similar to cardinality hint,
meeting target
Moving to a solution before understanding the
problem
Optimization Steps

Copyright © 2012, Oracle and/or its affiliates. All rights reserved. 71
Optimization Steps

Copyright © 2012, Oracle and/or its affiliates. All rights reserved. 72
Histogram on Column Group

Copyright © 2012, Oracle and/or its affiliates. All rights reserved. 73
13.Histogram on Extended Stats
Re-gathered stats after running the query with the
column groups
Frequency Histogram on the column group
Accurate cardinality estimates
Optimizer now uses a hash distribution
Optimization Steps
Copyright © 2012, Oracle and/or its affiliates. All rights reserved. 74
Optimization Steps

Copyright © 2012, Oracle and/or its affiliates. All rights reserved. 75
Optimization Steps
With a histogram on
the column group we
now have a good
cardinality estimate
Now we get a hash distribution
and meet the target

Copyright © 2012, Oracle and/or its affiliates. All rights reserved. 76
Second Query with Histogram Column Group

Copyright © 2012, Oracle and/or its affiliates. All rights reserved. 77
14.Query 2 with Extended Stats
Accurate cardinality estimates
Optimizer uses a broadcast distribution on second
query
Optimization Steps

Copyright © 2012, Oracle and/or its affiliates. All rights reserved. 78
16.Auto Column Groups
dbms_stats.report_col_usage shows column groups
identified during Seed Column Usage
dbms_stats.create_extended_stats creates column
groups identified
Automatically identifies usage of Country, Make and
Model columns together and creates column group
Optimization Steps

Copyright © 2012, Oracle and/or its affiliates. All rights reserved. 79
16.Auto Column Groups
Regather stats
Automatically creates Histogram on the column
group
Query meets target
Optimization Steps

Copyright © 2012, Oracle and/or its affiliates. All rights reserved. 80
Optimization Steps

Copyright © 2012, Oracle and/or its affiliates. All rights reserved. 81
Optimization Steps
Now with the column group identified and created
we have a good cardinality estimate
And we get a hash
distribution
Copyright © 2012, Oracle and/or its affiliates. All rights reserved. 82
What Did We Learn ?
Copyright © 2012, Oracle and/or its affiliates. All rights reserved. 83
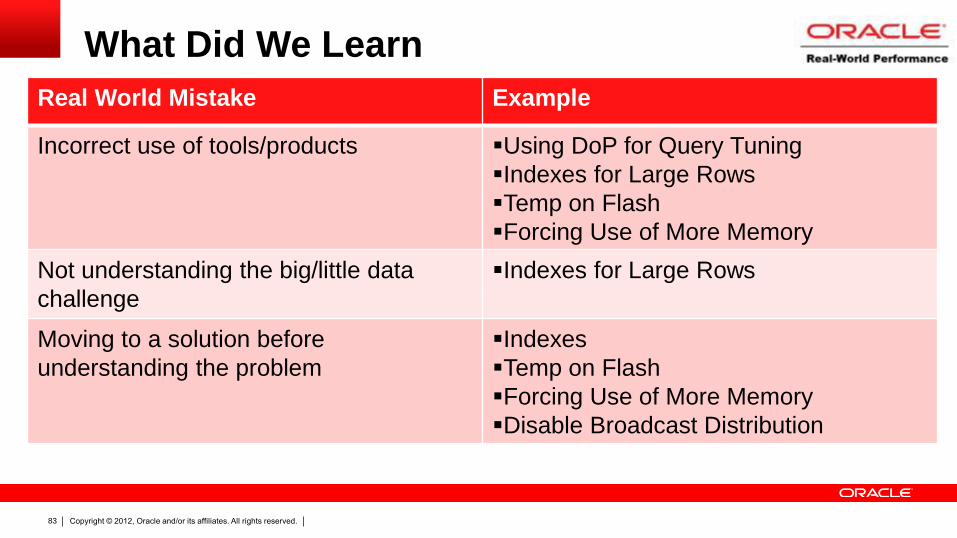
What Did We Learn
Real World Mistake Example
Incorrect use of tools/products Using DoP for Query Tuning
Indexes for Large Rows
Temp on Flash
Forcing Use of More Memory
Not understanding the big/little data
challenge
Indexes for Large Rows
Moving to a solution before
understanding the problem
Indexes
Temp on Flash
Forcing Use of More Memory
Disable Broadcast Distribution

Copyright © 2012, Oracle and/or its affiliates. All rights reserved. 84
OLTP Basics
Copyright © 2012, Oracle and/or its affiliates. All rights reserved. 85
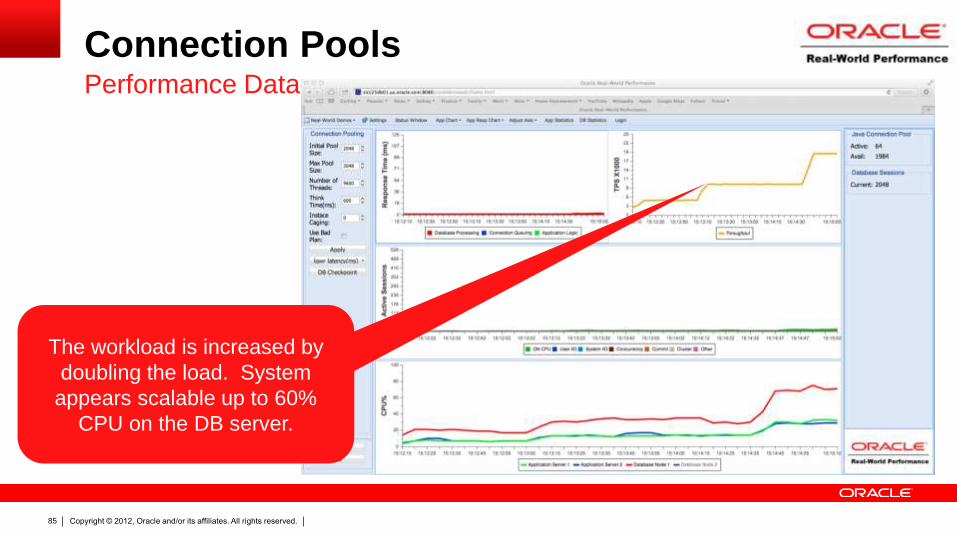
Connection Pools Performance Data
The workload is increased by
doubling the load. System
appears scalable up to 60%
CPU on the DB server.

Copyright © 2012, Oracle and/or its affiliates. All rights reserved. 86
Connection Pools Performance Data
A checkpoint is initiated,
creating a CPU spike that
results in unpredictable
response time

Copyright © 2012, Oracle and/or its affiliates. All rights reserved. 87
Connection Pools Performance Data
A slight increase to the
workload results in a
disproportionate CPU
increase and response time
degrades. System
monitoring tools become
unreliable

Copyright © 2012, Oracle and/or its affiliates. All rights reserved. 88
Connection Pools Performance Data
Reducing the connection pool by 50% results
in more application server queuing and less
DB processes in a wait state. No observable
improvement in response time or transaction
rate (value or consistency)
Copyright © 2012, Oracle and/or its affiliates. All rights reserved. 89
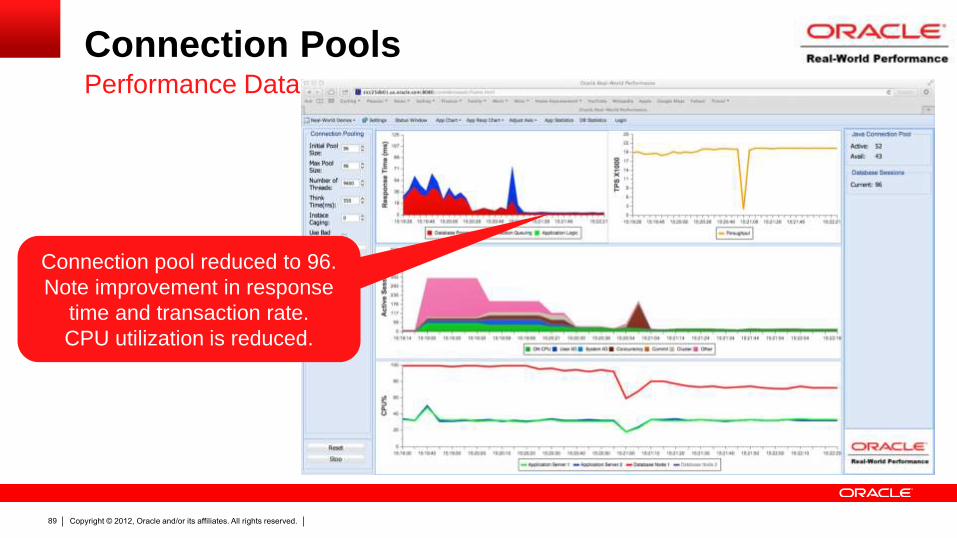
Connection Pools Performance Data
Connection pool reduced to 96.
Note improvement in response
time and transaction rate.
CPU utilization is reduced.

Copyright © 2012, Oracle and/or its affiliates. All rights reserved. 90
Resource Management Performance Data
By reducing the CPU_COUNT in the
resource manager, the database
can be throttled back. Note the
increase in response time and wait
event resmgr: cpu quantum

Copyright © 2012, Oracle and/or its affiliates. All rights reserved. 91
SQL Programming Basics Performance Data
Transaction rate: 300 TPS
Response time: 150 ms
CPU profile shows equal
system and user
utilization

Copyright © 2012, Oracle and/or its affiliates. All rights reserved. 92
SQL Programming Basics Performance Data
Transaction rate: 3,000 TPS
Response time: 20 ms
Hard parsing and shared
pool contention. Do we
have a security issue with
literals?

Copyright © 2012, Oracle and/or its affiliates. All rights reserved. 93
SQL Programming Basics Performance Data
Transaction rate: 25,000 TPS
Response time: 1 ms
No contention and no
parsing. CPU is well
utilized.

Copyright © 2012, Oracle and/or its affiliates. All rights reserved. 94
SQL Programming Basics Performance Data
Performance
significantly reduced on
production as compared
to development and test
Contention in the
shared pool

Copyright © 2012, Oracle and/or its affiliates. All rights reserved. 95
Programming Errors Performance Data
Error message:
ORA-01000 Maximum open
cursors exceeded
“SQL*Net
break/reset to
client”

Copyright © 2012, Oracle and/or its affiliates. All rights reserved. 96
Programming Errors Session Details
SQL*Net
break/reset to
client

Copyright © 2012, Oracle and/or its affiliates. All rights reserved. 97
Programming Errors Cursor Data
Cursor list with Count > 1
implies “leaked” cursors

Copyright © 2012, Oracle and/or its affiliates. All rights reserved. 98
Programming Errors Performance Data
Load diminishes to zero

Copyright © 2012, Oracle and/or its affiliates. All rights reserved. 99
Bad Performance #4
Potential indicators of session leaking:
– Frequent application server resets
– init.ora parameters process and sessions set very high
– Configuration of large and dynamic connection pools
– Large number of idle connections connected to the database
– Free memory on database server continually reduced
– Presence of idle connection kill scripts or middleware configured to kill idle
sessions
Session Leaking
Copyright © 2012, Oracle and/or its affiliates. All rights reserved. 100
Bad Performance #5
Without warning, the database appears to hang and the application
servers time out simultaneously
The DBA sees that all connections are waiting on a single lock held by
a process that has not been active for a while.
Each time the problem occurs, the DBA responds by running a script to
kill sessions held by long time lock holders and allowing the system to
restart.
Observations

Copyright © 2012, Oracle and/or its affiliates. All rights reserved. 101
Programming Errors Performance Data
Leaked lock holder
causes entire
system to stall

Copyright © 2012, Oracle and/or its affiliates. All rights reserved. 102
Programming Errors Blocking Tree
Block tree reveals
lock holder which
can be killed

Copyright © 2012, Oracle and/or its affiliates. All rights reserved. 103
Programming Errors Performance Data
enq: TX – row lock contention

Copyright © 2012, Oracle and/or its affiliates. All rights reserved. 104
Programming Errors Performance Data
System returns to normal
when lock is released.
There could have been
logical data corruption
and it may happen again

Copyright © 2012, Oracle and/or its affiliates. All rights reserved. 105
Set Based Processing Concepts

Copyright © 2012, Oracle and/or its affiliates. All rights reserved. 106
Loading
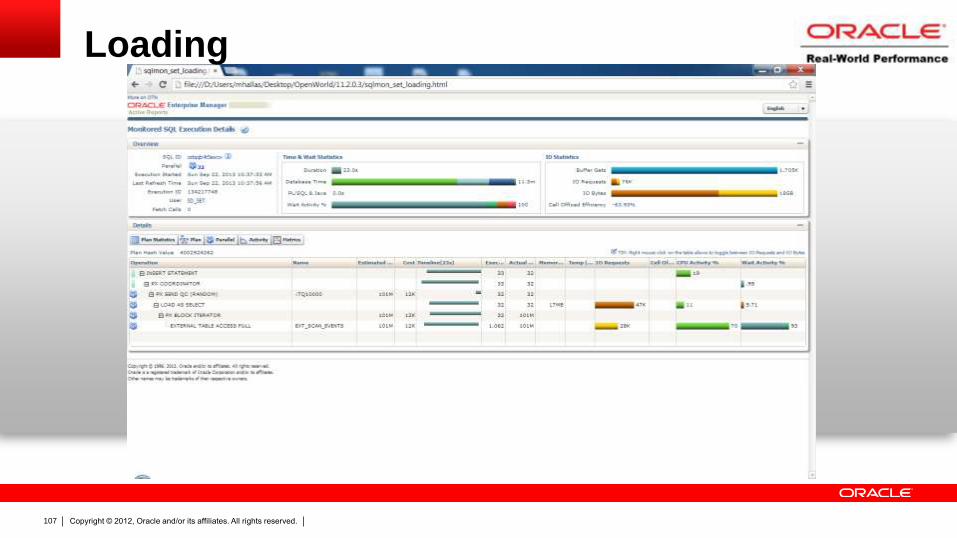
Copyright © 2012, Oracle and/or its affiliates. All rights reserved. 107
Loading

Copyright © 2012, Oracle and/or its affiliates. All rights reserved. 108
De-duplicating

Copyright © 2012, Oracle and/or its affiliates. All rights reserved. 109
De-duplicating

Copyright © 2012, Oracle and/or its affiliates. All rights reserved. 110
Transforming

Copyright © 2012, Oracle and/or its affiliates. All rights reserved. 111
Transforming

Copyright © 2012, Oracle and/or its affiliates. All rights reserved. 112
Aggregating using Set-based Method

Copyright © 2012, Oracle and/or its affiliates. All rights reserved. 113
Aggregating using Pipelined Table Function Method

Copyright © 2012, Oracle and/or its affiliates. All rights reserved. 114
Running out Memory

Copyright © 2012, Oracle and/or its affiliates. All rights reserved. 115
Huge Pages
To fill a shape with an image.
1. Use existing picture box, DO NOT delete and
create new picture box.
2. Right click on the shape.
3. At the bottom of the submenu select
“Format Shape”
4. Select “Fill” at the top of the “Format Shape”
dialog box.
5. Select “Picture or Texture fill” from the options.
6. And select “File” under the “Insert from” option.
7. Navigate to the file you want to use and
select “Insert”
8. On the “Format” tab, in the Size group, click on
“Crop to Fill” in the Crop tool and drag the image
bounding box to the desired size
9. DELETE THIS INSTRUCTION NOTE WHEN
NOT IN USE

Copyright © 2012, Oracle and/or its affiliates. All rights reserved. 116
Two system identical other than one (top) uses huge pages for SGA and other does not
Both systems have huge pages configured
At small number of connections there is little difference in memory utilization
Scenario
Huge Pages
Copyright © 2012, Oracle and/or its affiliates. All rights reserved. 117
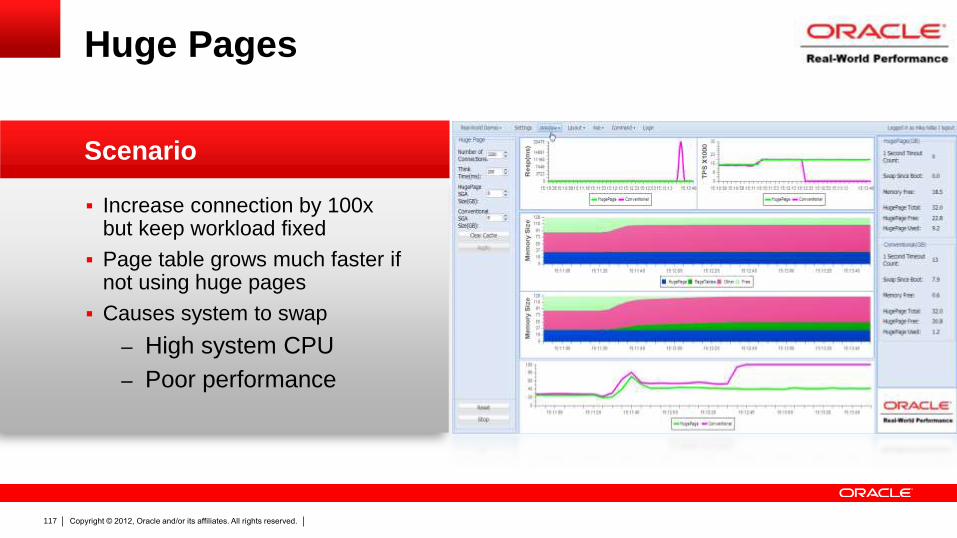
Increase connection by 100x but keep workload fixed
Page table grows much faster if not using huge pages
Causes system to swap
– High system CPU
– Poor performance
Scenario
Huge Pages

Copyright © 2012, Oracle and/or its affiliates. All rights reserved. 118
Reduce connection by a few
hundred relieves memory
pressure and system starts
working again
BUT…
Scenario
Huge Pages

Copyright © 2012, Oracle and/or its affiliates. All rights reserved. 119
Page table usage is on demand
so over time continues to
increase until swapping
resumes
Scenario
Huge Pages

Copyright © 2012, Oracle and/or its affiliates. All rights reserved. 120

Copyright © 2012, Oracle and/or its affiliates. All rights reserved. 121