Embed Size (px)
Citation preview
Copyright © 2012 McGraw-Hill Australia Pty Ltd PowerPoint presentation to accompany Economic Principles 3e, by Jackson, McIver, Wilson & BajadaSlides prepared by George Bredon
1- 1
Chapter 1
The general principles of economics
Copyright © 2012 McGraw-Hill Australia Pty Ltd PowerPoint presentation to accompany Economic Principles 3e, by Jackson, McIver, Wilson & BajadaSlides prepared by George Bredon
1- 2
Learning objectives1. Describe the nature and methodology of economics,
including the two fundamental facts that comprise the economising problem.
2. Explain specific problems, limitations and pitfalls encountered in studying economics.
3. Discuss the meaning of economic efficiency.
4. Introduce the concept of opportunity cost and the law of increasing opportunity cost.
Copyright © 2012 McGraw-Hill Australia Pty Ltd PowerPoint presentation to accompany Economic Principles 3e, by Jackson, McIver, Wilson & BajadaSlides prepared by George Bredon
1- 3
Learning objectives (cont.)
5. Illustrate, extend and modify the definition of economics through the use of production possibilities tables and curves.
6. Use the production possibilities curve model to examine the trade-off between current and future consumption.
Copyright © 2012 McGraw-Hill Australia Pty Ltd PowerPoint presentation to accompany Economic Principles 3e, by Jackson, McIver, Wilson & BajadaSlides prepared by George Bredon
1- 4
The economic perspectiveEconomics is concerned with the efficient use of limited productive resources for the purpose of attaining the maximum satisfaction of our material wants.
Copyright © 2012 McGraw-Hill Australia Pty Ltd PowerPoint presentation to accompany Economic Principles 3e, by Jackson, McIver, Wilson & BajadaSlides prepared by George Bredon
1- 5
The economic perspective (cont.)• Reasons for studying economics:
– provides valuable knowledge concerning our social environment and economic behaviour
– provides the knowledge needed to make fundamental decisions in a democracy
– provides businesses and consumers with valuable information and a set of methods for analysing information
– outlines the special perspective held by economists about scarcity, rational behaviour and the use of marginal concepts in decision making.
Copyright © 2012 McGraw-Hill Australia Pty Ltd PowerPoint presentation to accompany Economic Principles 3e, by Jackson, McIver, Wilson & BajadaSlides prepared by George Bredon
1- 6
The economic perspective (cont.)The economic perspective includes:• Scarcity and choice
– Resources are limited and this necessitates choices.
• Behaviour based on ‘rational self-interest’– Behaviour involves decisions and actions aimed at achieving
the greatest satisfaction or maximum fulfilment of goals.– Choices differ between people because their circumstances,
preferences and available information differ.
• Marginalism: benefits and costs– Marginal means ‘additional’ or ‘extra’.– Economic decisions compare marginal benefits and marginal
costs.– Additional benefits available from any changes are compared
to the additional costs of making the change.
Copyright © 2012 McGraw-Hill Australia Pty Ltd PowerPoint presentation to accompany Economic Principles 3e, by Jackson, McIver, Wilson & BajadaSlides prepared by George Bredon
1- 7
The foundation of economicsTwo fundamental facts that constitute the economising
problem:• Unlimited wants
– Material wants: the desires of consumers to obtain and use various goods and services that give utility or satisfaction
• Scarce resources– Economic resources includes all the natural, human and
manufactured resources that go into the production of goods and services. These include:
property resources —land, raw material and capital human resources—labour and enterprise.
Copyright © 2012 McGraw-Hill Australia Pty Ltd PowerPoint presentation to accompany Economic Principles 3e, by Jackson, McIver, Wilson & BajadaSlides prepared by George Bredon
1- 8
Scarce resourcesTwo broad categories:• Property resources
– Land and raw materials: all ‘gifts of nature’ usable in production
– Capital: aids to production e.g. factories, machinery
• Human resources– Labour– Entrepreneurial ability: initiation and organisation of factors
of production, promotes innovation, takes risks
Copyright © 2012 McGraw-Hill Australia Pty Ltd PowerPoint presentation to accompany Economic Principles 3e, by Jackson, McIver, Wilson & BajadaSlides prepared by George Bredon
1- 9
Resource payments• Land—rent• Capital—interest• Labour—wages• Enterprise—profit
Copyright © 2012 McGraw-Hill Australia Pty Ltd PowerPoint presentation to accompany Economic Principles 3e, by Jackson, McIver, Wilson & BajadaSlides prepared by George Bredon
1- 10
Five fundamental questions• How much total output is to be produced?• What combination of outputs is to be produced?• How are these outputs to be produced?• Who is to receive/consume these outputs?• How can change be accommodated?
Copyright © 2012 McGraw-Hill Australia Pty Ltd PowerPoint presentation to accompany Economic Principles 3e, by Jackson, McIver, Wilson & BajadaSlides prepared by George Bredon
1- 11
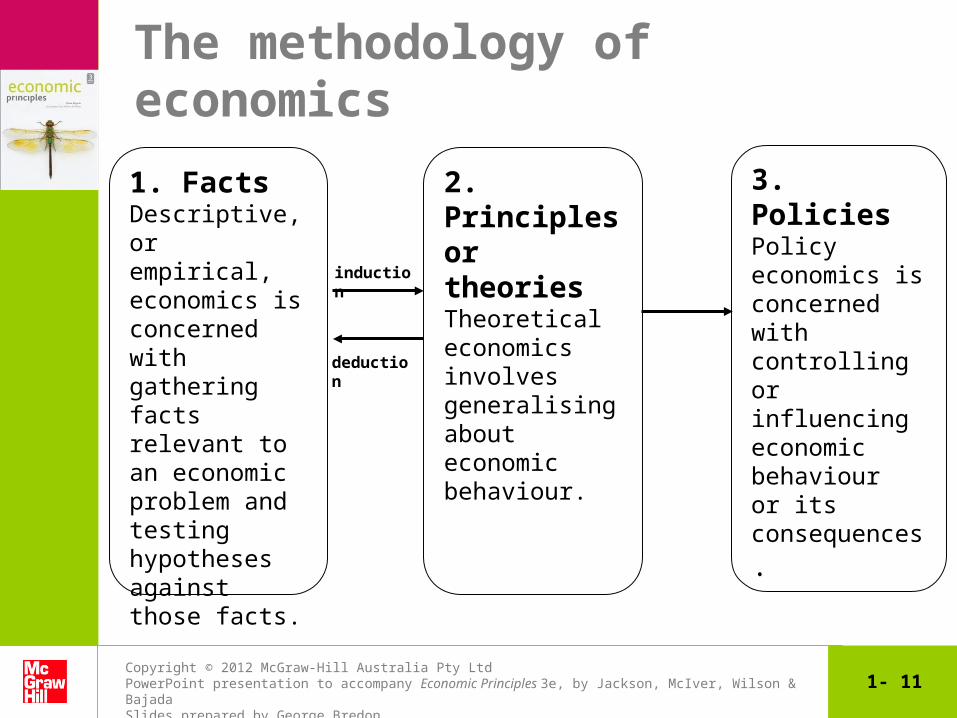
The methodology of economics
2. Principles or theoriesTheoretical economics involves generalising about economic behaviour.
induction
deduction
1. Facts Descriptive, or empirical, economics is concerned with gathering facts relevant to an economic problem and testing hypotheses against those facts.
3. PoliciesPolicy economics is concerned with controlling or influencing economic behaviour or its
consequences.
Copyright © 2012 McGraw-Hill Australia Pty Ltd PowerPoint presentation to accompany Economic Principles 3e, by Jackson, McIver, Wilson & BajadaSlides prepared by George Bredon
1- 12
Induction and deduction
• Induction– A method of reasoning that proceeds from facts to
generalisations.
• Deduction– Reasoning from assumptions to conclusions by testing
a hypothesis.
Copyright © 2012 McGraw-Hill Australia Pty Ltd PowerPoint presentation to accompany Economic Principles 3e, by Jackson, McIver, Wilson & BajadaSlides prepared by George Bredon
1- 13
Economic theory• Facts must be systematically arranged, interpreted
and generalised to derive appropriate economic theory.
• Theories or principles are the end result of economic analysis. These are meaningful statements drawn from facts.
Copyright © 2012 McGraw-Hill Australia Pty Ltd PowerPoint presentation to accompany Economic Principles 3e, by Jackson, McIver, Wilson & BajadaSlides prepared by George Bredon
1- 14
Terminology of economic theory• Economists use the terms ‘laws’, ‘theories’ and
‘models’ to represent generalisations, or statements of regularity, about the economic behaviour of individuals and institutions.
• Abstractions in economics– Economic theories do not encompass the full
complexity of reality.
Copyright © 2012 McGraw-Hill Australia Pty Ltd PowerPoint presentation to accompany Economic Principles 3e, by Jackson, McIver, Wilson & BajadaSlides prepared by George Bredon
1- 15
The ‘other things being equal’ assumption • The ‘other things being equal’ assumption
– Sometimes referred to as ‘ceteris paribus’
– Used in the process of analysis to signify that all variables, other than the one being considered, are held constant
– Used to focus attention on relationship between chosen variables to minimise distracting influence of other variables
Copyright © 2012 McGraw-Hill Australia Pty Ltd PowerPoint presentation to accompany Economic Principles 3e, by Jackson, McIver, Wilson & BajadaSlides prepared by George Bredon
1- 16
Microeconomics and macroeconomics
• Microeconomics is concerned with specific economic units and a detailed consideration of the behaviour of these individual units.
• Macroeconomics deals with the economy as a whole, or with the basic subdivisions or aggregates that make up the economy.
Copyright © 2012 McGraw-Hill Australia Pty Ltd PowerPoint presentation to accompany Economic Principles 3e, by Jackson, McIver, Wilson & BajadaSlides prepared by George Bredon
1- 17
Policy economics: positive and normative • Positive economics is based upon facts without value
judgements.• Normative economics is based upon subjective
beliefs . . . ‘what ought to be’– Normative economic statements come into play at the
level of policy economics.
Copyright © 2012 McGraw-Hill Australia Pty Ltd PowerPoint presentation to accompany Economic Principles 3e, by Jackson, McIver, Wilson & BajadaSlides prepared by George Bredon
1- 18
Pitfalls of objective thinking
• Bias• Fallacy of composition• Cause and effect
– Post-hoc fallacy
– Correlation versus causation
Copyright © 2012 McGraw-Hill Australia Pty Ltd PowerPoint presentation to accompany Economic Principles 3e, by Jackson, McIver, Wilson & BajadaSlides prepared by George Bredon
1- 19
Economics and efficiency
• Efficiency results from using or administering scarce resources to produce the maximum amount of the goods and services desired by society thereby achieving the greatest possible fulfilment of society’s wants.
• Full employment– When all available resources are employed
• Full production– When the maximum amount of goods and services are
produced from the fully employed resources of an economy
– Underemployment results if full production not achieved
Copyright © 2012 McGraw-Hill Australia Pty Ltd PowerPoint presentation to accompany Economic Principles 3e, by Jackson, McIver, Wilson & BajadaSlides prepared by George Bredon
1- 20
Economics and efficiency (cont.)
Types of efficiency
•Allocative efficiency– Occurs when all available resources are devoted to the
combination of goods most wanted by society
•Productive efficiency– Occurs when goods or services are produced using the
lowest cost production methods

Copyright © 2012 McGraw-Hill Australia Pty Ltd PowerPoint presentation to accompany Economic Principles 3e, by Jackson, McIver, Wilson & BajadaSlides prepared by George Bredon
1- 21
Specialisation and efficiency
• Two major forms of specialisation enhance efficiency:– The division of labour builds on existing differences in
abilities and skills.
– Geographic specialisation builds on locational resource advantages.
Copyright © 2012 McGraw-Hill Australia Pty Ltd PowerPoint presentation to accompany Economic Principles 3e, by Jackson, McIver, Wilson & BajadaSlides prepared by George Bredon
1- 22
Production possibilities table• Used to illustrate the economising problem and the
concepts of scarcity and opportunity cost
Assumptions– Efficiency
Full employment and productive efficiency.
– Fixed resources– Fixed technology– Two products only
Capital good and consumer good.
• In short run resources are scarce so output is limited – Implies that increase in production of one good means shift
of resources from production of the other good
Copyright © 2012 McGraw-Hill Australia Pty Ltd PowerPoint presentation to accompany Economic Principles 3e, by Jackson, McIver, Wilson & BajadaSlides prepared by George Bredon
1- 23
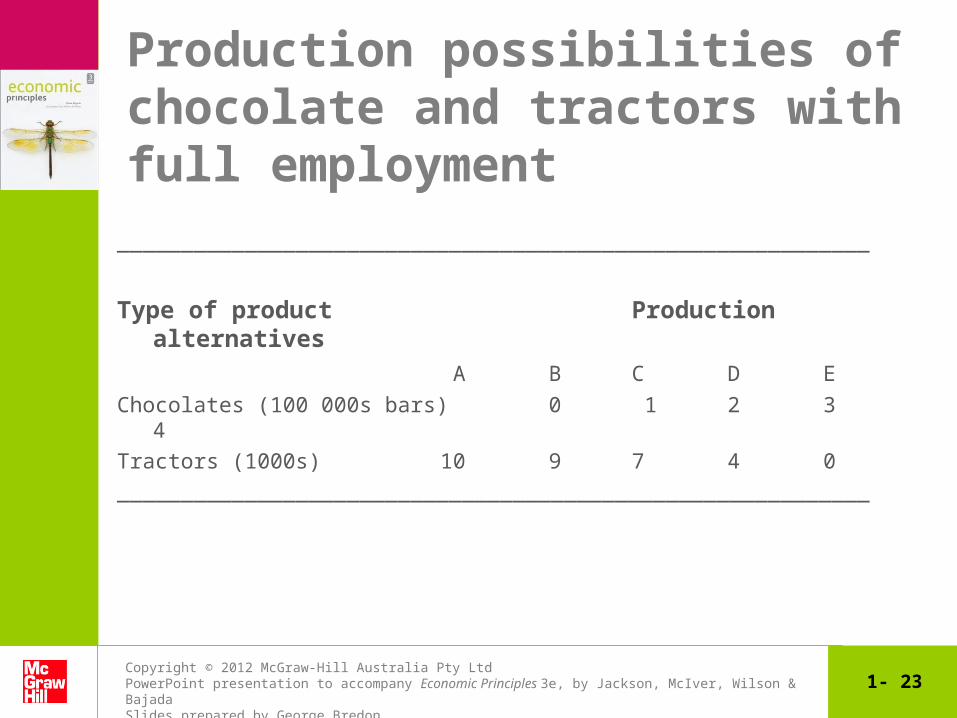
Production possibilities of chocolate and tractors with full employment
___________________________________________________________
Type of product Production alternatives
A B C D E
Chocolates (100 000s bars) 0 1 2 3 4
Tractors (1000s) 10 9 7 4 0
___________________________________________________________
Copyright © 2012 McGraw-Hill Australia Pty Ltd PowerPoint presentation to accompany Economic Principles 3e, by Jackson, McIver, Wilson & BajadaSlides prepared by George Bredon
1- 24
Production possibilities curve• The production possibilities curve (PPC) can be used
to illustrate the concept of choice and opportunity cost.
• Demonstrates that society must make choices about which goods and services to produce and which to go without
• Data from the PP table can be used to plot PPC
Copyright © 2012 McGraw-Hill Australia Pty Ltd PowerPoint presentation to accompany Economic Principles 3e, by Jackson, McIver, Wilson & BajadaSlides prepared by George Bredon
1- 25
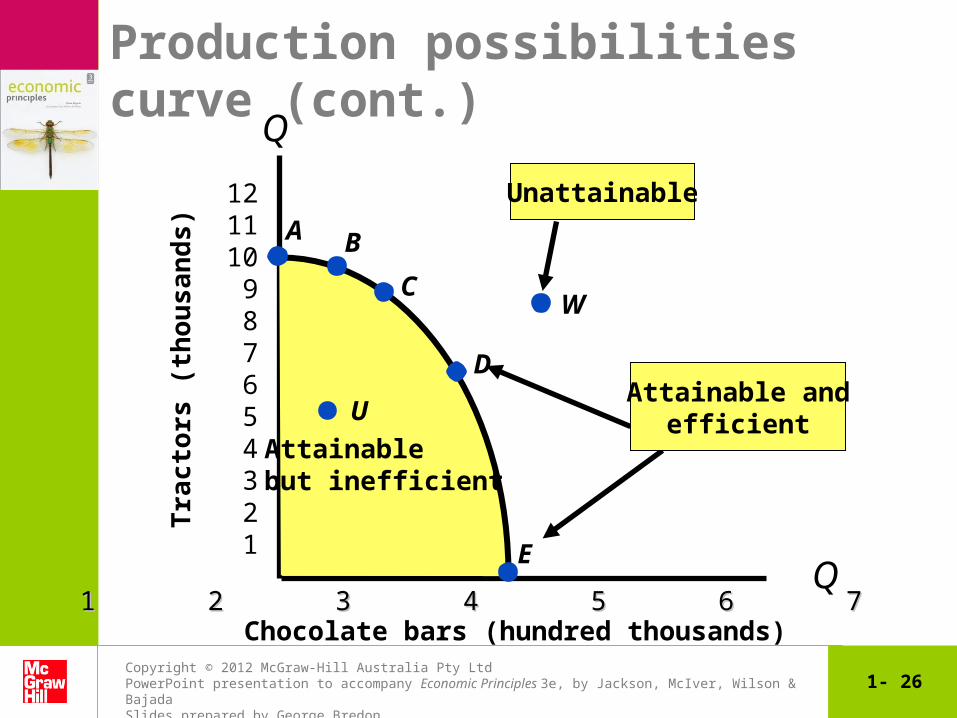
Production possibilities curve (cont.)
• Points on the PPC represent a maximum output of the two products.
• Points inside the PPC are attainable, but are inefficient and undesirable.
• Points outside the curve are superior, but unobtainable given the assumptions of fixed technology and resources.
Copyright © 2012 McGraw-Hill Australia Pty Ltd PowerPoint presentation to accompany Economic Principles 3e, by Jackson, McIver, Wilson & BajadaSlides prepared by George Bredon
1- 26
Q
Q
Tra
cto
rs (
tho
us
an
ds
)
Chocolate bars (hundred thousands)
121110 9 8 7 6 5 4 3 2 1
A B
C
D
E
W
Unattainable
Attainable andefficient
Attainablebut inefficient
U
Production possibilities curve (cont.)
1 2 3 4 5 6 7 81 2 3 4 5 6 7 8
Copyright © 2012 McGraw-Hill Australia Pty Ltd PowerPoint presentation to accompany Economic Principles 3e, by Jackson, McIver, Wilson & BajadaSlides prepared by George Bredon
1- 27
• Opportunity cost: – The amount of other products that must be sacrificed
to obtain an additional unit of a good
• The PPC is concave to the origin because of the law of increasing opportunity costs:– more and more of a good must be given up to obtain
additional units of the other good.
Production possibilities curve (cont.)

Copyright © 2012 McGraw-Hill Australia Pty Ltd PowerPoint presentation to accompany Economic Principles 3e, by Jackson, McIver, Wilson & BajadaSlides prepared by George Bredon
1- 28
Law of increasing opportunity costs
• Concavity: the slope of the concave PPC becomes steeper as we move from A to E – To gain progressively more chocolate production
society has to give up increasing levels of tractor production and vice versa.
• Rationale:– Economic resources are not completely adaptable to
alternative uses; they are imperfect substitutes.
– Resources lack perfect flexibility or interchangeability.
Copyright © 2012 McGraw-Hill Australia Pty Ltd PowerPoint presentation to accompany Economic Principles 3e, by Jackson, McIver, Wilson & BajadaSlides prepared by George Bredon
1- 29
Allocative efficiency revisited• Resources are efficiently allocated to any product
when the output is such that its marginal benefit equals its marginal cost (MB = MC).

Copyright © 2012 McGraw-Hill Australia Pty Ltd PowerPoint presentation to accompany Economic Principles 3e, by Jackson, McIver, Wilson & BajadaSlides prepared by George Bredon
1- 30
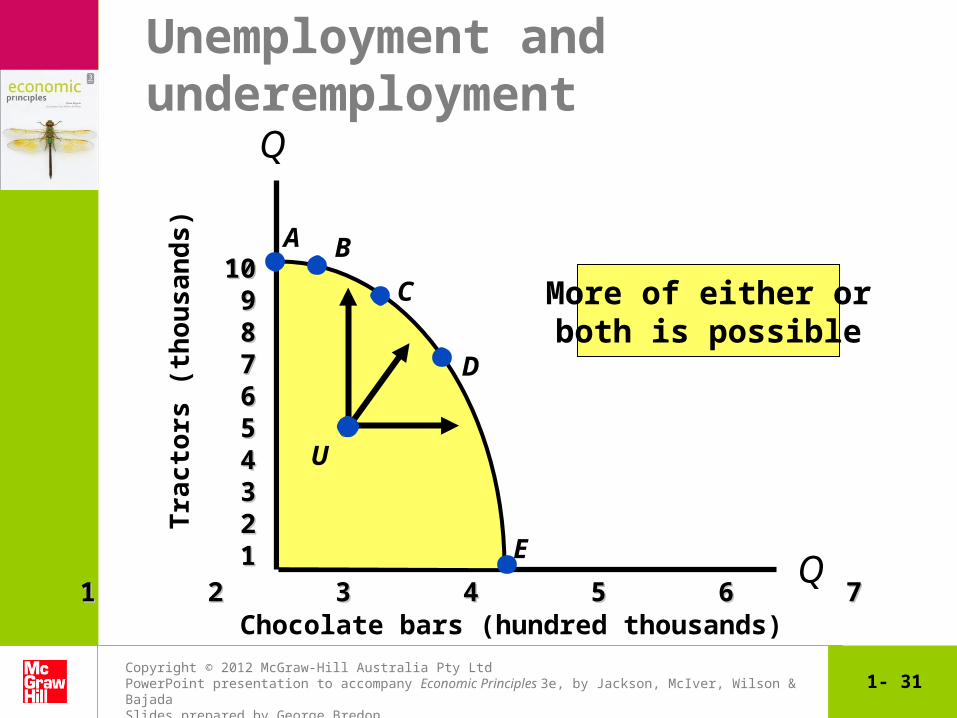
Unemployment and growth• Points inside the production possibility curve illustrate
unemployment or productive inefficiency.• A movement towards full employment and productive
efficiency from a point such as U will entail a greater output of at least one, if not both, products.
Copyright © 2012 McGraw-Hill Australia Pty Ltd PowerPoint presentation to accompany Economic Principles 3e, by Jackson, McIver, Wilson & BajadaSlides prepared by George Bredon
1- 31
Unemployment and underemployment
Q
Q
Tra
cto
rs (
tho
us
an
ds
)
Chocolate bars (hundred thousands)
1010 99 88 77 66 55 44 33 22 11
A B
C
D
E
More of either orboth is possible
U
1 2 3 4 5 6 7 81 2 3 4 5 6 7 8
Copyright © 2012 McGraw-Hill Australia Pty Ltd PowerPoint presentation to accompany Economic Principles 3e, by Jackson, McIver, Wilson & BajadaSlides prepared by George Bredon
1- 32
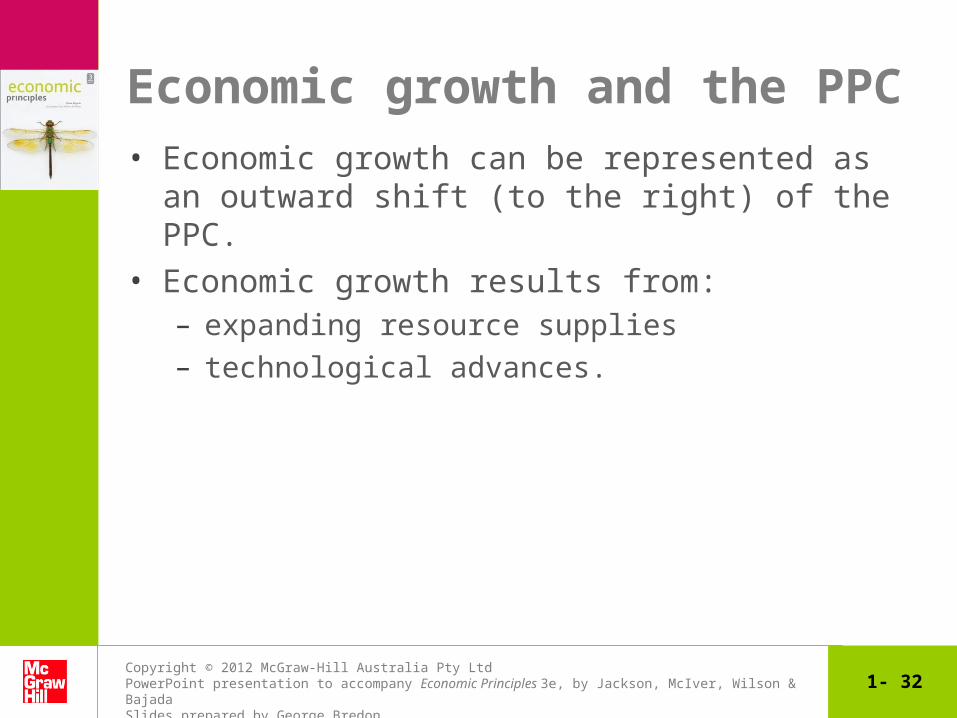
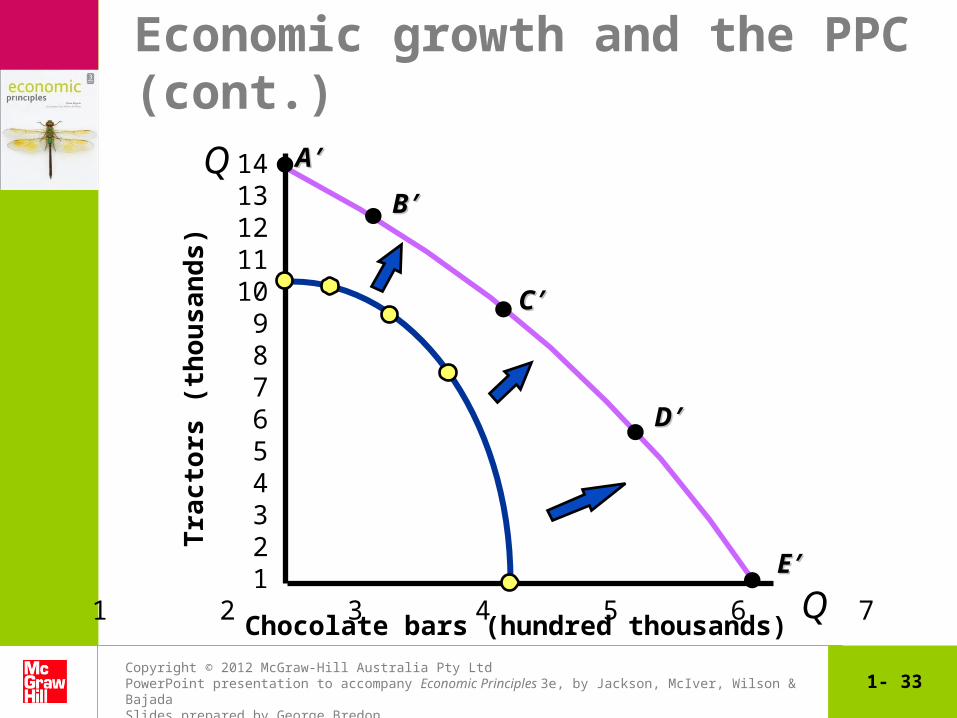
Economic growth and the PPC• Economic growth can be represented as an outward
shift (to the right) of the PPC.• Economic growth results from:
– expanding resource supplies
– technological advances.
Copyright © 2012 McGraw-Hill Australia Pty Ltd PowerPoint presentation to accompany Economic Principles 3e, by Jackson, McIver, Wilson & BajadaSlides prepared by George Bredon
1- 33
Q
Q
Tra
cto
rs (
tho
us
an
ds
)
Chocolate bars (hundred thousands)
1413121110 9 8 7 6 5 4 3 2 1
AA′′
BB′′
CC′′
DD′′
EE′′
Economic growth and the PPC (cont.)
1 2 3 4 5 6 7 8
Copyright © 2012 McGraw-Hill Australia Pty Ltd PowerPoint presentation to accompany Economic Principles 3e, by Jackson, McIver, Wilson & BajadaSlides prepared by George Bredon
1- 34
The role of markets and prices
• Market or price system is the basic coordinating mechanism of a capitalist economy.
• Markets bring buyers (‘demanders’) and sellers (‘suppliers’) of a good or service into contact with each other.
• Product and resource prices are set as a result of the choices made by demanders and suppliers in product and resource markets.
• Markets help society make some or all of its decisions about the five fundamental questions raised earlier.

Copyright © 2012 McGraw-Hill Australia Pty Ltd PowerPoint presentation to accompany Economic Principles 3e, by Jackson, McIver, Wilson & BajadaSlides prepared by George Bredon
1- 35
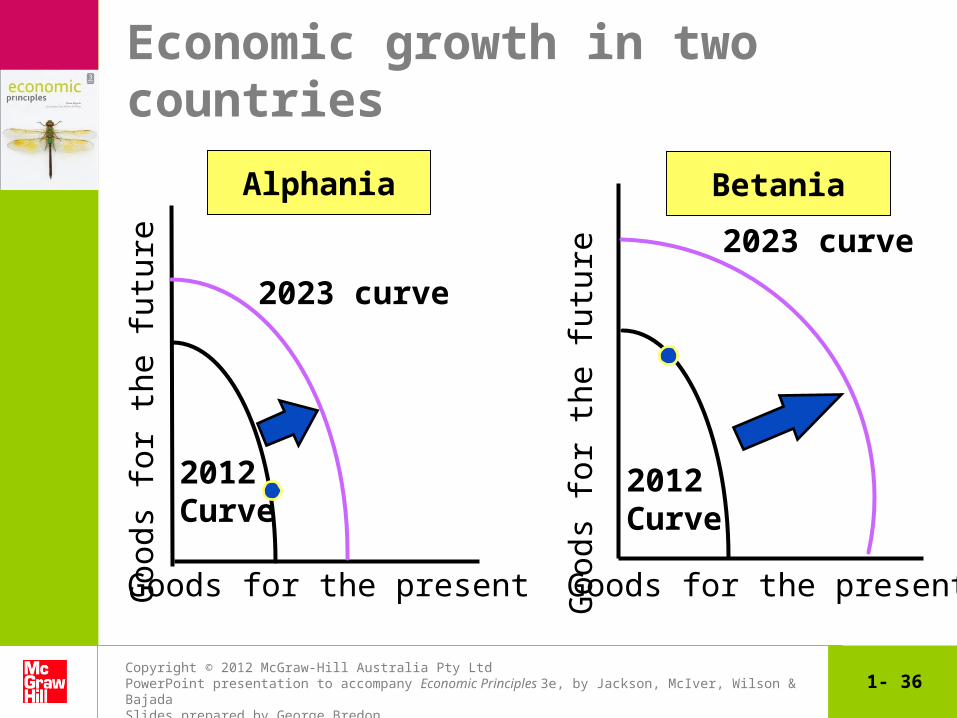
Present choices and future possibilities
The PPC can be used to:• illustrate the importance of society’s choice between
current and future consumption• demonstrate the economic basis for trade between
nations.
Copyright © 2012 McGraw-Hill Australia Pty Ltd PowerPoint presentation to accompany Economic Principles 3e, by Jackson, McIver, Wilson & BajadaSlides prepared by George Bredon
1- 36
Goods for the present Goods for the present
Goo
ds f
or t
he f
utur
e
Goo
ds f
or t
he f
utur
e
2012 Curve
2023 curve
2023 curve
2012 Curve
Alphania Betania
Economic growth in two countries
Copyright © 2012 McGraw-Hill Australia Pty Ltd PowerPoint presentation to accompany Economic Principles 3e, by Jackson, McIver, Wilson & BajadaSlides prepared by George Bredon
1- 37
Graphs and their meaning
Appendix to Chapter 1
Copyright © 2012 McGraw-Hill Australia Pty Ltd PowerPoint presentation to accompany Economic Principles 3e, by Jackson, McIver, Wilson & BajadaSlides prepared by George Bredon
1- 38
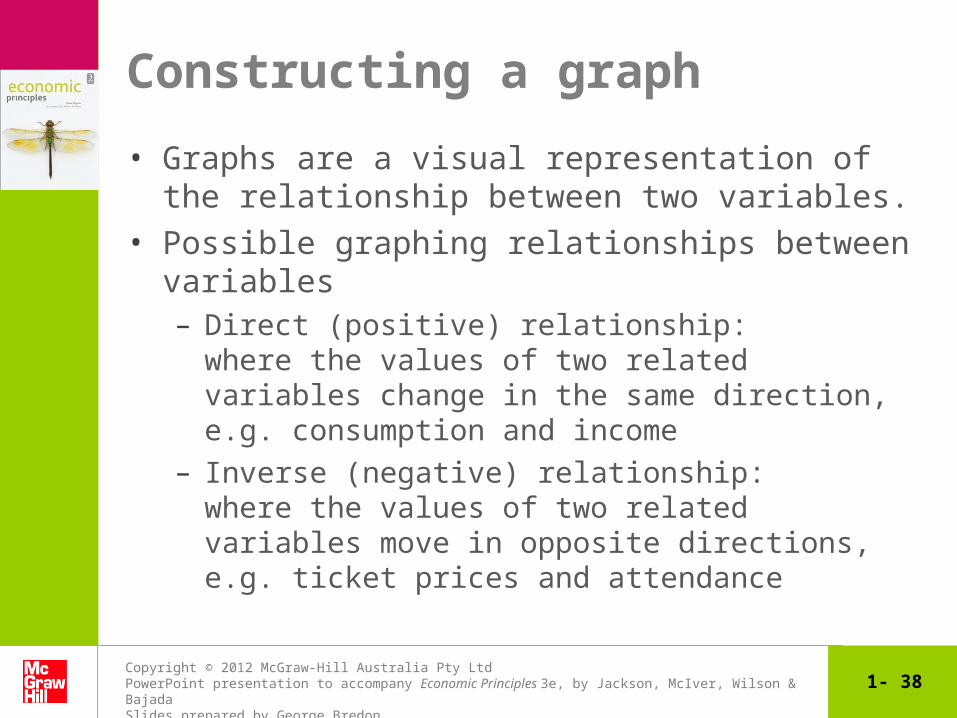
Constructing a graph
• Graphs are a visual representation of the relationship between two variables.
• Possible graphing relationships between variables– Direct (positive) relationship:
where the values of two related variables change in the same direction, e.g. consumption and income
– Inverse (negative) relationship: where the values of two related variables move in opposite directions, e.g. ticket prices and attendance
Copyright © 2012 McGraw-Hill Australia Pty Ltd PowerPoint presentation to accompany Economic Principles 3e, by Jackson, McIver, Wilson & BajadaSlides prepared by George Bredon
1- 39
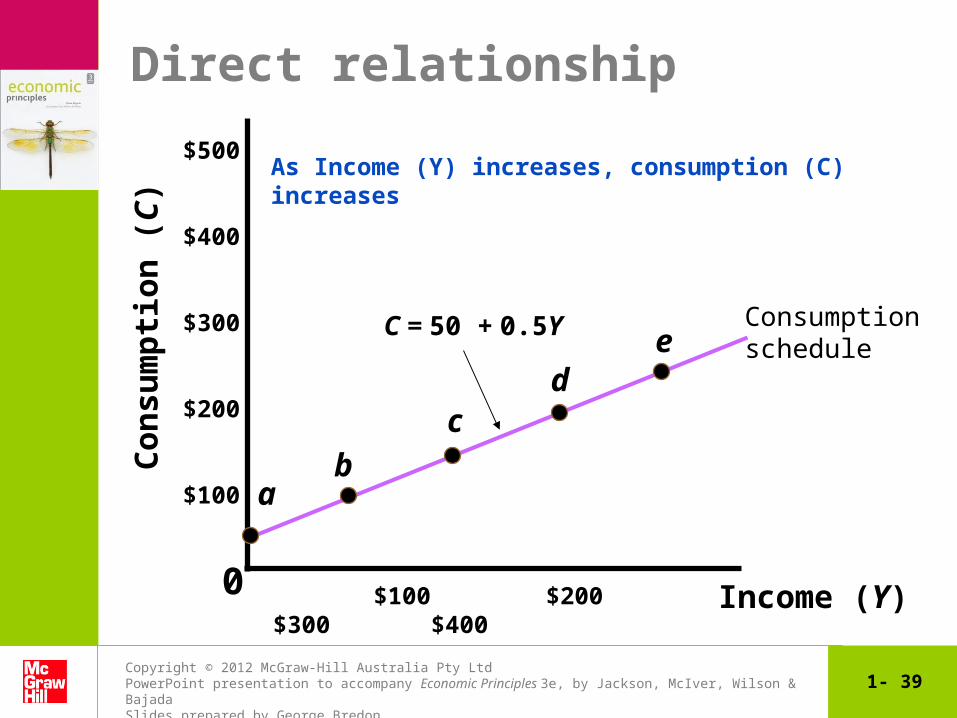
Direct relationship
0
$500
$400
$300
$200
$100
Co
nsu
mp
tio
n (
C)
Income (Y)
Consumptionschedule
C = 50 + 0.5Y
ab
cd
e
As Income (Y) increases, consumption (C) increases
$100 $200 $300 $400
Copyright © 2012 McGraw-Hill Australia Pty Ltd PowerPoint presentation to accompany Economic Principles 3e, by Jackson, McIver, Wilson & BajadaSlides prepared by George Bredon
1- 40
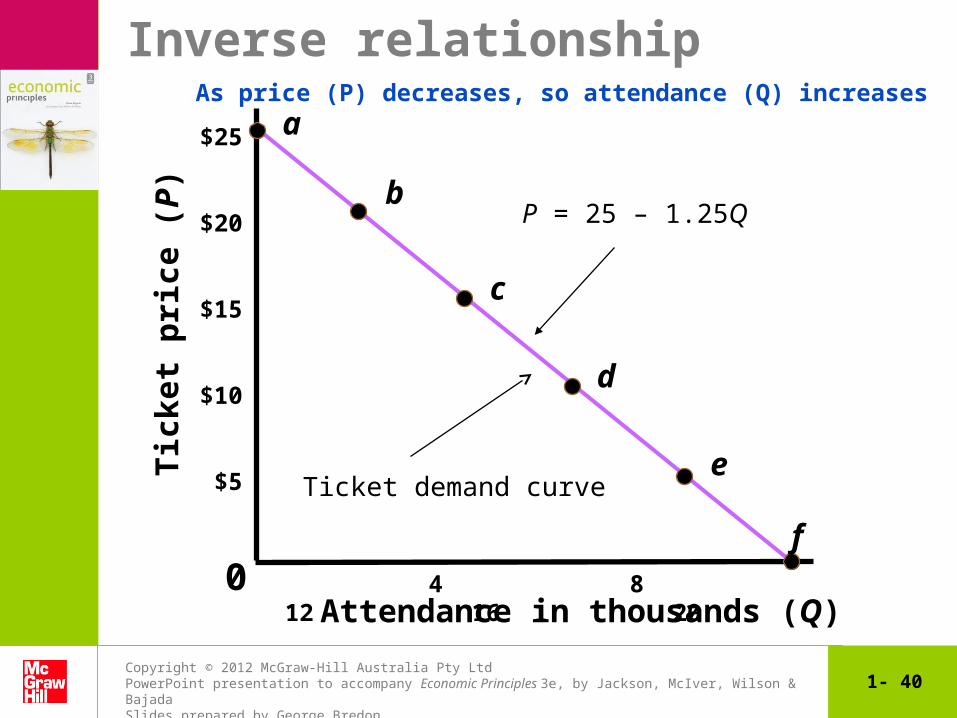
Inverse relationship
0
$25
$20
$15
$10
$5
Tic
ket
pri
ce (
P)
Attendance in thousands (Q)
a
b
c
d
f
As price (P) decreases, so attendance (Q) increases
e
P = 25 – 1.25Q
Ticket demand curve
4 8 12 16 20
Copyright © 2012 McGraw-Hill Australia Pty Ltd PowerPoint presentation to accompany Economic Principles 3e, by Jackson, McIver, Wilson & BajadaSlides prepared by George Bredon
1- 41
Slope of a straight line• The slope is the ratio of the vertical change to the
corresponding horizontal change involved in moving between two points.
• Ratio stays constant for a straight line
Copyright © 2012 McGraw-Hill Australia Pty Ltd PowerPoint presentation to accompany Economic Principles 3e, by Jackson, McIver, Wilson & BajadaSlides prepared by George Bredon
1- 42
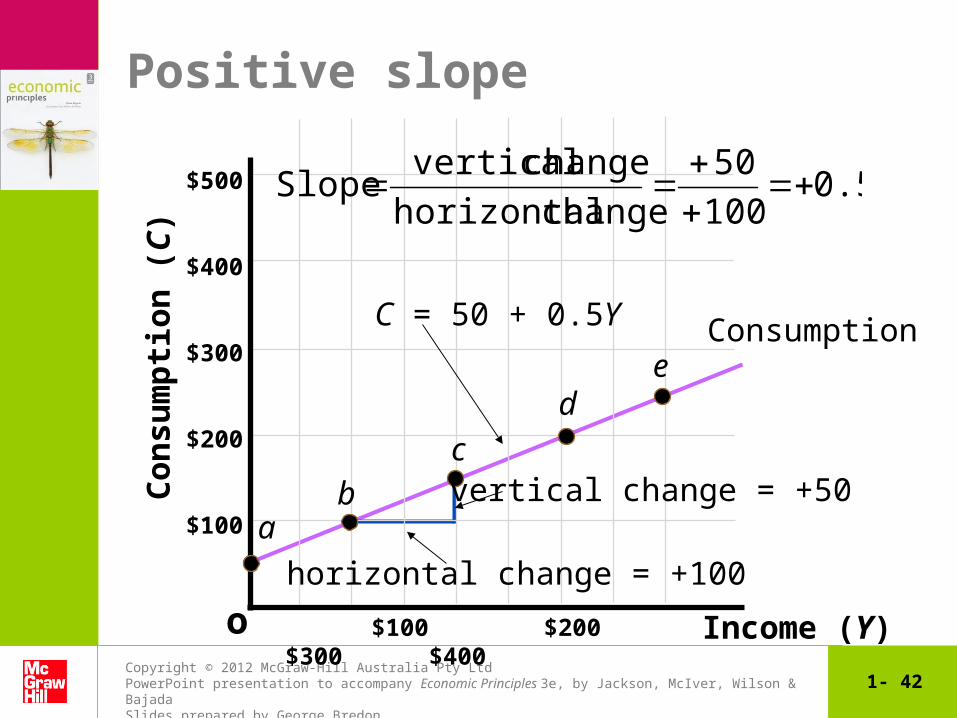
Positive slope
o
$500
$400
$300
$200
$100
Co
nsu
mp
tio
n (
C)
Income (Y)
ConsumptionC = 50 + 0.5Y
ab
c
de
vertical change = +50
horizontal change = +100
0.5100
50
change horizontal
change verticalSlope
$100 $200 $300 $400
Copyright © 2012 McGraw-Hill Australia Pty Ltd PowerPoint presentation to accompany Economic Principles 3e, by Jackson, McIver, Wilson & BajadaSlides prepared by George Bredon
1- 43
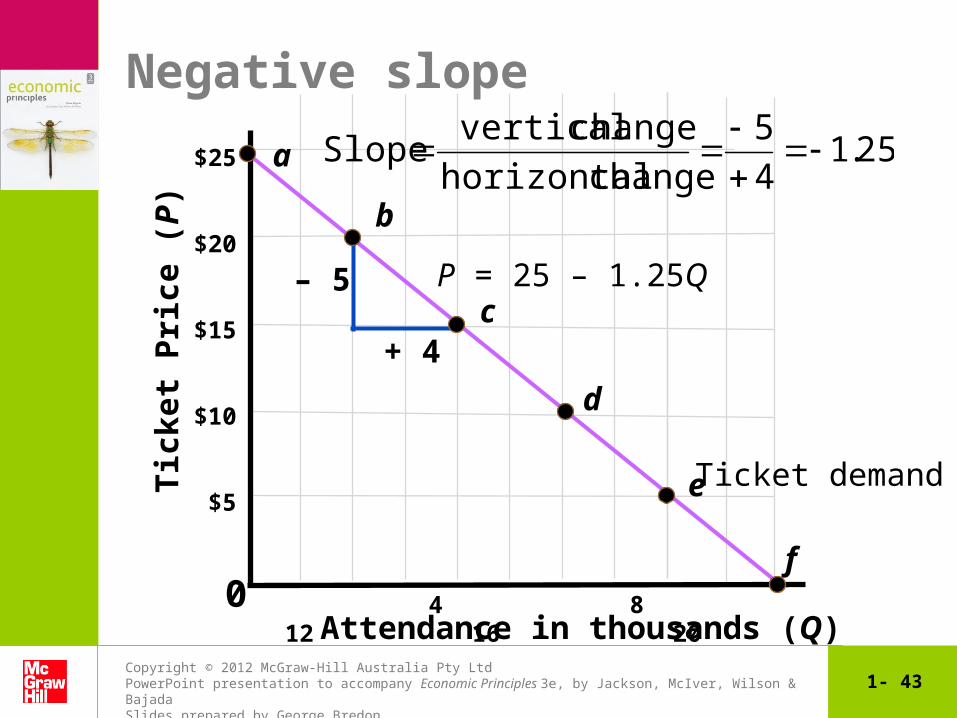
Negative slope
0
$25
$20
$15
$10
$5
Tic
ket
Pri
ce (
P)
Attendance in thousands (Q)
Ticket demand
P = 25 – 1.25Q
a
b
c
d
f
25.14
5
change horizontal
change verticalSlope
– 5
+ 4
e
4 8 12 16 20
Copyright © 2012 McGraw-Hill Australia Pty Ltd PowerPoint presentation to accompany Economic Principles 3e, by Jackson, McIver, Wilson & BajadaSlides prepared by George Bredon
1- 44
Three addenda• The discussion of the slope of a line needs the
following three additional comments:– measurement units– marginal analysis– infinite and zero slopes.
Copyright © 2012 McGraw-Hill Australia Pty Ltd PowerPoint presentation to accompany Economic Principles 3e, by Jackson, McIver, Wilson & BajadaSlides prepared by George Bredon
1- 45
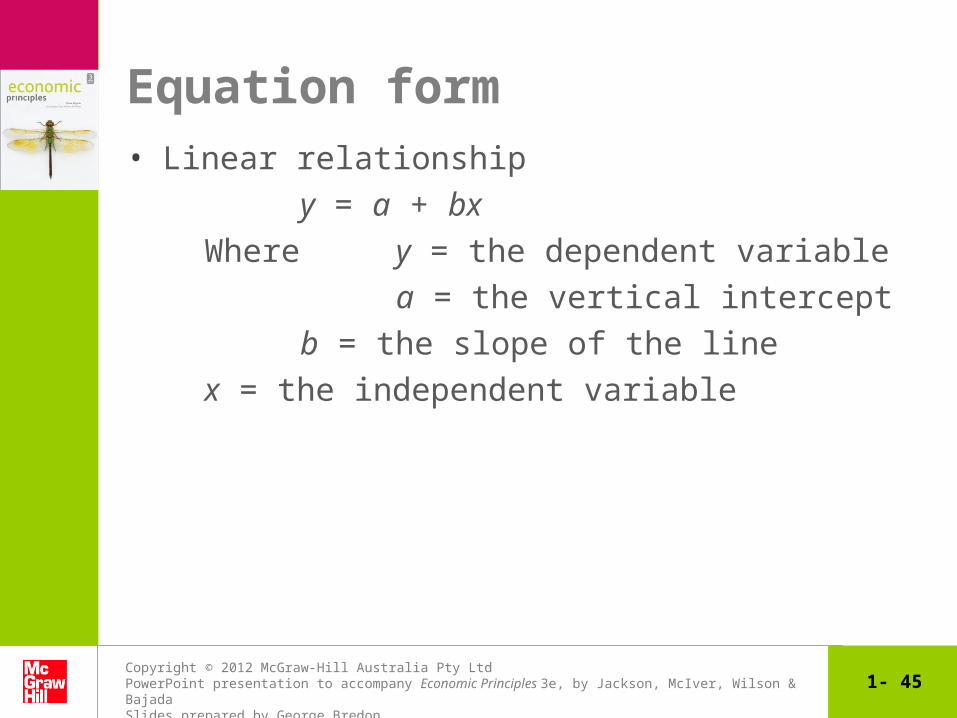
Equation form• Linear relationship
y = a + bx
Where y = the dependent variable
a = the vertical intercept
b = the slope of the line
x = the independent variable
Copyright © 2012 McGraw-Hill Australia Pty Ltd PowerPoint presentation to accompany Economic Principles 3e, by Jackson, McIver, Wilson & BajadaSlides prepared by George Bredon
1- 46
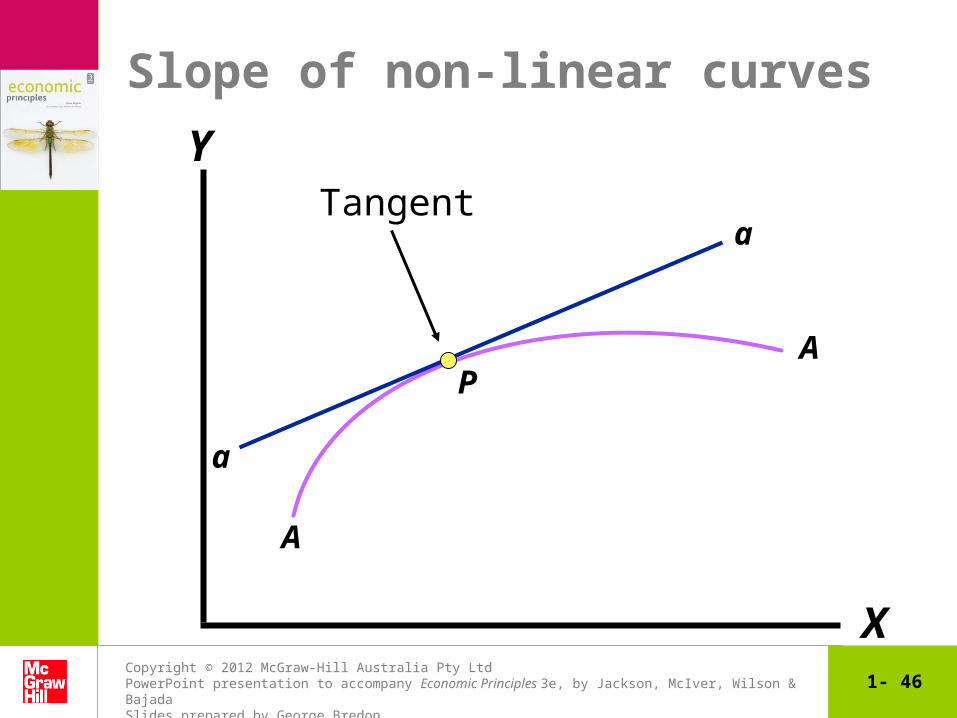
Slope of non-linear curves
Tangent
A
A
a
a
X
Y
P
Copyright © 2012 McGraw-Hill Australia Pty Ltd PowerPoint presentation to accompany Economic Principles 3e, by Jackson, McIver, Wilson & BajadaSlides prepared by George Bredon
1- 47
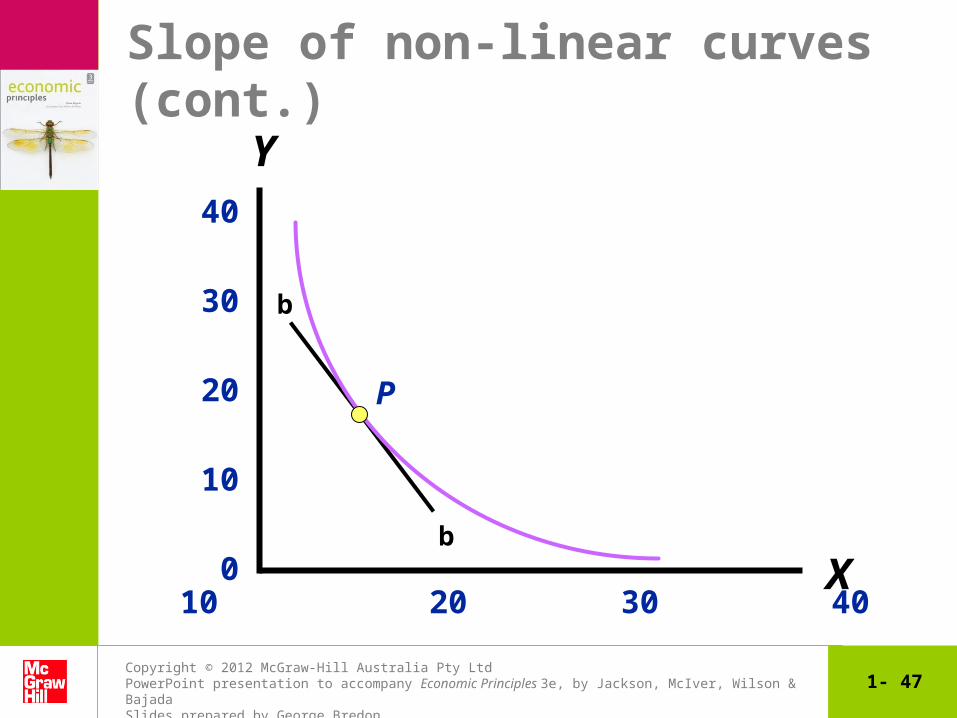
Slope of non-linear curves (cont.)
X
Y40
30
20
10
0
P
b
b
10 20 30 40
Copyright © 2012 McGraw-Hill Australia Pty Ltd PowerPoint presentation to accompany Economic Principles 3e, by Jackson, McIver, Wilson & BajadaSlides prepared by George Bredon
1- 48
Next chapter
Demand and supply