Embed Size (px)
Citation preview

Copyright © 2010, Scryer Analytics, LLC. All rights reserved.
Optimizing SAS System Performance− A Platform PerspectivePatrick McDonaldScryer Analytics, LLCJune 3, 2010
Copyright © 2010, Scryer Analytics, LLC. All rights reserved.
Presentation Overview
After this presentation you will know:• How your SAS code interacts with the hardware it runs
on.
• The different hardware configurations SAS may run on in your organization.
• How to help your IT organization diagnose and correct performance problems.
You probably won’t gain:• Any new SAS programming tips
• More than a very brief overview of efficient programming techniques

Copyright © 2010, Scryer Analytics, LLC. All rights reserved.
An Easy Question
What does this program do? Connects to DB2
SAS table of db2table
Disconnects from DB2
Creates x as previous y
Calculates Mean and N and outputs data
proc sql;connect to db2 (database=mydatabase);create table Table1 as select * from connection to db2 ( select * from db2table);disconnect from db2;quit;
data View1 / view=View1; set Table1;retain x;output;x=y; run;
proc summary data=View1 NWAY; var _numeric_;class c1 c2 c3; output out =p.mymeans mean= M N=COUNT;run;
Copyright © 2010, Scryer Analytics, LLC. All rights reserved.
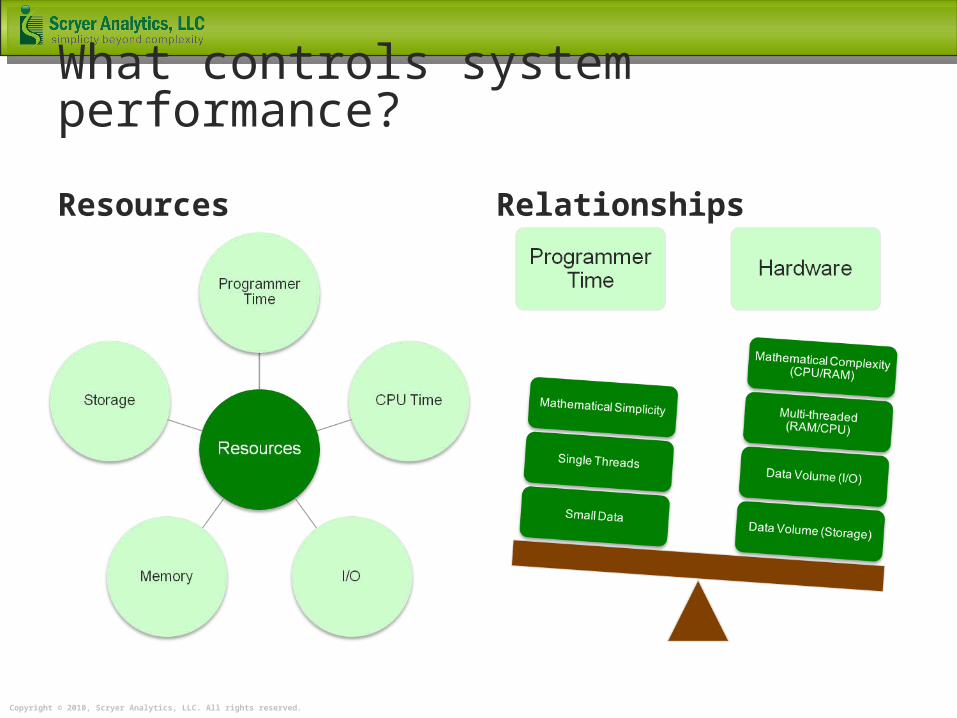
What controls system performance?
Resources Relationships
Copyright © 2010, Scryer Analytics, LLC. All rights reserved.
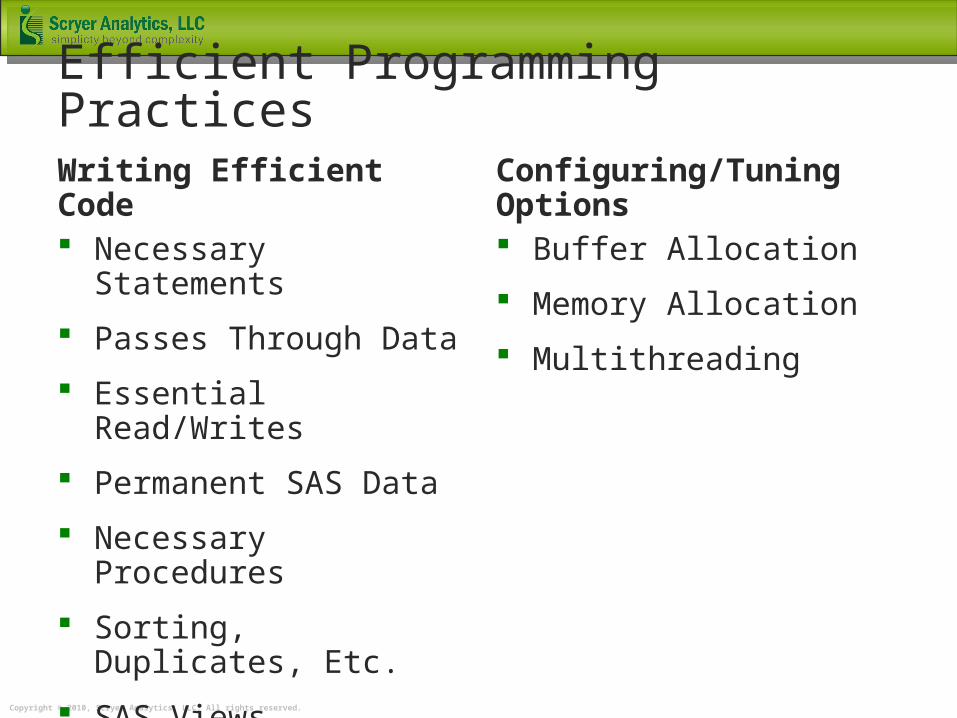
Efficient Programming Practices
Writing Efficient Code Necessary Statements
Passes Through Data
Essential Read/Writes
Permanent SAS Data
Necessary Procedures
Sorting, Duplicates, Etc.
SAS Views
DBMS Optimization
Configuring/Tuning Options Buffer Allocation
Memory Allocation
Multithreading
Copyright © 2010, Scryer Analytics, LLC. All rights reserved.
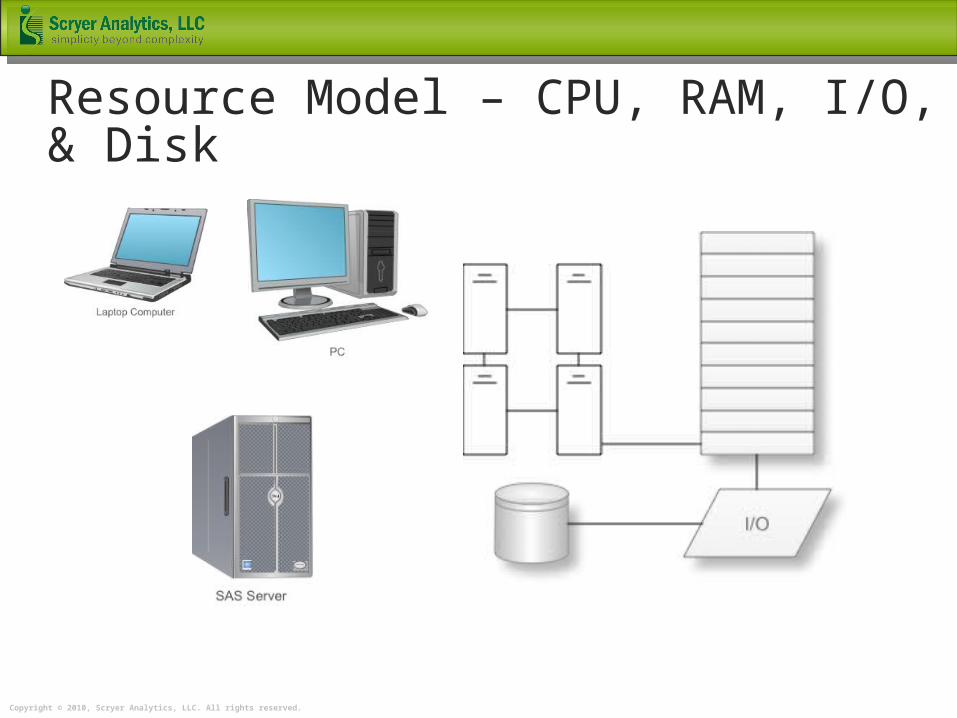
Resource Model – CPU, RAM, I/O, & Disk
Copyright © 2010, Scryer Analytics, LLC. All rights reserved.
CPU
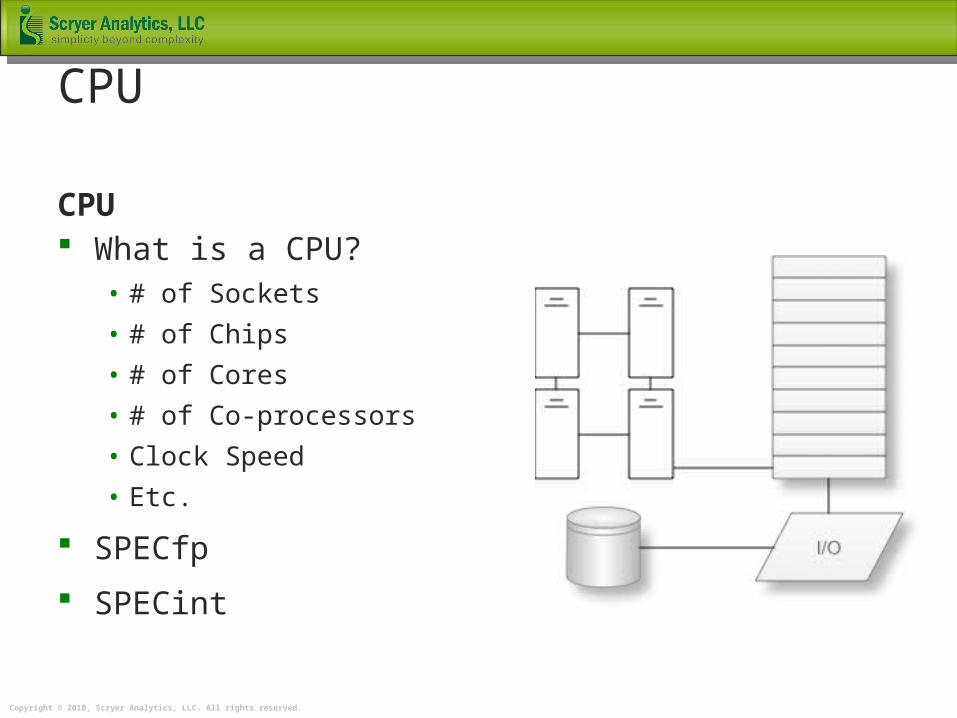
CPU What is a CPU?
• # of Sockets
• # of Chips
• # of Cores
• # of Co-processors
• Clock Speed
• Etc.
SPECfp
SPECint
Copyright © 2010, Scryer Analytics, LLC. All rights reserved.
RAM
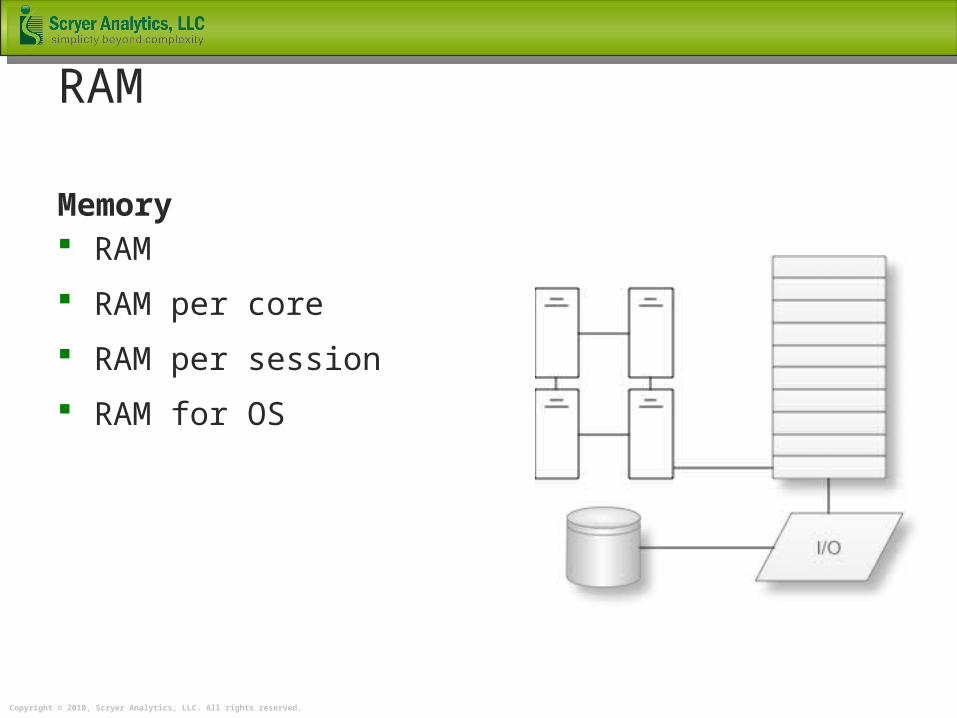
Memory RAM
RAM per core
RAM per session
RAM for OS
Copyright © 2010, Scryer Analytics, LLC. All rights reserved.
I/O
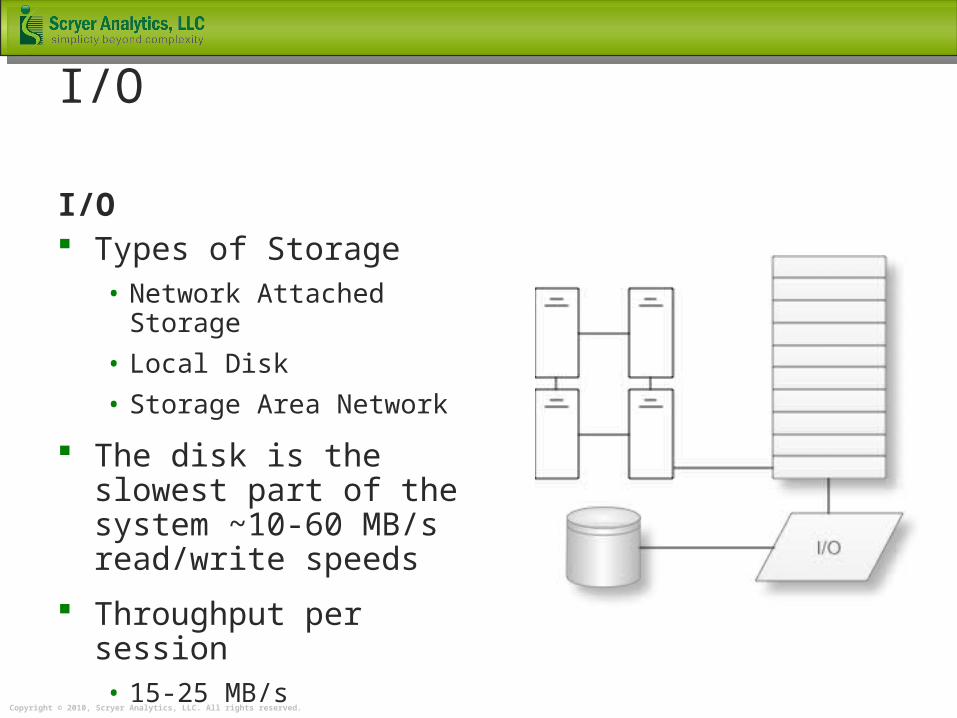
I/O Types of Storage
• Network Attached Storage
• Local Disk
• Storage Area Network
The disk is the slowest part of the system ~10-60 MB/s read/write speeds
Throughput per session• 15-25 MB/s
• 50-75+ MB/s
Copyright © 2010, Scryer Analytics, LLC. All rights reserved.
A little more about storage
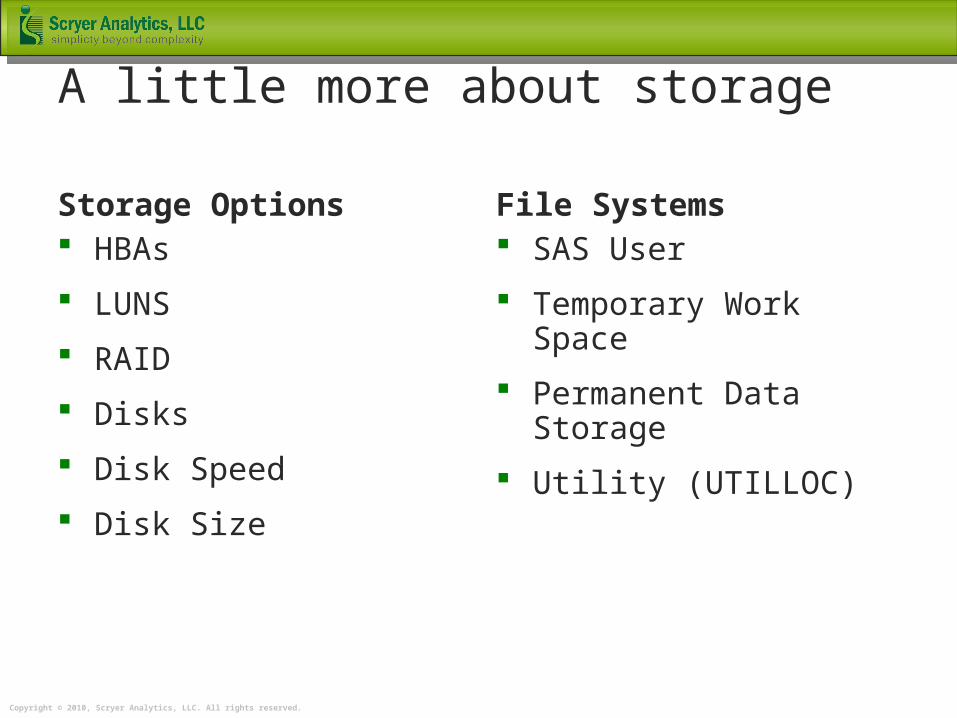
Storage Options HBAs
LUNS
RAID
Disks
Disk Speed
Disk Size
File Systems SAS User
Temporary Work Space
Permanent Data Storage
Utility (UTILLOC)

Copyright © 2010, Scryer Analytics, LLC. All rights reserved.
RAID Configurations in SAS Environments
Copyright © 2010, Scryer Analytics, LLC. All rights reserved.
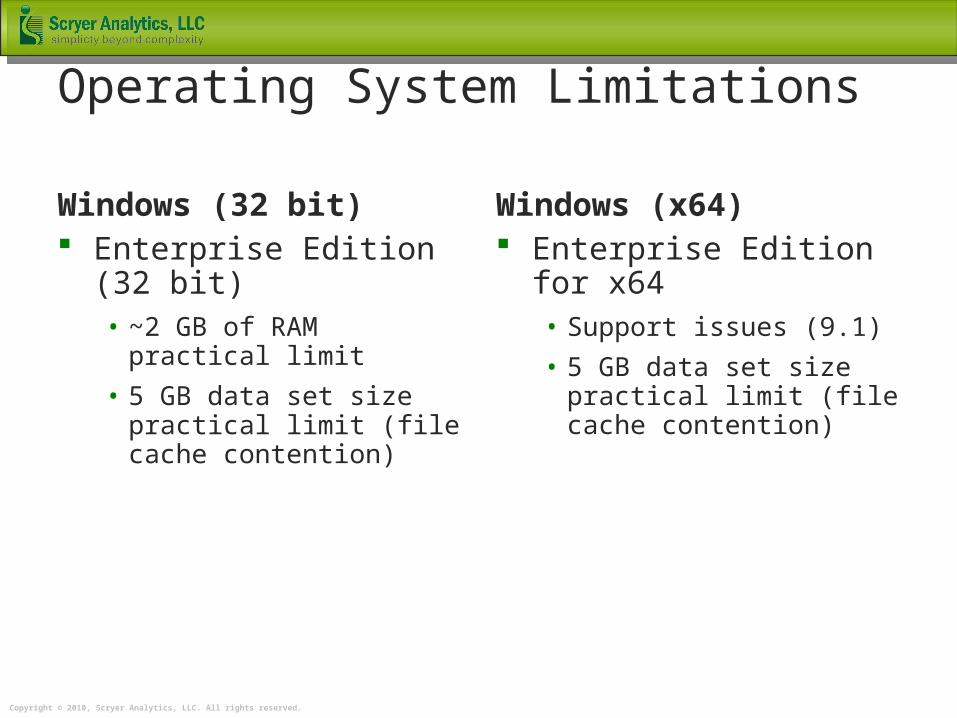
Operating System Limitations
Windows (32 bit) Enterprise Edition (32 bit)
• ~2 GB of RAM practical limit
• 5 GB data set size practical limit (file cache contention)
Windows (x64) Enterprise Edition for x64
• Support issues (9.1)
• 5 GB data set size practical limit (file cache contention)

Copyright © 2010, Scryer Analytics, LLC. All rights reserved.
Operating System Limitations
Windows (Itanium) Enterprise Edition
(Itanium)• 10 GB data set size
practical limit (file cache contention)
Unix (64 bit) HPUX, Solaris, AIX etc.
• Limited by hardware only
• Access to additional memory
• No file cache contention issues
Copyright © 2010, Scryer Analytics, LLC. All rights reserved.
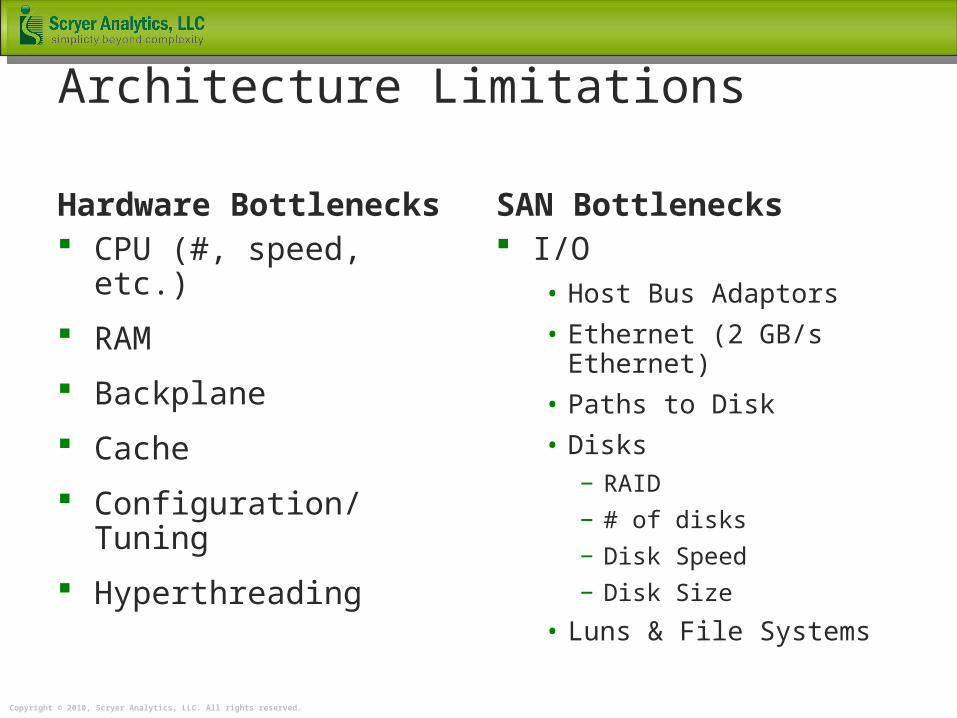
Architecture Limitations
Hardware Bottlenecks CPU (#, speed, etc.)
RAM
Backplane
Cache
Configuration/Tuning
Hyperthreading
SAN Bottlenecks I/O
• Host Bus Adaptors
• Ethernet (2 GB/s Ethernet)
• Paths to Disk
• Disks− RAID
− # of disks
− Disk Speed
− Disk Size
• Luns & File Systems
Copyright © 2010, Scryer Analytics, LLC. All rights reserved.
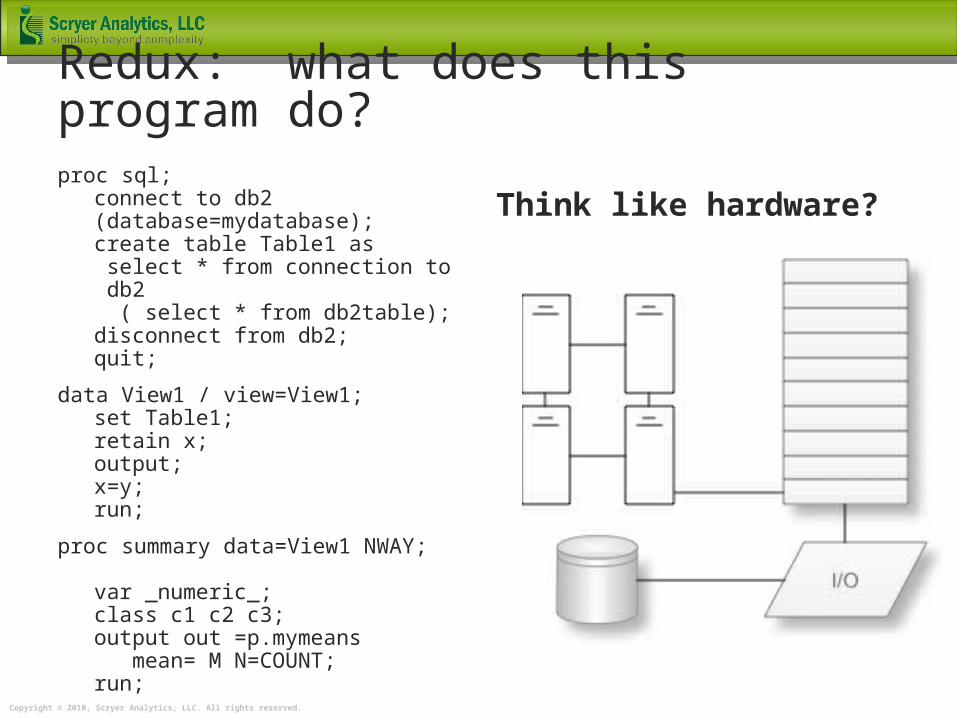
Redux: what does this program do?
Think like hardware?proc sql;
connect to db2 (database=mydatabase);create table Table1 as select * from connection to db2 ( select * from db2table);disconnect from db2;quit;
data View1 / view=View1; set Table1;retain x;output;x=y; run;
proc summary data=View1 NWAY; var _numeric_;class c1 c2 c3; output out =p.mymeans mean= M N=COUNT;run;

Copyright © 2010, Scryer Analytics, LLC. All rights reserved.
PROC SQL
What resources are used?proc sql;
connect to db2 (database=mydatabase);create table Table1 as select * from connection to db2 ( select * from db2table);disconnect from db2;quit;
data View1 / view=View1; set Table1;retain x;output;x=y; run;
proc summary data=View1 NWAY; var _numeric_;class c1 c2 c3; output out =p.mymeans mean= M N=COUNT;run;

Copyright © 2010, Scryer Analytics, LLC. All rights reserved.
Data Step
What resources are used?proc sql;
connect to db2 (database=mydatabase);create table Table1 as select * from connection to db2 ( select * from db2table);disconnect from db2;quit;
data View1 / view=View1; set Table1;retain x;output;x=y; run;
proc summary data=View1 NWAY; var _numeric_;class c1 c2 c3; output out =p.mymeans mean= M N=COUNT;run;

Copyright © 2010, Scryer Analytics, LLC. All rights reserved.
Proc Step
What resources are used?proc sql;
connect to db2 (database=mydatabase);create table Table1 as select * from connection to db2 ( select * from db2table);disconnect from db2;quit;
data View1 / view=View1; set Table1;retain x;output;x=y; run;
proc summary data=View1 NWAY; var _numeric_;class c1 c2 c3; output out =p.mymeans mean= M N=COUNT;run;
Copyright © 2010, Scryer Analytics, LLC. All rights reserved.
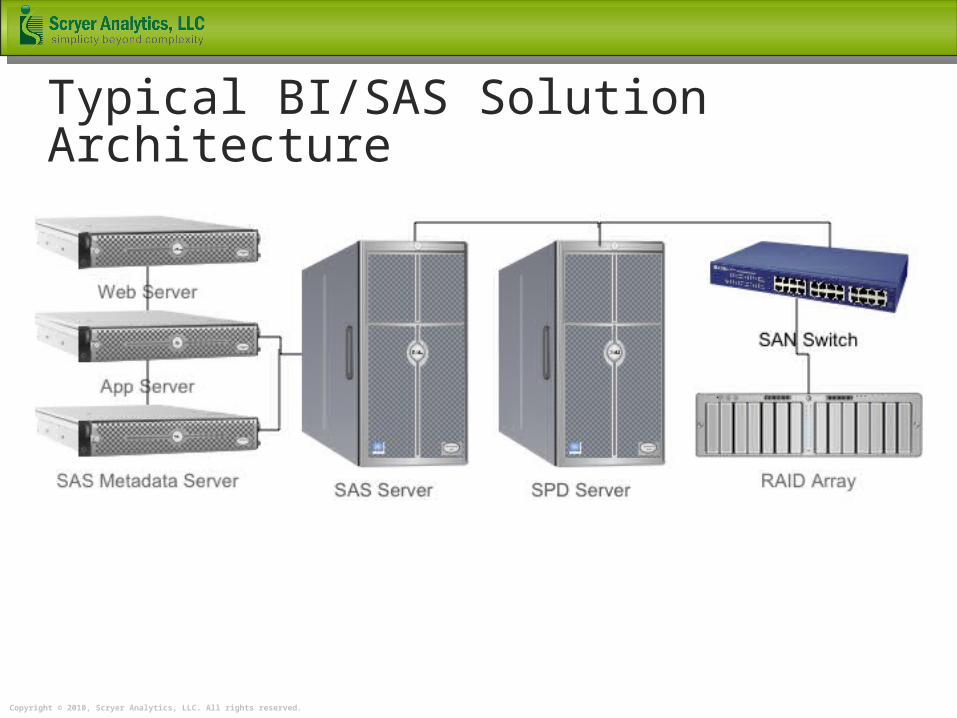
Typical BI/SAS Solution Architecture
Copyright © 2010, Scryer Analytics, LLC. All rights reserved.
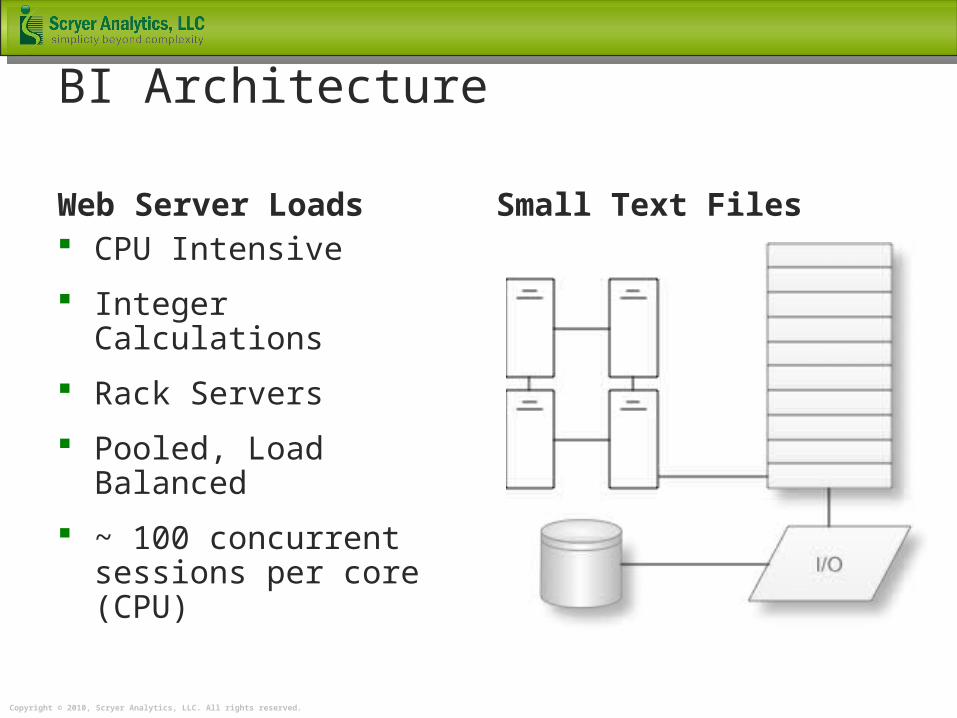
BI Architecture
Web Server Loads CPU Intensive
Integer Calculations
Rack Servers
Pooled, Load Balanced
~ 100 concurrent sessions per core (CPU)
Small Text Files
Copyright © 2010, Scryer Analytics, LLC. All rights reserved.
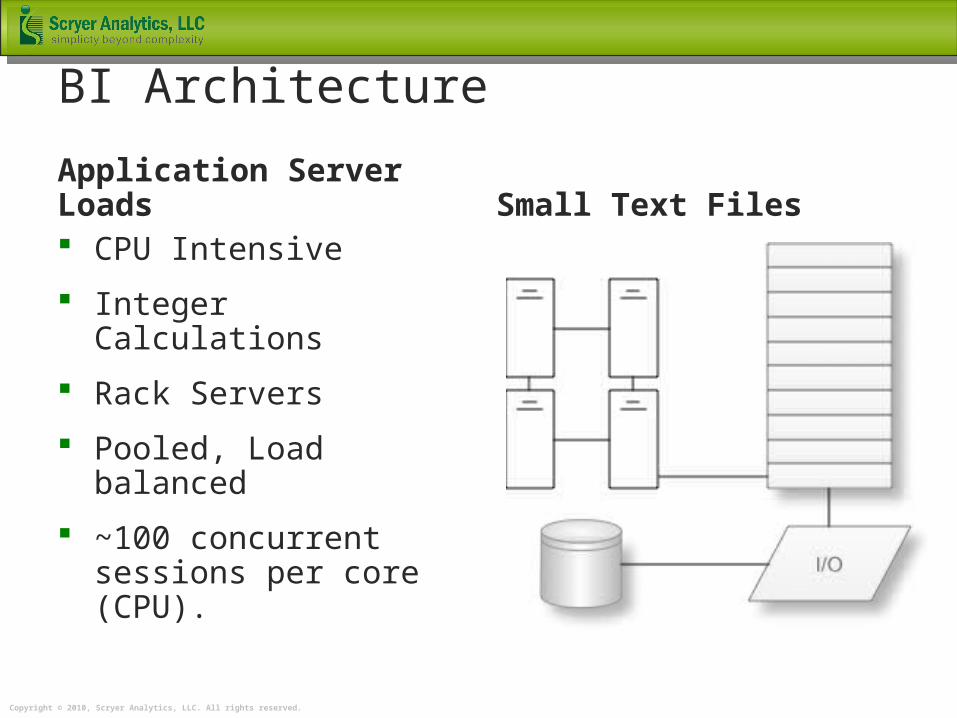
BI Architecture
Application Server Loads CPU Intensive
Integer Calculations
Rack Servers
Pooled, Load balanced
~100 concurrent sessions per core (CPU).
Small Text Files
Copyright © 2010, Scryer Analytics, LLC. All rights reserved.
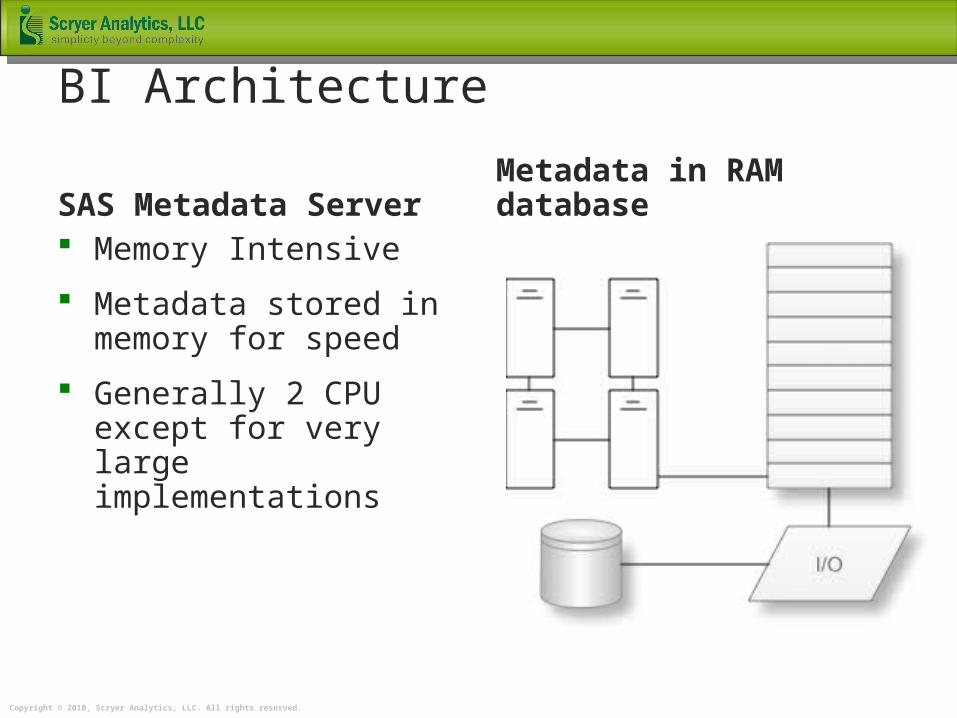
BI Architecture
SAS Metadata Server Memory Intensive
Metadata stored in memory for speed
Generally 2 CPU except for very large implementations
Metadata in RAM database
Copyright © 2010, Scryer Analytics, LLC. All rights reserved.
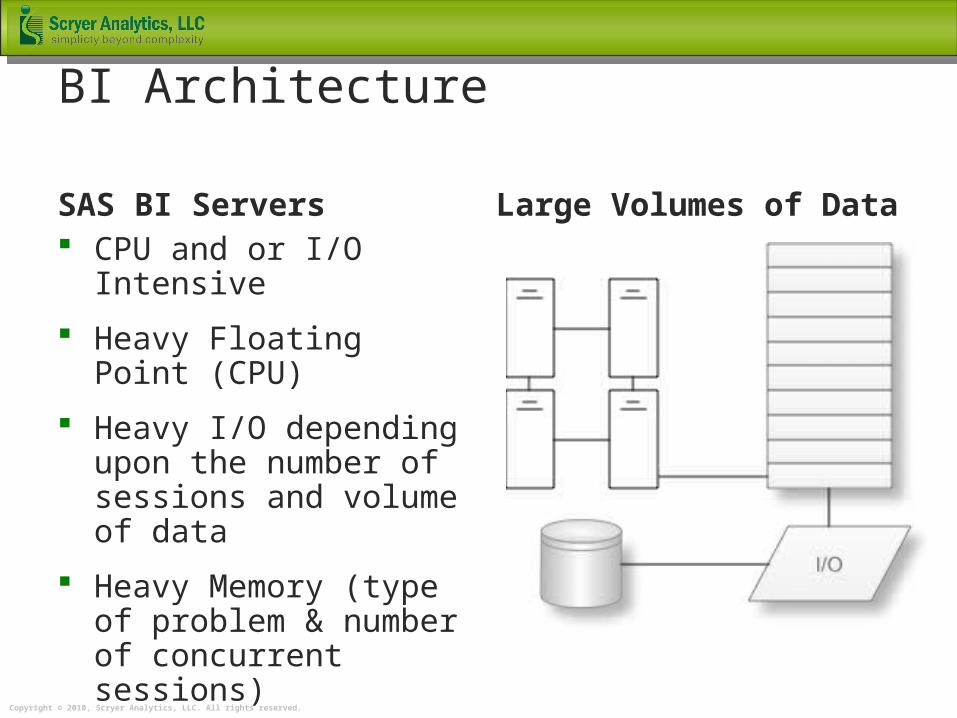
BI Architecture
SAS BI Servers CPU and or I/O Intensive
Heavy Floating Point (CPU)
Heavy I/O depending upon the number of sessions and volume of data
Heavy Memory (type of problem & number of concurrent sessions)
Large Volumes of Data

Copyright © 2010, Scryer Analytics, LLC. All rights reserved.
BI Architecture
SPD Server/RDBMS I/O Intensive
SAN Storage (75+ Mb/s sustained I/O throughput per session)
Large Volumes of Data
Copyright © 2010, Scryer Analytics, LLC. All rights reserved.
Questions

Copyright © 2010, Scryer Analytics, LLC. All rights reserved.
References
http://en.wikipedia.org/wiki/RAID
Optimizing SAS® Programs Course Notes
SGF 2009: How to maintain happy SAS users
SUGI 31: Solving SAS Performance Problems: Employing Host Based Tools
Copyright © 2010, Scryer Analytics, LLC. All rights reserved.
SIMPLICITYBEYOND
COMPLEXITY