Embed Size (px)
Citation preview
Copyright © 2010 Pearson Addison-Wesley. All rights reserved.
Chapter 10
One- and Two-Sample Tests of Hypotheses
Copyright © 2010 Pearson Addison-Wesley. All rights reserved.
Section 10.1
Statistical Hypotheses: General Concepts
Copyright © 2010 Pearson Addison-Wesley. All rights reserved. 10 - 3
Definition 10.1
Copyright © 2010 Pearson Addison-Wesley. All rights reserved.
Section 10.2
Testing a Statistical Hypothesis
Copyright © 2010 Pearson Addison-Wesley. All rights reserved. 10 - 5
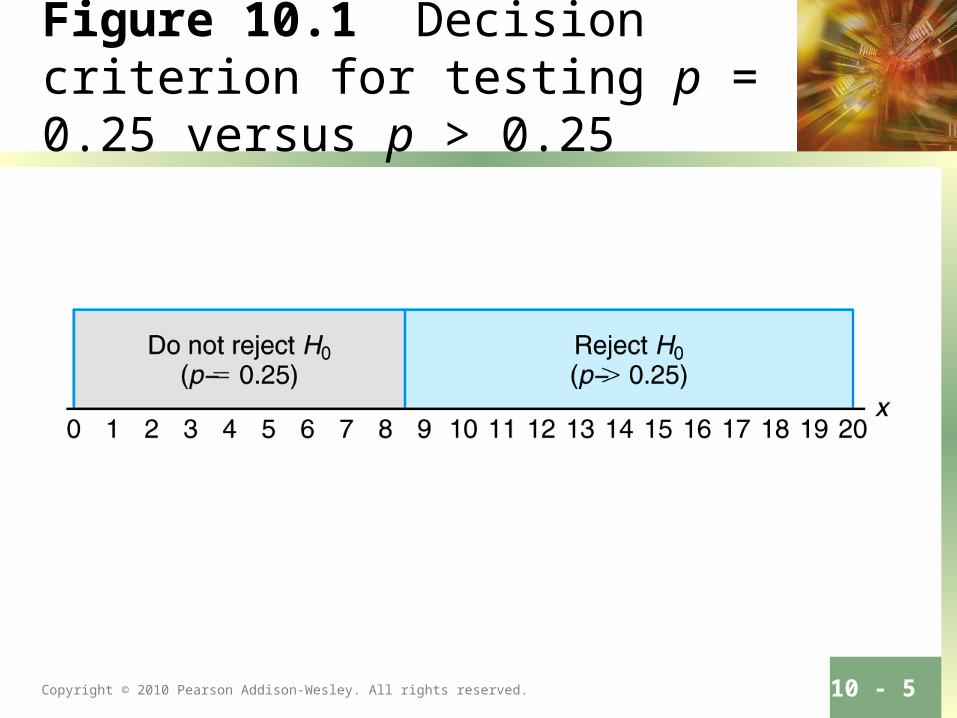
Figure 10.1 Decision criterion for testing p = 0.25 versus p > 0.25

Copyright © 2010 Pearson Addison-Wesley. All rights reserved. 10 - 6
Definition 10.2
Copyright © 2010 Pearson Addison-Wesley. All rights reserved. 10 - 7
Definition 10.3
Copyright © 2010 Pearson Addison-Wesley. All rights reserved. 10 - 8
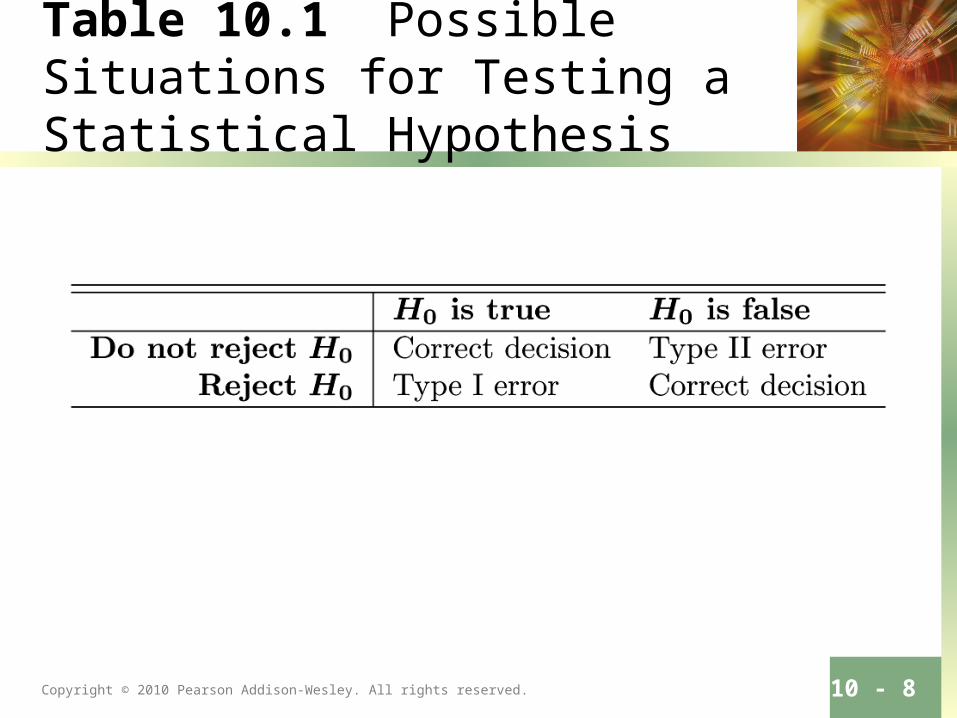
Table 10.1 Possible Situations for Testing a Statistical Hypothesis
Copyright © 2010 Pearson Addison-Wesley. All rights reserved. 10 - 9
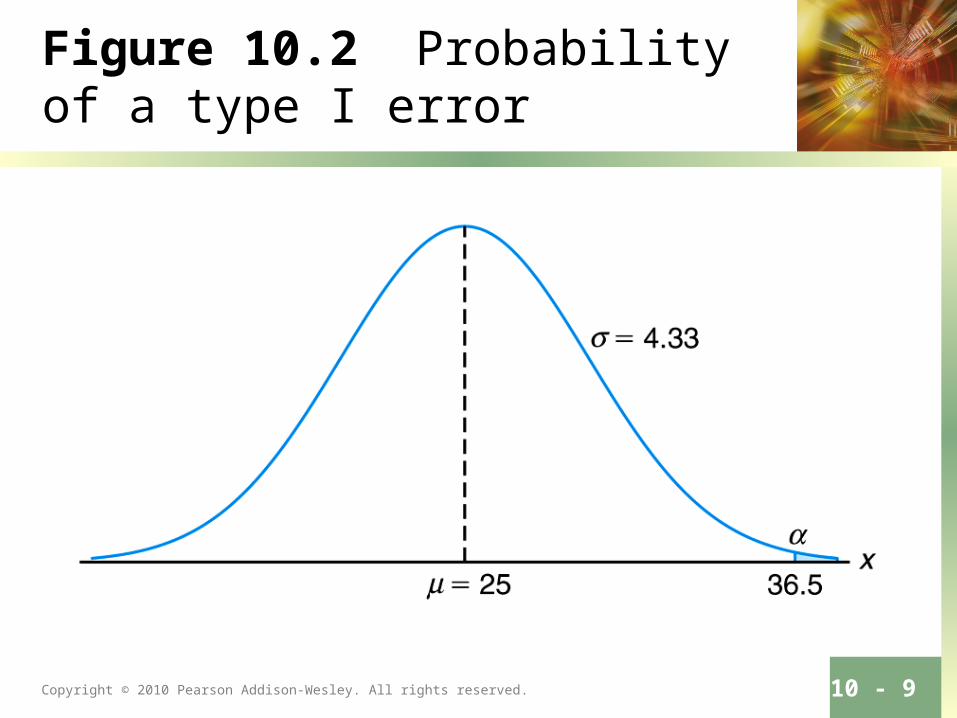
Figure 10.2 Probability of a type I error
Copyright © 2010 Pearson Addison-Wesley. All rights reserved. 10 - 10
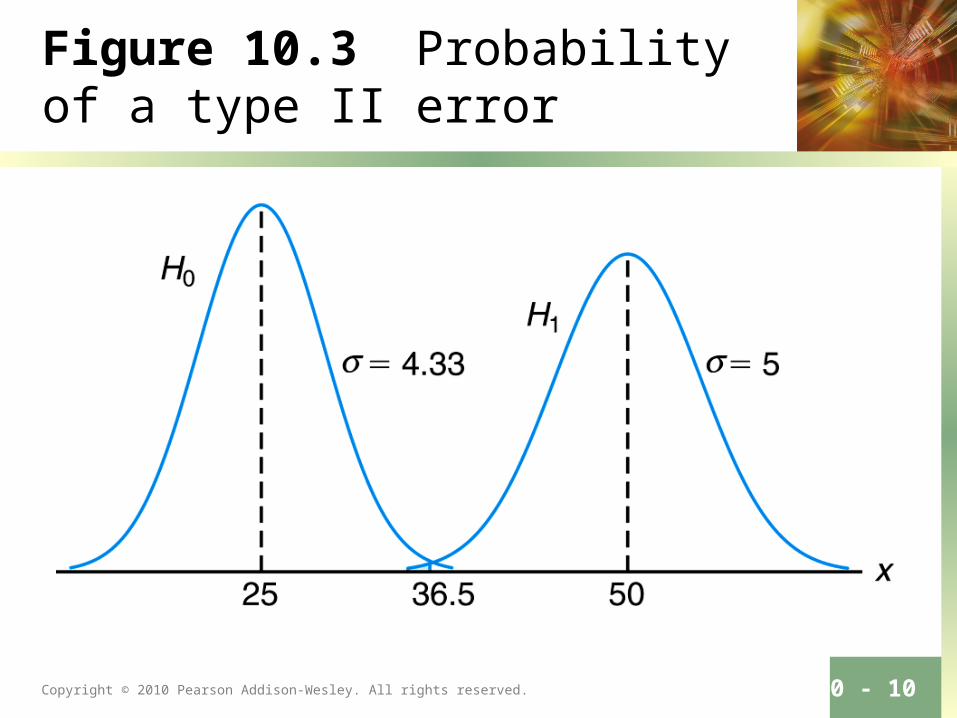
Figure 10.3 Probability of a type II error
Copyright © 2010 Pearson Addison-Wesley. All rights reserved. 10 - 11
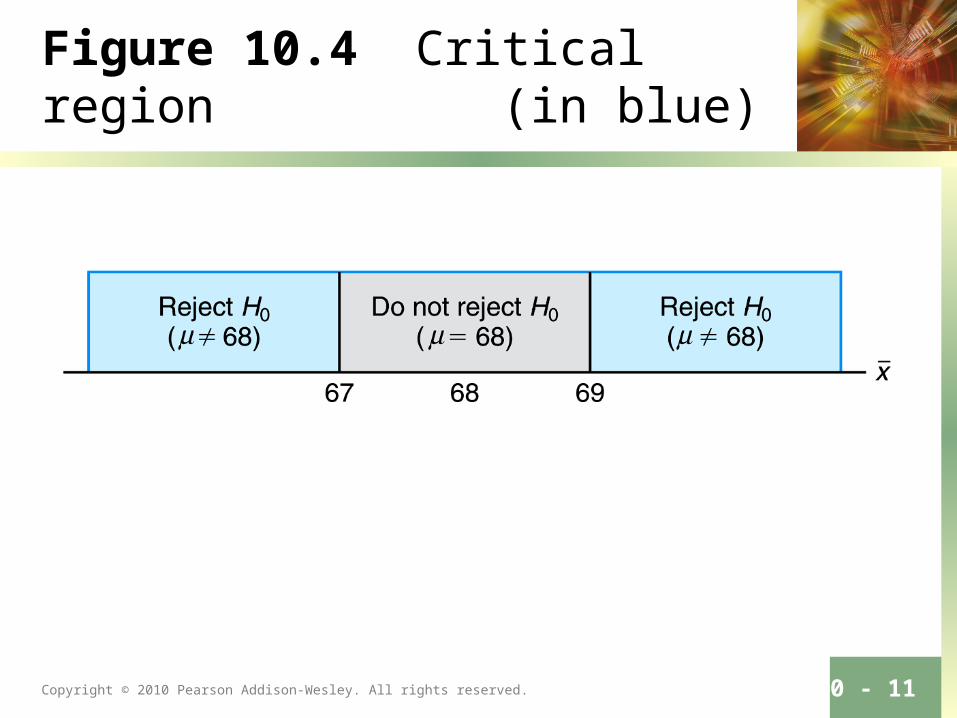
Figure 10.4 Critical region (in blue)
Copyright © 2010 Pearson Addison-Wesley. All rights reserved. 10 - 12
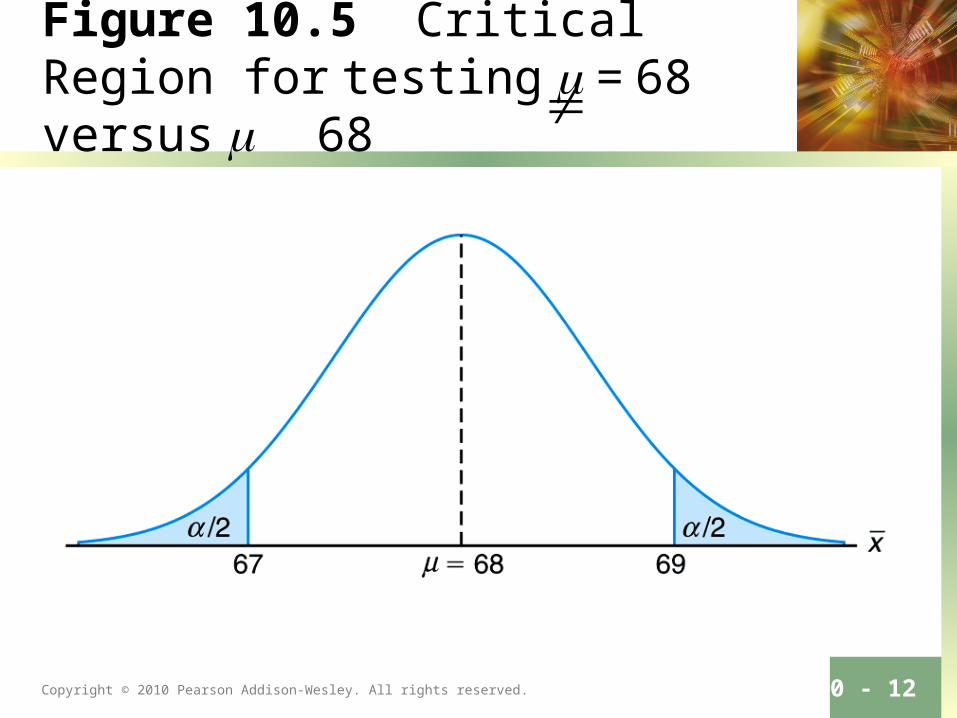
Figure 10.5 Critical Region for testing = 68 versus 68
Copyright © 2010 Pearson Addison-Wesley. All rights reserved. 10 - 13
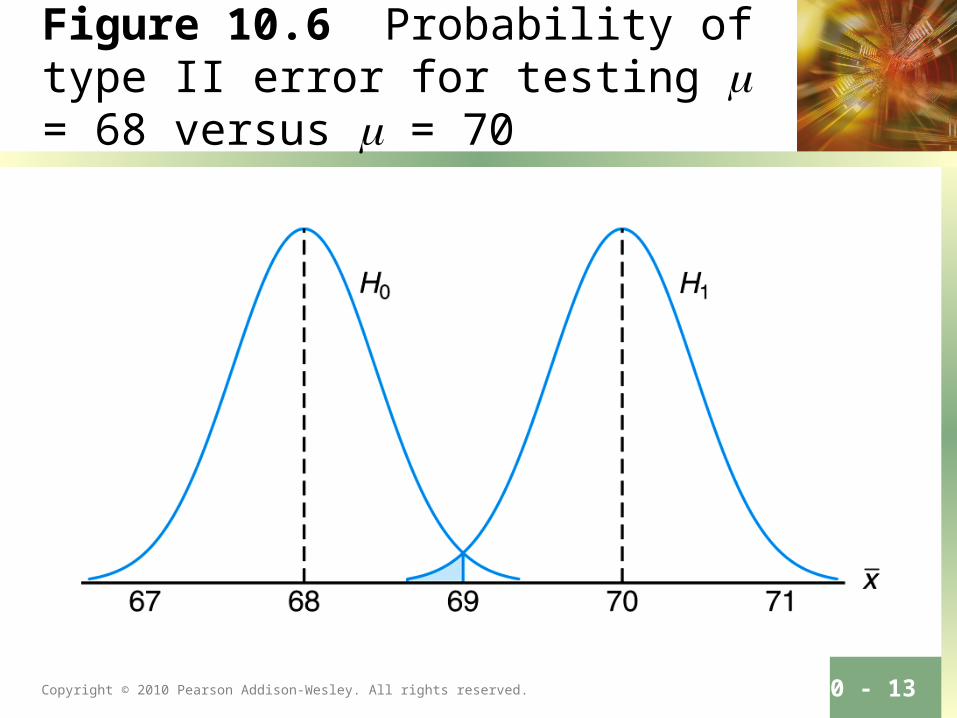
Figure 10.6 Probability of type II error for testing = 68 versus = 70
Copyright © 2010 Pearson Addison-Wesley. All rights reserved. 10 - 14
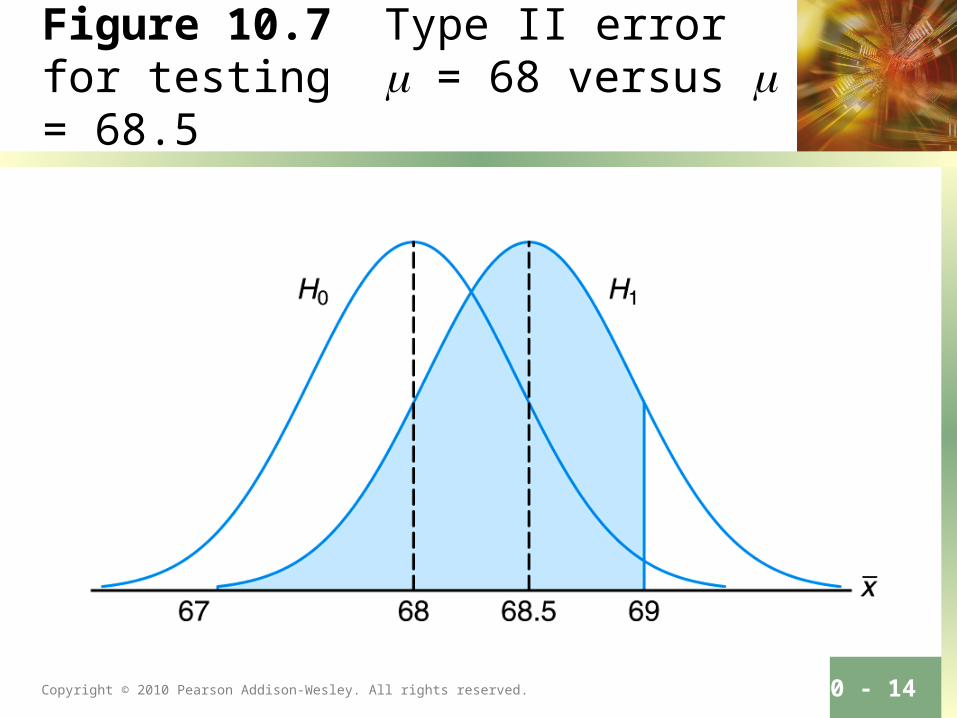
Figure 10.7 Type II error for testing = 68 versus = 68.5

Copyright © 2010 Pearson Addison-Wesley. All rights reserved. 10 - 15
Definition 10.4
Copyright © 2010 Pearson Addison-Wesley. All rights reserved.
Section 10.3
The Use of P-Values for Decision Making in Testing Hypotheses
Copyright © 2010 Pearson Addison-Wesley. All rights reserved. 10 - 17
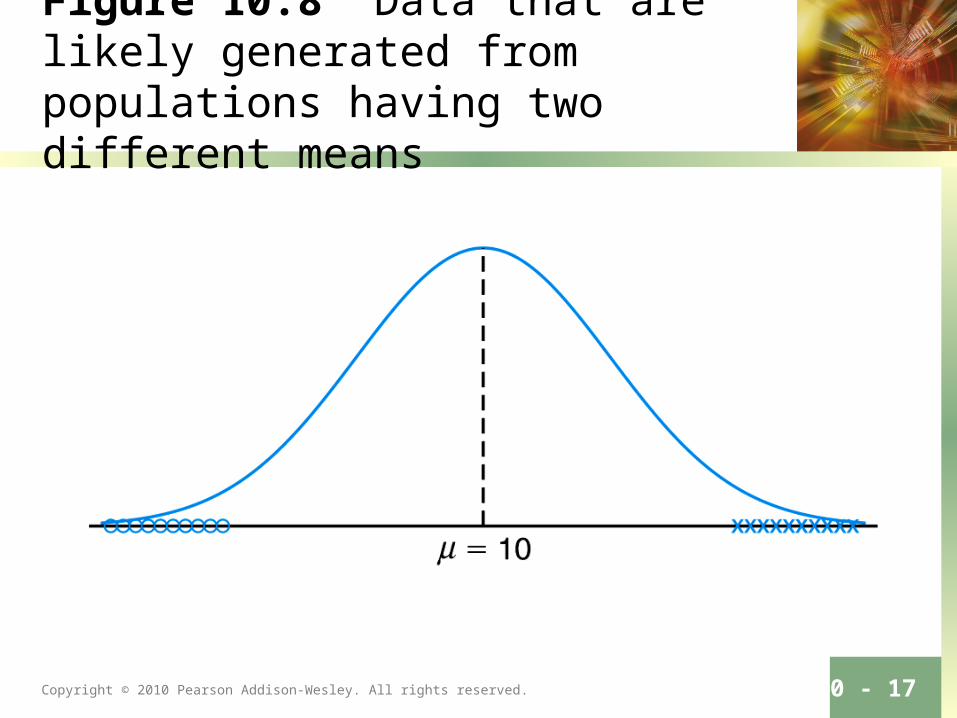
Figure 10.8 Data that are likely generated from populations having two different means
Copyright © 2010 Pearson Addison-Wesley. All rights reserved. 10 - 18
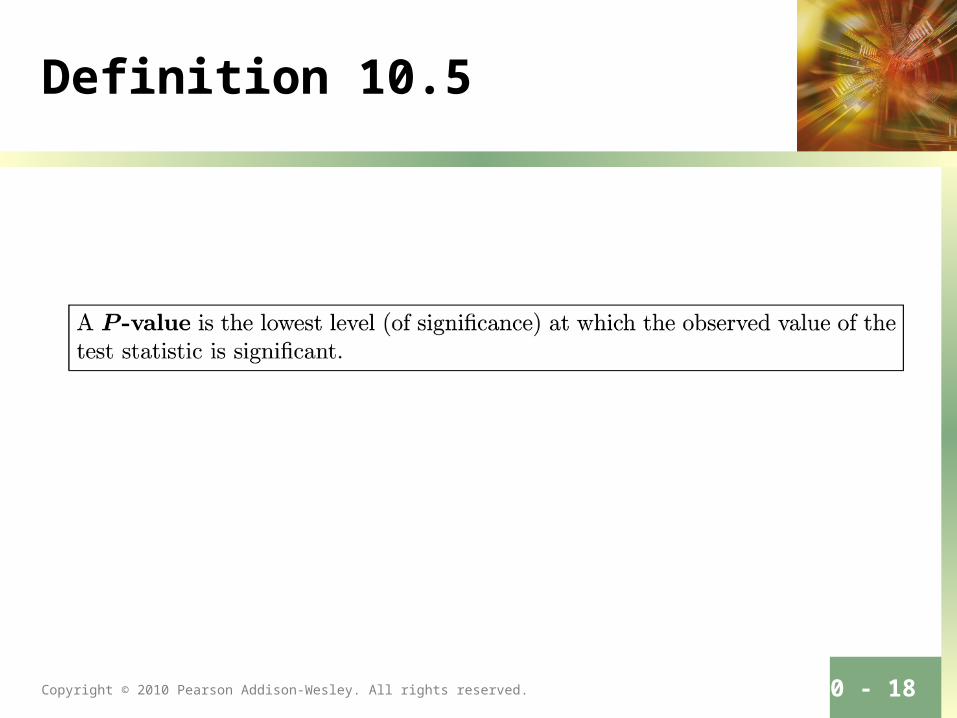
Definition 10.5
Copyright © 2010 Pearson Addison-Wesley. All rights reserved.
Section 10.4
Single Sample: Tests Concerning a Single Mean
Copyright © 2010 Pearson Addison-Wesley. All rights reserved. 10 - 20
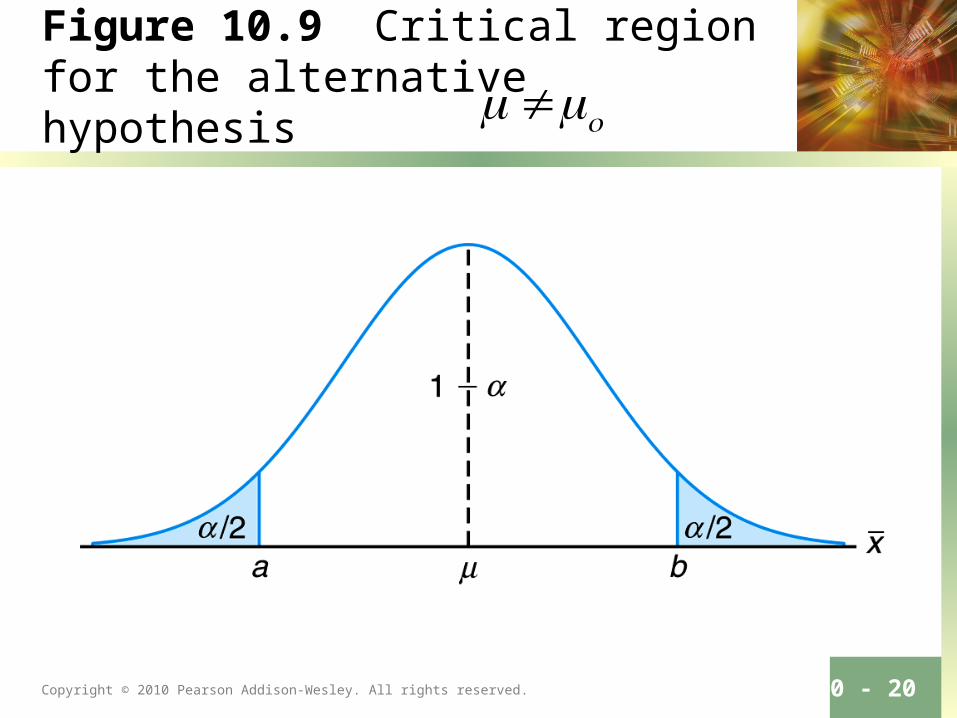
Figure 10.9 Critical region for the alternative hypothesis
Copyright © 2010 Pearson Addison-Wesley. All rights reserved. 10 - 21
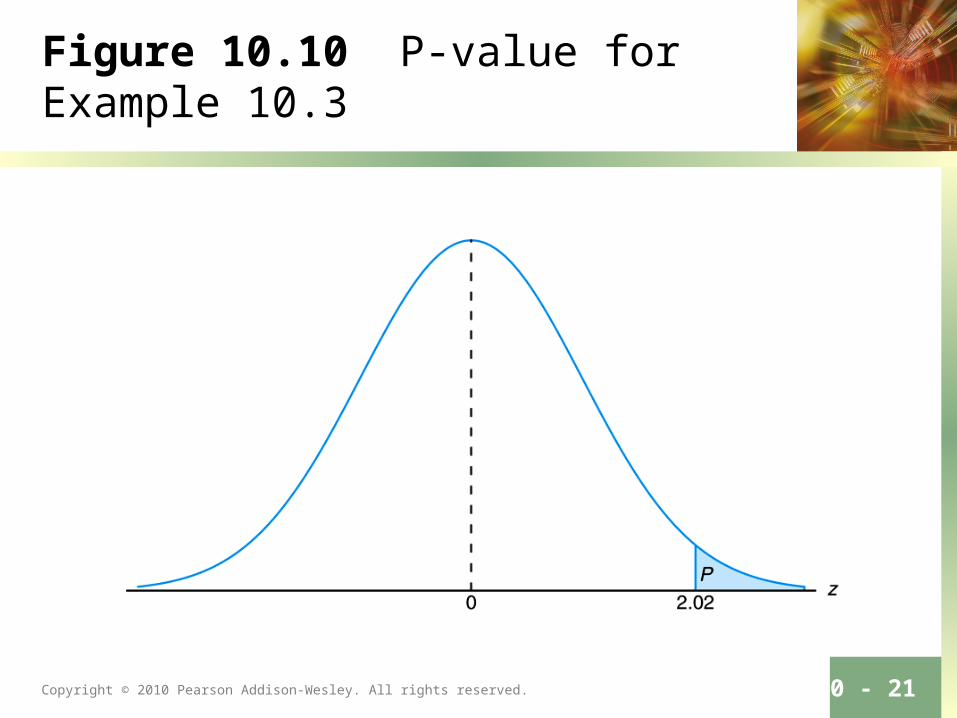
Figure 10.10 P-value for Example 10.3
Copyright © 2010 Pearson Addison-Wesley. All rights reserved. 10 - 22
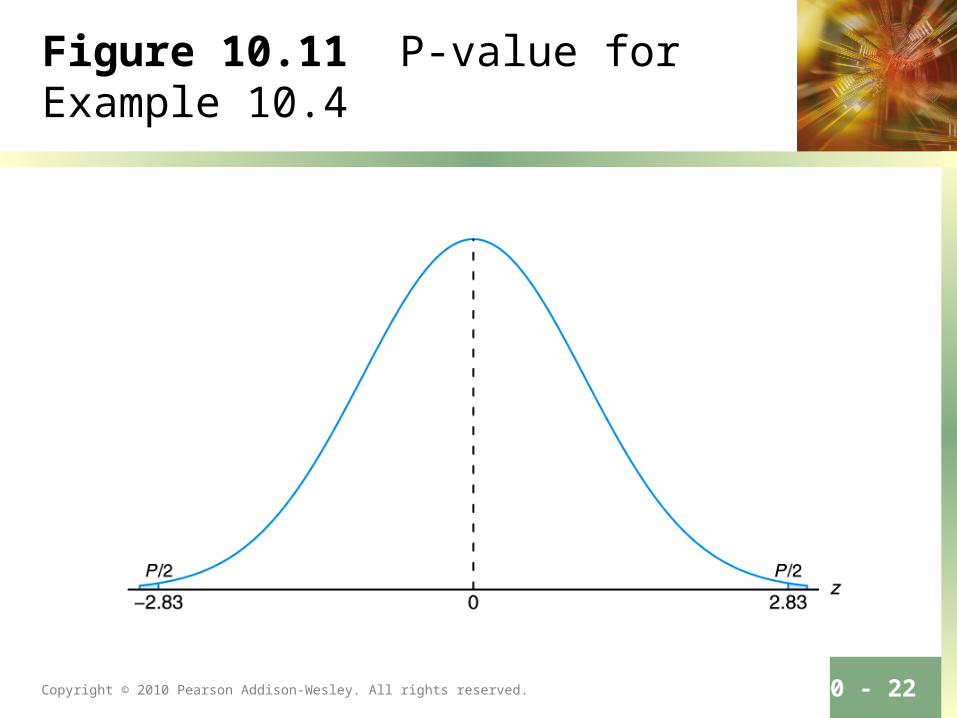
Figure 10.11 P-value for Example 10.4
Copyright © 2010 Pearson Addison-Wesley. All rights reserved. 10 - 23
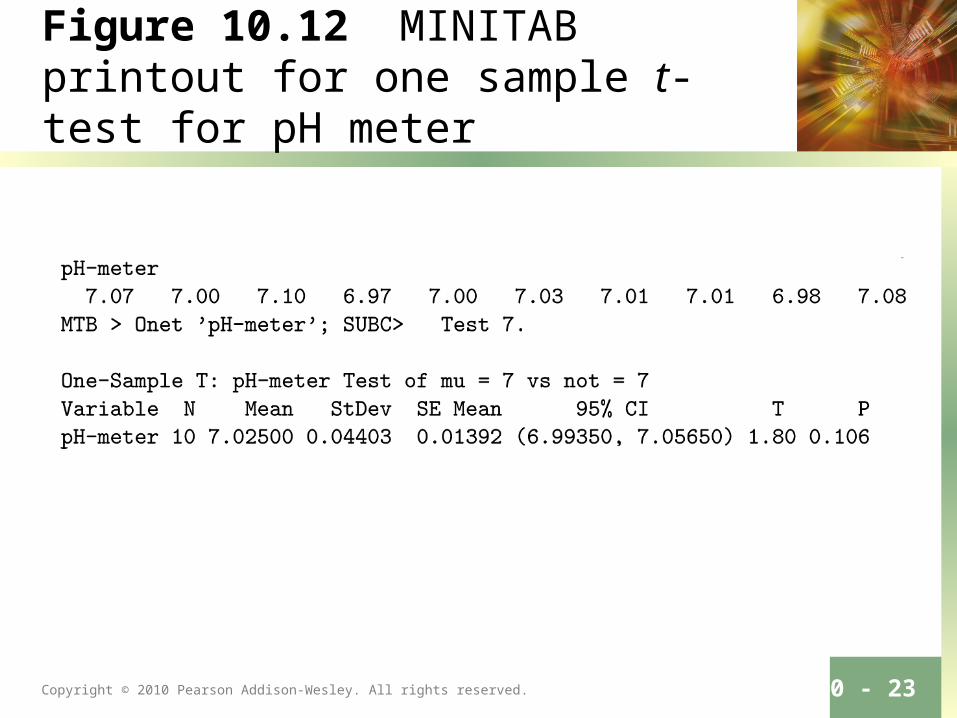
Figure 10.12 MINITAB printout for one sample t-test for pH meter
Copyright © 2010 Pearson Addison-Wesley. All rights reserved.
Section 10.5
Two Samples: Tests on Two Means
Copyright © 2010 Pearson Addison-Wesley. All rights reserved. 10 - 25
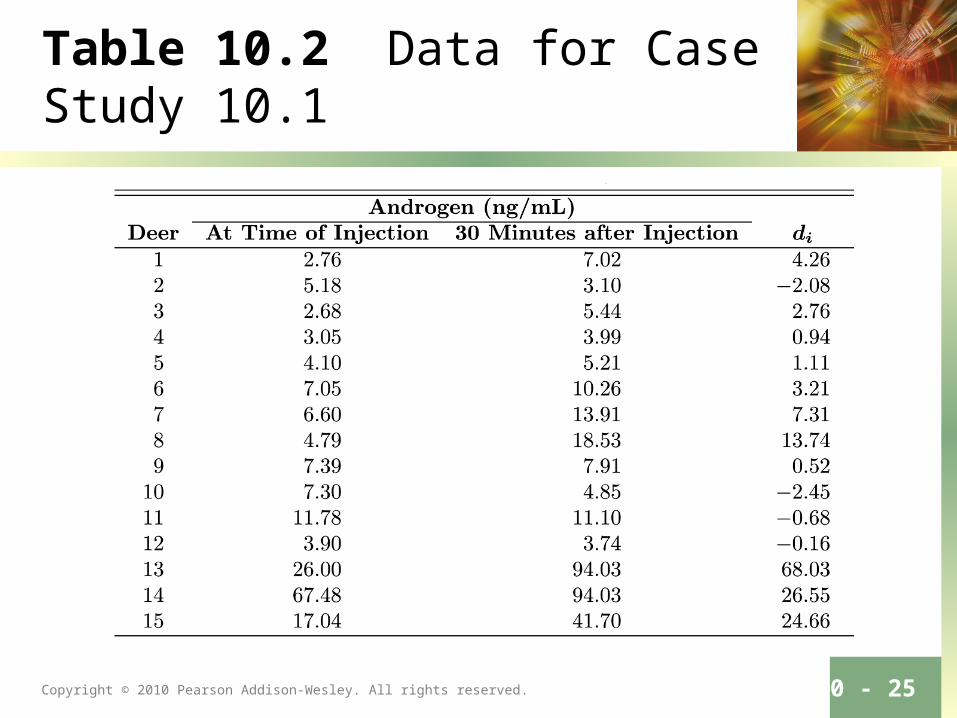
Table 10.2 Data for Case Study 10.1
Copyright © 2010 Pearson Addison-Wesley. All rights reserved. 10 - 26
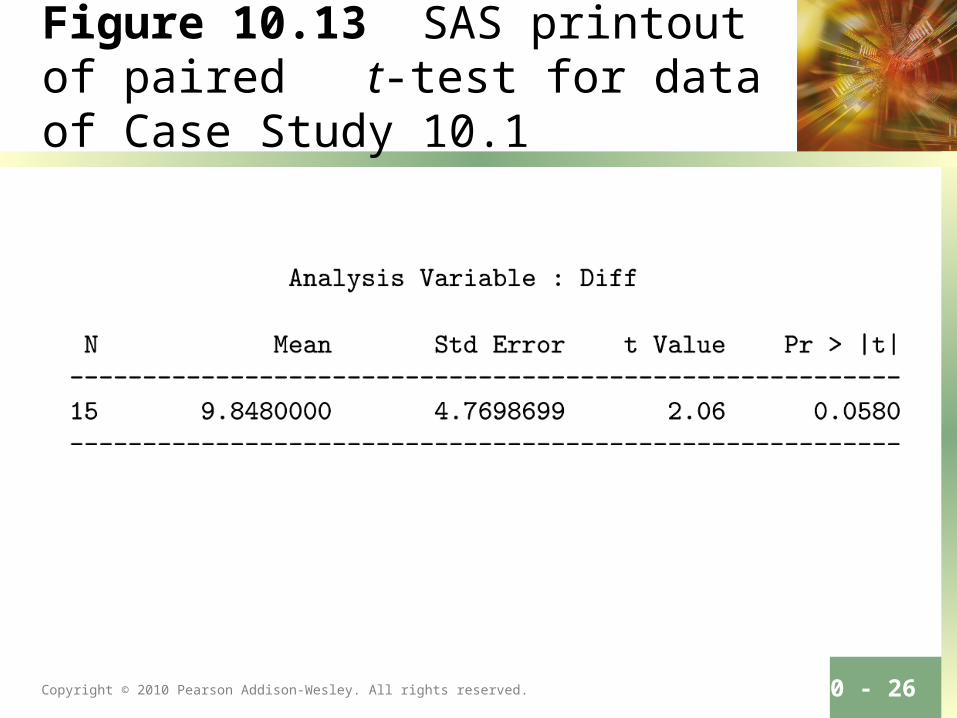
Figure 10.13 SAS printout of paired t-test for data of Case Study 10.1
Copyright © 2010 Pearson Addison-Wesley. All rights reserved.
Section 10.6
Choice of Sample Size for Testing Means
Copyright © 2010 Pearson Addison-Wesley. All rights reserved. 10 - 28
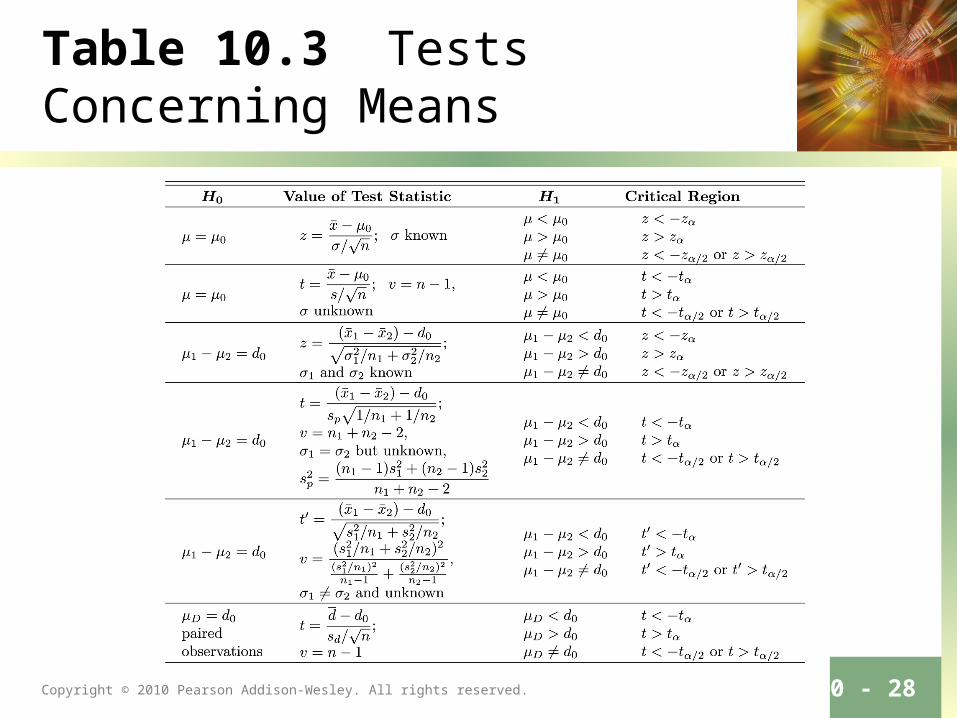
Table 10.3 Tests Concerning Means
Copyright © 2010 Pearson Addison-Wesley. All rights reserved. 10 - 29
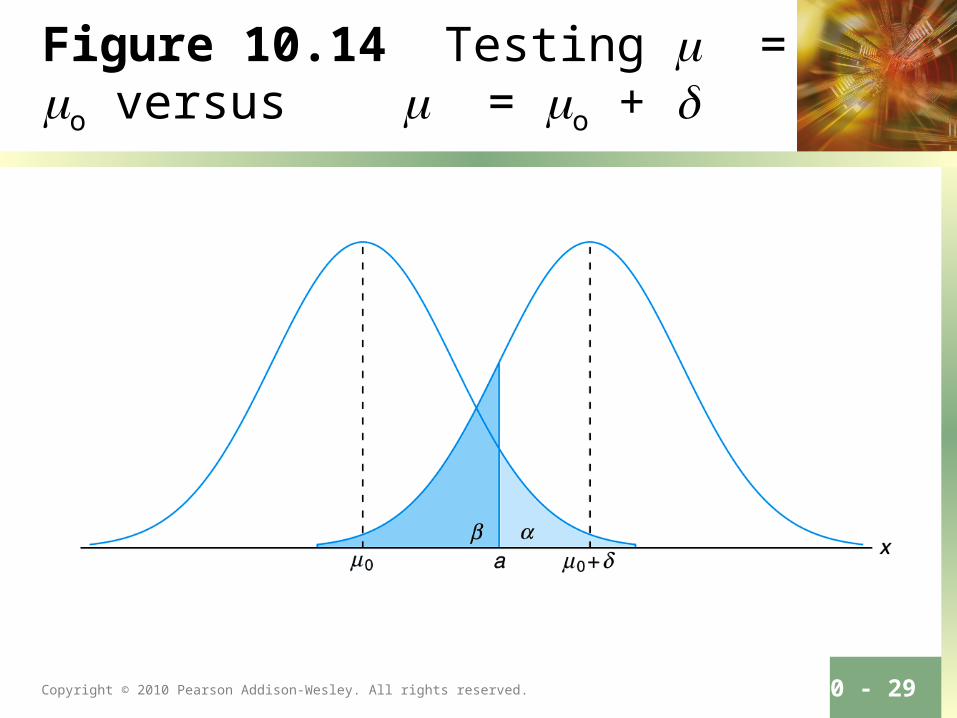
Figure 10.14 Testing = o versus = o +
Copyright © 2010 Pearson Addison-Wesley. All rights reserved. 10 - 30
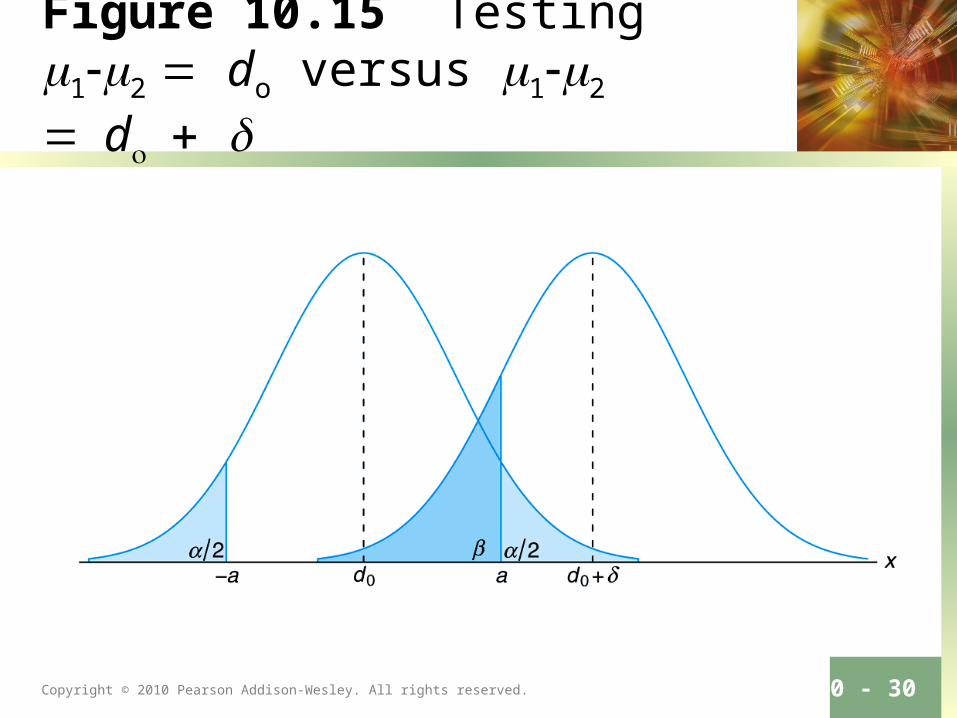
Figure 10.15 Testing 12 do versus 12 d
Copyright © 2010 Pearson Addison-Wesley. All rights reserved.
Section 10.7
Graphical Methods for Comparing Means
Copyright © 2010 Pearson Addison-Wesley. All rights reserved. 10 - 32
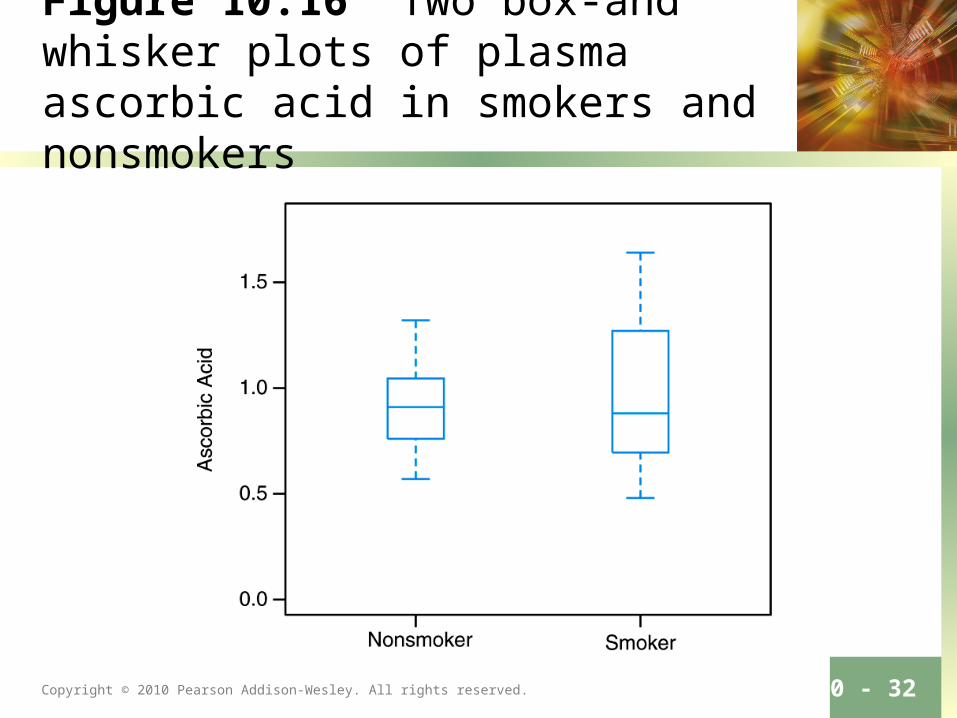
Figure 10.16 Two box-and whisker plots of plasma ascorbic acid in smokers and nonsmokers
Copyright © 2010 Pearson Addison-Wesley. All rights reserved. 10 - 33
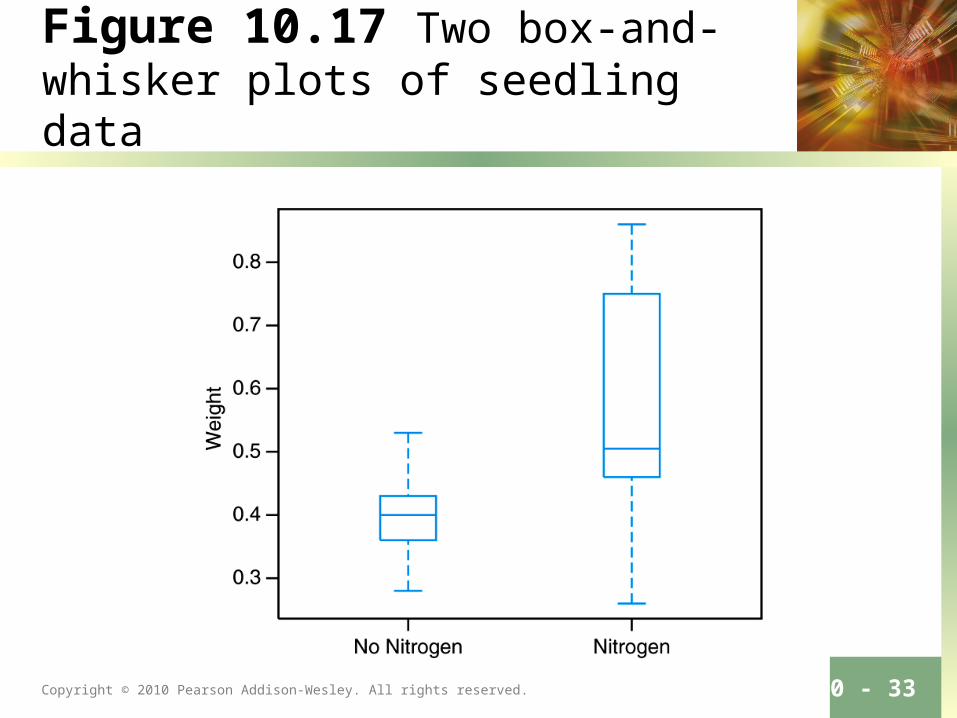
Figure 10.17 Two box-and-whisker plots of seedling data
Copyright © 2010 Pearson Addison-Wesley. All rights reserved. 10 - 34
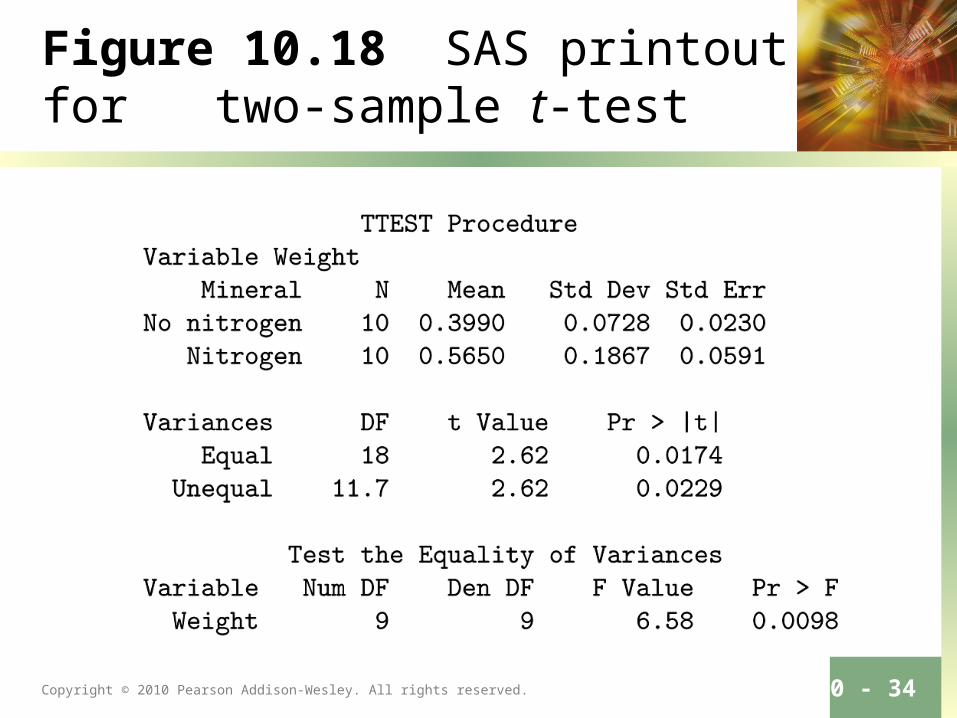
Figure 10.18 SAS printout for two-sample t-test

Copyright © 2010 Pearson Addison-Wesley. All rights reserved.
Section 10.8
One Sample: Test on a Single Proportion

Copyright © 2010 Pearson Addison-Wesley. All rights reserved.
Section 10.9
Two Samples: Tests on Two Proportions
Copyright © 2010 Pearson Addison-Wesley. All rights reserved.
Section 10.10
One- and Two- Sample Tests Concerning Variances
Copyright © 2010 Pearson Addison-Wesley. All rights reserved. 10 - 38
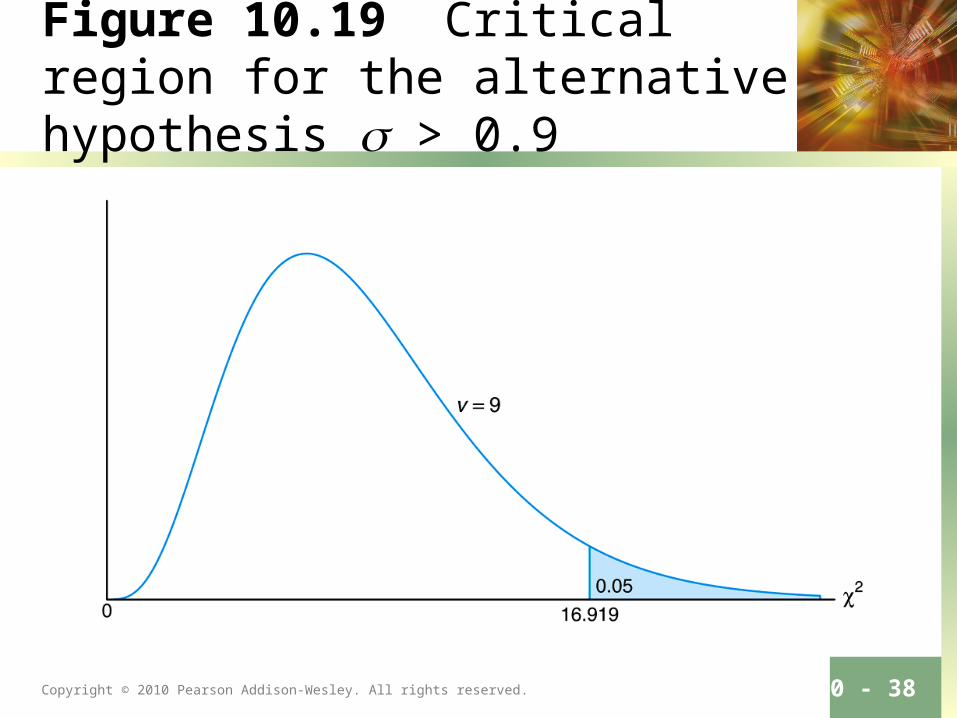
Figure 10.19 Critical region for the alternative hypothesis > 0.9
Copyright © 2010 Pearson Addison-Wesley. All rights reserved. 10 - 39
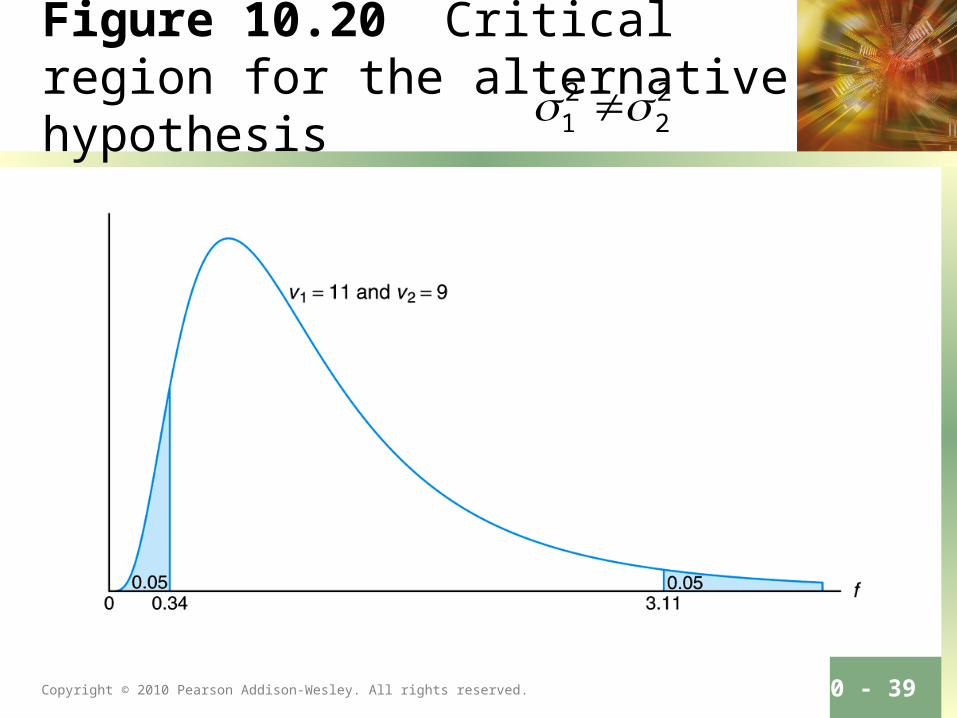
Figure 10.20 Critical region for the alternative hypothesis 2 2
1 2
Copyright © 2010 Pearson Addison-Wesley. All rights reserved.
Section 10.11
Goodness-of-Fit Test
Copyright © 2010 Pearson Addison-Wesley. All rights reserved. 10 - 41
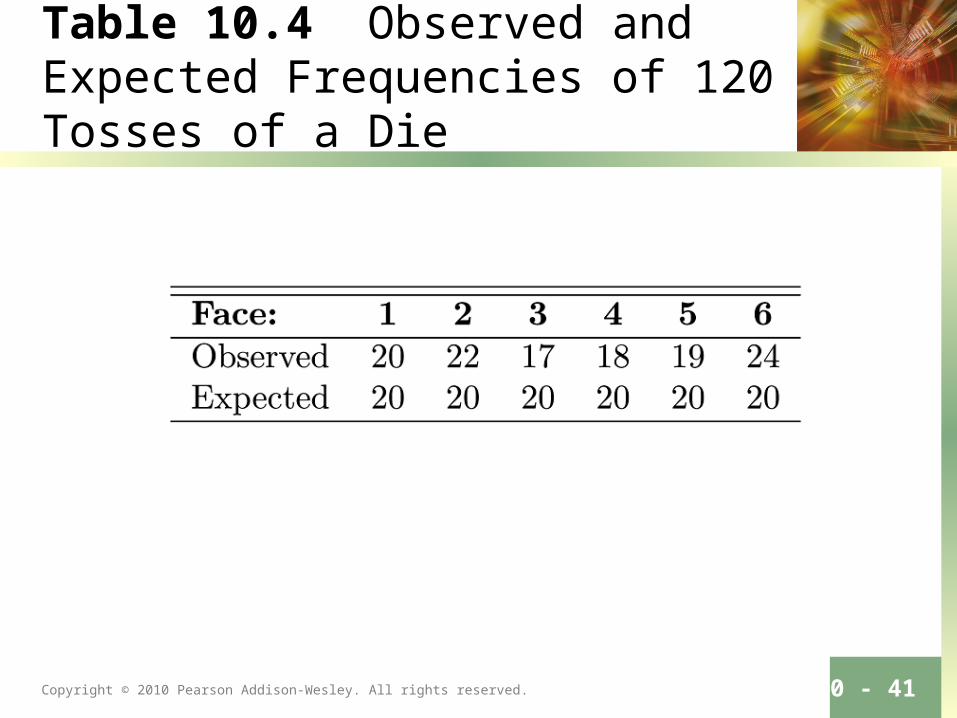
Table 10.4 Observed and Expected Frequencies of 120 Tosses of a Die
Copyright © 2010 Pearson Addison-Wesley. All rights reserved. 10 - 42
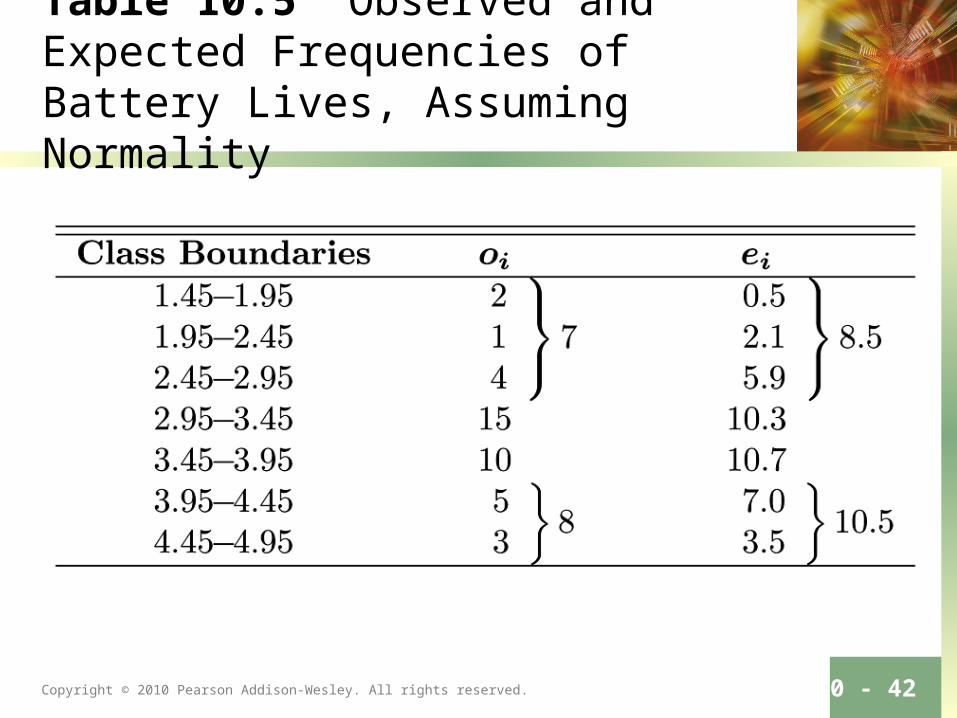
Table 10.5 Observed and Expected Frequencies of Battery Lives, Assuming Normality
Copyright © 2010 Pearson Addison-Wesley. All rights reserved.
Section 10.12
Test for Independence (Categorical Data)
Copyright © 2010 Pearson Addison-Wesley. All rights reserved. 10 - 44
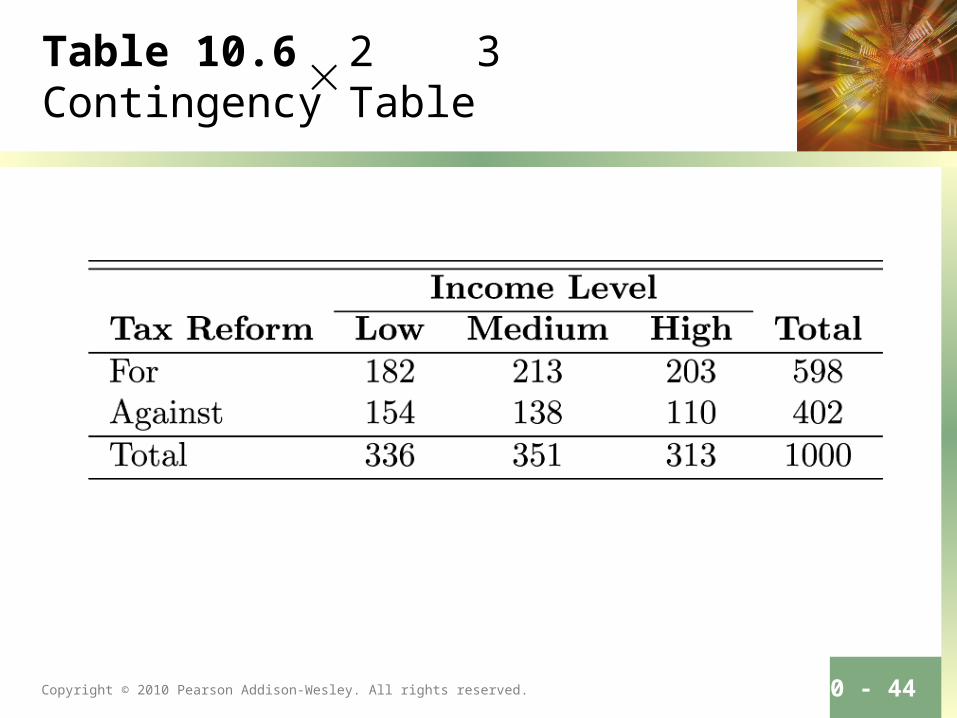
Table 10.6 2 3 Contingency Table
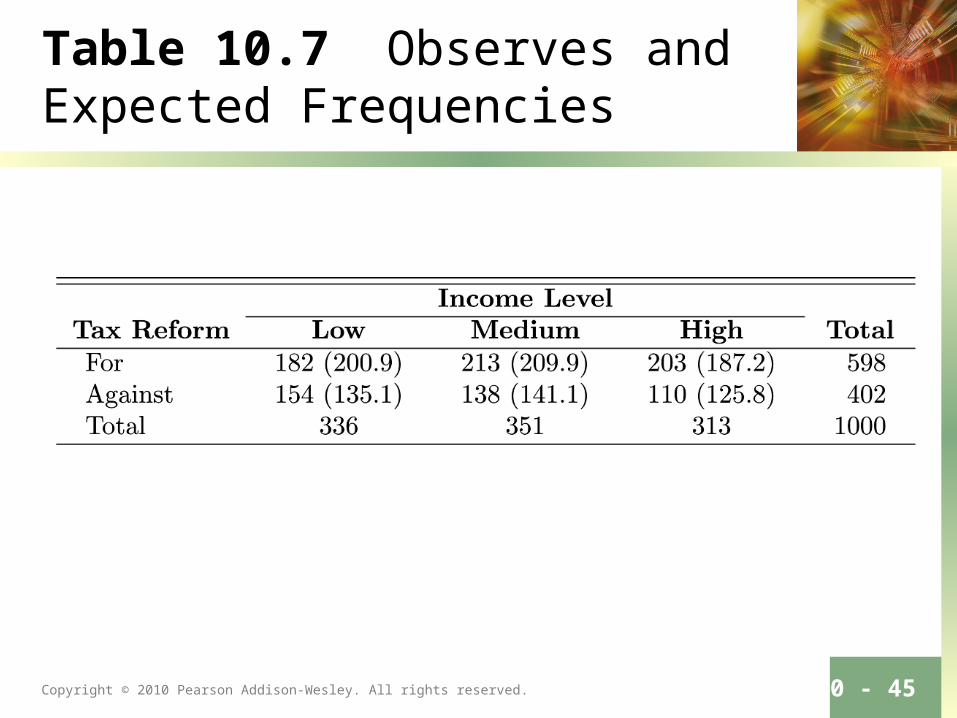
Copyright © 2010 Pearson Addison-Wesley. All rights reserved. 10 - 45
Table 10.7 Observes and Expected Frequencies
Copyright © 2010 Pearson Addison-Wesley. All rights reserved.
Section 10.13
Test for Homogeneity
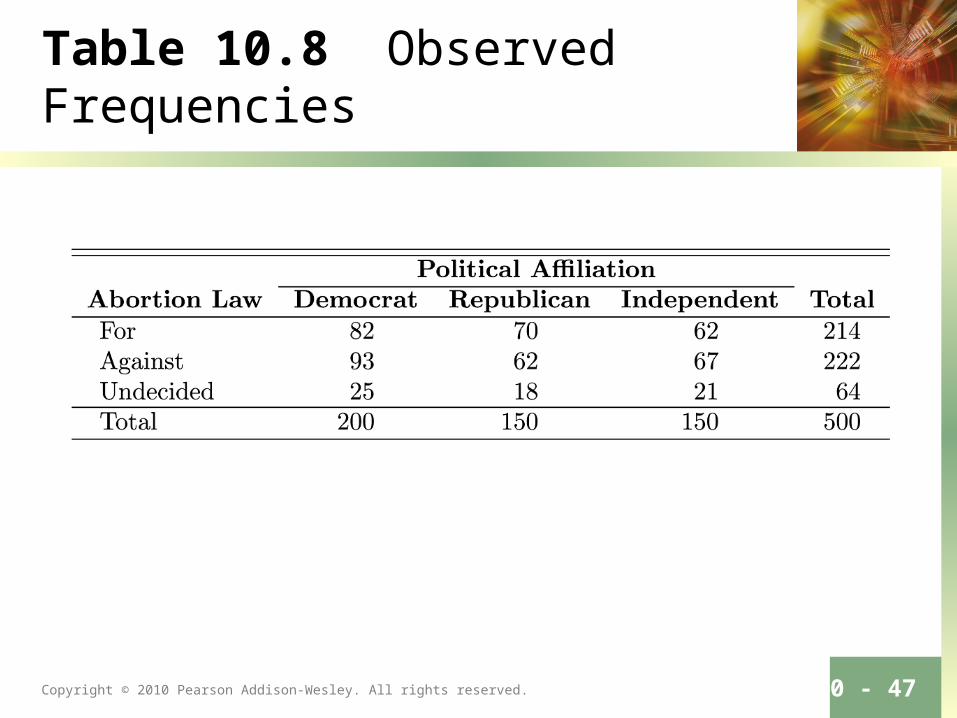
Copyright © 2010 Pearson Addison-Wesley. All rights reserved. 10 - 47
Table 10.8 Observed Frequencies
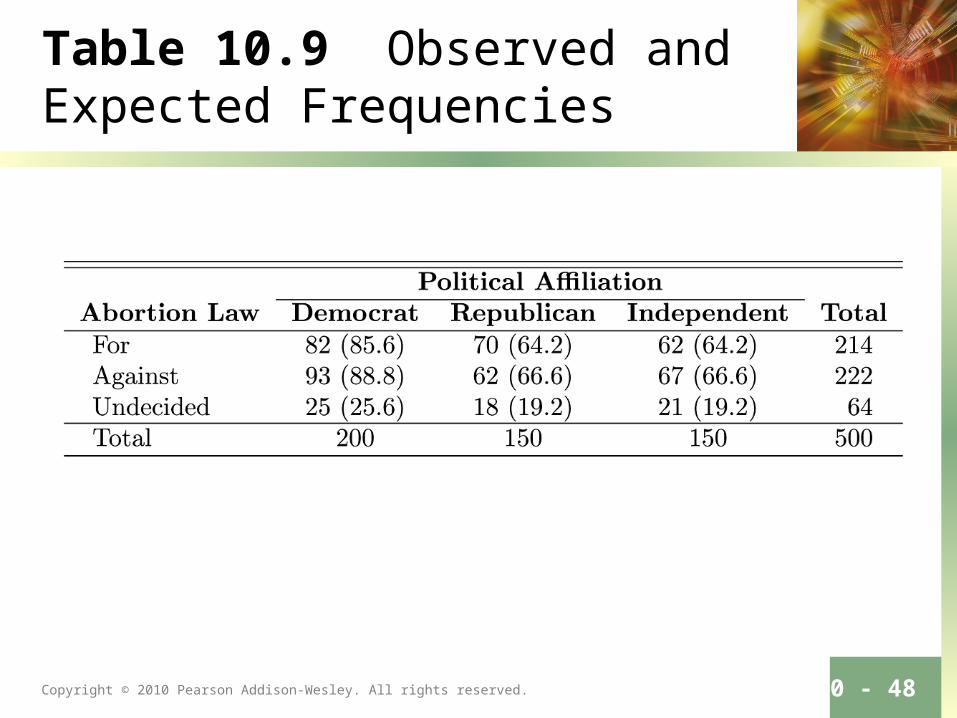
Copyright © 2010 Pearson Addison-Wesley. All rights reserved. 10 - 48
Table 10.9 Observed and Expected Frequencies
Copyright © 2010 Pearson Addison-Wesley. All rights reserved. 10 - 49
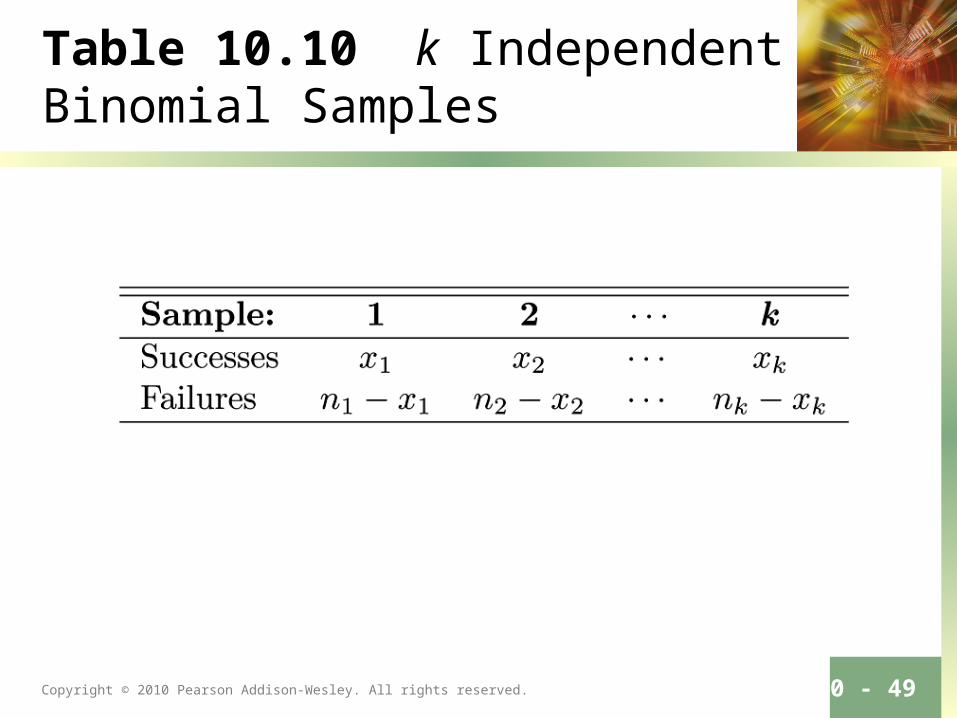
Table 10.10 k Independent Binomial Samples
Copyright © 2010 Pearson Addison-Wesley. All rights reserved. 10 - 50
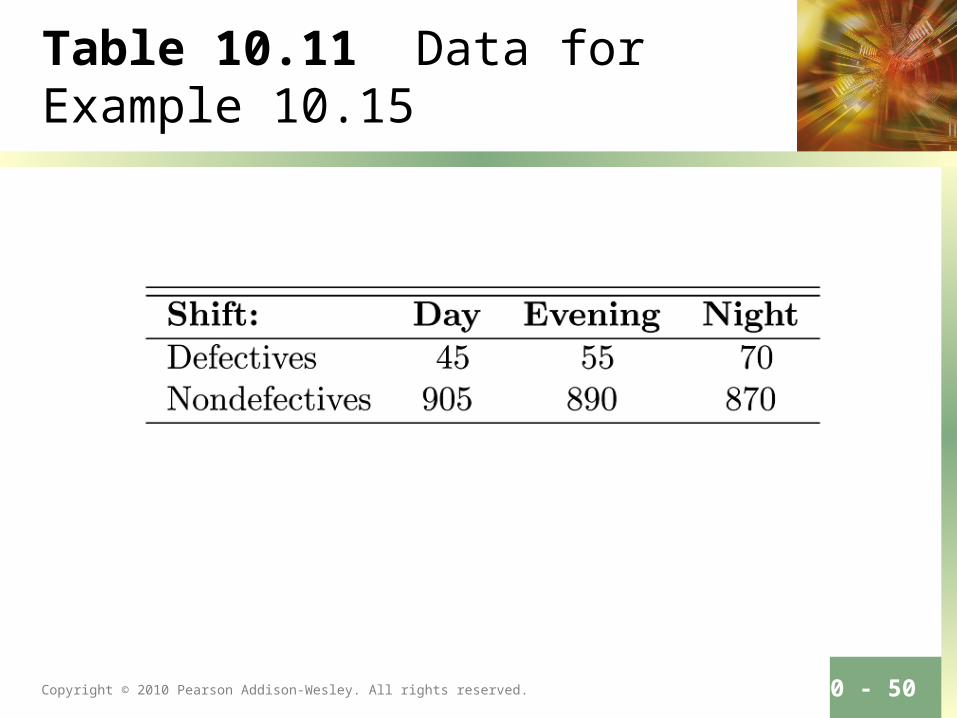
Table 10.11 Data for Example 10.15
Copyright © 2010 Pearson Addison-Wesley. All rights reserved. 10 - 51
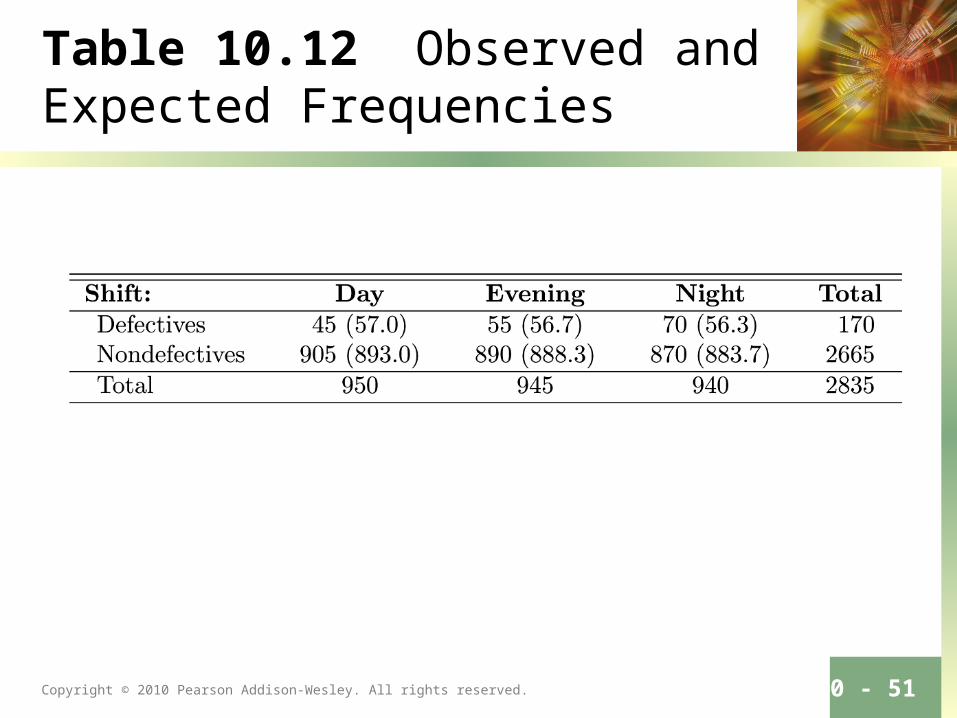
Table 10.12 Observed and Expected Frequencies
Copyright © 2010 Pearson Addison-Wesley. All rights reserved.
Section 10.14
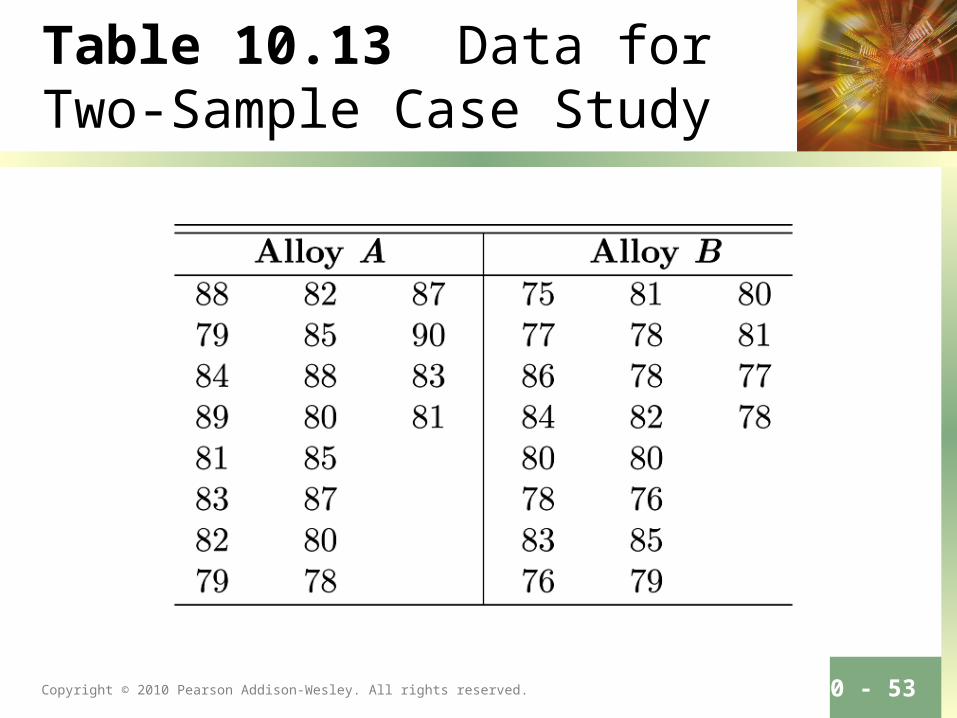
Two-Sample Case Study
Copyright © 2010 Pearson Addison-Wesley. All rights reserved. 10 - 53
Table 10.13 Data for Two-Sample Case Study
Copyright © 2010 Pearson Addison-Wesley. All rights reserved. 10 - 54
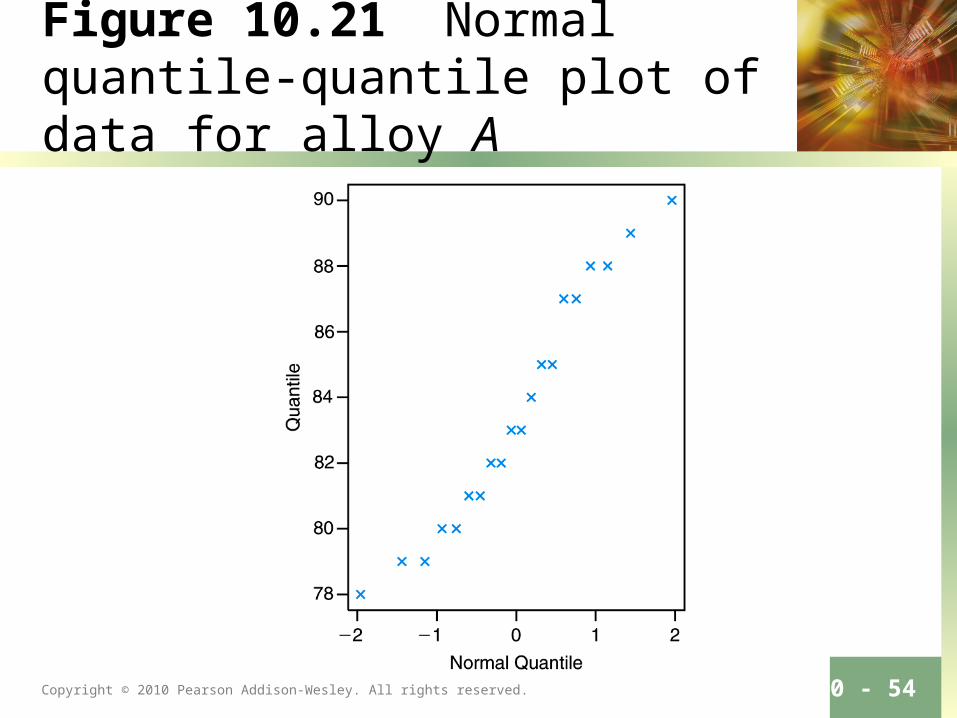
Figure 10.21 Normal quantile-quantile plot of data for alloy A
Copyright © 2010 Pearson Addison-Wesley. All rights reserved. 10 - 55
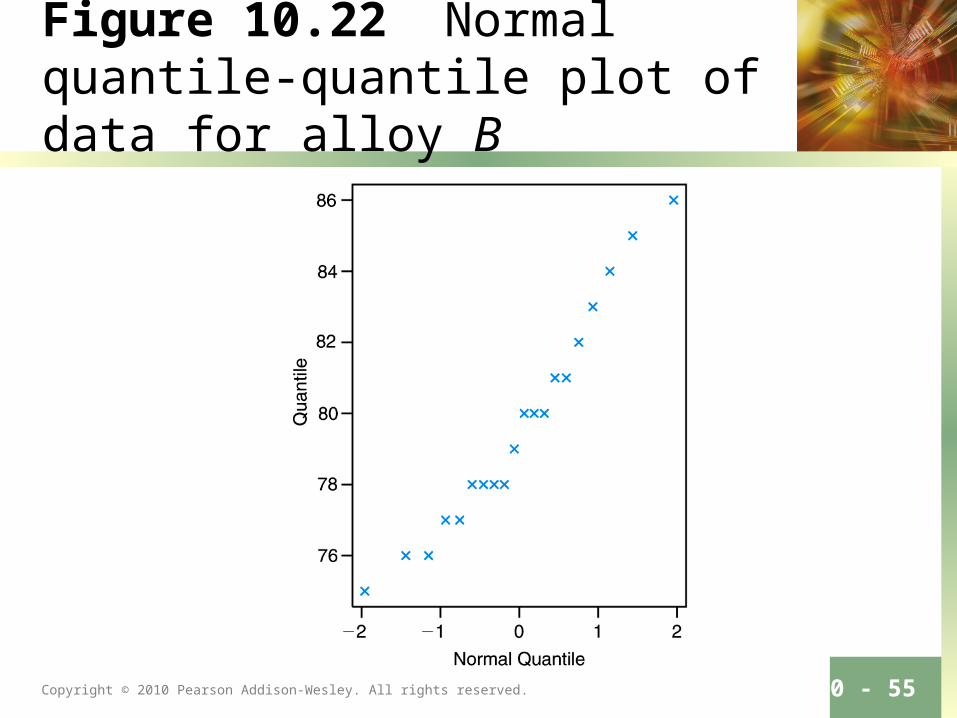
Figure 10.22 Normal quantile-quantile plot of data for alloy B
Copyright © 2010 Pearson Addison-Wesley. All rights reserved. 10 - 56
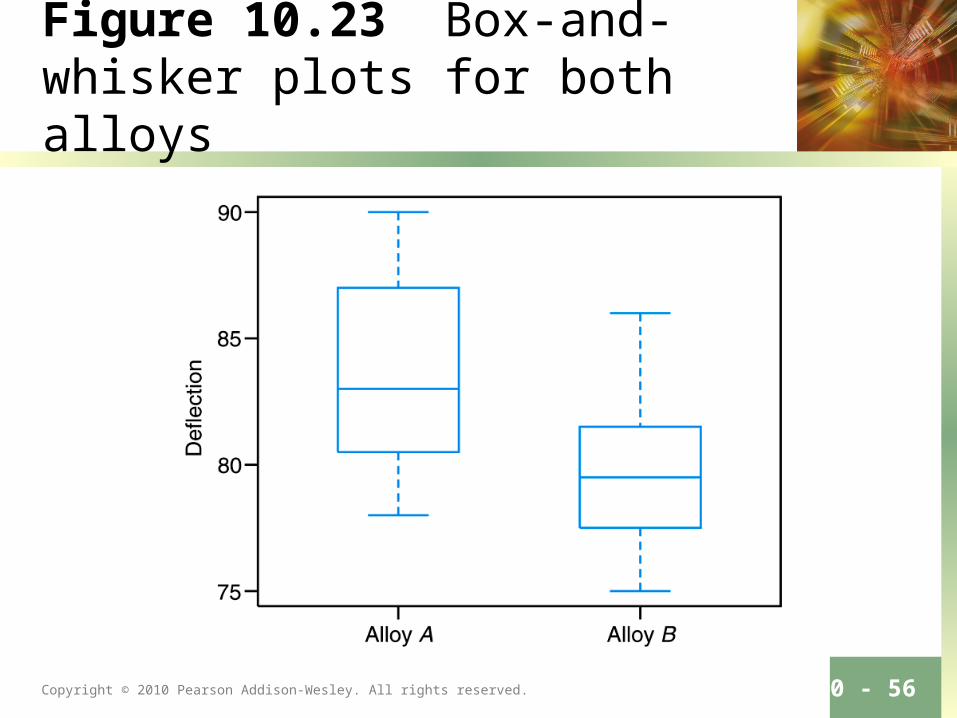
Figure 10.23 Box-and-whisker plots for both alloys
Copyright © 2010 Pearson Addison-Wesley. All rights reserved. 10 - 57
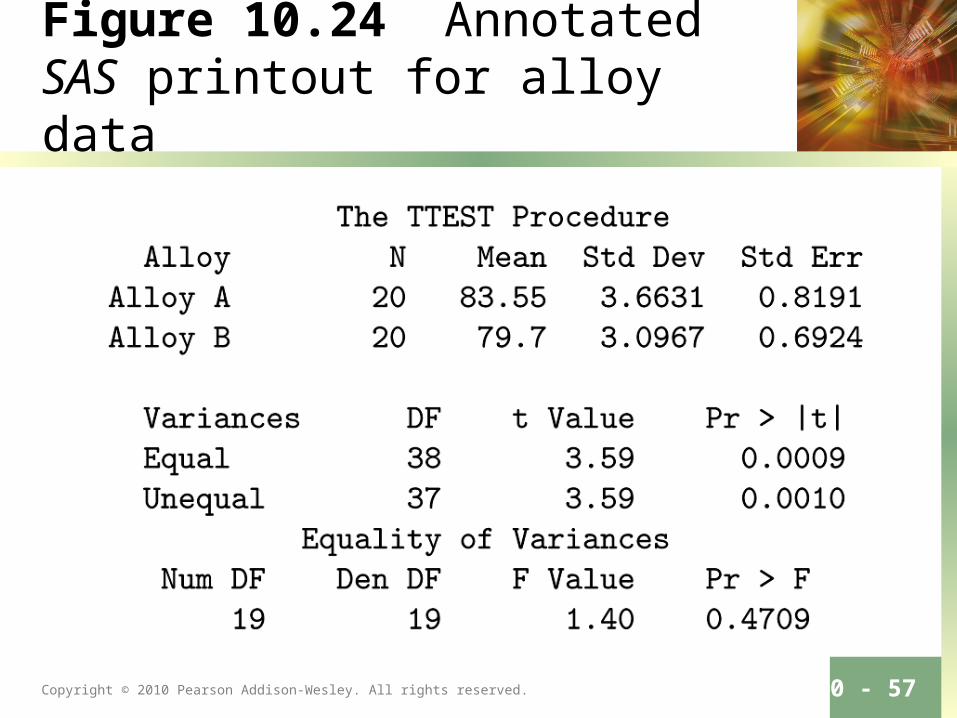
Figure 10.24 Annotated SAS printout for alloy data
Copyright © 2010 Pearson Addison-Wesley. All rights reserved.
Potential Misconceptions and Hazards; Relationship to Material in Other Chapters
Section 10.15