Embed Size (px)
Citation preview

Copyright © 2009 Pearson Education, Inc.
Chapter 6
Supply of Labor to the Economy: The Decision to Work
Copyright © 2009 Pearson Education, Inc. 6- 2
Table 6.1: Labor Force Participation Rates of Females in the United States over 16 Years of
Age, by Martial Status, 1900-2005 (percentage)

Copyright © 2009 Pearson Education, Inc. 6- 3
Table 6.2: Labor Force Participation Rates for Male in the United States, by Age,
1900-2005 (percentage)
Copyright © 2009 Pearson Education, Inc. 6- 4
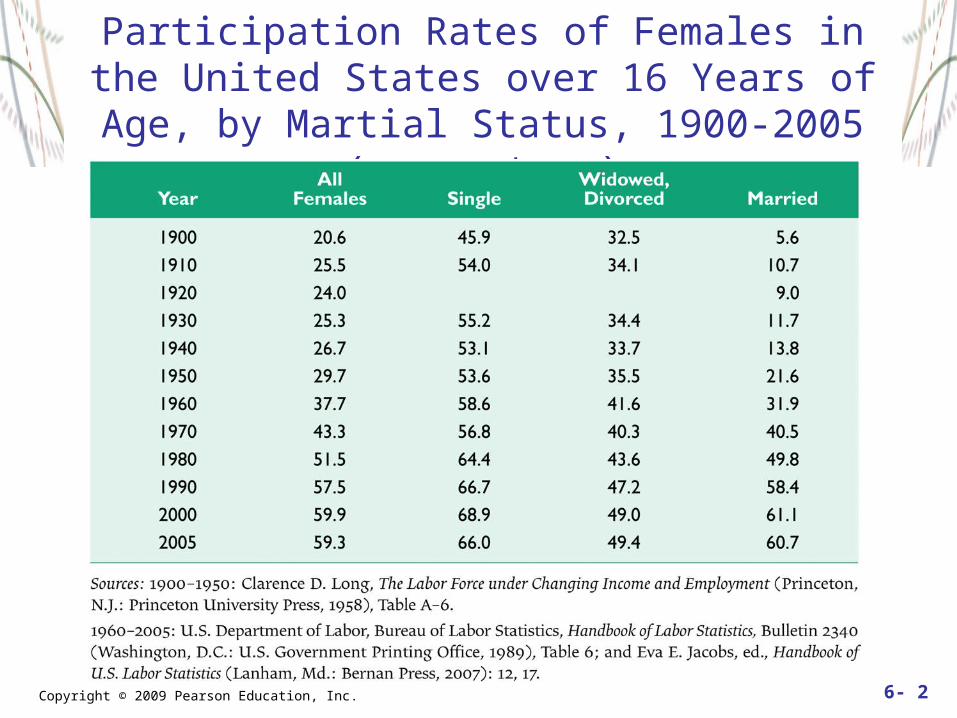
Table 6.3: Labor Force Participation Rates of Women and Older Men, Selected Countries, 1965-2004 (percentage)

Copyright © 2009 Pearson Education, Inc. 6- 5
Important Definitions - The Decision to Work I
Work vs. LeisurePure Income and Substitution EffectsIncome and Substitution Effects of A Wage ChangeBackward Bending Labor Supply Curve
Copyright © 2009 Pearson Education, Inc. 6- 6
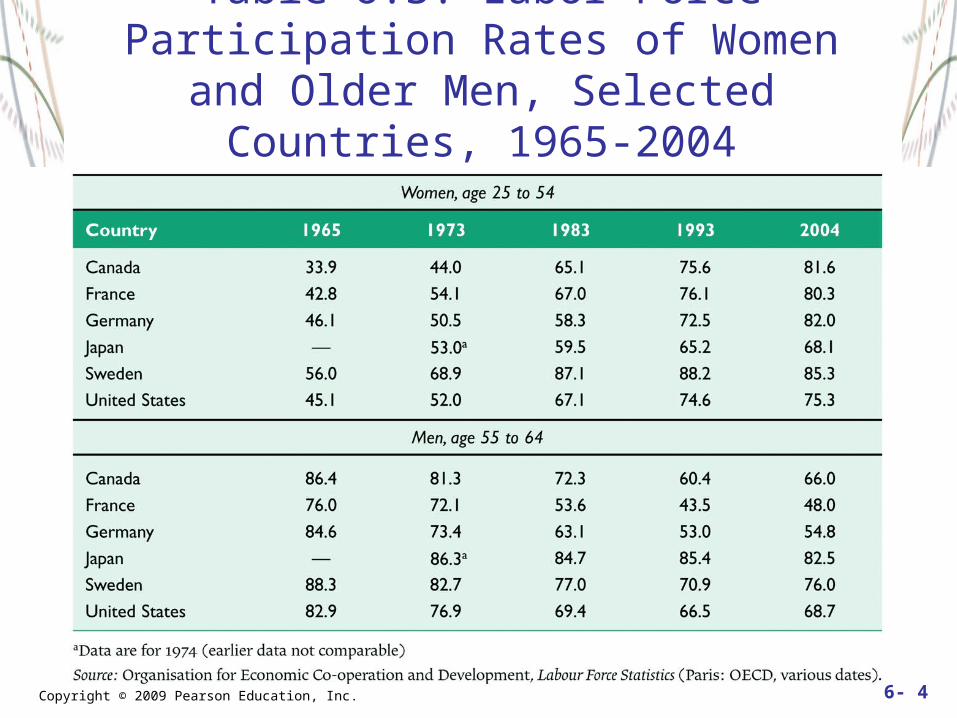
Figure 6.1: An Individual Labor Supply Curve Can Bend Backward
Copyright © 2009 Pearson Education, Inc. 6- 7
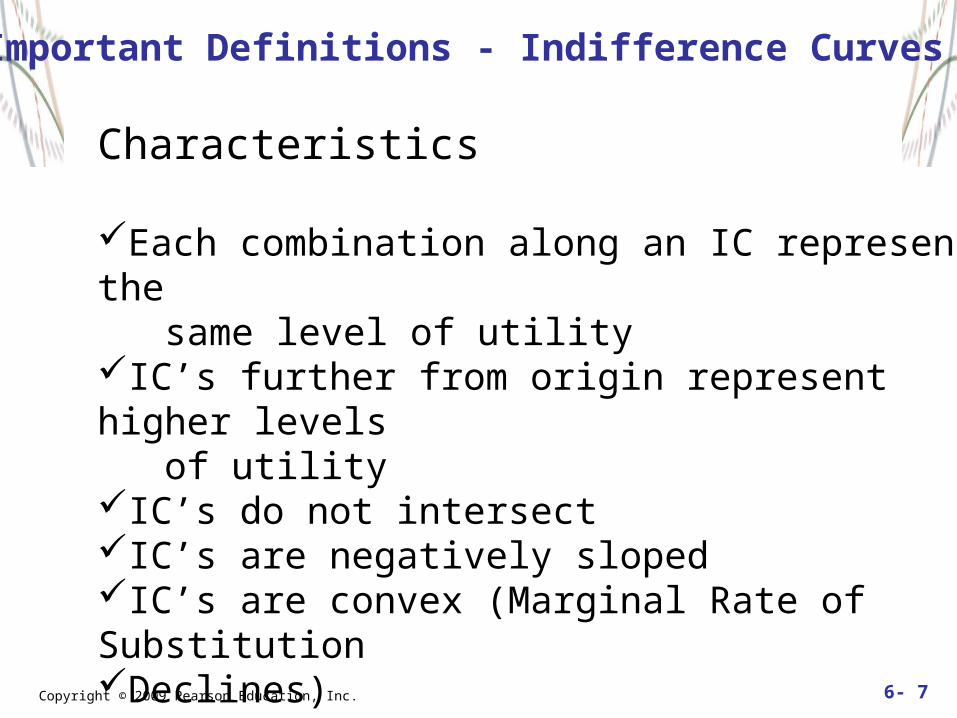
Important Definitions - Indifference Curves I
Characteristics
Each combination along an IC represents the same level of utility IC’s further from origin represent higher levels of utility IC’s do not intersectIC’s are negatively slopedIC’s are convex (Marginal Rate of Substitution Declines)
Copyright © 2009 Pearson Education, Inc. 6- 8
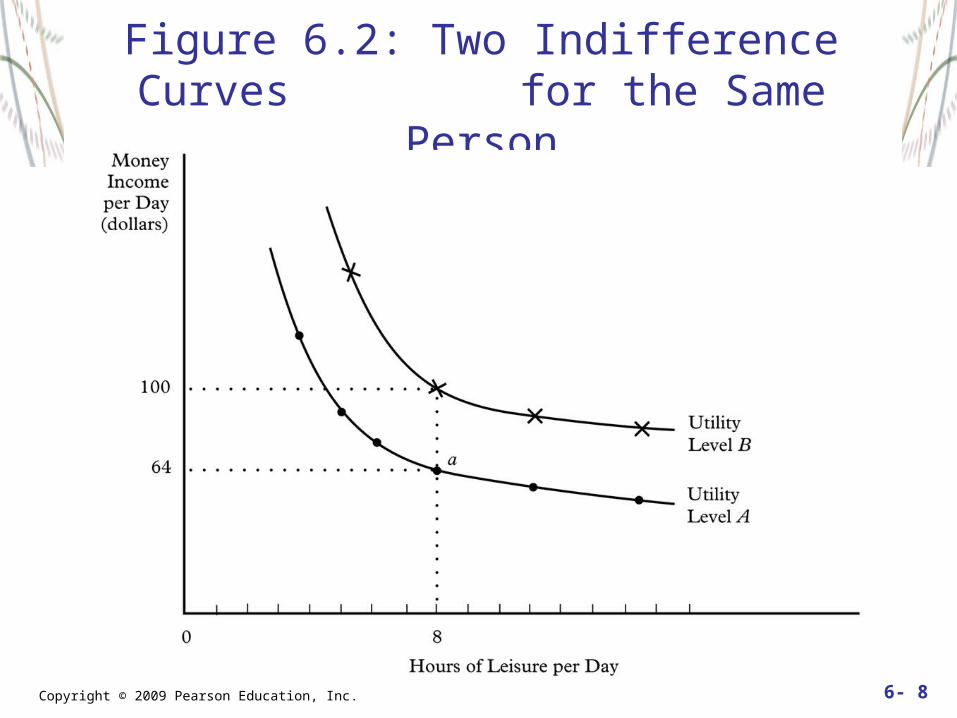
Figure 6.2: Two Indifference Curves for the Same Person
Copyright © 2009 Pearson Education, Inc. 6- 9
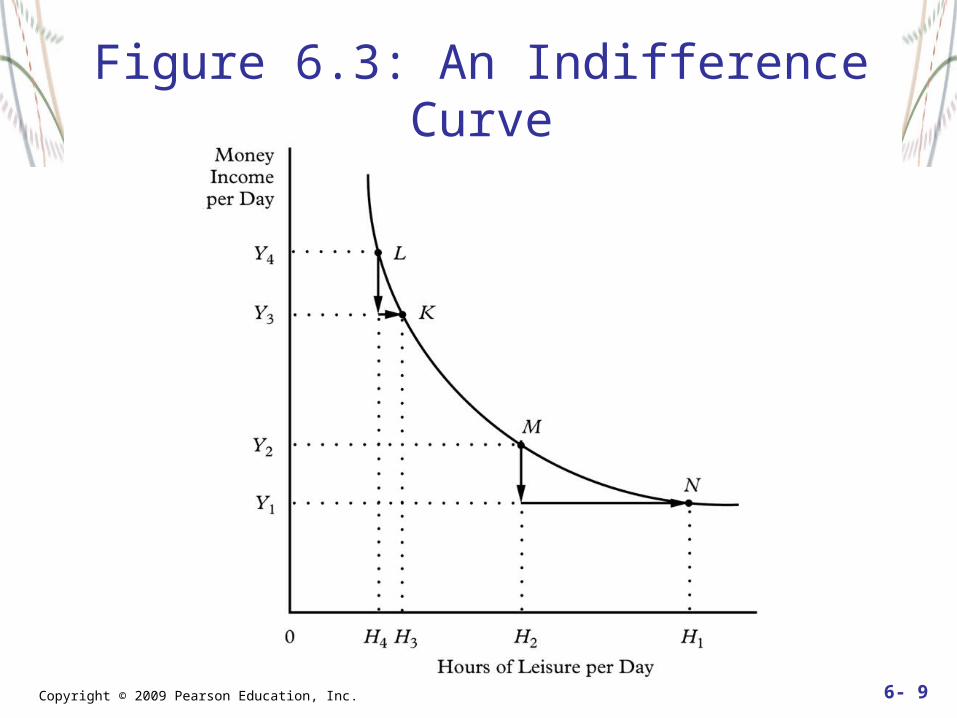
Figure 6.3: An Indifference Curve
Copyright © 2009 Pearson Education, Inc. 6- 10
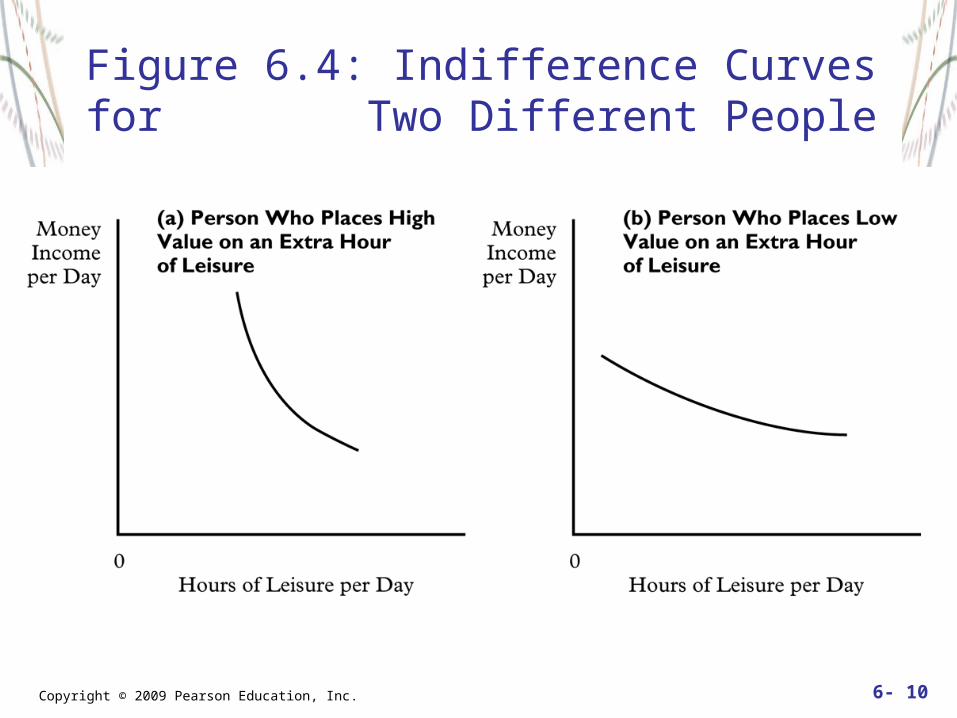
Figure 6.4: Indifference Curves for Two Different People
Copyright © 2009 Pearson Education, Inc. 6- 11
Important Definitions - Consumer Equilibrium
Budget Constraint Wage Rate and the Slope of the Budget Constraint Tangency Condition for Consumer EquilibriumCorner SolutionPure Income Effect and Consumer Equilibrium
Copyright © 2009 Pearson Education, Inc. 6- 12
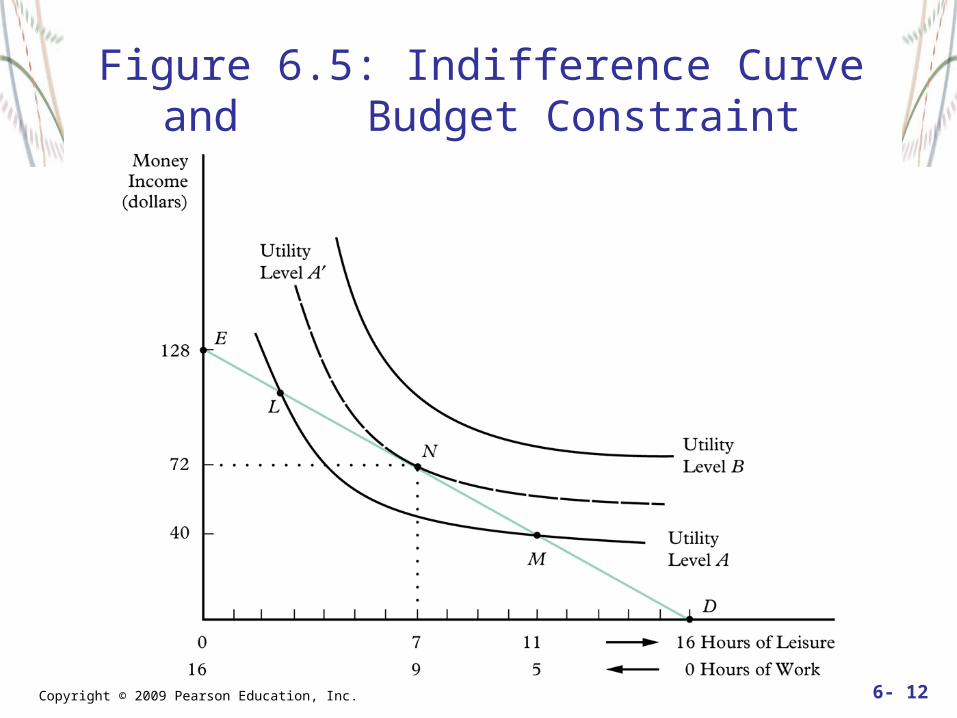
Figure 6.5: Indifference Curve and Budget Constraint
Copyright © 2009 Pearson Education, Inc. 6- 13
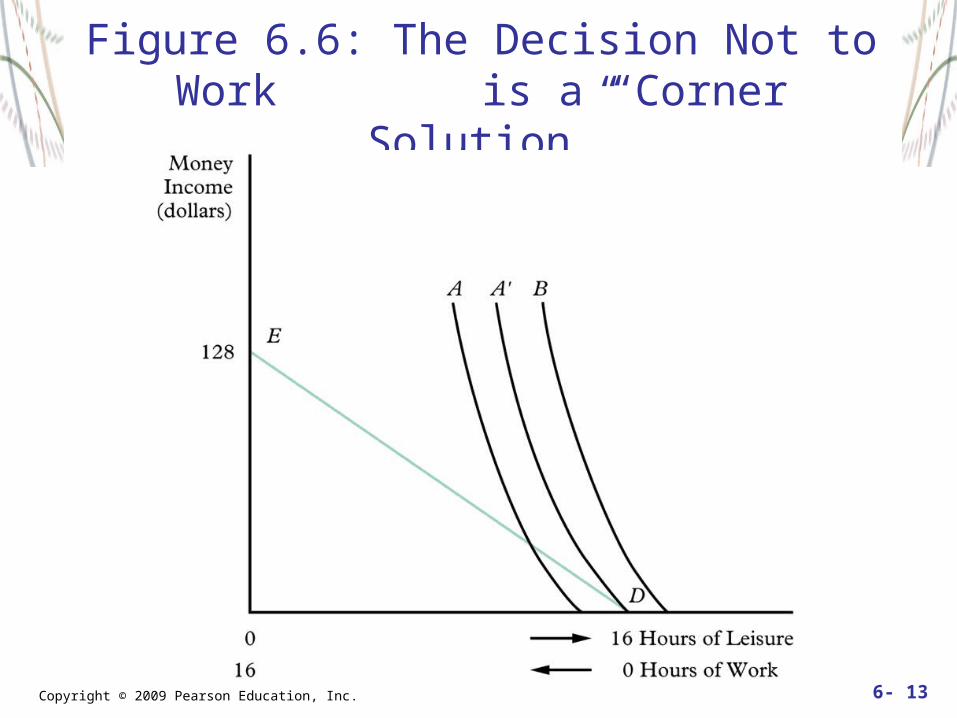
Figure 6.6: The Decision Not to Work is a “Corner Solution”
Copyright © 2009 Pearson Education, Inc. 6- 14
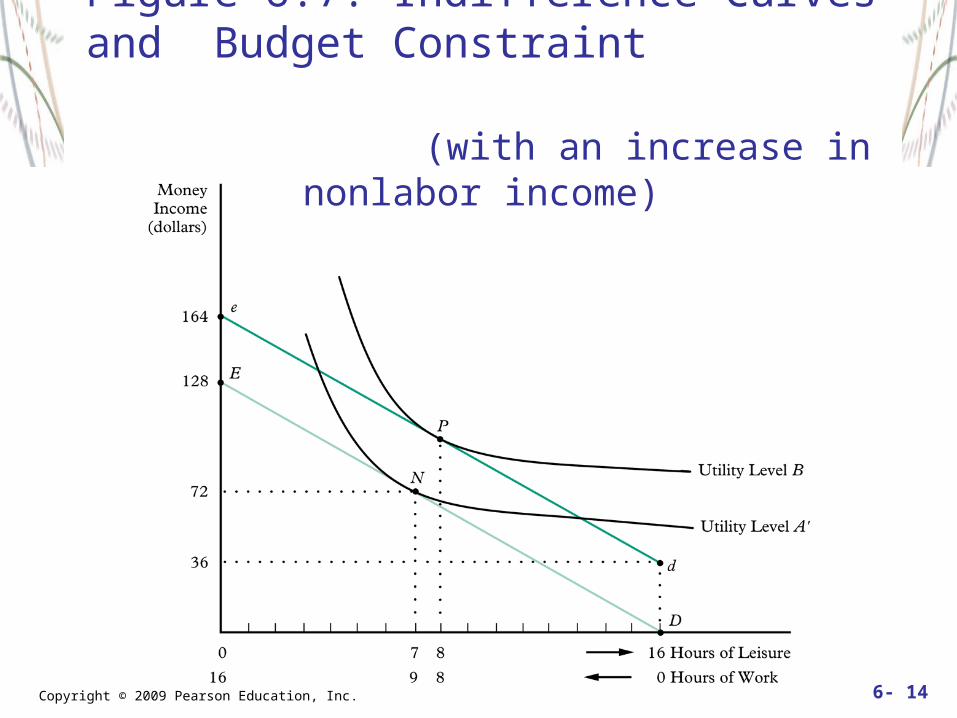
Figure 6.7: Indifference Curves and Budget Constraint (with an increase in nonlabor income)
Copyright © 2009 Pearson Education, Inc. 6- 15
Income and Substitution Effect of a Wage Change
Solution When Substitution Effect Dominates
Solution When Income Effect Dominates
Copyright © 2009 Pearson Education, Inc. 6- 16
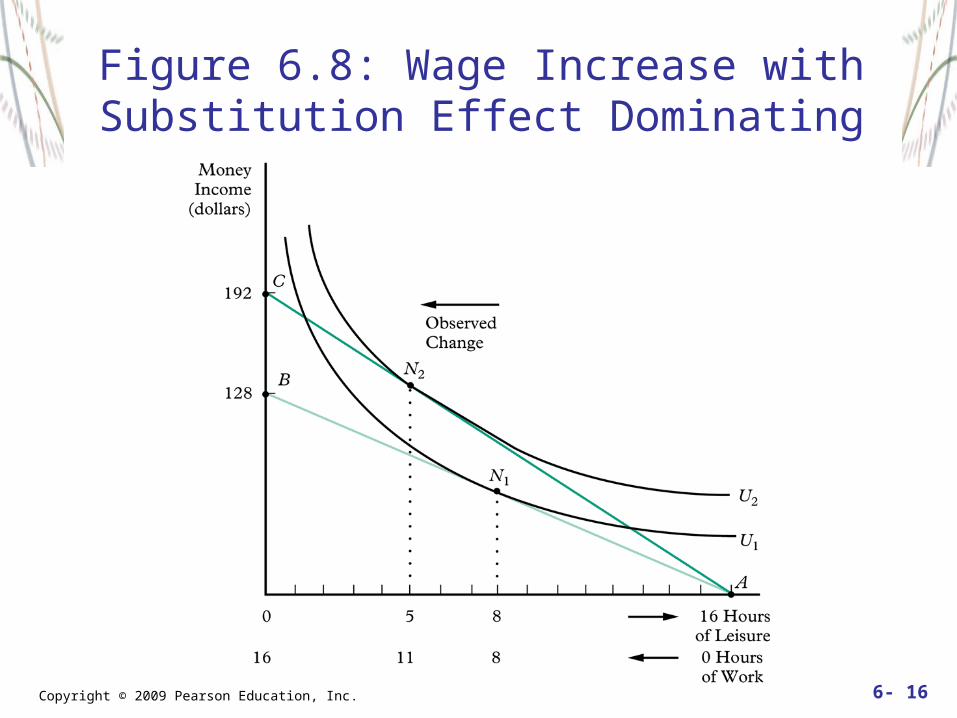
Figure 6.8: Wage Increase with Substitution Effect Dominating
Copyright © 2009 Pearson Education, Inc. 6- 17
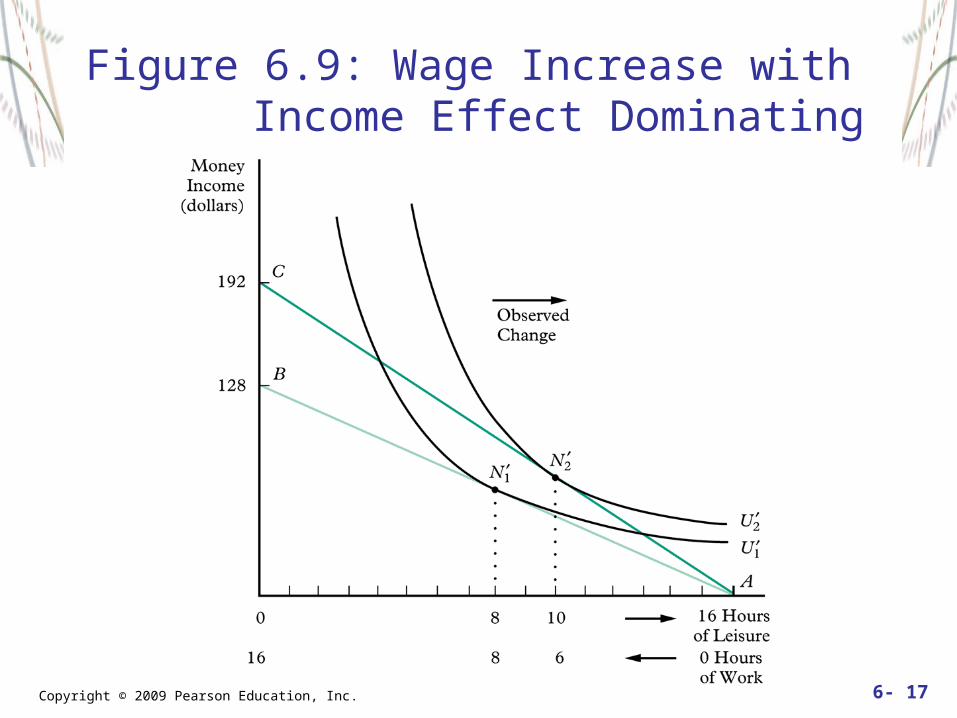
Figure 6.9: Wage Increase with Income Effect Dominating
Copyright © 2009 Pearson Education, Inc. 6- 18
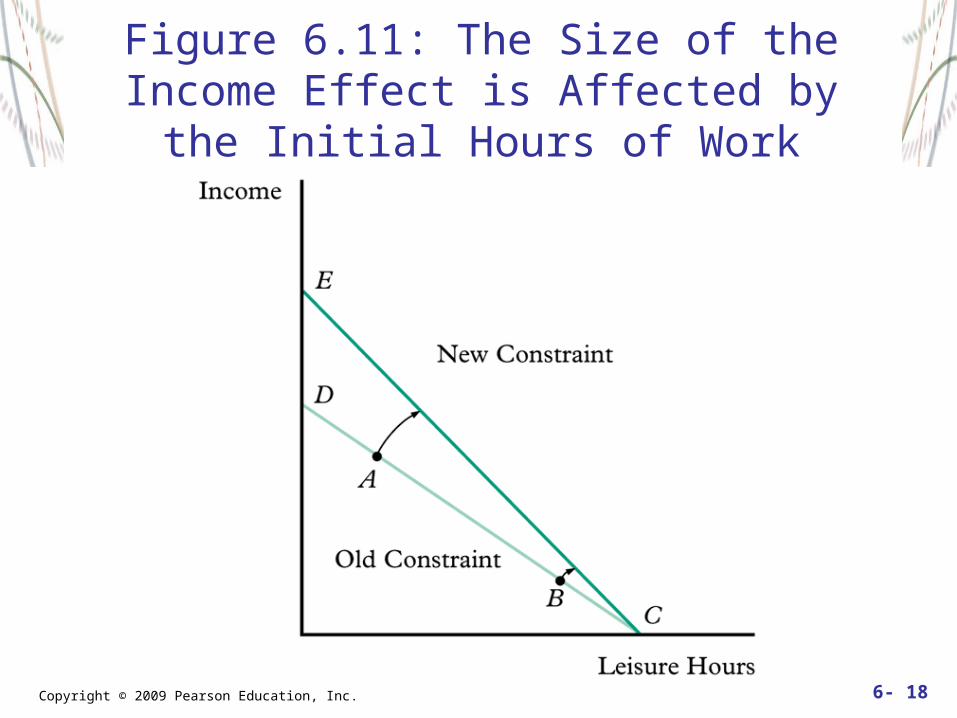
Figure 6.11: The Size of the Income Effect is Affected by the Initial Hours of Work

Copyright © 2009 Pearson Education, Inc. 6- 19
Important Definitions - Policy Applications
Unemployment Compensation Guaranteed Annual Income Workfare
Copyright © 2009 Pearson Education, Inc. 6- 20
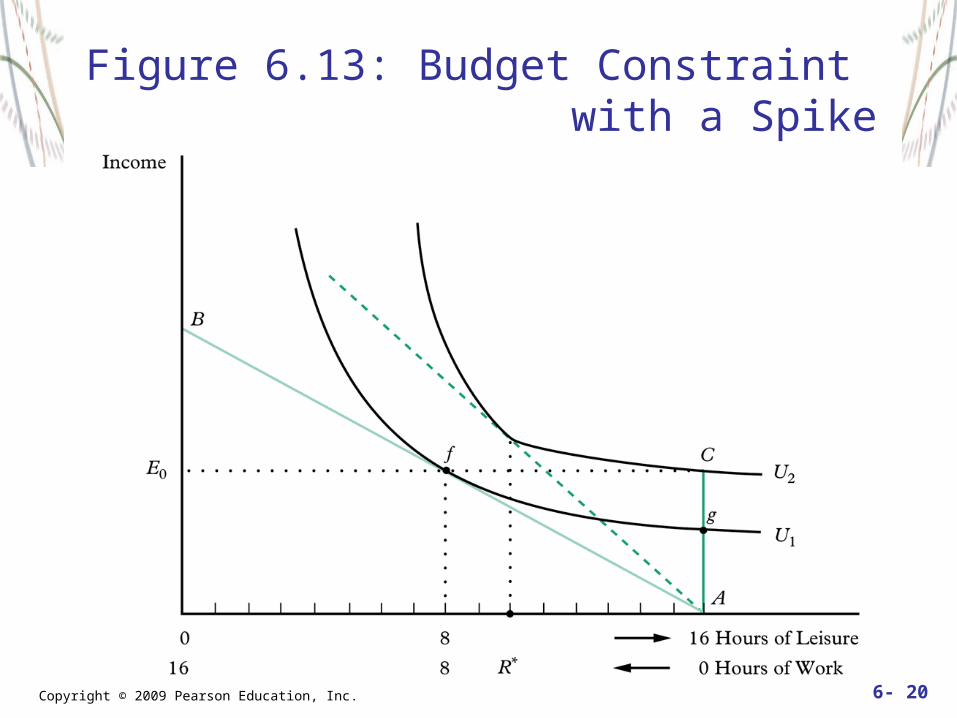
Figure 6.13: Budget Constraint with a Spike
Copyright © 2009 Pearson Education, Inc. 6- 21
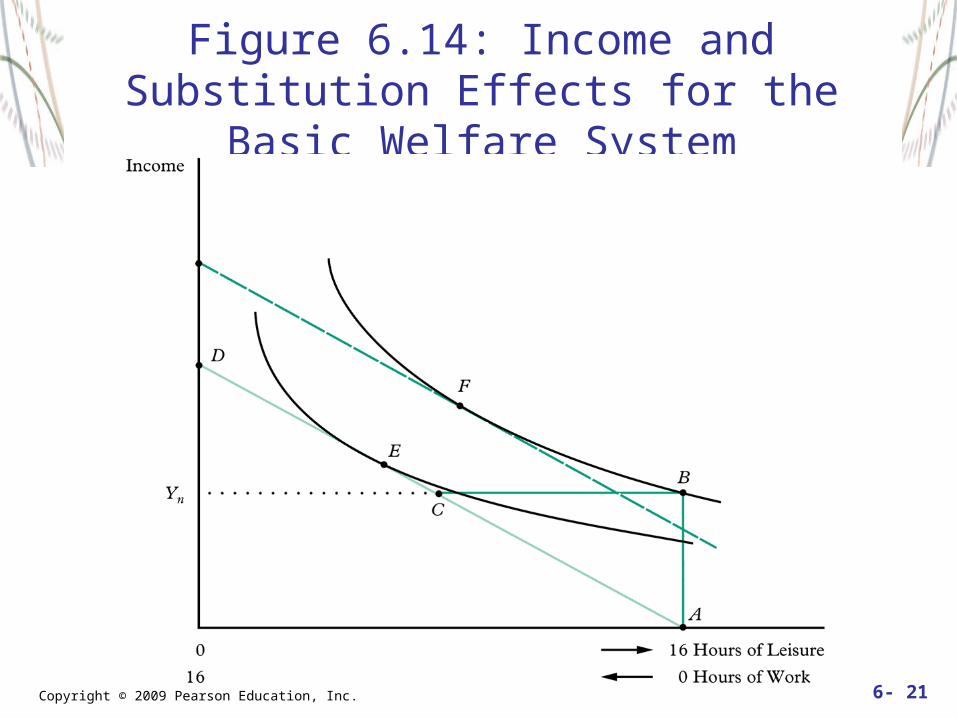
Figure 6.14: Income and Substitution Effects for the Basic Welfare System
Copyright © 2009 Pearson Education, Inc. 6- 22
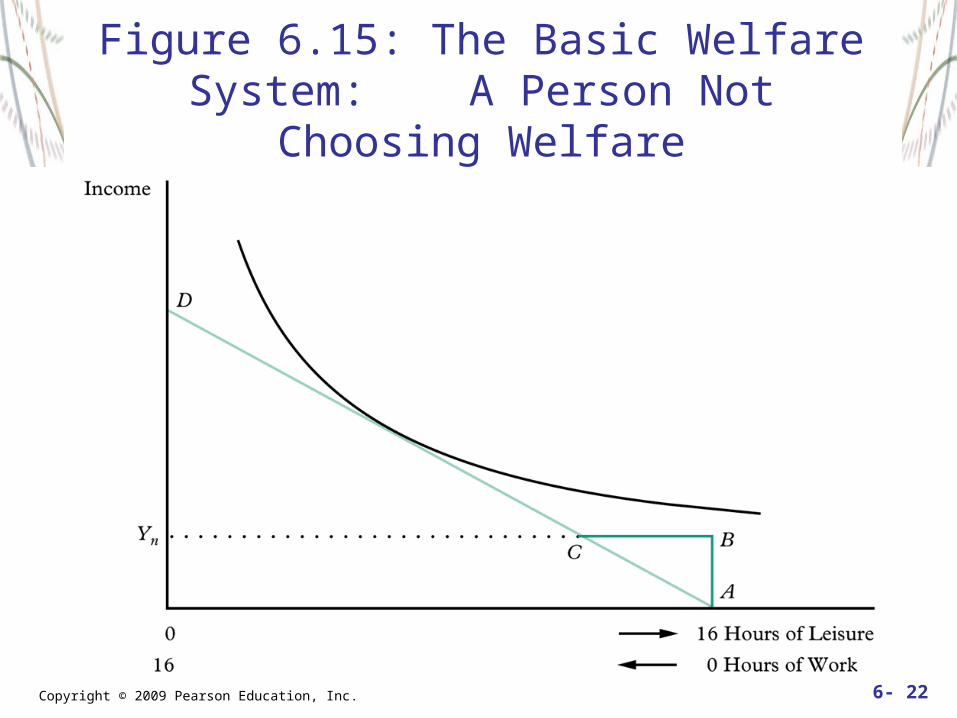
Figure 6.15: The Basic Welfare System: A Person Not Choosing Welfare
Copyright © 2009 Pearson Education, Inc. 6- 23
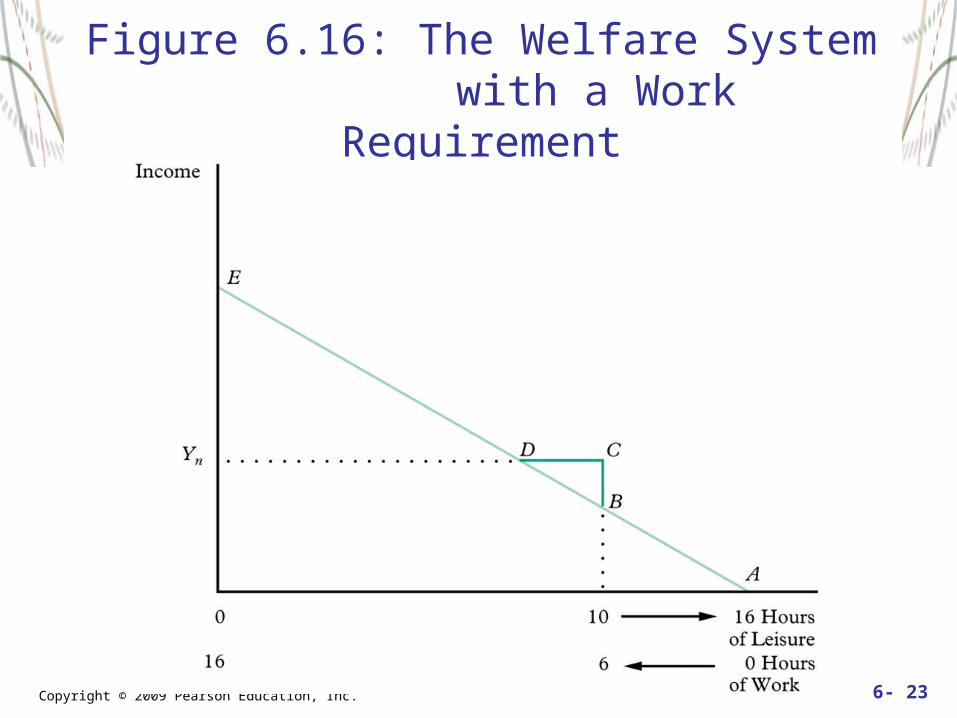
Figure 6.16: The Welfare System with a Work Requirement
Copyright © 2009 Pearson Education, Inc. 6- 24
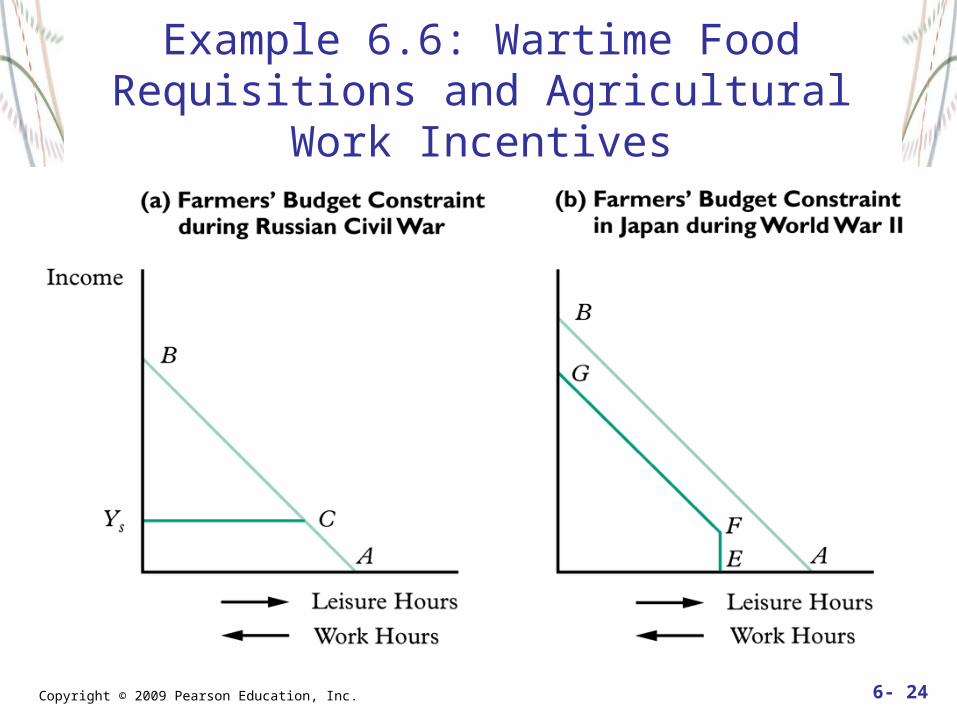
Example 6.6: Wartime Food Requisitions and Agricultural Work Incentives
Copyright © 2009 Pearson Education, Inc. 6- 25
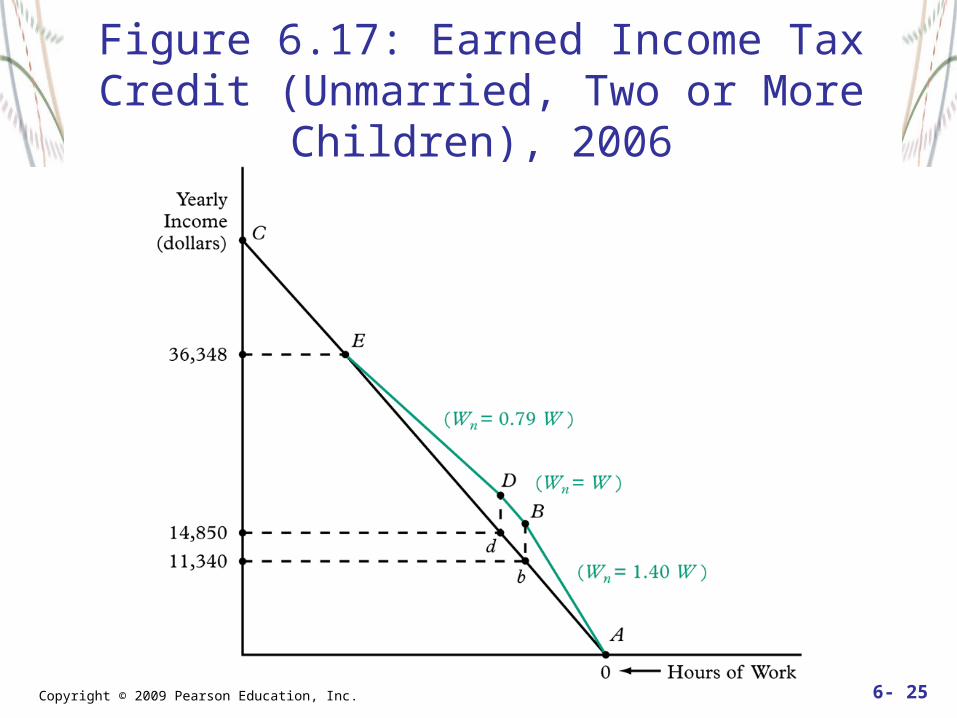
Figure 6.17: Earned Income Tax Credit (Unmarried, Two or More Children), 2006