Embed Size (px)
Citation preview

Copyright © 2009 Pearson Education, Inc. Chapter 15 Section 3 - Slide 1
5-3 Election Theory
Apportionment Methods

Chapter 15 Section 3 - Slide 2Copyright © 2009 Pearson Education, Inc.
WHAT YOU WILL LEARN
• Standard quotas and standard divisors
• Apportionment methods• Flaws of apportionment methods

Chapter 15 Section 3 - Slide 3Copyright © 2009 Pearson Education, Inc.
Apportionment
The goal of apportionment is to determine a method to allocate the total number of items to be apportioned in a fair manner.
Four Methods Hamilton’s method Jefferson’s method Webster’s method Adam’s method

Chapter 15 Section 3 - Slide 4Copyright © 2009 Pearson Education, Inc.
Definitions
total populationStandard divisor =
number of items to be allocated
population for the particular groupStandard quota =
standard divisor

Chapter 15 Section 3 - Slide 5Copyright © 2009 Pearson Education, Inc.
Example
A Graduate school wishes to apportion 15 graduate assistantships among the colleges of education, business and chemistry based on their undergraduate enrollments. Using the table on the next slide, find the standard quotas for the schools.

Chapter 15 Section 3 - Slide 6Copyright © 2009 Pearson Education, Inc.
Example (continued)
standard divisor =
8020
15534.67
14.999Standard quota
8020188029403200Population
TotalChemistryBusinessEducation
3200
534.675.985
2940
534.675.498
1880
534.673.516

Chapter 15 Section 3 - Slide 7Copyright © 2009 Pearson Education, Inc.
Hamilton’s Method
1. Calculate the standard divisor for the set of data.
2. Calculate each group’s standard quota.
3. Round each standard quota down to the nearest integer (the lower quota). Initially, each group receives its lower quota.
4. Distribute any leftover items to the groups with the largest fractional parts until all items are distributed.

Chapter 15 Section 3 - Slide 8Copyright © 2009 Pearson Education, Inc.
Example: Apportion the 15 graduate assistantships
15456Hamilton’s
13355Lower quota
14.999Standard
quota
8020188029403200Population
TotalChemistryBusinessEducation
3200
534.675.985
2940
534.675.498
1880
534.673.516

Chapter 15 Section 3 - Slide 9Copyright © 2009 Pearson Education, Inc.
The Quota Rule
An apportionment for every group under consideration should always be either the upper quota or the lower quota.

Chapter 15 Section 3 - Slide 10Copyright © 2009 Pearson Education, Inc.
Jefferson’s Method
1. Determine a modified divisor, d, such that when each group’s modified quota is rounded down to the nearest integer, the total of the integers is the exact number of items to be apportioned. We will refer to the modified quotas that are rounded down as modified lower quotas.
2. Apportion to each group its modified lower quota.

Chapter 15 Section 3 - Slide 11Copyright © 2009 Pearson Education, Inc.
Modified divisor = 480
15366Jefferson
3.91676.1256.67Modified
quota
14.999Standard
quota
8020188029403200Population
TotalChemistryBusinessEducation
3200
534.675.985
2940
534.675.498
1880
534.673.516

Chapter 15 Section 3 - Slide 12Copyright © 2009 Pearson Education, Inc.
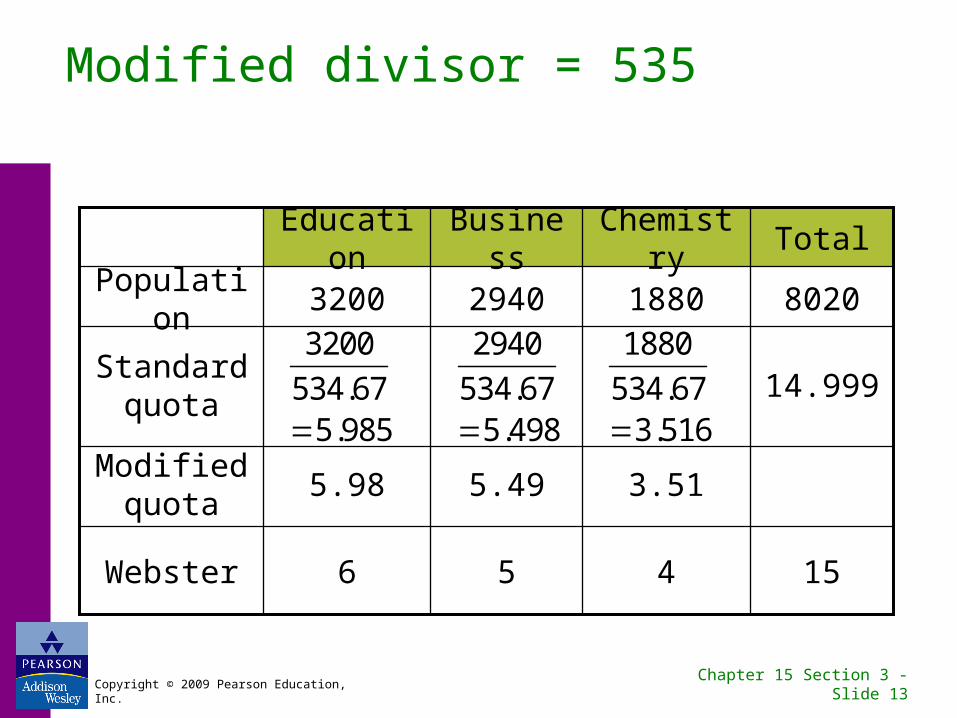
Webster’s Method
1. Determine a modified divisor, d, such that when each group’s modified quota is rounded to the nearest integer, the total of the integers is the exact number of items to be apportioned. We will refer to the modified quotas that are rounded to the nearest integer as modified rounded quotas.
2. Apportion to each group its modified rounded quota.
Chapter 15 Section 3 - Slide 13Copyright © 2009 Pearson Education, Inc.
Modified divisor = 535
15456Webster
3.515.495.98Modified
quota
14.999Standard
quota
8020188029403200Population
TotalChemistryBusinessEducation
3200
534.675.985
2940
534.675.498
1880
534.673.516

Chapter 15 Section 3 - Slide 14Copyright © 2009 Pearson Education, Inc.
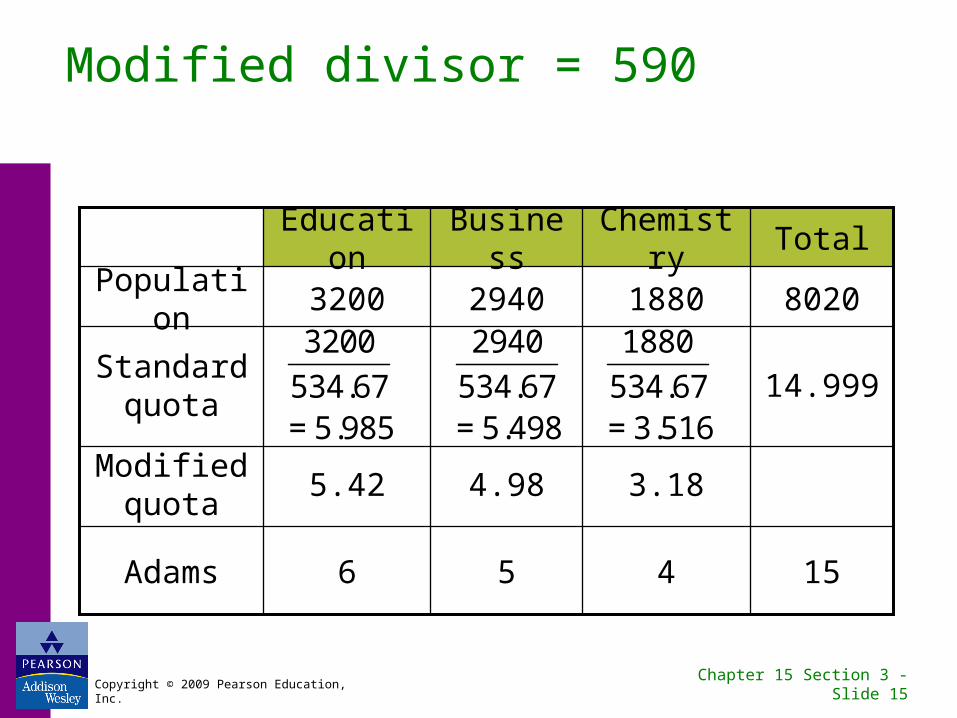
Adams’s Method
1. Determine a modified divisor, d, such that when each group’s modified quota is rounded up to the nearest integer, the total of the integers is the exact number of items to be apportioned. We will refer to the modified quotas that are rounded up as modified upper quotas.
2. Apportion to each group its modified upper quota.
Chapter 15 Section 3 - Slide 15Copyright © 2009 Pearson Education, Inc.
Modified divisor = 590
15456Adams
3.184.985.42Modified
quota
14.999Standard
quota
8020188029403200Population
TotalChemistryBusinessEducation
=
3200
534.675.985 =
2940
534.675.498 =
1880
534.673.516

Chapter 15 Section 4 - Slide 16Copyright © 2009 Pearson Education, Inc.
Three Flaws of Hamilton’s Method
The three flaws of Hamilton’s method are: the Alabama paradox, the population paradox, and the new-states paradox. These flaws apply only to Hamilton’s method
and do not apply to Jefferson’s method, Webster’s method, or Adam’s method.
In 1980 the Balinski and Young’s Impossibility Theorem stated that there is no perfect apportionment method that satisfies the quota rule and avoids any paradoxes.

Chapter 15 Section 4 - Slide 17Copyright © 2009 Pearson Education, Inc.
Alabama Paradox
The Alabama paradox occurs when an increase in the total number of items to be apportioned results in a loss of an item for a group.

Chapter 15 Section 4 - Slide 18Copyright © 2009 Pearson Education, Inc.
Example: Demonstrating the Alabama Paradox
A large company, with branches in three cities, must distribute 30 cell phones to the three offices. The cell phones will be apportioned based on the number of employees in each office shown in the table below.
900489250161Employees
Total321Office

Chapter 15 Section 4 - Slide 19Copyright © 2009 Pearson Education, Inc.
Example: Demonstrating the Alabama Paradox (continued) Apportion the cell phones using Hamilton’s
method. Does the Alabama paradox occur using
Hamilton’s method if the number of new cell phones increased from 30 to 31? Explain.

Chapter 15 Section 4 - Slide 20Copyright © 2009 Pearson Education, Inc.
Example: Demonstrating the Alabama Paradox (continued) Based on 30 cell phones, the table is as follows: (Note: standard divisor = 900/30 = 30)
900489250161Employees
291685Lower Quota
301686Hamilton’s
apportionment
16.38.335.37Standard Quota
Total321Office

Chapter 15 Section 4 - Slide 21Copyright © 2009 Pearson Education, Inc.
Example: Demonstrating the Alabama Paradox (continued) Based on 31 cell phones, the table is as follows: (Note: standard divisor = 900/31 ≈ 29.03)
900489250161Employees
291685Lower Quota
311795Hamilton’s
apportionment
16.848.615.55Standard Quota
Total321Office

Chapter 15 Section 4 - Slide 22Copyright © 2009 Pearson Education, Inc.
Example: Demonstrating the Alabama Paradox (continued) When the number of cell phones increased from
30 to 31, office one actually lost a cell phone, while the other two offices actually gained a cell phone under Hamilton’s apportionment.

Chapter 15 Section 4 - Slide 23Copyright © 2009 Pearson Education, Inc.
Population Paradox
The Population Paradox occurs when group A loses items to group B, even though group A’s population grew at a faster rate than group B’s.

Chapter 15 Section 4 - Slide 24Copyright © 2009 Pearson Education, Inc.
Example: Demonstrating Population Paradox
A school district with five elementary schools has funds for 54 scholarships. The student population for each school is shown in the table below.
5400106311339331538733Population
in 2003
5450111211339331539733Population
in 2005
D E TotalCBASchool

Chapter 15 Section 4 - Slide 25Copyright © 2009 Pearson Education, Inc.
Example: Demonstrating Population Paradox (continued) Apportion the scholarships using Hamilton’s
method. If the school wishes to give the same number
of scholarships two years later, does a population paradox occur?

Chapter 15 Section 4 - Slide 26Copyright © 2009 Pearson Education, Inc.
Solution
Based on the population in 2003, the table is as follows:
(Note: standard divisor = 5400/54 = 100)
16
15
15.38
1538
B
9
9
9.33
933
C
11
11
11.33
1133
D
54
52
5400
Total
11
10
10.63
1063
E
733Population in
2003
7Lower Quota
7Hamilton’s
apportionment
7.33Standard
Quota
ASchool

Chapter 15 Section 4 - Slide 27Copyright © 2009 Pearson Education, Inc.
Solution (continued) Based on the population in 2005, the table is as
follows: (Note: standard divisor = 5450/54 ≈ 100.93)
15
15
15.25
1539
B
9
9
9.24
933
C
11
11
11.23
1133
D
54
53
5450
Total
11
11
11.02
1112
E
733Population in
2005
7Lower Quota
8Hamilton’s
apportionment
7.26Standard
Quota
ASchool

Chapter 15 Section 4 - Slide 28Copyright © 2009 Pearson Education, Inc.
Solution (continued)
In the school district in 2005, school B actually gives one of its scholarships to school A, even though the population in school B actually grew by 1 student and the population in School A remained the same.
Chapter 15 Section 4 - Slide 29Copyright © 2009 Pearson Education, Inc.
New-States Paradox
The new-states paradox occurs when the addition of a new group reduces the apportionment of another group.

Chapter 15 Section 4 - Slide 30Copyright © 2009 Pearson Education, Inc.
Summary
Small states
Small states
Large states
Large states
Appointment method favors
NoNoNoYesMay produce the new-states paradox
NoNoNoYesMay produce the
population paradox
NoNoNoYesMay produce the Alabama paradox
YesYesYesNoMay violate the
quota rule
WebsterAdamsJeffersonHamilton
Apportionment Method

Slide 15 - 31Copyright © 2009 Pearson Education, Inc.
A country has four states and 40 seats in the legislature. The population of each state is shown below. Determine each state’s apportionment using Hamilton’s method.
a. 16, 8, 9, 7 b. 15, 8, 10, 7
c. 14, 9, 9, 8 d. 15, 9, 9, 7
State A B C D Total
Population 7800 4531 5122 3955 21,408

Slide 15 - 32Copyright © 2009 Pearson Education, Inc.
A country has four states and 40 seats in the legislature. The population of each state is shown below. Determine each state’s apportionment using Hamilton’s method.
a. 16, 8, 9, 7 b. 15, 8, 10, 7
c. 14, 9, 9, 8 d. 15, 9, 9, 7
State A B C D Total
Population 7800 4531 5122 3955 21,408

Slide 15 - 33Copyright © 2009 Pearson Education, Inc.
A country has four states and 40 seats in the legislature. The population of each state is shown below. Determine each state’s apportionment using Jefferson’s method.
a. 16, 8, 9, 7 b. 15, 8, 10, 7
c. 14, 9, 9, 8 d. 15, 9, 9, 7
State A B C D Total
Population 7800 4531 5122 3955 21,408

Slide 15 - 34Copyright © 2009 Pearson Education, Inc.
A country has four states and 40 seats in the legislature. The population of each state is shown below. Determine each state’s apportionment using Jefferson’s method.
a. 16, 8, 9, 7 b. 15, 8, 10, 7
c. 14, 9, 9, 8 d. 15, 9, 9, 7
State A B C D Total
Population 7800 4531 5122 3955 21,408

Slide 15 - 35Copyright © 2009 Pearson Education, Inc.
Practice Problems

Slide 15 - 36Copyright © 2009 Pearson Education, Inc.