Embed Size (px)
Citation preview
Copyright © 2009 Pearson Education, Inc. Chapter 12 Section 1 - Slide 1
Unit 7
Probability

Chapter 12 Section 1 - Slide 2Copyright © 2009 Pearson Education, Inc.
WHAT YOU WILL LEARN• Empirical probability and theoretical
probability• Compound probability, conditional
probability, and binomial probability• Odds against an event and odds in
favor of an event• Expected value• Tree diagrams

Chapter 12 Section 1 - Slide 3Copyright © 2009 Pearson Education, Inc.
WHAT YOU WILL LEARN
• Mutually exclusive events and independent events
• The counting principle, permutations, and combinations

Copyright © 2009 Pearson Education, Inc. Chapter 12 Section 1 - Slide 4
Section 4
Expected Value (Expectation)

Chapter 12 Section 1 - Slide 5Copyright © 2009 Pearson Education, Inc.
Expected Value
The symbol P1 represents the probability that the first event will occur, and A1 represents the net amount won or lost if the first event occurs.
P2 is the probability of the second event, and A2
is the net amount won or lost if the second event occurs.
And so on…
E P1A
1 P
2A
2 P
3A
3 ... P
nA
n

Chapter 12 Section 1 - Slide 6Copyright © 2009 Pearson Education, Inc.
Example
Teresa is taking a multiple-choice test in which there are four possible answers for each question. The instructor indicated that she will be awarded 3 points for each correct answer and she will lose 1 point for each incorrect answer and no points will be awarded or subtracted for answers left blank. If Teresa does not know the correct answer to
a question, is it to her advantage or disadvantage to guess?
If she can eliminate one of the possible choices, is it to her advantage or disadvantage to guess at the answer?

Chapter 12 Section 1 - Slide 7Copyright © 2009 Pearson Education, Inc.
Solution Expected value if Teresa guesses.
Therefore, over the long run, Theresa will neither gain nor lose points by guessing.
P guesses correctly 1
4
E 1
43 3
4 1
3
4
3
40
P guesses incorrectly 3
4

Chapter 12 Section 1 - Slide 8Copyright © 2009 Pearson Education, Inc.
Solution (continued) —eliminate a choice
Therefore, over the long run, Theresa will, on average, gain 1/3 point each time she guesses when she can eliminate one choice.
P guesses correctly 1
3
E 1
33 2
3 1
12
3
1
3
P guesses incorrectly 2
3
Chapter 12 Section 1 - Slide 9Copyright © 2009 Pearson Education, Inc.
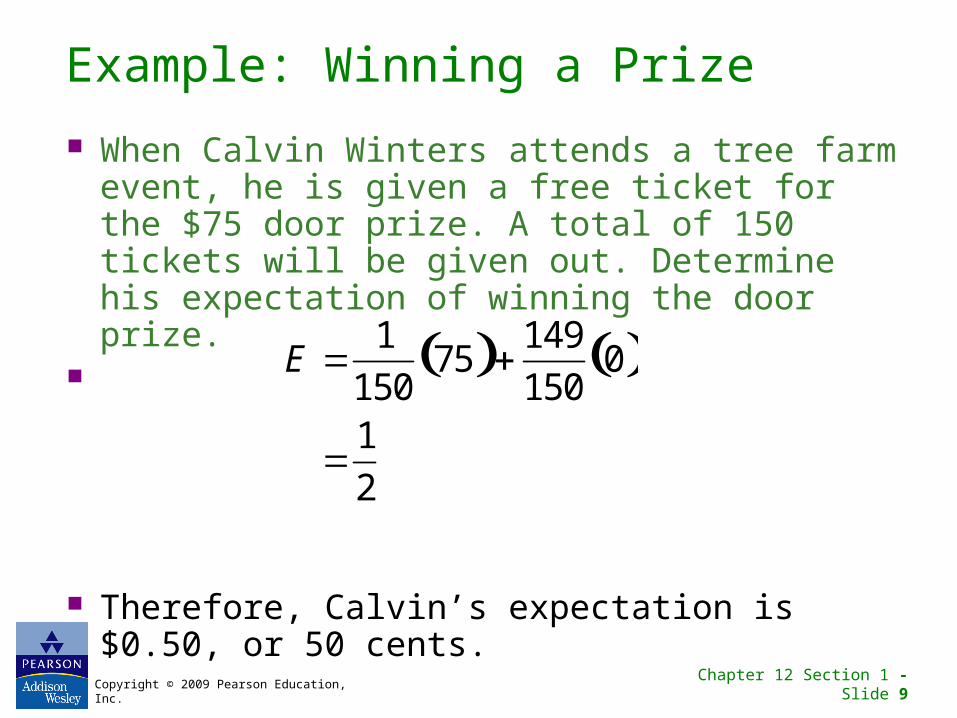
Example: Winning a Prize
When Calvin Winters attends a tree farm event, he is given a free ticket for the $75 door prize. A total of 150 tickets will be given out. Determine his expectation of winning the door prize.
Therefore, Calvin’s expectation is $0.50, or 50 cents.
E 1
15075 149
1500
1
2
Chapter 12 Section 1 - Slide 10Copyright © 2009 Pearson Education, Inc.
Example
When Calvin Winters attends a tree farm event, he is given the opportunity to purchase a ticket for the $75 door prize. The cost of the ticket is $3, and 150 tickets will be sold. Determine Calvin’s expectation if he purchases one ticket.

Chapter 12 Section 1 - Slide 11Copyright © 2009 Pearson Education, Inc.
Solution
Calvin’s expectation is $2.50 when he purchases one ticket.
1 14972 3
150 15072 447
150 150375
1502.50
E
Slide 12 - 12Copyright © 2009 Pearson Education, Inc.
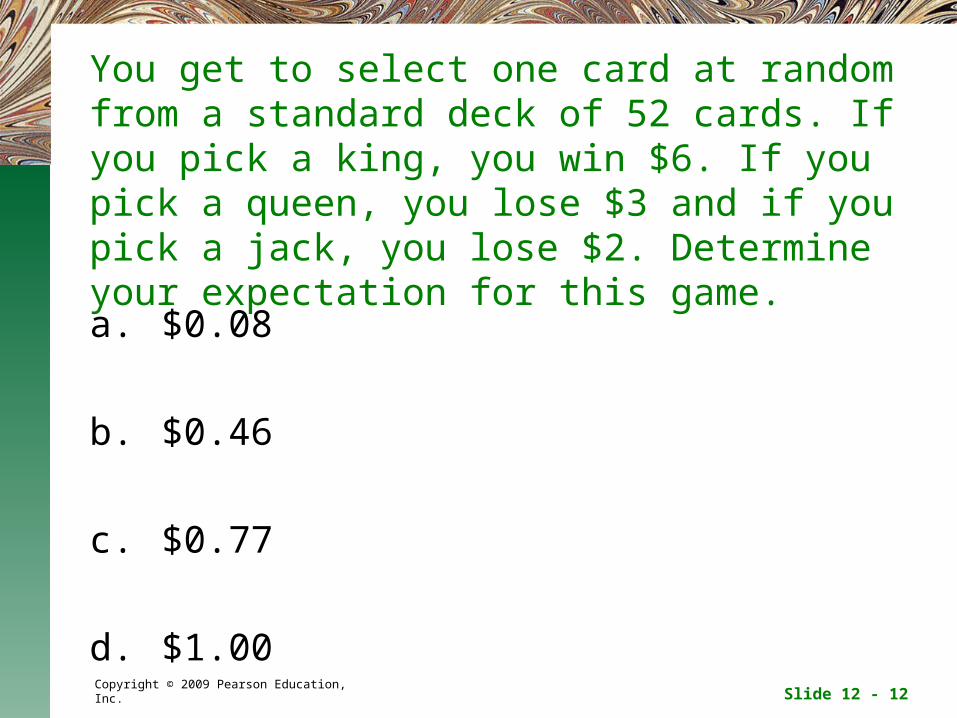
You get to select one card at random from a standard deck of 52 cards. If you pick a king, you win $6. If you pick a queen, you lose $3 and if you pick a jack, you lose $2. Determine your expectation for this game.
a. $0.08
b. $0.46
c. $0.77
d. $1.00

Slide 12 - 13Copyright © 2009 Pearson Education, Inc.
You get to select one card at random from a standard deck of 52 cards. If you pick a king, you win $6. If you pick a queen, you lose $3 and if you pick a jack, you lose $2. Determine your expectation for this game.
a. $0.08
b. $0.46
c. $0.77
d. $1.00

Chapter 12 Section 1 - Slide 14Copyright © 2009 Pearson Education, Inc.
Fair Price
Fair price = expected value + cost to play

Chapter 12 Section 1 - Slide 15Copyright © 2009 Pearson Education, Inc.
Example
Suppose you are playing a game in which you spin the pointer shown in the figure, and you are awarded the amount shown under the pointer. If it costs $10 to play the game, determine:
a) the expectation of the person who plays the game.
b) the fair price to play the game.
$10
$10
$2
$2
$20$15

Chapter 12 Section 1 - Slide 16Copyright © 2009 Pearson Education, Inc.
Solution
$0
3/8
$10
$10$5$8Amount Won/Lost
1/81/83/8Probability
$20$15$2Amt. Shown on Wheel
E 3
8 $8 3
8$0 1
8$5 1
8$10
24
8 0
5
8
10
8
9
8 1.125 $1.13
Chapter 12 Section 1 - Slide 17Copyright © 2009 Pearson Education, Inc.
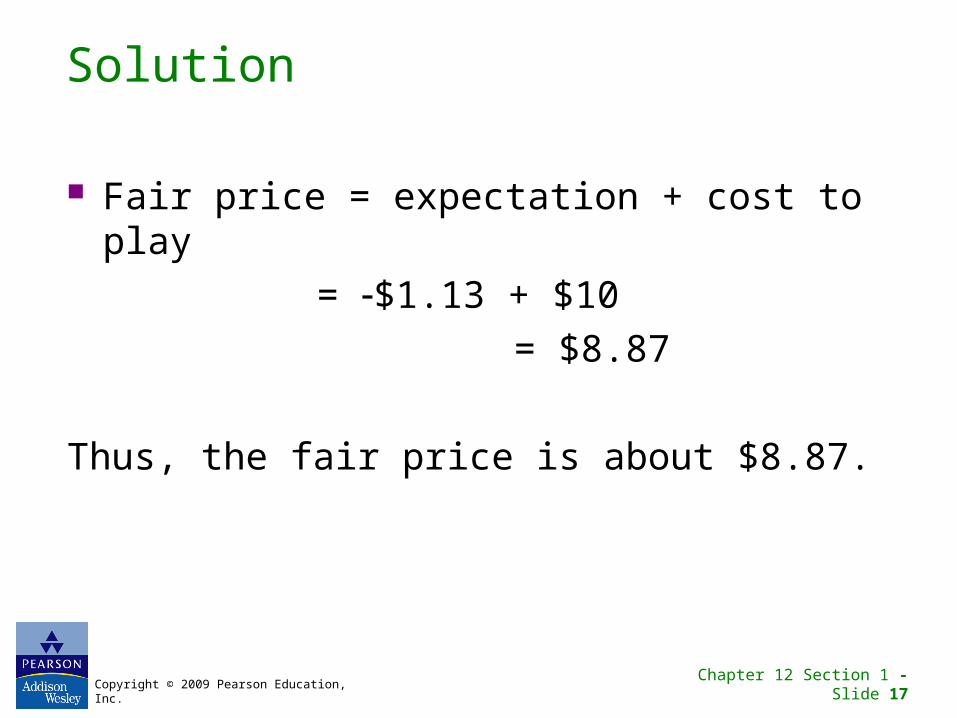
Solution
Fair price = expectation + cost to play
= $1.13 + $10
= $8.87
Thus, the fair price is about $8.87.
Copyright © 2009 Pearson Education, Inc. Chapter 12 Section 1 - Slide 18
Section 5
Tree Diagrams

Chapter 12 Section 1 - Slide 19Copyright © 2009 Pearson Education, Inc.
Counting Principle
If a first experiment can be performed in M distinct ways and a second experiment can be performed in N distinct ways, then the two experiments in that specific order can be performed in M • N distinct ways.

Chapter 12 Section 1 - Slide 20Copyright © 2009 Pearson Education, Inc.
Definitions
Sample space: A list of all possible outcomes of an experiment.
Sample point: Each individual outcome in the sample space.
Tree diagrams are helpful in determining sample spaces.

Chapter 12 Section 1 - Slide 21Copyright © 2009 Pearson Education, Inc.
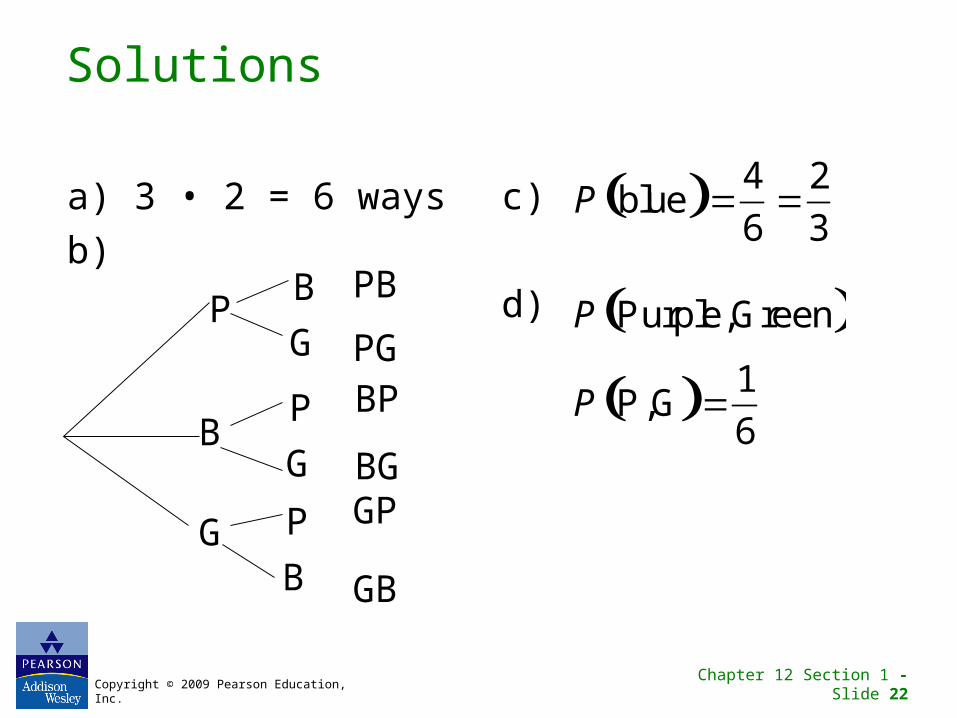
Example
Two balls are to be selected without replacement from a bag that contains one purple, one blue, and one green ball.
a) Use the counting principle to determine the number of points in the sample space.
b) Construct a tree diagram and list the sample space.
c) Find the probability that one blue ball is selected.
d) Find the probability that a purple ball followed by a green ball is selected.
Chapter 12 Section 1 - Slide 22Copyright © 2009 Pearson Education, Inc.
Solutions
a) 3 • 2 = 6 ways
b)
c)
d)
B
P
B
G
B
G
P
G
P
PB
PGBP
BGGP
GB
P blue 4
6
2
3
P Purple,Green P P,G 1
6
Slide 12 - 23Copyright © 2009 Pearson Education, Inc.
One die is rolled and one colored chip - black or white - is selected at random. Use the counting principle to determine the number of sample points in the sample space.
a. 6
c. 12
b. 8
d. 10

Slide 12 - 24Copyright © 2009 Pearson Education, Inc.
One die is rolled and one colored chip - black or white - is selected at random. Use the counting principle to determine the number of sample points in the sample space.
a. 6
c. 12
b. 8
d. 10
Chapter 12 Section 1 - Slide 25Copyright © 2009 Pearson Education, Inc.
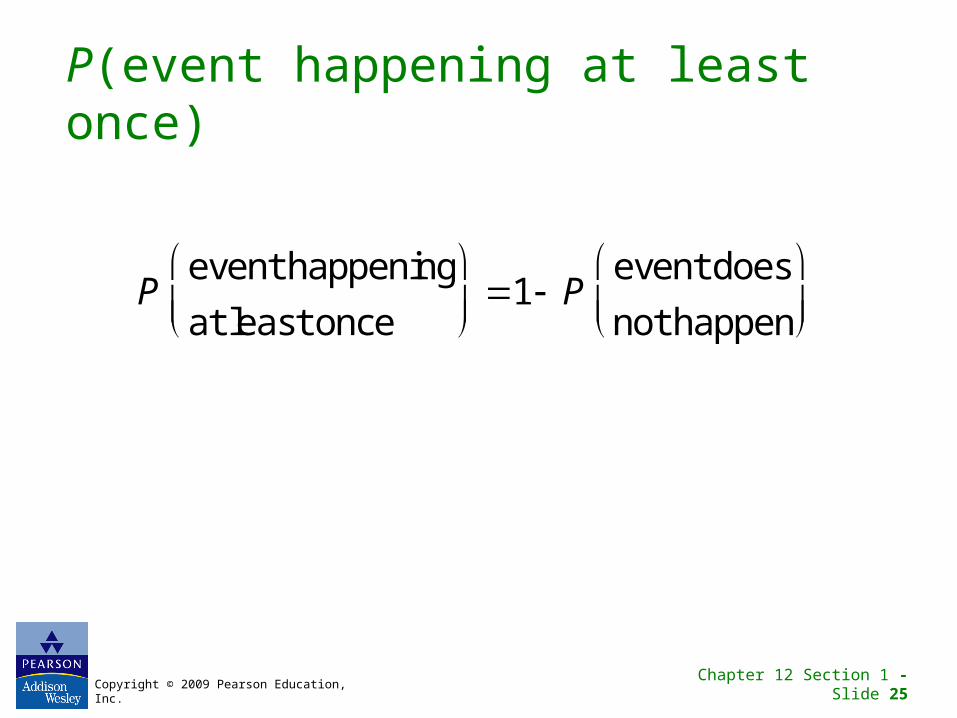
P(event happening at least once)
P
event happening
at least once
1 P
event does
not happen

Copyright © 2009 Pearson Education, Inc. Chapter 12 Section 1 - Slide 26
Section 6
Or and And Problems

Chapter 12 Section 1 - Slide 27Copyright © 2009 Pearson Education, Inc.
Or Problems
P(A or B) = P(A) + P(B) P(A and B) Example: Each of the numbers 1, 2, 3, 4, 5, 6,
7, 8, 9, and 10 is written on a separate piece of paper. The 10 pieces of paper are then placed in a bowl and one is randomly selected. Find the probability that the piece of paper selected contains an even number or a number greater than 5.

Chapter 12 Section 1 - Slide 28Copyright © 2009 Pearson Education, Inc.
Solution
P(A or B) = P(A) + P(B) P(A and B)
Thus, the probability of selecting an even number or a number greater than 5 is 7/10.
Peven or
greater than 5
P even P greater than 5 Peven and
greater than 5
5
10
5
10
3
10
7
10

Chapter 12 Section 1 - Slide 29Copyright © 2009 Pearson Education, Inc.
Example
Each of the numbers 1, 2, 3, 4, 5, 6, 7, 8, 9, and 10 is written on a separate piece of paper. The 10 pieces of paper are then placed in a bowl and one is randomly selected. Find the probability that the piece of paper selected contains a number less than 3 or a number greater than 7.

Chapter 12 Section 1 - Slide 30Copyright © 2009 Pearson Education, Inc.
Solution
There are no numbers that are both less than 3 and greater than 7. Therefore,
P less than 3 2
10
P greater than 7 3
10
P
less than 3 or
greater than 7
2
10
3
10 0
5
10
1
2
Chapter 12 Section 1 - Slide 31Copyright © 2009 Pearson Education, Inc.
Mutually Exclusive
Two events A and B are mutually exclusive if it is impossible for both events to occur simultaneously.

Chapter 12 Section 1 - Slide 32Copyright © 2009 Pearson Education, Inc.
Example
One card is selected from a standard deck of playing cards. Determine the probability of the following events.
a) selecting a 3 or a jack
b) selecting a jack or a heart
c) selecting a picture card or a red card
d) selecting a red card or a black card
Chapter 12 Section 1 - Slide 33Copyright © 2009 Pearson Education, Inc.
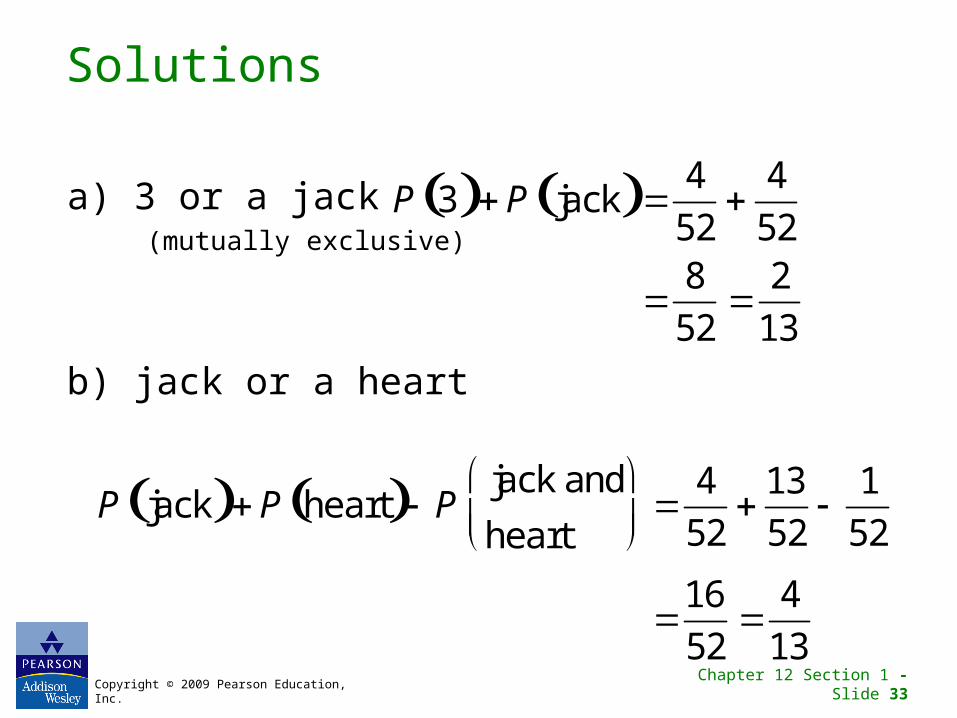
Solutions
a) 3 or a jack (mutually exclusive)
b) jack or a heart
P 3 P jack 4
52
4
52
8
52
2
13
P jack P heart Pjack and
heart
4
52
13
52
1
52
16
52
4
13
Chapter 12 Section 1 - Slide 34Copyright © 2009 Pearson Education, Inc.
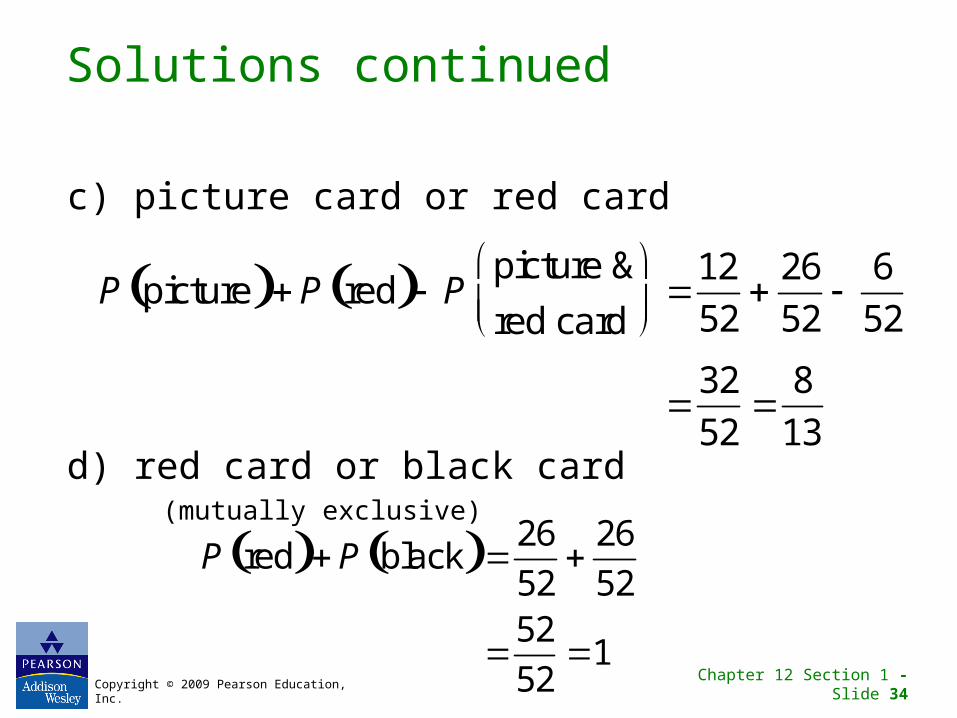
Solutions continued
c) picture card or red card
d) red card or black card (mutually exclusive)
P picture P red Ppicture &
red card
12
52
26
52
6
52
32
52
8
13
P red P black 26
52
26
52
52
521
Chapter 12 Section 1 - Slide 35Copyright © 2009 Pearson Education, Inc.
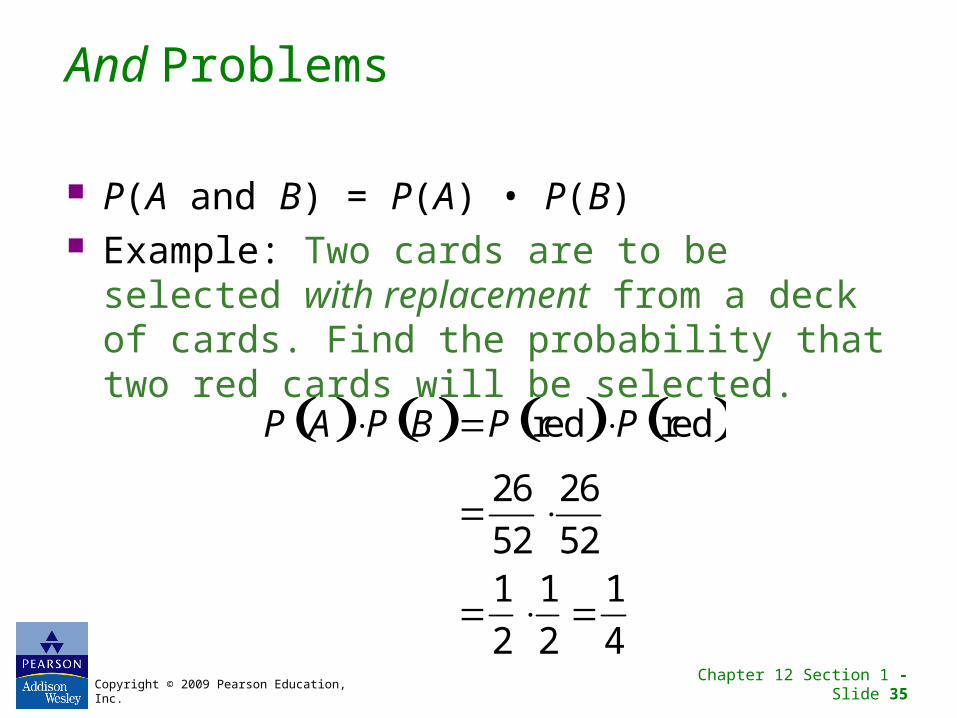
And Problems
P(A and B) = P(A) • P(B) Example: Two cards are to be selected with
replacement from a deck of cards. Find the probability that two red cards will be selected.
P A P B P red P red
26
5226
52
1
21
2
1
4

Chapter 12 Section 1 - Slide 36Copyright © 2009 Pearson Education, Inc.
Example
Two cards are to be selected without replacement from a deck of cards. Find the probability that two red cards will be selected.
red red
26 25
52 511 25 25
2 51 102
P A P B P P
Chapter 12 Section 1 - Slide 37Copyright © 2009 Pearson Education, Inc.
Independent Events
Event A and Event B are independent events if the occurrence of either event in no way affects the probability of the occurrence of the other event.
Experiments done with replacement will result in independent events, and those done without replacement will result in dependent events.

Slide 12 - 38Copyright © 2009 Pearson Education, Inc.
One die is rolled and one colored chip - black or white - is selected at random. Determine the probability of obtaining an even number and the color white.
a.
c.
1
2
1
3b.
d.
1
6
1
4

Slide 12 - 39Copyright © 2009 Pearson Education, Inc.
One die is rolled and one colored chip - black or white - is selected at random. Determine the probability of obtaining an even number and the color white.
a.
c.
1
2
1
3b.
d.
1
6
1
4
Chapter 12 Section 1 - Slide 40Copyright © 2009 Pearson Education, Inc.
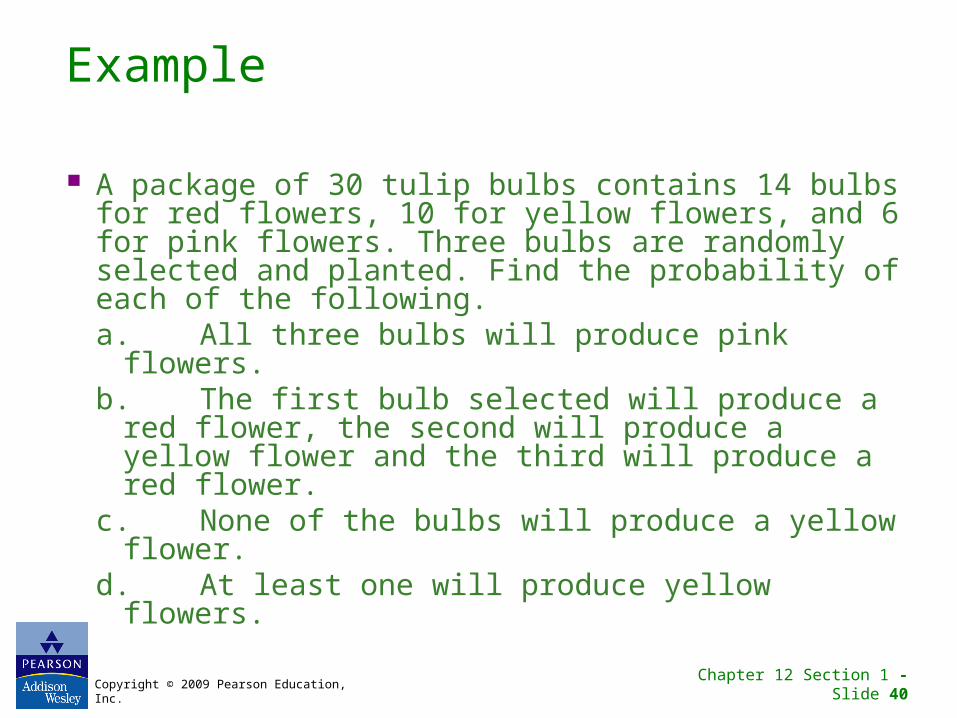
Example
A package of 30 tulip bulbs contains 14 bulbs for red flowers, 10 for yellow flowers, and 6 for pink flowers. Three bulbs are randomly selected and planted. Find the probability of each of the following.a.All three bulbs will produce pink flowers.b.The first bulb selected will produce a red
flower, the second will produce a yellow flower and the third will produce a red flower.
c.None of the bulbs will produce a yellow flower.
d.At least one will produce yellow flowers.

Chapter 12 Section 1 - Slide 41Copyright © 2009 Pearson Education, Inc.
Solution
30 tulip bulbs, 14 bulbs for red flowers, 10 for yellow flowers, and 6 for pink flowers.
a. All three bulbs will produce pink flowers.
P 3 pink P pink 1 P pink 2 P pink 3
6
30
5
29
4
28
1
203
Chapter 12 Section 1 - Slide 42Copyright © 2009 Pearson Education, Inc.
Solution (continued)
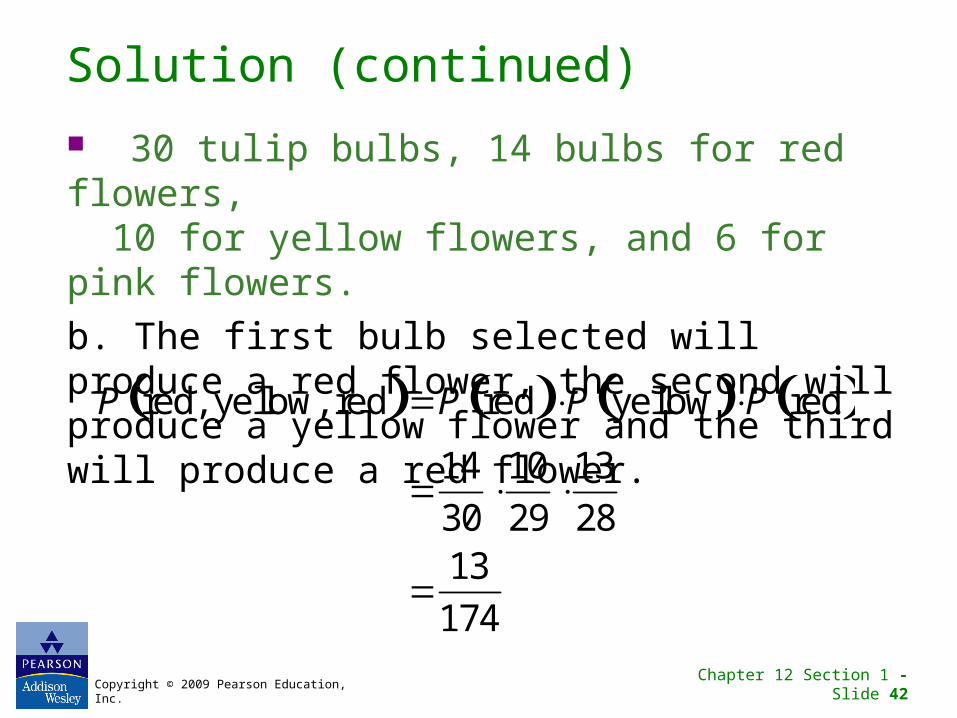
30 tulip bulbs, 14 bulbs for red flowers,0010 for yellow flowers, and 6 for pink flowers.
b. The first bulb selected will produce a red flower, the second will produce a yellow flower and the third will produce a red flower.
P red, yellow, red P red P yellow P red
14
3010
2913
28
13
174

Chapter 12 Section 1 - Slide 43Copyright © 2009 Pearson Education, Inc.
Solution (continued)
30 tulip bulbs, 14 bulbs for red flowers,0010 for yellow flowers, and 6 for pink flowers.
c. None of the bulbs will produce a yellow flower.
Pnone
yellow
P
first not
yellow
P
second not
yellow
P
third not
yellow
20
3019
2918
28
57
203
Chapter 12 Section 1 - Slide 44Copyright © 2009 Pearson Education, Inc.
Solution (continued)
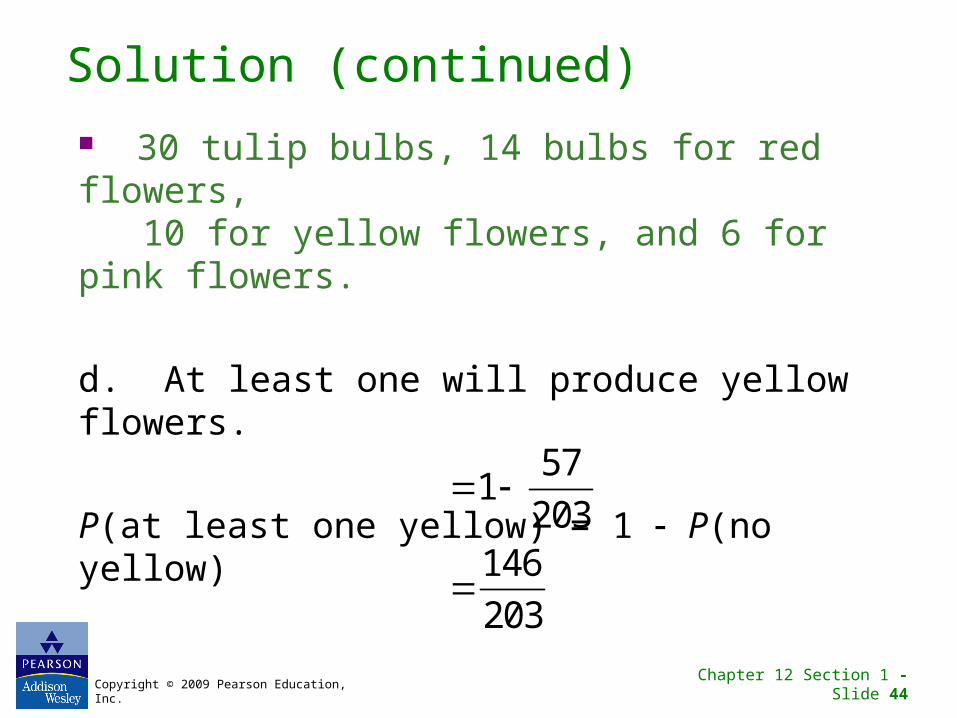
30 tulip bulbs, 14 bulbs for red flowers, 10 for yellow flowers, and 6 for pink flowers.
d. At least one will produce yellow flowers.
P(at least one yellow) = 1 P(no yellow)
157
203
146
203