Embed Size (px)
Citation preview
Copyright© 2008 TSI Incorporated
Nanoparticle Monitoring in Occupational Environments –
Comparing and ContrastingMeasurement Metrics
TSI Incorporated 2008
Nanotechnology and Occupational Health and Safety Education Series

Copyright© 2008 TSI Incorporated
Agenda
• Nanoparticle exposure • Traditional IH aerosol
measurements• What is nanotechnology?• Filtration mechanisms• Engineering controls• Current measurement metrics
for nanoparticles• Working towards best practices• Multi-metric sampling and
control approaches• Summary• References
Horizontal zinc oxide nanowires on sapphire surface
Image credit: Courtesy National Institute of Standards and Technology

Copyright© 2008 TSI Incorporated
Nanoparticle Exposure
• Increasing commercial development
• Worker exposure is a concern
• Nano-scale materials exhibit new properties– Follow laws of quantum physics– Determines new properties
• Occupational health risks are not clearly understood
“Buckyball” designed for drug delivery
Image credit: Courtesy LUNA Innovations

Copyright© 2008 TSI Incorporated
Nanoparticle Exposure
• Routes of exposure– Inhalation
• Most common/efficient• Most well understood
– Dermal contact• Less work done here• Just a few studies (e.g., Beryllium, Nano Safe II in Europe)
– Ingestion• Little interaction between pharmaceutical industry & toxicologists and
epidemiologists• Questions about adverse health effects and ingestion

Copyright© 2008 TSI Incorporated
Nanoparticle Exposure
• Solubility• Particle size• Particle shape• Particle number
• Surface Area• Composition• Surface coatings• Surface chemistry• Others?
Properties That Contribute to Nanoparticle Toxicity

Copyright© 2008 TSI Incorporated
Nanoparticle Exposure
Current research indicates that mass and bulk chemistry may be less important than particle size, surface area, and surface chemistry for nanostructured materials
(Oberdörster et al. 1992, 1994a,b; Duffin et al. 2002)

Copyright© 2008 TSI Incorporated
Nanoparticle Exposure
Nanoparticle Exposure Studies
• Dr. Driscoll (1996) and Dr. Oberdörster (2001) have shown that surface area (μm2/cc) plays an important role in the toxicity of nanoparticles
• Surface area is the metric that is highly correlated with particle-
induced adverse health effects (Driscoll, 1996; Oberdörster, 2001)
• Potential for adverse health effects is proportional to particle
surface area (Driscoll, 1996; Oberdörster, 2001)

Copyright© 2008 TSI Incorporated
Nanoparticle Exposure
What experts say
If nanoparticles can . . . i. Deposit in the lung and remain thereii. Have active surface chemistry iii. Interact with the body
. . . there is the potential for exposure and dosing

Copyright© 2008 TSI Incorporated
Nanoparticle Exposure
• Relatively few occupational studies– Compared to overall money spent on
nanotechnology– More are being conducted
• Most studies in research settings• Lack of exposure metrics to
compare/contrast – What is a good vs. high number?– Emerging issue for OH&S
• Monitoring equipment is available– Some not considered IH optimized

Copyright© 2008 TSI Incorporated
Nanoparticle Exposure
• Inadequate protection– Engineering controls or PPE
• Material handling or mixing– Increase chance of fugitive emissions
• Fugitive emissions– From non-enclosed or controlled
production or process systems
• Maintenance activities
Similar to what you already find!
Workplace Conditions Likely to Cause Exposure to Nanoparticles

Copyright© 2008 TSI Incorporated
Traditional IH Aerosol Measurements

Copyright© 2008 TSI Incorporated
Traditional IH Aerosol Measurements
Exposure limits based on mass• Size range of ~0.1 – 100 µm
• Toxicity data
• Lung deposition models relating to size selective sampling protocols

Copyright© 2008 TSI Incorporated
Traditional IH Aerosol Measurements
• OSHA, 2 sizes– Total dust, ≤100 µm
• Deposits in all areas of the respiratory tract
– Respirable dust, ≤4 µm• Subset of total dust,
deposits in alveolar region of the respiratory tract
• ACGIH/ISO/CEN, 3 sizes– Inhalable, ≤100 µm
• Deposits in all areas of the respiratory tract
– Thoracic, ≤10 µm • Subset of inhalable, deposits in
the tracheobronchial and alveolar regions
– Respirable, ≤4 µm• Subset of thoracic, deposits in
the alveolar region
Lung deposited size fractions

Copyright© 2008 TSI Incorporated
Traditional IH Aerosol Measurements
Mass measurement methods• Gravimetric sampling
– Personal air sampling systems• Worn by the worker• Breathing zone sampling for personal exposure• Personal sample pump/inlet conditioner/media
– Area air sampling systems• Work area sampling • For area sampling, baseline screening and trend analysis• Pump/inlet conditioner/media
• Personal or higher volume pump used

Copyright© 2008 TSI Incorporated
Traditional IH Aerosol Measurements
Mass measurement methods• Direct-reading instruments
– Photometers
• Incorporate same sampling methodologies as gravimetric– Inlet conditioners
– Personal sampling
– Area sampling
Copyright© 2008 TSI Incorporated
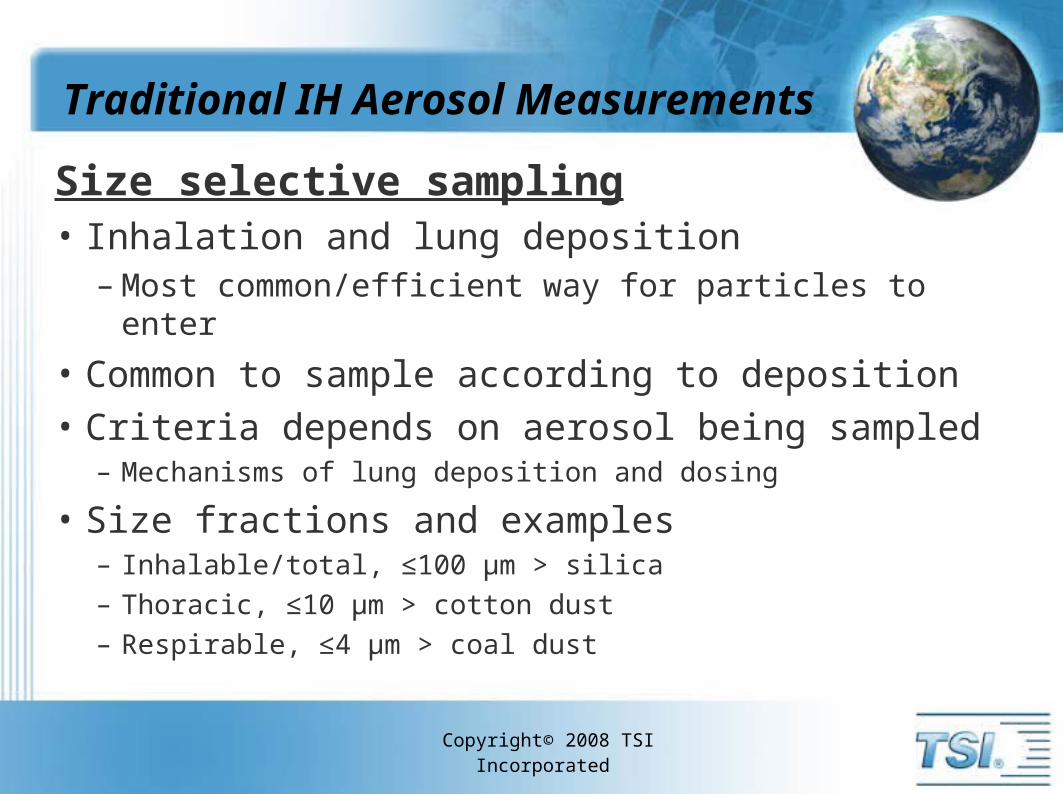
Traditional IH Aerosol Measurements
Size selective sampling• Inhalation and lung deposition
– Most common/efficient way for particles to enter
• Common to sample according to deposition• Criteria depends on aerosol being sampled
– Mechanisms of lung deposition and dosing
• Size fractions and examples– Inhalable/total, ≤100 µm > silica– Thoracic, ≤10 µm > cotton dust– Respirable, ≤4 µm > coal dust

Copyright© 2008 TSI Incorporated
Traditional IH Aerosol Measurements
Based on International Commission of Radiological Protection (1994) and U.S. Environmental Protection Agency (1996a).Air Quality Criteria for Particulate matter, 2004, p 6-5.
• The respiratory tract consists of 3 major regions– Extrathoracic region:
uppermost region– Tracheobronchial (TB)
region: middle region– Alveolar (A) region:
innermost region

Copyright© 2008 TSI Incorporated
What is Nanotechnology?
. . . .technologies, that measure, manipulate, or incorporate material or features with at least one critical dimension between ~ 1 nanometer and 100 nanometers . . .
. . . whose applications exploit properties, distinct from bulk/macroscopic systems, that arise from their scale/critical dimension . . .
Note: terminology from ASTM Committee E56, definitions are only considerations

Copyright© 2008 TSI Incorporated
What is Nanotechnology?
Nanotechnology
“The art and science of building stuff that does stuff at the nanometer scale.”
Richard Smalley (1943 – 2005)
Nobel Prize Winner, Chemistry (1996)

Copyright© 2008 TSI Incorporated
What is Nanotechnology?
Coarse particle – ≤10 µm
Fine particle – ≤2.5 µm
Ultrafine particle – ≤0.1 µm (100nm)
Nanoparticle
• Dimensions between 1 and 100 nm in at least one dimension
• Nanoparticle size may go up to 200 – 300 nm for occupational exposure
Note: terminology from ASTM Committee E56, definitions are only considerations

Copyright© 2008 TSI Incorporated
What is Nanotechnology?
Aggregate
• A group of particles that are strongly bonded together (e.g., fused, sintered, or metallically bonded)
Agglomerate
• A group of particles held together by relatively weak forces (e.g., van der waals, capillary, etc.) that may break apart into smaller agglomerates, aggregates or primary particles upon handling

Copyright© 2008 TSI Incorporated
What is Nanotechnology?
• Earth = 12756 km• Soccer ball = 0.2264 m
– Difference 1.77 x10⁻⁸
• Soccer ball = 0.2264 m• 10 nm particle = 10x10-9 m
– Difference 4.44 x 10⁻⁸
How small are nanoparticles?
Source: Professor David Pui, University of Minnesota
Copyright© 2008 TSI Incorporated
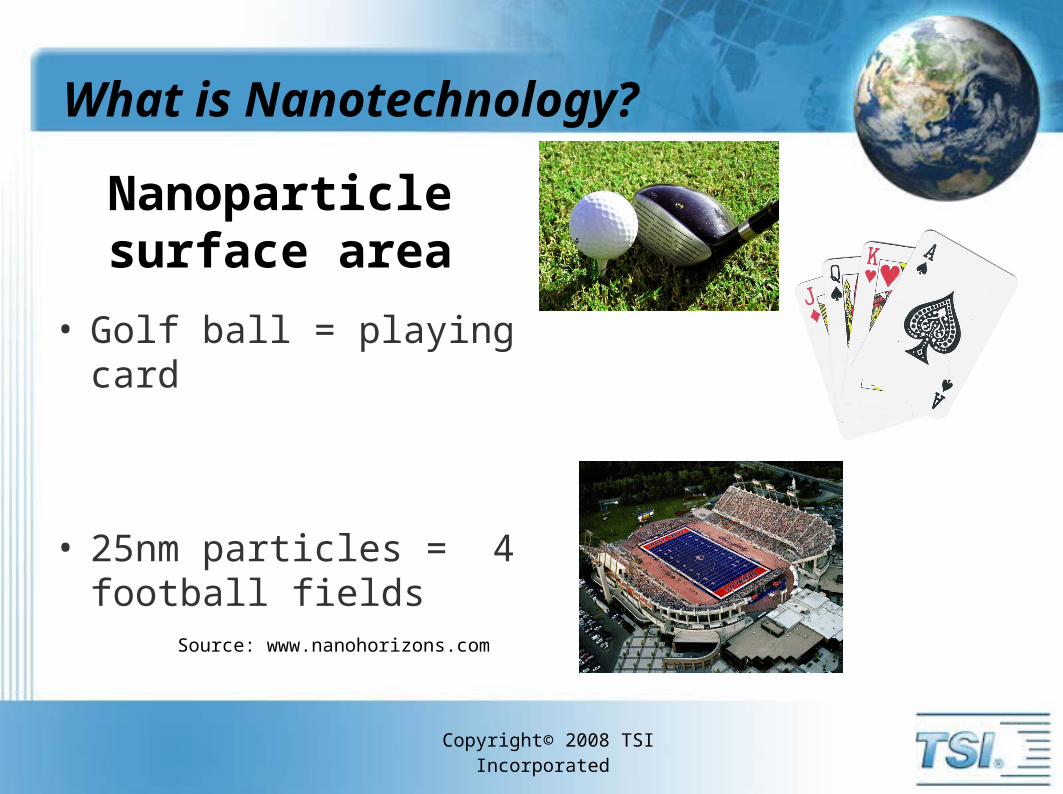
What is Nanotechnology?
• Golf ball = playing card
• 25nm particles = 4 football fields
Nanoparticle surface area
Source: www.nanohorizons.com

The Scale of Things – Nanometers and More
Things Natural Things Manmade
Ant~ 5 mm
Head of a pin1 - 2 mm
Dust Mite~ 200 μm
Red blood cellswith white cell
~ 2 - 5 μm
Human Hair~ 60 - 120 μm wide
Carbon nanotube~ 1.3 nm diameter
DNA~ 2 1/2 nmDiameter
Carbon buckyball~ 1 nm Diameter
Micro Electro Mechanical(MEMS) devices10 - 100 μm wide
Adapted from Office of Basic Energy Sciences,Office of Science, U.S. Department of Energy

0.001 0.01 0.1 1 10 100Particle Size Range (micrometers)
Ty
pes
of
Par
ticl
es
BacteriaVirus
Oil Smoke
Diesel Engine Exhaust
Combustion Nuclei
Soot
Inhalable
(Total dust)
Respirable
Thoracic
Pollen
Particle Sizes
Construction ActivitiesCarbon Black
Welding Fume
4
Sea salt
Tobacco smokeCoal Dust (mining)
Paint Pigment
Vacuuming
Wind blown dust
Volcanic emissions
Environmental / Naturally Occurring Particles
Workplace / man-made Particles
Fly Ash
Nanoparticle

Copyright© 2008 TSI Incorporated
Nanoparticle Sources
Nanoparticles and ultrafine particles
• Capable of depositing in all areas of the lung
• Essentially the same size range– How they are produced that is different
• Look at them as one group

Copyright© 2008 TSI Incorporated
Nanoparticle Sources
Naturally Occurring / Biogenic
• Forest fires• Volcanic activity• Sea-spray salt• Photochemical reactions
high in the atmosphereSt Helens erupting on May 18, 1980. Source: NASA

Copyright© 2008 TSI Incorporated
Nanoparticle Sources
Manmade / Incidental• Unintentionally produced byproducts• Products of combustion/high energy
operations• Produced by chemical reactions
Examples• Combustion aerosols – many sources!
– Welding and cutting – Engine emissions – Heating/furnace emissions – Coal fired power plant emissions– Cooking exhaust– Copiers, faxes and printers

Copyright© 2008 TSI Incorporated
Nanoparticle Sources
• Intentionally manufactured from homogeneous materials
Examples• Carbon nanotubes • Carbon nanowires and ropes• Buckminster fullerenes • Quantum dots• Nanocoatings• Nanolayers• Nanoshells
Engineered Nanoparticles
Source: AZONANO.com

Copyright© 2008 TSI Incorporated
Manufacturing Processes
• Plasma reactors• Laser ablation• Flame reactors• Flame spray pyrolysis• Furnace reactors
• Plasma heating• Sputtering• Sparking• Spray evaporation• Spray pyrolysis
Nanoparticle Manufacturing Methods

Copyright© 2008 TSI Incorporated
Nanoparticles vs. Large Particles
• Relatively little mass– Mass of 1 billion 10 nm
particles = mass of 10 µm particle
• Large surface area• Produced in large numbers• Quantum effects
– Change their physical, chemical, and biological properties
• Behave like gases– Stay suspended for weeks
• Disperse quickly– Reach equilibriium (high → low)– Pressure differentials provide
transport pathways
• Tend to agglomerate quickly after production
• Health effects are not completely understood
Nanoparticle Properties and Behavior

Copyright© 2008 TSI Incorporated
Nanoparticles vs. Large Particles
• Aerosol researchers have shown worldwide…
– 86% of the total number of particles in a unit volume of air make up <1% of the mass
– 14% of the total number of particles make up >99% of the mass

Copyright© 2008 TSI Incorporated
Present Nanotechnology
• Nanotechnology is now!• US is the largest producer of
nanomaterials• Material science research
focus• Intense scientific application
study– Chemical, plastics/polymers,
optical, electronics, semiconductor, pharmaceutical, biomedical
• Passive nanotechnology– Enhancement of existing
products with new properties/functions
– Products are additives/ components
• Active nanotechnology– Products change state
during operation

Copyright© 2008 TSI Incorporated
Nanotechnology Applications
Current applications• Longer lasting rubber compounds• Plastics (bumpers on cars)• Polymers and composites• Cement/concrete additives• Paints, pigments, inks and coatings• Stain- and wrinkle-free clothing• Sunscreen and cosmetics• Protective and glare reducing coatings• Appliances and food storage containers
– Silver nanoparticles inhibit the growth of microorganisms
www.nanotechproject.org/consumerproducts

Copyright© 2008 TSI Incorporated
Filtration Mechanisms
Filtration• Used extensively
– General / dilution ventilation (HVAC)– Local exhaust ventilation (engineering controls)– Respiratory protection (air purifying respirators and filtering
face pieces) • Air filters are classified as
– Mechanical filters– Electrostatic filters (not ESPs)
• There are many differences between filters although they all use fibrous media
• Many different fibers are used– Cotton, fiberglass, polyester, polypropylene

Copyright© 2008 TSI Incorporated
Filtration Mechanisms
• Fibrous filters of different design are used for various applications– Flat-panel filters– Pleated filters– Pocket or bag filters– Respirator cartridges

Copyright© 2008 TSI Incorporated
Filtration Mechanisms
Mechanisms• There are 4 types of collection mechanisms that
govern filter performance– Impaction occurs when a particle due to inertia deviates
from the air stream and collides with a fiber– Interception occurs when a particle due to it’s size simply
collides with a fiber in the air stream– Diffusion occurs when a particle due to random motion
causes it to collide with a fiber in the air stream– Electrostatic attraction occurs when a fiber is contacted by
a very small particle and is held in place by a weak electrostatic force

Copyright© 2008 TSI Incorporated
Filtration Mechanisms
Adapted from Guidance for Filtration and Air-Cleaning Systems for Protecting
Building Environments, NIOSH

Copyright© 2008 TSI Incorporated
Filtration Mechanisms
• Impaction and interception are dominant for collecting particles >0.2 µm
• Diffusion is dominant for collecting particles <0.2 µm (200 nm)
• As mechanical filters load with particles their collection efficiency increases
• The combined effects of these 3 collection mechanisms yields the classic collection efficiency curve

Copyright© 2008 TSI Incorporated
Filtration Mechanisms
This figure is adapted from Lee et al. [1980].

Copyright© 2008 TSI Incorporated
Filtration Mechanisms
• Particles from 0.2 – 0.4 µm, most difficult to stop
• Collection efficiency for nanoparticles by diffusion is as efficient as larger particles by inertial impaction and interception
Filter Testing Methods– Photometers, Optical Particle Counters (OPCs), and CPCs
are used in filter-testing
– CPCs and photometers are used in quantitative respirator fit-testing

Copyright© 2008 TSI Incorporated
Filtration Mechanisms
Testing and current work• Current knowledge indicates the well designed
exhaust ventilation systems using HEPA filters effectively remove nanoparticles (Hinds 1999) – Apply current ACGIH ventilation design criteria for the
“control of particulate matter” for nanoparticles

Copyright© 2008 TSI Incorporated
Filtration Mechanisms
Testing and current work • Respiratory protection
– No specific recommendations on types of respirators• Use P100 filters for highest level of protection
– Respirator filters are tested at 300 nm (0.3 µm) size particles• Most penetrating particle size (MPPS)
– Collection efficiencies for smaller particles should exceed the measured collection efficiency of 300 nm particles (Lee and Liu 1982)
– If a respirator works for MPPS, it should work for all particles– NIOSH tested HEPA filters with nanoparticles in 2003
• Found that P100 filters good down to at least 2.5 nm
– Quantitative CPC fit-testing with particles down to 20 nm for testing respirator fit using HEPA/P100 filter cartridges
• Uses nanoparticles as the test agent• Face seal is the leak/test point

Copyright© 2008 TSI Incorporated
Filtration Mechanisms
Testing and current work • For respiratory protection the real question is:
– Are the assigned protection factors currently used for respirators good enough for nanotechnology applications
– In the absence of exposure limits it is hard to determine if an assigned protection factor is good enough for a given respirator
– Be conservative, use full-face APR or SCBA, and use engineering controls to ensure exposure is at a minimum

Copyright© 2008 TSI Incorporated
Engineering Controls
Fundamental Control Assumptions• Typically support engineering and maintenance
departments– IH’s provide guidance, calculations, and design assistance– Evaluate and validate systems upon start up
• Five fundamental control assumptionsi. All hazards can be controlled to some degree by some
methodii. There are alternative approaches to controliii. More than one control may be useful or requirediv. Some control methods are more cost-effective than othersv. Controls may not completely control the hazard

Copyright© 2008 TSI Incorporated
Engineering Controls
Engineering Control Techniques
• Ventilation – General/dilution ventilation– Local exhaust ventilation
• Substitution• Enclosure• Isolation• Process change• Process automation• Process elimination
Other controls• Prevention• Administrative controls• Work practices• Personal protective
equipment

Copyright© 2008 TSI Incorporated
Engineering Controls
General/Dilution Ventilation• Remove air from general area, replace with dilution air • Dilution of contaminated air with non-contaminated air
in a general area• Not as good for health hazard control as local exhaust• Limiting factors for general/dilution ventilation
– Quantity of contaminant too great to use dilution– Contaminant source too close to worker– Toxicity of contaminant must be low– Contaminant source must be constant

Copyright© 2008 TSI Incorporated
Engineering Controls
General/Dilution Ventilation
• Typically not good for dusts and fumes– Due to high toxicity, requires more dilution air– Higher concentrations of contaminant produced– In the past hard to measure contaminants
• Easier to do now with real time monitors

Copyright© 2008 TSI Incorporated
Engineering Controls
Local Exhaust Ventilation
• Proper design necessary – Capture velocity is dependent on moving air past a
contaminant source– Drawing it into an exhaust hood – Using an enclosure to capture particles
• Negative pressure used to lower exposure • Positive pressure used to increase quality and output
Copyright© 2008 TSI Incorporated
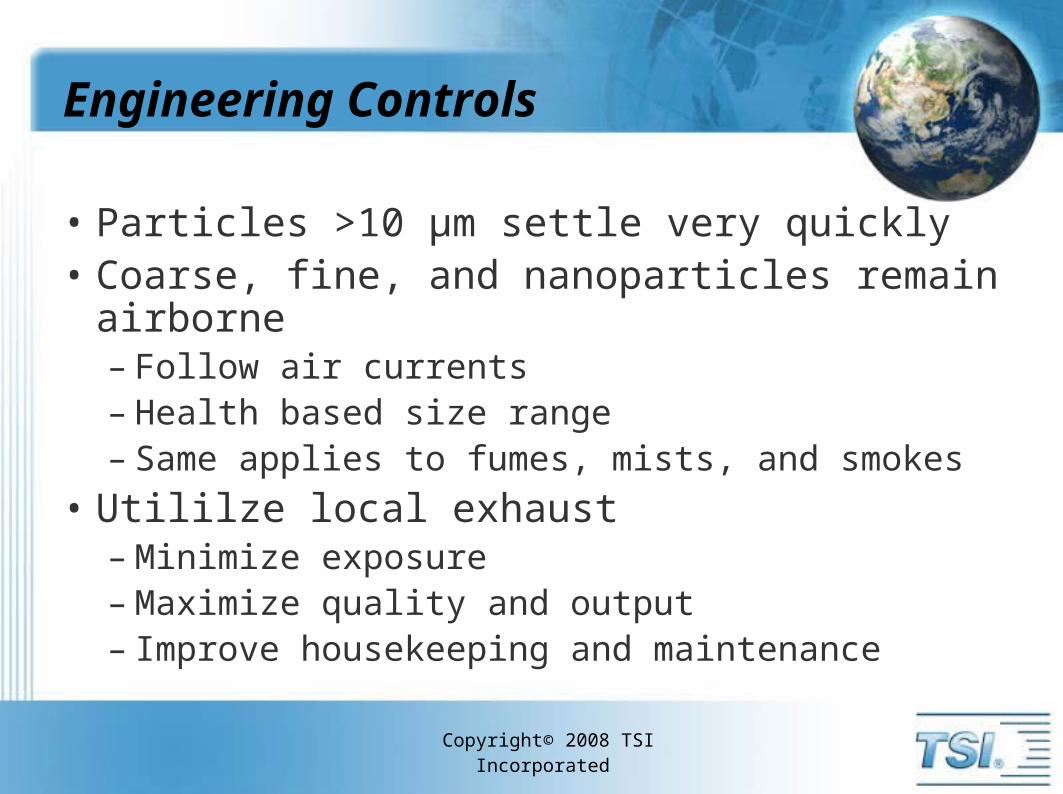
Engineering Controls
• Particles >10 µm settle very quickly • Coarse, fine, and nanoparticles remain airborne
– Follow air currents– Health based size range– Same applies to fumes, mists, and smokes
• Utililze local exhaust– Minimize exposure– Maximize quality and output– Improve housekeeping and maintenance

Copyright© 2008 TSI Incorporated
Engineering Controls
Examples• Point source/capture exhaust systems
– Snorkel exhaust– Bench top exhaust– Ventilated cabinets (negative pressure)
• Lab hoods• Process ventilation systems
– Push – pull systems– Overhead capture systems– Negative pressure enclosures

Copyright© 2008 TSI Incorporated
Engineering Controls
For most nanotechnology processes and job tasks• The control of airborne exposure to nanoparticles can most likely be
accomplished using a wide variety of engineering control techniques similar to those used in reducing exposure to general aerosols
(Ratherman 1996; Burton 1997)• The use of ventilation systems should be designed, tested, and maintained
using approaches recommended by ACGIH (ACGIH 2001)
• In general, control techniques such as source enclosure and local exhaust ventilation systems should be effective for capturing airborne nanoparticles, based on what is known of nanoparticle motion and behavior in air
(ACGIH 2001)• Using current control techniques based on scientific knowledge of generation,
transport, and capture of aerosols, these control techniques should be effective for controlling airborne exposures to nanoscale particles
(Seinfeld and Pandis 1998; Hinds 1999)

Copyright© 2008 TSI Incorporated
Nanoparticle Measurements
Applications – back to basics, JHA’s, WAA’s• Determining effectiveness of ventilation systems
– Mechanical filtering efficiency– Understanding pressure differentials– General/dilution ventilation– Local exhaust ventilation/controls
• Conduct work area monitoring– Determine specific sources of nanoparticles
• Point source location• Target potential sources and problem areas
– Particle mapping/engineering studies• Grid out work areas
– Determine infiltration of ambient sources into the workplace• Transport pathways

Copyright© 2008 TSI Incorporated
Nanoparticle Measurements
Applications – back to basics• Assist in characterizing, defining, and validating new production
processes• Assist with task-specific material handling operations
– Minimizing process emissions• Selecting and implementing corrective actions
– Repair equipment or engineering controls– Remove source– Remediate source– Implement engineering controls– Change worker process interactions– Implement use of PPE
• Validate corrective actions
“ALARA best practice approaches”

Copyright© 2008 TSI Incorporated
Nanoparticle Measurements
General Sampling Practices – back to basics• Evaluate and measure outdoor concentrations
– Determine external sources– Time of day when concentrations may go up
• Ventilation system plays a role– Check mechanical filtration efficiency– Local exhaust ventilation– Lack of ventilation
• Background/baseline measurements of the work area– Before work operations– During and after (if possible)– Can change quickly– Can bias measurements– Ideally would like background, corrected measurement data

Copyright© 2008 TSI Incorporated
Mass Measurements
• Why would we want to measure mass for nanoparticles?– It is a well known metric– Established substance-specific exposure limits for
larger particles

Copyright© 2008 TSI Incorporated
Mass Measurements
• Traditional gravimetric methods may not be effective for nanoparticles– Insignificant mass compared to larger particles– High flow rates and long sampling times required
for a quantifiable sample

Copyright© 2008 TSI Incorporated
Mass Measurements
• Mass may not be a good indicator for nanoparticle exposure and dosing since it is based on toxicity data for large particles– Quantum chemistry and physics play a role– Do toxicity and pharmacokinetics change?– Size decreases ↔ toxicity increases
• Mass can be measured– Gravimetrically (discussed)– Photometrically

Copyright© 2008 TSI Incorporated
Photometry
Photometers• Photometers measure particle mass in real time• Light-scattering effects vary based on
– Particle size, size distribution, density, morphology, and refractive index
• Photometers respond linearly to mass concentration across their detection range
• Size specific aerosol fractions are measured• Size fractions > aerodynamically cut using an inlet
conditioner > cyclone or impactor

Copyright© 2008 TSI Incorporated
Photometry
Photometers• Typical particle size range: 0.1 – 10 µm• Typical concentration range: 0.001 – 100 mg/m3
• Size fractions using inlet conditioners – Respirable, thoracic, PM10, PM2.5 or PM1.0
• What types of aerosols will a photometer detect and measure?– Any aerosol within the size range
• Personal, hand held, table top, and fixed monitor configurations

Copyright© 2008 TSI Incorporated
Mass Measurements
Gravimetric Strengths• Area and personal samplers
in the nano size range• Ability to compare to
historical data• Relatively inexpensive
– Air sampling equipment– Lab analysis
Gravimetric Weaknesses• Mass measurements for
nanoparticles are difficult due to size and sampling constraints
• Not a real-time measurment• Toxicity for nanoparticles unknown
– May not have quantitative relevance as an exposure metric
• No guidelines or standards for nanoparticles
Copyright© 2008 TSI Incorporated
Mass Measurements
Photometer Strengths• Qualitative relevance for
agglomerated / aggregated nanoparticles: >100 nm
• Real-time measurement• Field portable, battery
operated, and easy to use• Personal or area sampling• Relatively inexpensive ~$3
-10K
Photometer Weaknesses• Not in the size range for
discrete nanoparticles: <100 nm
• Not size resolved• Not a compliance method• No guidelines or
standards for nanoparticles

Copyright© 2008 TSI Incorporated
Number Concentration
Why measure the number concentration of nanoparticles?– To determine if they are being released from
production processes or being re-aerosolized during bulk production use
• Point source location during production or use• Select and validate engineering controls• Compare to background/baseline measurements of the
work area

Copyright© 2008 TSI Incorporated
Number Concentration
• Measure number concentration in real time
• A CPC uses a method of condensation to grow particles to an optically detectable size
• CPCs do not size particles, only count them
• Not a size resolved measurement• CPCs require a working fluid
– Alcohol or water
Condensation Particle Counters - CPC
Source: TSI Inc.

Copyright© 2008 TSI Incorporated
Number Concentration
• Particle size range:
10 – 1000 nm• Concentration range:
0 – 500,000 pt/cc• What types of aerosols will a
CPC detect and measure?– Any aerosol within the size range
• Hand held and table top configurations
Condensation Particle Counters - CPC
Source: TSI Inc.

Copyright© 2008 TSI Incorporated
Number Concentration
CPC Strengths• CPCs are well suited to
measuring nanoparticles in the workplace– Good qualitative measurements– Based on relative changes in concentration
• Field portable, battery operated, and easy to use
• Handheld models relatively inexpensive ~ $5 – 8K
CPC Weaknesses• CPCs are not a size
resolved measurement– Cannot determine particle size– Cannot account for
agglomeration
• No guidelines or standards exist for number concentration of nanoparticles

Copyright© 2008 TSI Incorporated
Size Distribution
Why measure size distribution of nanoparticles?– To know the size and number of nanoparticles produced
• Exposure information• Quality control purposes (maximize output and minimize loss)
– To determine if they are being released from production processes or being re-aerosolized during bulk production use
• Point source location• Select and validate engineering controls• Compare to background/baseline measurements of the work area
– To determine if nanoparticles are agglomerating or aggregating after production

Copyright© 2008 TSI Incorporated
Size Distribution
Size distribution can be measured in a number of ways– Scanning Mobility Particle Sizer (SMPS), <1 µm– Optical Particle Counter (OPC), >0.3 µm

Copyright© 2008 TSI Incorporated
SMPS Technology
• A SMPS uses a Differential Mobility Analyzer (DMA) and a CPC to measure size and number concentration of nanopaticles
• DMA separates particles according to charge and electrical mobility for size classification
• CPC grows the particles to a detectible size for counting

Copyright© 2008 TSI Incorporated
SMPS Technology
• High resolution and accuracy
• Wide size and concentration range
• Fast response time
• What type of aerosols can be detected with a SMPS?– Any aerosols within the detection range

Copyright© 2008 TSI Incorporated
SMPS Technology
SMPS Technology• Size ranges vary
– 2.5 – 1000 nm– 10 – 487 nm
• Multiple size bins• Fast continuous scanning

Copyright© 2008 TSI Incorporated
OPC Technology
• Measures the size and number concentration of particles in real time– Counts individual flashes of scattered light and the intensity of
each flash• OPCs may be able to measure nanoparticles in the
workplace– Nanoparticles must have agglomerated or aggregated to ≥0.3
µm• Typically have multiple size bins that can be arranged
to simultaneously measure size fractions– Respirable, thoracic, >10 µm, PM1.0, PM2.5 and PM10– Eliminating the need for inlet conditioners like cyclones and
impactors

Copyright© 2008 TSI Incorporated
OPC Technology
• Typical particle size range: 0.3 µm – ~15 µm
• Concentration range: 2x10⁶ particles/ft3 (70 pt/cc)
• What types of aerosols will a OPC detect and measure?– Any aerosol within the size range
• Hand held, table top and fixed instruments

Copyright© 2008 TSI Incorporated
Size Distribution
SMPS Strengths• Particle size range
– 2 to 1000 nm
• Real-time measurement• Size resolved, quantitative
measurement– For nanoparticle production
process applications– Determine if nanoparticles are
agglomerating
• Qualitative area sampling– Locate point sources– Select and validate engineering
controls for nanoparticles
SMPS Weaknesses• No guidelines or standards
for nanoparticles• Limited field portability• Computer controlled• Expensive $60 – 80K
Copyright© 2008 TSI Incorporated
Size Distribution
OPC Strengths• For agglomerated/aggregated
nanoparticles, >300 nm• Size-resolved measurement• Real time measurement• Qualitative area sampling
– Relative changes in number concentration
– Locate point sources– Select and validate engineering
controls• Field portable, battery operated,
and easy to use• Relatively inexpensive ~$3 -10K
OPC Weaknesses• Not in the size range for
discrete nanoparticles, <300 nm• No guidelines or standards for
nanoparticles

Copyright© 2008 TSI Incorporated
Surface Area Measurements
Why measure the surface area of nanoparticles?
• To obtain exposure information based on lung deposited surface area
• To determine if they are being released from production processes or being re-aerosolized during bulk production use
• Point source location• Select and validate engineering controls• Compare to background/baseline measurements
of the work area

Copyright© 2008 TSI Incorporated
Surface Area Measurements
• Nanoparticles vs. large particles– Have relatively little mass– Have large surface area– Produced in large numbers– Quantum effects change physical, chemical, and
biological properties
• Nanoparticle exposure studies– Drs. Driscoll (1996) and Oberdörster (2001) have
shown that surface area (μm2/cc) plays an important role in the toxicity of nanoparticles

Copyright© 2008 TSI Incorporated
Surface Area Measurements
• Surface area is the metric that is highly correlated with particle-induced adverse health effects
(Driscoll, 1996; Oberdörster, 2001)
• Potential for adverse health effects is proportional to particle surface area
(Driscoll, 1996; Oberdörster, 2001)
• Emerging need to assess workplace exposure to nanoparticles based on surface area

Copyright© 2008 TSI Incorporated
Surface Area Measurements
Lung Deposition
• Inhalation is primary exposure route
• Most common/efficient way for particles to enter the body
• The respiratory tract consists of 3 major regions– Extrathoracic region: uppermost region– Tracheobronchial (TB) region: middle region– Alveolar (A) region: innermost region
• Uptake of inhaled particles according to deposition in respiratory tract

Copyright© 2008 TSI Incorporated
Lung Deposition
Based on International Commission of Radiological Protection (1994) and U.S. Environmental Protection Agency (1996a).Air Quality Criteria for Particulate matter, 2004, p 6-5.

Copyright© 2008 TSI Incorporated
Diffusion Charger Technology
• A Diffusion Charger measures the charge of the particles and calculates the surface area deposited in the TB or A regions of the lung
• Particle size range: 10 nm – 1000 nm• Measurement ranges: TB = 1 – 2,500 µm2/cc
A = 1 – 10,000 µm2/cc• What types of aerosols will a diffusion charger detect
and measure?– Any aerosol within the size range
• Desk top and hand held instruments

Copyright© 2008 TSI Incorporated
Surface Area Measurements
Diffusion Charger Strengths
• Surface area is highly correlated with observed toxic effects
• Nano size range, 10 - 1000 nm• Real time measurement• Quantitative area sampling
– Surface area dosing information
• Qualitative area sampling– Data correlates well with CPC and
SMPS measurement trends
• Field portable, battery operated, and easy to use
• Relatively inexpensive, ~ $10 - 16K
Diffusion Charger Weaknesses
• Not size resolved– Cannot determine size of particle– Does not account for agglomeration
• No guidelines or standards for nanoparticles– What’s a good number vs. a bad
number

Copyright© 2008 TSI Incorporated
Working Towards Best Practices
What can be done?A Proactive Approach – to managing risk• To minimize the risk of exposure, implement a risk
management program • Develop a health hazard surveillance program for
workers in nanotechnology operations• Continual reassessment of potential hazards and
exposures based on information gained is necessary to maintain the surveillance program

Copyright© 2008 TSI Incorporated
Working Towards Best Practices
Program Elements1. Hazard surveillance monitoring2. Guidelines for installing and evaluating
engineering controls3. Work practices
• Education and training of workers• Establishing safe production processes and
material handling procedures
4. Procedures for selection and use of PPE (e.g., respirators, clothing and gloves)

Copyright© 2008 TSI Incorporated
Working Towards Best Practices
Hazard Surveillance Monitoring• Conduct a job hazard analysis• Determine need for sampling
– Based on potential exposure areas• Leads to a decision to measure nanoparticles, keep in
mind several factors– Mass and bulk chemistry for exposure may be less important
than particle size, surface area and surface chemistry– Currently, there is no single sampling method to use to
characterize nanoparticle exposure (Brower et al., 2004)– Therefore, use a multi-metric sampling and measurement
approach to characterize workplace exposure to nanoparticles (Brower et al., 2004)

Copyright© 2008 TSI Incorporated
Working Towards Best Practices
Hazard Surveillance Monitoring1. Identify source(s) of nanoparticle emissions
• Critical to get ambient background / baseline measurements regardless of monitoring metric used
• Compare against measurements taken during and after work processes
• Area, point source, and personal sampling locations
2. Once point source location(s) are identified continue using multi-metric sampling approach
• Select engineering control techniques to use • Conduct dosing and exposure measurements• Goal is to achieve ALARA conditions

Copyright© 2008 TSI Incorporated
Working Towards Best Practices
Hazard Surveillance Monitoring
3. Implement and validate engineering controls using same multi-metric sampling approach
• To achieve ALARA conditions
4. Continue with hazard surveillance monitoring program on a regular basis
• Ensure engineering controls functioning• Verify process and workplace conditions have not
changed

Copyright© 2008 TSI Incorporated
Working Towards Best Practices
Health Hazard Monitoring • Using a multi-metric sampling approach, assessment of
worker exposure to nanoparticles can be conducted• This multi-metric approach:
– Determines presence and identification of nanopaticles– Assists in selecting, implementing, and validating engineering
controls– Assists in characterizing the aerosol measurement metrics
• Since most nanoparticle measurements rely primarily on area sampling, some uncertainty will exist in estimating worker exposures

Copyright© 2008 TSI Incorporated
Multi-metric Sampling & Control Approaches
Nanotechnology Applications
1. Nanoparticle manufacturing– Bulk production of engineered nanoparticles
2. Industrial manufacturing using nanoscale
materials– Utilizing bulk nanoscale materials in products– Bulk nanoscale material handling

Copyright© 2008 TSI Incorporated
Multi-metric Sampling & Control Approaches
Nanoparticle Manufacturing Process
• Manufucturing nanoparticles in bulk
• May be a well characterized and defined production process or not
• May be a clean room manufacturing environment (R&D Lab) or, a “dirty” environment– May or may not have general/dilution ventilation

Copyright© 2008 TSI Incorporated
Multi-metric Sampling & Control Approaches
Hazard Surveillance Monitoring• Do a job hazard analysis
– Determine need and make decision to sample• What do you measure to determine sources?
– Size distribution using a SMPS• Know what size of nanoparticle being produced• Want to see if it is getting into ambient air to determine if you have
process leaks• Quality control measurement (minimize loss and maximize output)• Comparing against background measurements
– Number concentration using a CPC for locating point sources
• Qualitatively locating point sources using changes in relative nanoparticle concentration
• Comparing against background measurements

Copyright© 2008 TSI Incorporated
Multi-metric Sampling & Control Approaches
Hazard Surveillance Monitoring• Located sources now what do you measure?
– Size distribution using a SMPS• Know what size of nanoparticle being produced• Want to see if it is producing the same size particle• Quality control measurement (minimize loss and maximize output)• Comparing against background measurements
– Number concentration using a CPC for selecting, implementing, and validating engineering controls
• Qualitatively using relative changes in number concentration to achieve ALARA conditions
• Comparing against background measurements– Surface area concentration using a diffusion charger
• Conduct work area dosing and exposure measurements• Before, during, and after implementation of engineering controls• Compare against background measurements

Copyright© 2008 TSI Incorporated
Multi-metric Sampling & Control Approaches
Hazard Surveillance Monitoring
• Continue with monitoring on a regular basis to ensure that ALARA conditions are maintained
• Reassess hazard surveillance plan periodically

Copyright© 2008 TSI Incorporated
Multi-metric Sampling & Control Approaches
Manufacturing Using Bulk Nanoscale Material• Not well characterized or defined manufacturing process
– Utilizing bulk nanomaterials in products– Bulk nanoscale material handling processes– May be dealing with agglomerates and or aggregates, >100 to
300 nm
• Typically a dirty production environment– May or may not have general/dilution ventilation– Other processes may contribute aerosol contaminants

Copyright© 2008 TSI Incorporated
Multi-metric Sampling & Control Approaches
Hazard Surveillance Monitoring• Do a job hazard analysis
– Determine need and make decision to sample• What do you measure to determine sources?
– Mass using a photometer, particles >100 nm– Size distribution using a OPC, particles >300 nm– Number conentration using a CPC, particles >10 nm– Surface area using a diffusion charger, particles >10 nm
• Qualitatively locate point sources using relative changes in concentrations for all measurements
• Locate and ruling out other contributing contaminant processes• Use any measurement that works to locate point sources• Compare against background measurements

Copyright© 2008 TSI Incorporated
Multi-metric Sampling & Control Approaches
Hazard Surveillance Monitoring• Located sources now what do you measure?
– Use any point source location measurement that works for selecting, implementing, and validating engineering controls
• Qualitatively using relative changes in number concentration to achieve ALARA conditions
• Comparing against background measurements
– Surface area concentration using a diffusion charger• Conduct work area dosing and exposure measurements
– Before, during, and after implementation of engineering controls
• Compare against background measurements

Copyright© 2008 TSI Incorporated
Multi-metric Sampling & Control Approaches
Hazard Surveillance Monitoring
• Continue monitoring on a regular basis to ensure that ALARA conditions are maintained
• Reassess hazard surveillance plan periodically

Copyright© 2008 TSI Incorporated
Summary
• Nanoparticle exposures are not clearly understood • . . . mass and bulk chemistry may be less important
than particle size, surface area, and surface chemistry (or activity) for nanostructured materials. . .
• Primary route of exposure is inhalation and lung deposition
• No established exposure metrics• Filtration and engineering controls can be effective• Use multi-metric approach to assess nanotechnology
workplaces

Copyright© 2008 TSI Incorporated
Gregory M. Olson, Jr., M.S.Product ManagerHealth and Safety InstrumentsTSI Incorporated USA(651) [email protected]

0.001 0.01 0.1 1 10 100Particle Size Range (micrometers)
Inhalable (Total dust)
TSPRespirable
Thoracic Particle Size Range for Aerosol Instruments
Photometer
CPC-alcohol
OPC
Diffusion Charger
4
OPC: Optical Particle Counter
CPC: Condensation Particle Counter
SMPS: Scanning Mobility Particle Sizer
CPC - Water
SMPS
Nanoparticle

Photometer OPC CPC SMPS Diffusion Charger
Typical Size Range 0.1 to 10 um 0.3 to 20 um
0.0025 to 3.0 um
0.0025 to 1 um
0.02 to 0.1 um
Measures Particle Mass (estimate) Yes No No (Yes) No
Typical Mass Concentration Range 0.01 to 100 mg/m3
N/A N/A N/A N/A
Measures Particle Size No Yes No Yes No
Detects Single Particles No Yes Yes Yes No
Typical Number Concentration Range (Particles / cc)
N/A 2 x 10⁶ 1.5 x 10¹⁰ 1 x 10⁸ N/A
Upper Limit, number concentration (particles/cc)
N/A 70 500,000 1 x 10⁸ N/A
Measures Lung-Deposited Surface Area No No No No1 Yes
OPC = Optical Particle Counter
CPC = Condensation Particle Counter
SMPS = Scanning Mobility Particle Sizer
1Surface area can be calculated using SPMS size distribution data.
Aerosol Technology
Comparisons

Application Comparison
Photometer OPC CPCDiffusion charger
Indoor Air Quality - Conventional Studies Good Good N/A N/A
Indoor Air Quality - Ultrafine Particle Tracking Poor N/A Excellent N/A
Industrial Workplace Monitoring (Conventional) Excellent Poor N/A N/A
Industrial Workplace Monitoring (Nano-Materials) Poor1/Good2 Poor1/Good2 Excellent3 Excellent3
Outdoor Environmental Monitoring Good Good Excellent3 Excellent3
Emissions Monitoring Excellent Poor Good Excellent
Respirator Fit Testing Excellent Poor Excellent N/A
Filter Testing Excellent Excellent Excellent N/A
Clean Room Monitoring Poor Excellent Excellent N/A
1 Engineered nano particles of homogenous material less than 0.1 micron (100 nm) in diameter.2 Agglomerated and aggregated nano particles greater than 0.1 microns (100 nm) diameter for photometers and greater than0.3 microns (300nm) for OPC’s.3The Health effects of engineered nano particles and ultrafine particles below 0.1 micron (100 nm) in diameter are notcompletely understood. Research suggests these ultrafine particles may cause the greatest harm. There are currently noestablished exposure limits or governmental regulations specifically addressing ultrafine or nano particles exposure.

Copyright© 2008 TSI Incorporated
References
• Nanotechnology Consensus Workplace Safety Guidelines– http://www.orc-dc.com/
• National Nanotechnology Initiative (NNI)– http://www.nano.gov
• USEPA – “Nanotechnology White Paper”– http://www.epa.gov/osa/nanotech.htm
• NIOSH - “Approaches to Safe Nanotechnology” – www.cdc.gov/niosh/topics/nanotech/
• UK Health & Safety Executive – “Nanoparticles: Occupational Hygiene Review”– http://www.hse.gov.uk/RESEARCH/rrhtm/rr274.htm

Copyright© 2008 TSI Incorporated
References
• National Nanotechnology Initiative (NNI) – US Gov’t.– Started in 2000– Over $2 Billion spent on nanotechnology research since
2000– $1 Billion allocated in FY 2006– Predicting annual investment of $15 Billion per year by 2015– Estimated that 50% of all products produced will be affected
by nanotechnology within 10 years– Employment in nanotechnology is expected to grow to 2
million workers in next 10 years (US Department of Labor)

Copyright© 2008 TSI Incorporated
References
• NIOSH – US– Taking a leadership role for nanotechnology and OH&S
• Research to Practice
– Comprehensive nanotechnology website, including the “Nanoparticle Information Library”
– “Approaches to Safe Nanotechnologies”• Formulate guidance relevant to occupational health surveillance for
nanotechnology• Provide information that can be used to create appropriate occupational
health surveillance to fit the needs of those involved with nanotechnology
– Nanotechnology industry field studies– Research projects for nanopaticle toxicity

Copyright© 2008 TSI Incorporated
References
• US Environmental Protection Agency– Traffic related particle exposure and risk assessment studies
• Mass, number concentration, size distribution, and surface area
– Investigating whether or not nanomaterials should be classified as new chemicals (e.g., new CAS numbers) under TSCA, or will it be a classified as a “new use” for an existing chemical under TSCA
• ASTM, ANSI, and ISO– Working on consensus nomenclature terminology– ISO developed and released a document on information and
guidance for monitoring for nanoparticle exposures in workplace atmospheres (2006)

Copyright© 2008 TSI Incorporated
References
• Federal OSHA– Participating in NNI as a federal agency– Working with NIOSH as they conduct research– Future plans to develop guidance documents for
nanotech companies
• Health and Safety Laboratory (HSL/HSE) – UK– Nanotechnology industry field studies– Workplace sampling and control strategies using
control banding techniques

Copyright© 2008 TSI Incorporated
References
• Woodrow Wilson Institute for Scholars– Project on Emerging Nanotechnologies, started 2005– Dedicated to helping ensure that as nanotechnologies
advance, 1. Possible risks are minimized
2. Public and consumer engagement remains strong
3. The potential benefits of these new technologies are realized
– Philosophy of “responsible nanotechnology”

Copyright© 2008 TSI Incorporated
References
• US Food and Drug Administration (FDA)– Regulates a wide range of products, including foods,
cosmetics, drugs, devices, and veterinary products, which may utilize nanotechnology or contain nanomaterials
– Formed a task force in August 2006 “Charged with determining regulatory approaches that
encourage the continued development of innovative, safe
and effective FDA-regulated products that use
nanotechnology materials”

Copyright© 2008 TSI Incorporated
References
Research Work• In chronic rat inhalation studies:
– Inflammatory response induced by different particle types was found best correlated with surface area of particles retained in the alveolar space (Oberdörster, 1996)
- Total surface area of retained particles was found best dose parameter for a correlation when the endpoint was lung tumor (Driscoll, 1996)

Copyright© 2008 TSI Incorporated
References
Research Work• Nano-sized TiO2 induce tumor in rats
(Lee et al., 1985; Heinrich et al. 1995) – Chronic inhalation studies with nano-scale ( ~ 20 nm) and fine
TiO2 (~ 250 nm) have shown that more than ten times lower inhaled concentrations of the aggregated ultrafine particles, compared with fine particles, are sufficient to produce the same amount of tumor-induction in rats
• Nano-sized Teflon fumes (count median particle size~18nm) result in severe pulmonary inflammation and hemorrhage in rats. No toxicity observed for 100 nm particles of same material
(Oberdörster et al., 1995)

Copyright© 2008 TSI Incorporated
References
Research Work
• Carbon black nanoparticles cause mutations and cancer
– Large enough dosage of nano-sized carbon black capable of causing pulmonary inflammation, particle overload, lung tumors and mutations in rats
(Driscoll et al.,1996)
– Similar results seen with nano-sized quartz and TiO2 (Driscoll et al., 1995; Heinrich et al.,
1995)

Copyright© 2008 TSI Incorporated
References
Research Work
• Intratracheally induced carbon nanotubes cause pulmonary toxicity in mice and rats
(Warheit et al., 2004; Lam et al., 2004)
• In hamsters, inhaled nanoparticles translocate into blood (Nemmar et al., 2001)
• In humans, inhaled nanoparticles translocate into blood thus influence cardiovascular endpoints directly
(Nemmar et al., 2002)

Copyright© 2008 TSI Incorporated
References
References1. Donaldson, K. et al. Ultrafine (Nanometer) Particle Mediated Lung Injury, J. Aerosol Sci.
29(5/6):553-560. (1998)2. Driscoll K.E. Role of inflammation in the development of rat lung tumors in response to chronic
particle exposure. Inhal. Toxicol. 8 [suppl1: 85-98] (1996)3. Driscoll K.E. et al. Pulmonary inflammatory, chemokine, and mutagenic responses in rats after
subchronic inhalation of carbon-black. Toxicol. Appl. Pharmacol. 136, 372-380 (1996)4. Driscoll K.E. et al. Characterizing mutagenesis in the hprt gene of rat alveolar epithelial-cells.
Exp. Lung Res. 21, 941-956 (1995).5. Heinrich et al. Chronic inhalation exposure of Wistar rats and two different strains of mice to
diesel engine exhaust, carbon black, and titanium dioxide. Inhal. Toxicol. 7: 533-556 (1995)6. Lam C.W. et al. Pulmonary toxicity of single-wall carbon nanotubes in mice 7 and 90 days after
intratracheal instillation, Toxicol. Sci. 77 (1): 126-134 (2004)7. Lee K.P. et al. Pulmonary response of rats exposed to titanium dioxide by inhalation for two
years. Toxicol. Appl. Pharmacol. 79: 179-192 (1985)8. Li N. et al. Ultrafine particulate pollutants induce oxidative stress and mitochondrial damage,
Environ. Health Persp. 111:455-460 (2003)9. Nemmar A. et al. Passage of inhaled particles into the blood circulation in humans, Circulation
105:411-414 (2002)10. Nemmar A. et al. Passage of intratracheally instilled ultrafine particles from the lung into the
systemic circulation in hamster. Am J Respir Crit Care Med (164) 1665-1668 (2001)
Copyright© 2008 TSI Incorporated
References
References11. Oberdörster E.
Manufactured nanomaterials (Fullerenes, C-60) induce oxidative stress in the brain of juvenile largemouth bass, Environ. Health Persp. 112 (10): 1058-1062 (2004)
12. Oberdörster G. Pulmonary effects of inhaled ultrafine particles. Int. Arch. Occup. Environ. Health 74:1-8 (2001)
13. Oberdörster, G. Significance of Particle Parameters in the Evaluation of Exposure-Dose-Response Relationships of Inhaled Particles, Particulate Sci. Technol. 14(2):135-151 (1996).
14. Oberdörster G. et al Association of particulate air pollution and acute mortality: involvement of ultrafine particles? Inhal. Toxicol. 7:111-124 (1995)
15. Penttinen P. et al. Number concentration and size of particles in urban air: effects on spirometric lung function in adult asthmatic subjects, Environ. Health Persp. 109:319-323 (2001)
16. Shanbhag, A. S. et al. Macrophage/Particle Interactions: Effect of Size, Composition and Surface Area, J. Biomed. Mat. Res. 28(1):81-90 (1994).
17. Utell M.J. et al. Acute health effects of ambient air pollution: the ultrafine particle hypothesis. J. Aerosol Med. 13:355-359 (2000).
18. Warheit D. B. et al. Comparative Pulmonary Toxicity Assessment of Single-wall Carbon Nanotubes in Rats, Toxicol. Sci. 77 (1): 117-125 (2004)