Embed Size (px)
Citation preview
Copyright © 2007 Indiana University
Automated Customer Tracking and Behavior Recognition
Raymond R. Burke and Alex LeykinKelley School of Business
Indiana University
November 2, 2007
Copyright © 2007 Indiana University
Copyright © 2007 Indiana UniversityCopyright © 2007 Indiana University
What is Retail Shoppability?
Definition:
The ability of the retail environment to translate consumer demand into purchase
Copyright © 2007 Indiana UniversityCopyright © 2007 Indiana University
What is Retail Shoppability?
Definition:
The ability of the retail environment to translate consumer demand into purchase
Components:
Consumer Engagement: Making consumers’ needs salient in specific retail settings
Copyright © 2007 Indiana UniversityCopyright © 2007 Indiana University
What is Retail Shoppability?
Definition:
The ability of the retail environment to translate consumer demand into purchase
Components:
Consumer Engagement: Making consumers’ needs salient in specific retail settings
Purchase conversion: Turning shoppers into buyers
Copyright © 2007 Indiana UniversityCopyright © 2007 Indiana University
What Determines Shoppability?
Factors:Store, department, and category navigationPhysical and visual clutterProduct visibility and presentationProduct organizationProduct information and value communicationPresentation of new productsShopping convenienceShopping enjoyment
Copyright © 2007 Indiana UniversityCopyright © 2007 Indiana University
How Do We Measure and Manage Shoppability?
• Survey ResearchMeasure consumer perceptions of the shopping experience and diagnose problems with store, department, and category shoppability
Copyright © 2007 Indiana UniversityCopyright © 2007 Indiana University
How Do We Measure and Manage Shoppability?
• Survey ResearchMeasure consumer perceptions of the shopping experience and diagnose problems with store, department, and category shoppability
• Observational ResearchTrack shopper behavior, identify points of engagement and purchase obstacles, andthen manipulate and measure response
Copyright © 2007 Indiana UniversityCopyright © 2007 Indiana University
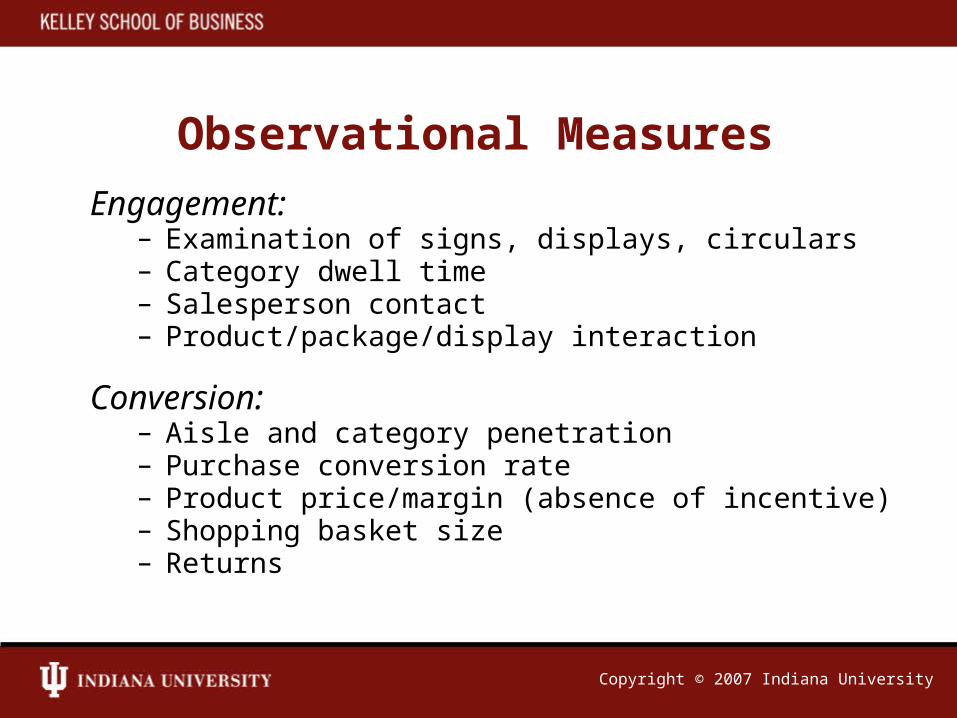
Observational Measures
Engagement:– Examination of signs, displays, circulars– Category dwell time– Salesperson contact– Product/package/display interaction
Conversion:– Aisle and category penetration– Purchase conversion rate– Product price/margin (absence of incentive)– Shopping basket size– Returns

Copyright © 2007 Indiana UniversityCopyright © 2007 Indiana University
Key Customer Touchpoints
• Store Entrance and Window Displays• Lead Fixtures and Merchandising• End-of-Aisle Displays• High Volume / Margin Departments• Customer Service Desk• Checkout
Copyright © 2007 Indiana UniversityCopyright © 2007 Indiana University
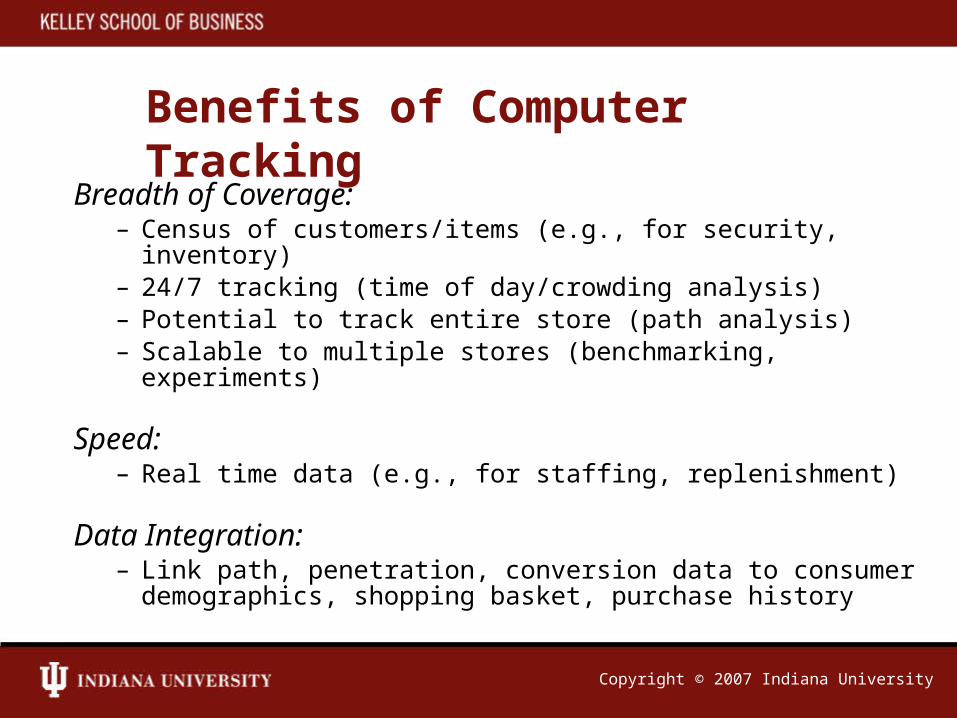
Benefits of Computer TrackingBreadth of Coverage:
– Census of customers/items (e.g., for security, inventory)– 24/7 tracking (time of day/crowding analysis)– Potential to track entire store (path analysis)– Scalable to multiple stores (benchmarking, experiments)
Speed:– Real time data (e.g., for staffing, replenishment)
Data Integration:– Link path, penetration, conversion data to consumer
demographics, shopping basket, purchase history
Copyright © 2007 Indiana UniversityCopyright © 2007 Indiana University
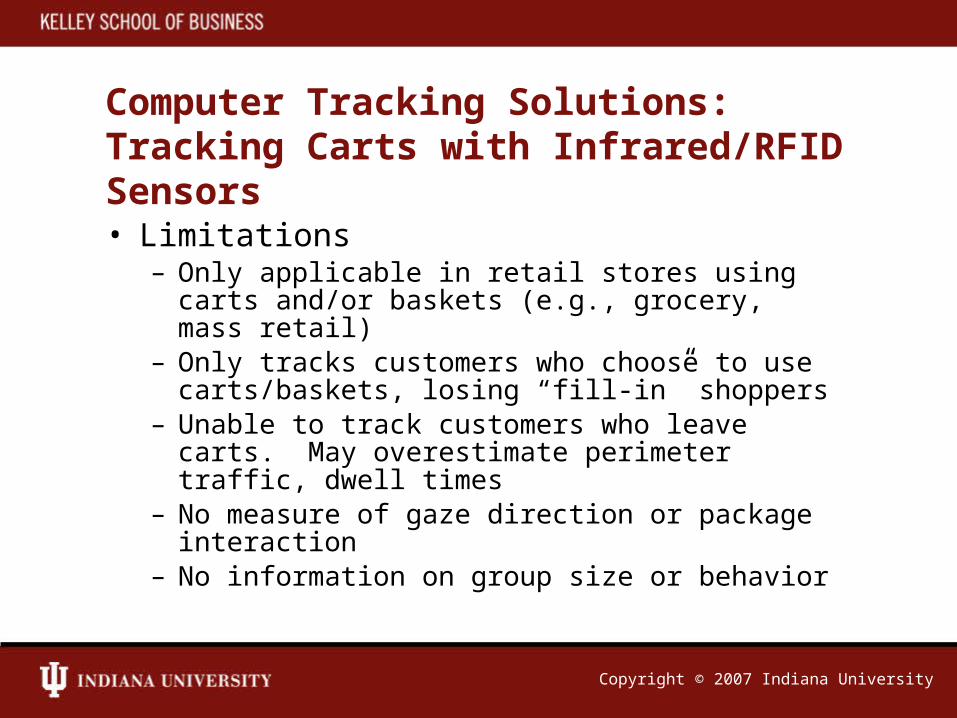
Computer Tracking Solutions:Tracking Carts with Infrared/RFID Sensors
• Limitations– Only applicable in retail stores using carts and/or
baskets (e.g., grocery, mass retail)– Only tracks customers who choose to use
carts/baskets, losing “fill-in” shoppers– Unable to track customers who leave carts. May
overestimate perimeter traffic, dwell times– No measure of gaze direction or package
interaction– No information on group size or behavior
Copyright © 2007 Indiana UniversityCopyright © 2007 Indiana University
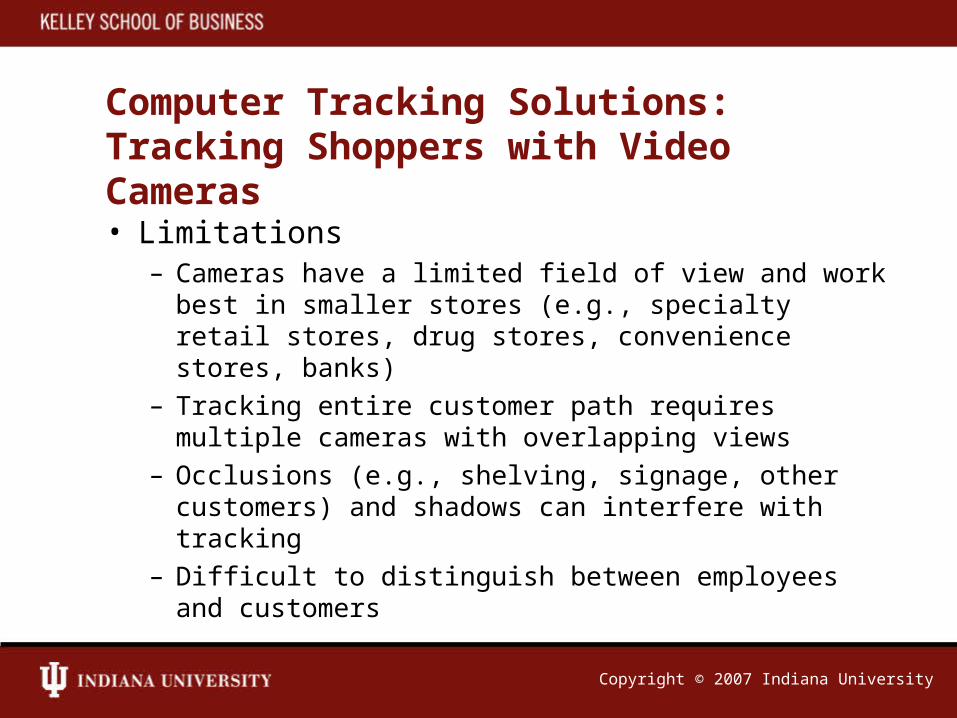
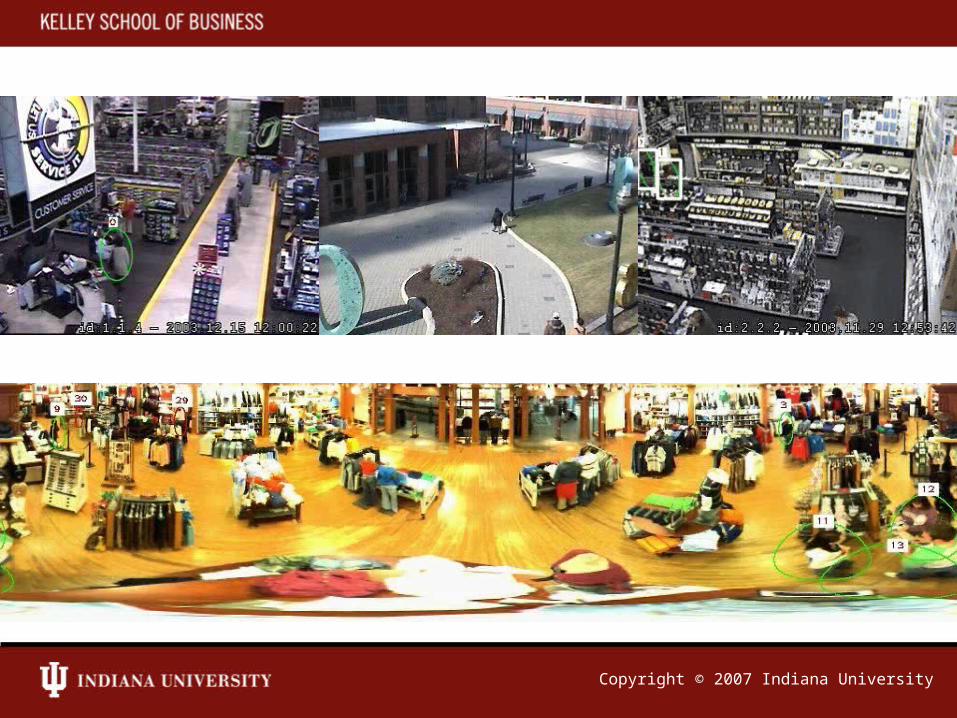
Computer Tracking Solutions:Tracking Shoppers with Video Cameras
• Limitations– Cameras have a limited field of view and work best in
smaller stores (e.g., specialty retail stores, drug stores, convenience stores, banks)
– Tracking entire customer path requires multiple cameras with overlapping views
– Occlusions (e.g., shelving, signage, other customers) and shadows can interfere with tracking
– Difficult to distinguish between employees and customers
Copyright © 2007 Indiana UniversityCopyright © 2007 Indiana University
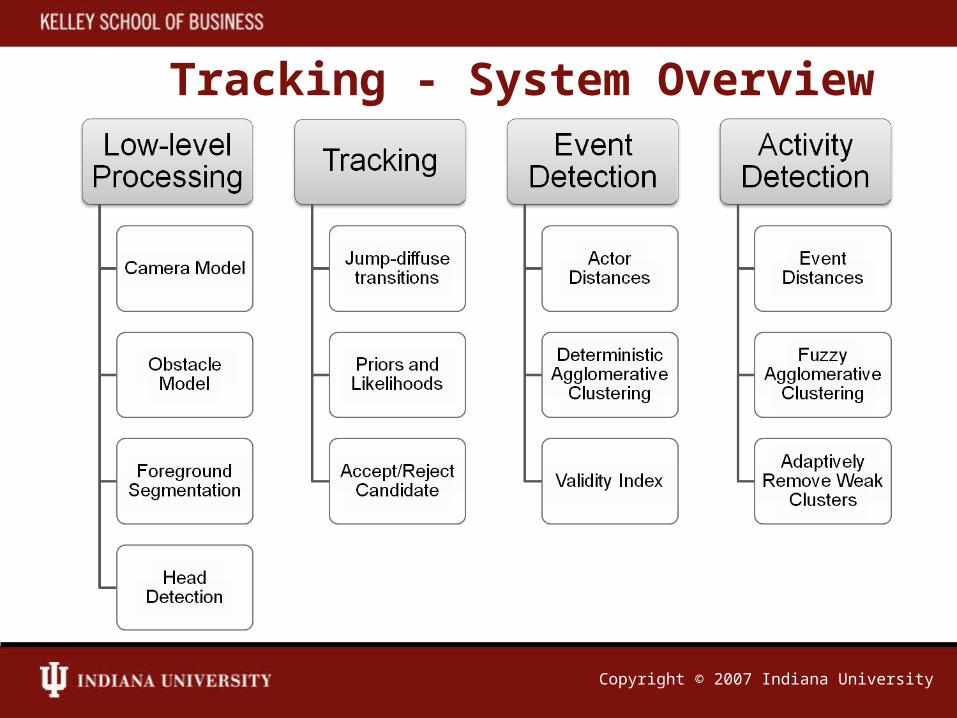
Tracking - System Overview
Copyright © 2007 Indiana UniversityCopyright © 2007 Indiana University
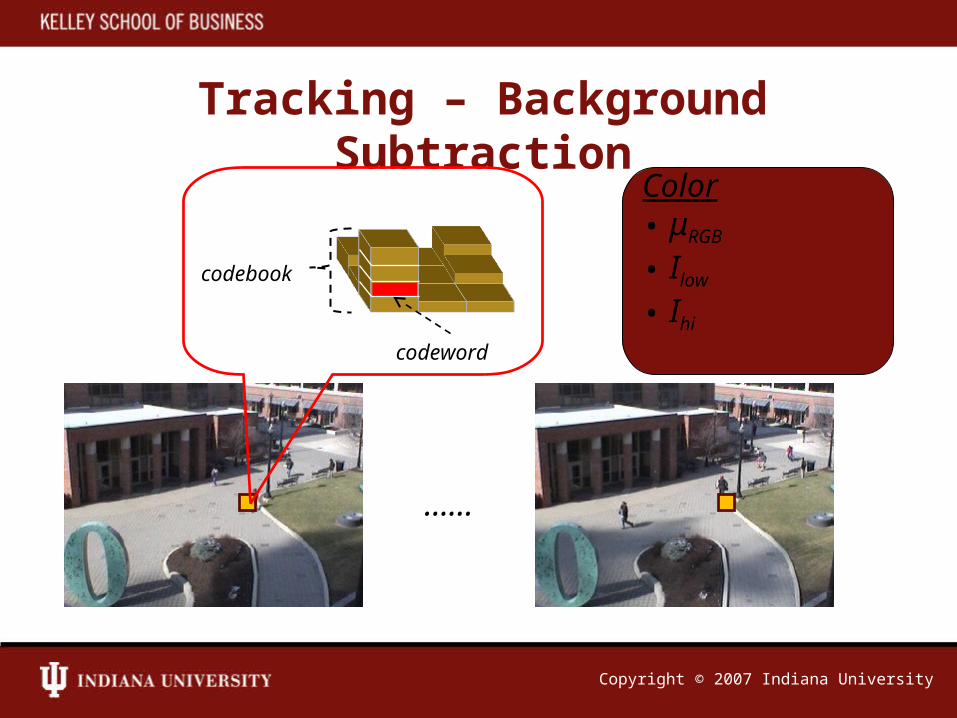
Tracking – Background SubtractionColor• μRGB
• Ilow • Ihi
codeword
codebook
……
Copyright © 2007 Indiana UniversityCopyright © 2007 Indiana University
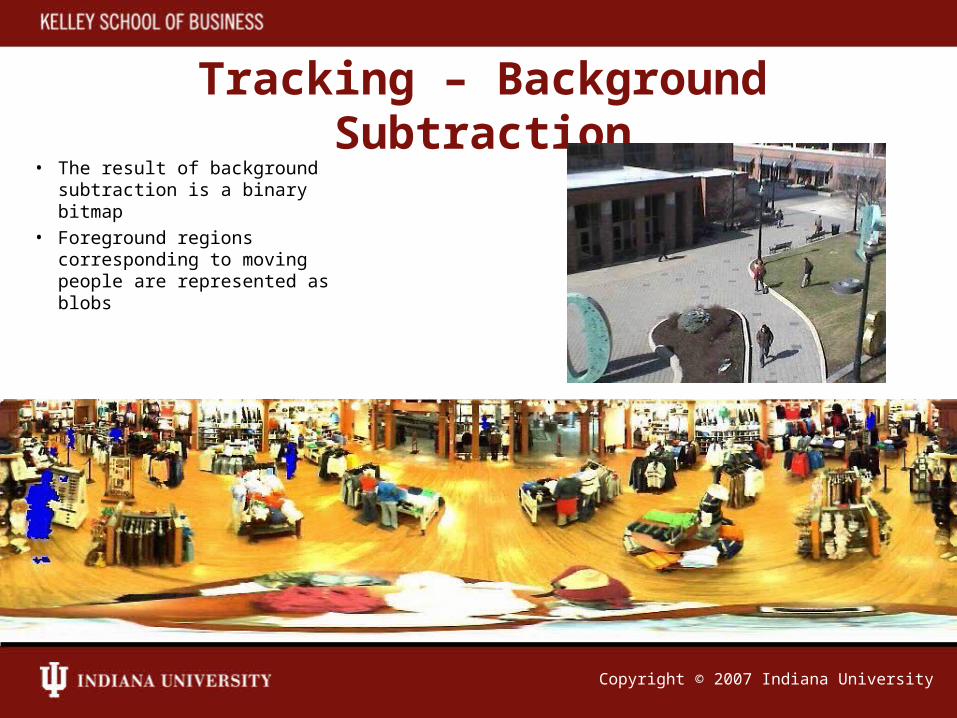
Tracking – Background Subtraction• The result of background
subtraction is a binary bitmap
• Foreground regions corresponding to moving people are represented as blobs
Copyright © 2007 Indiana UniversityCopyright © 2007 Indiana University
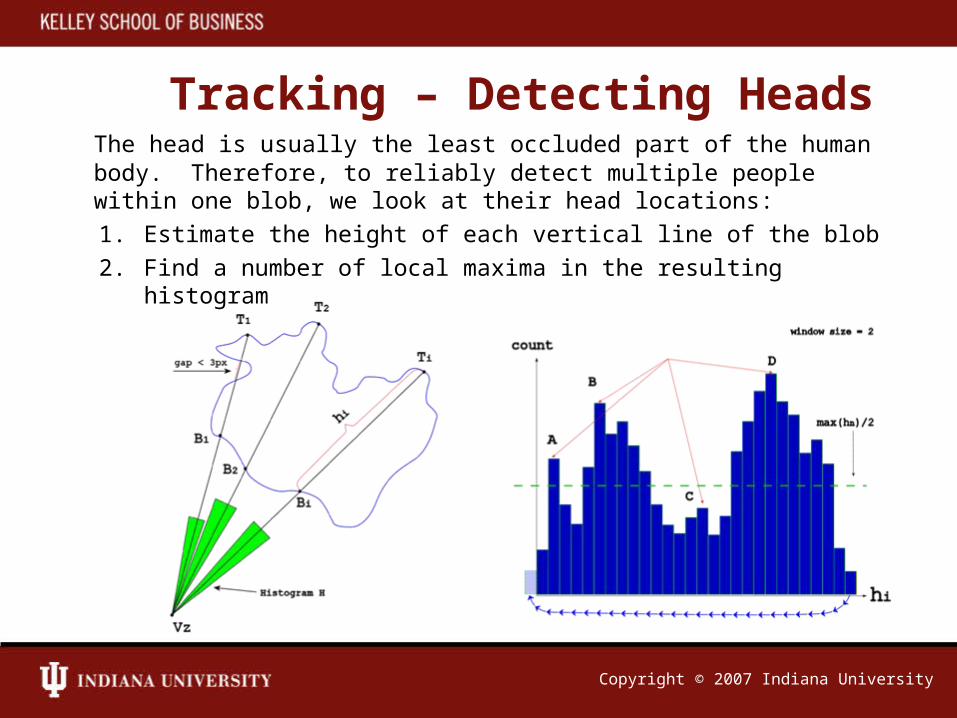
Tracking – Detecting HeadsThe head is usually the least occluded part of the human body. Therefore, to reliably detect multiple people within one blob, we look at their head locations:
1. Estimate the height of each vertical line of the blob
2. Find a number of local maxima in the resulting histogram
Copyright © 2007 Indiana UniversityCopyright © 2007 Indiana University
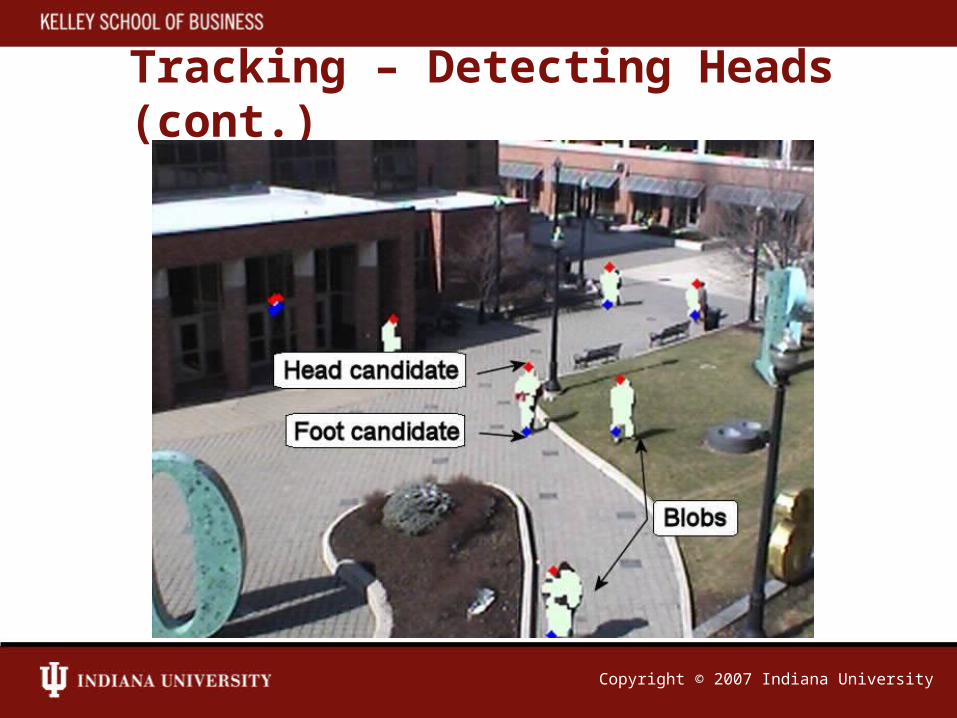
Tracking – Detecting Heads (cont.)
Copyright © 2007 Indiana UniversityCopyright © 2007 Indiana University
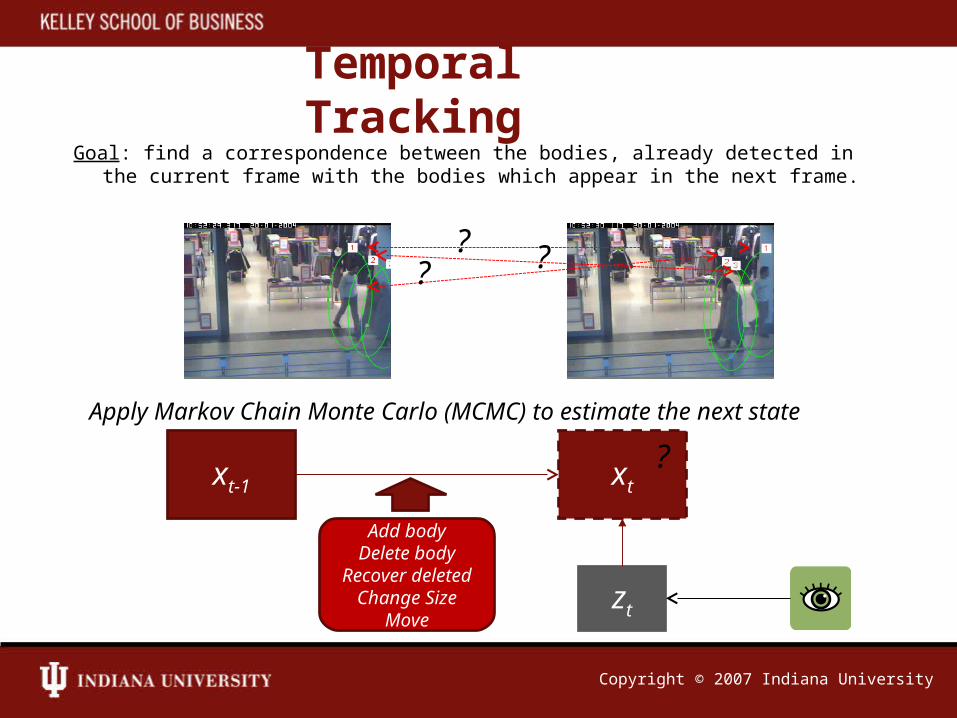
Temporal TrackingGoal: find a correspondence between the bodies, already detected in the
current frame with the bodies which appear in the next frame.
Apply Markov Chain Monte Carlo (MCMC) to estimate the next state
? ??
xt-1 xt
zt
?
Add bodyDelete body
Recover deletedChange Size
Move
Copyright © 2007 Indiana UniversityCopyright © 2007 Indiana University
Copyright © 2007 Indiana UniversityCopyright © 2007 Indiana University
Swarming
• Shopper groups detected based on “swarming” idea in reverse– Swarming is used in graphics to
generate flocking behaviour in animations.
– Rules define flocking behaviour:• Avoid collisions with the neighbors.• Maintain fixed distance with neighbors• Coordinate velocity vector with neighbors.
Copyright © 2007 Indiana UniversityCopyright © 2007 Indiana University
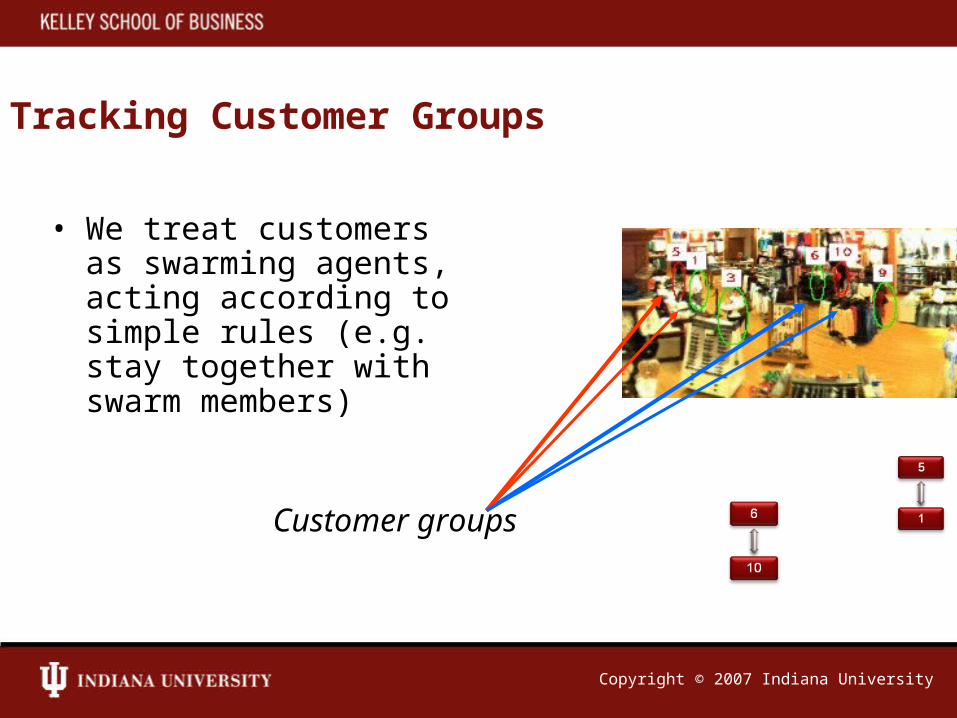
Tracking Customer Groups
• We treat customers as swarming agents, acting according to simple rules (e.g. stay together with swarm members)
Customer groups
Copyright © 2007 Indiana UniversityCopyright © 2007 Indiana University
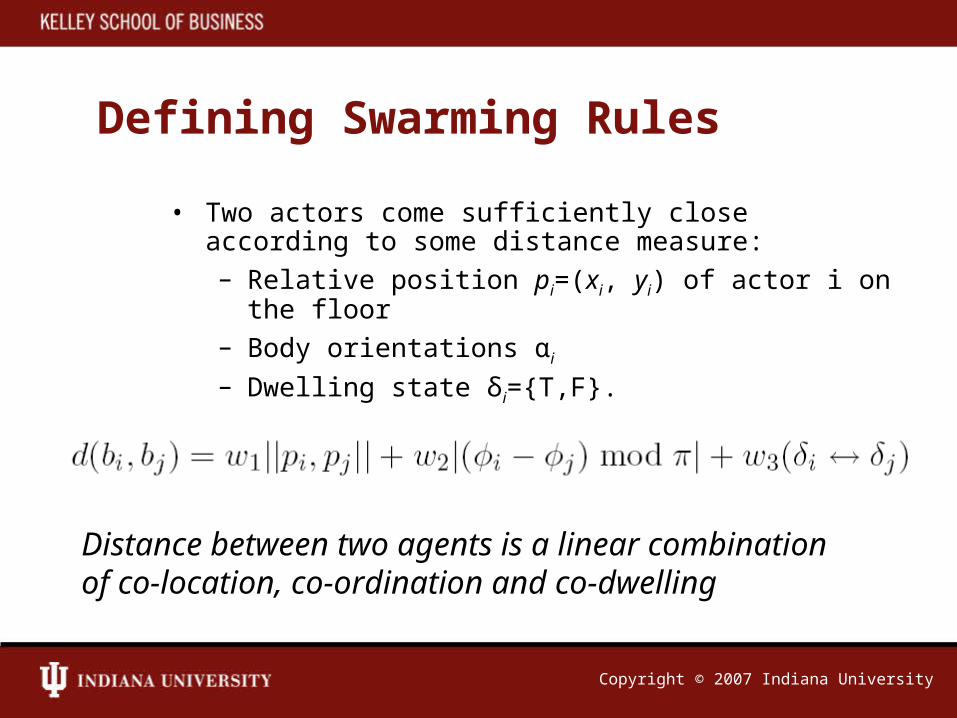
Defining Swarming Rules
• Two actors come sufficiently close according to some distance measure:– Relative position pi=(xi, yi) of actor i on the floor– Body orientations αi
– Dwelling state δi={T,F}.
Distance between two agents is a linear combination of co-location, co-ordination and co-dwelling
Copyright © 2007 Indiana UniversityCopyright © 2007 Indiana University
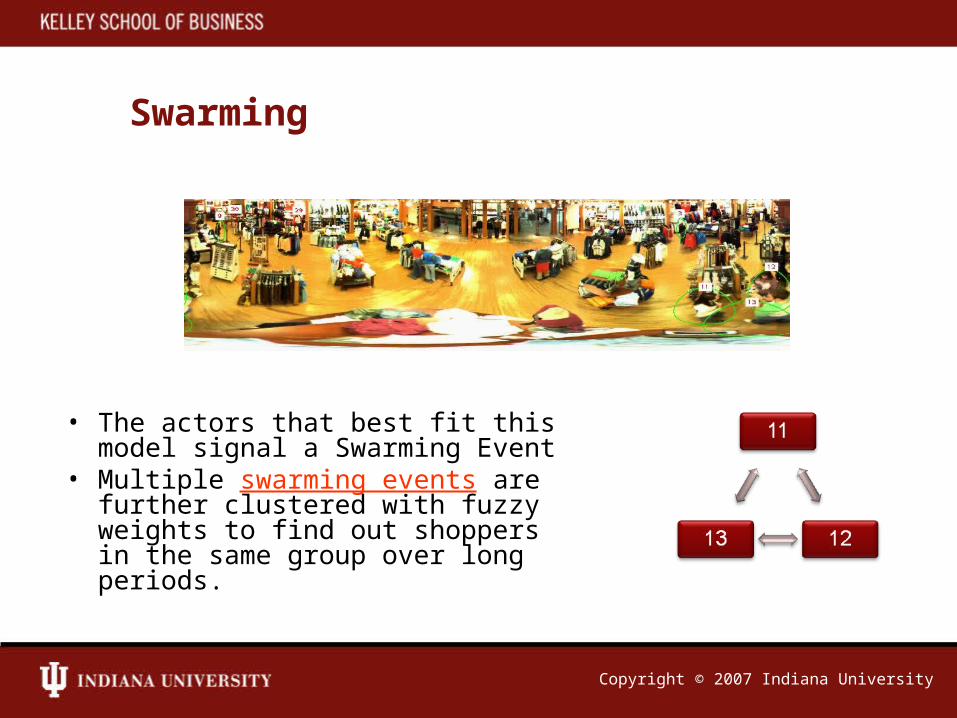
Swarming
• The actors that best fit this model signal a Swarming Event
• Multiple swarming events are further clustered with fuzzy weights to find out shoppers in the same group over long periods.
Copyright © 2007 Indiana UniversityCopyright © 2007 Indiana University
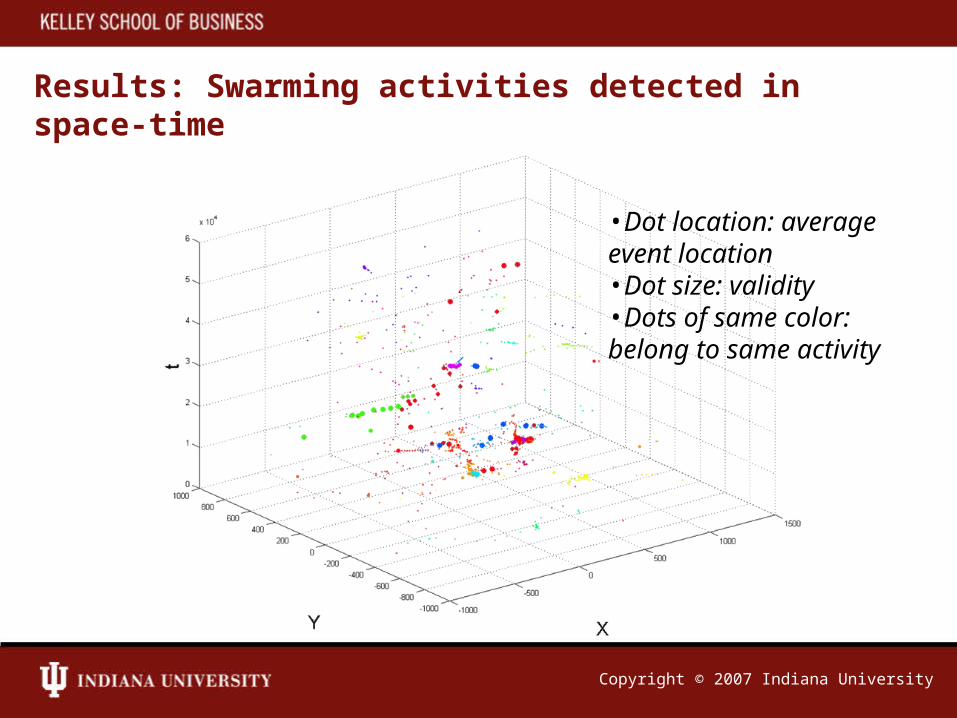
Results: Swarming activities detected in space-time
•Dot location: average event location•Dot size: validity•Dots of same color: belong to same activity
Copyright © 2007 Indiana UniversityCopyright © 2007 Indiana University
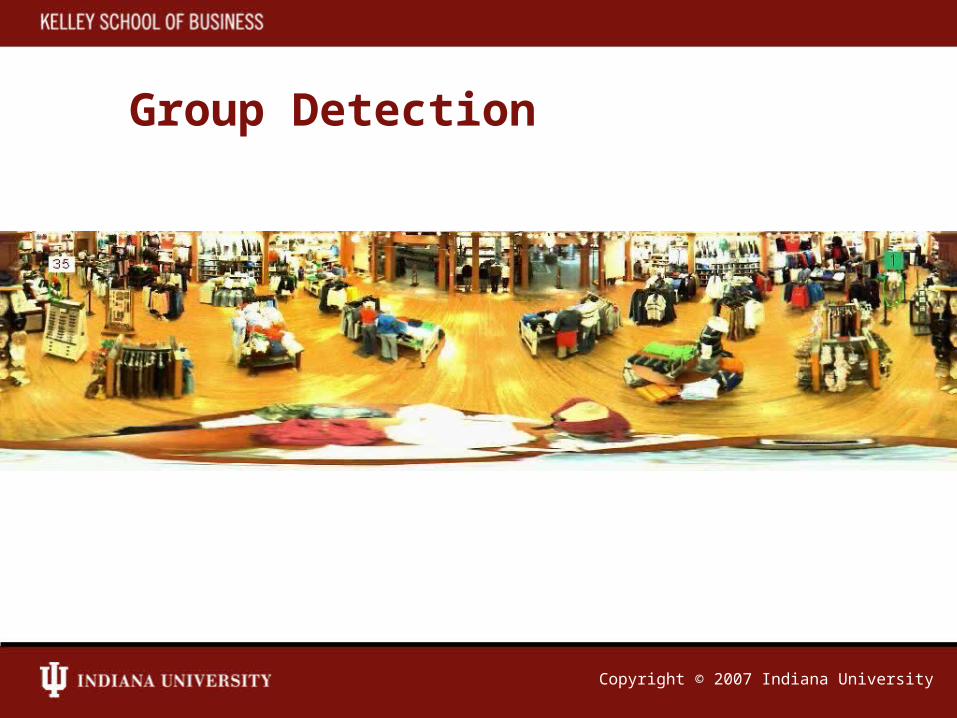
Group Detection
Copyright © 2007 Indiana University
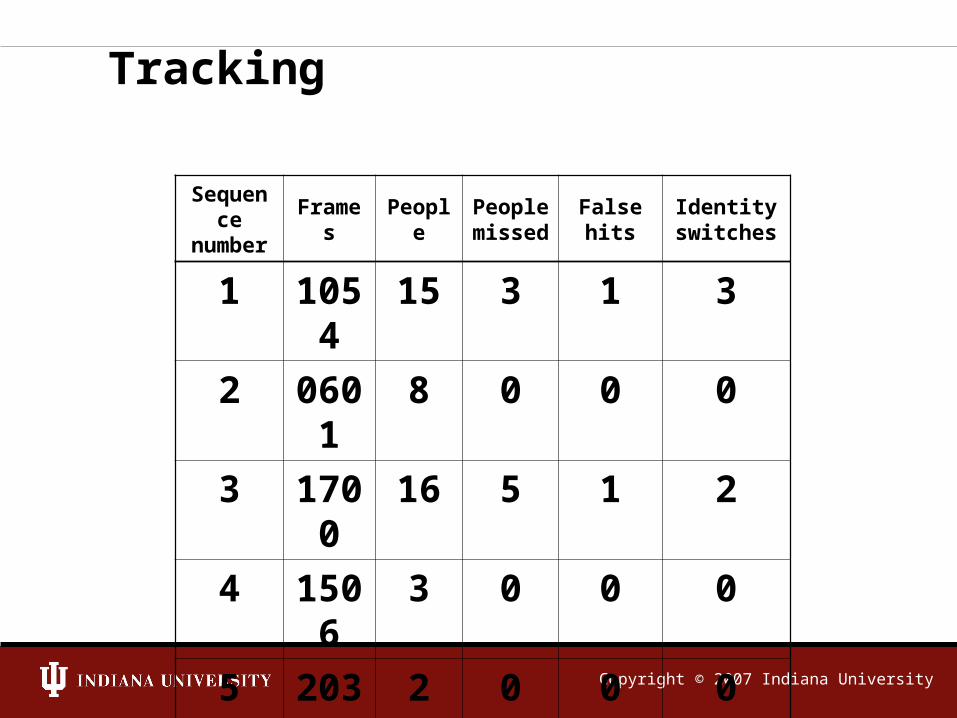
Tracking
Sequence
number
Frames
People
People
missed
False hits
Identity switches
1 1054
15 3 1 3
2 0601
8 0 0 0
3 1700
16 5 1 2
4 1506
3 0 0 0
5 2031
2 0 0 0
6 1652
4 0 0 0
%% 8544
48 12.5
4.1 10.4
Copyright © 2007 Indiana University
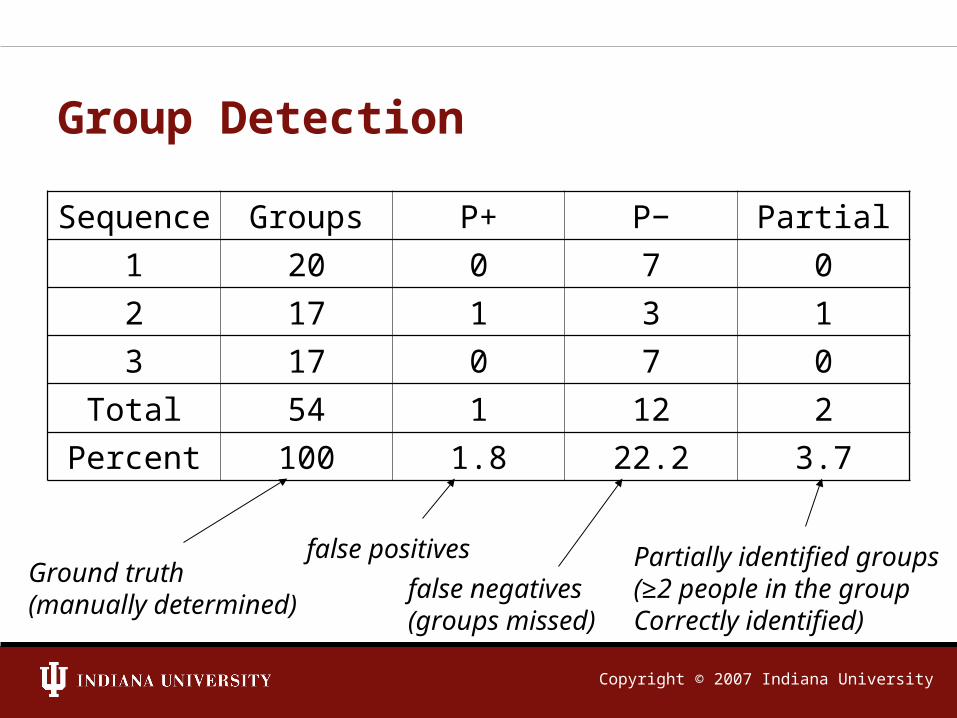
Group Detection
Sequence Groups P+ P− Partial
1 20 0 7 0
2 17 1 3 1
3 17 0 7 0
Total 54 1 12 2
Percent 100 1.8 22.2 3.7
Ground truth(manually determined)
false positives
false negatives(groups missed)
Partially identified groups(≥2 people in the group Correctly identified)
Copyright © 2007 Indiana UniversityCopyright © 2007 Indiana University
Qualitative Assesments
• Longer paths provide better group detection (pval << 1)
• Two-people groups are easiest to detect• Simple one-step clustering of trajectories is not
sufficient for long-term group detection• Employee tracks pose a significant problem and
have to be excluded• Several groups were missed by the operator in
the initial ground truth– System caught groups missed by the human expert
after inspection of results.
Copyright © 2007 Indiana UniversityCopyright © 2007 Indiana University
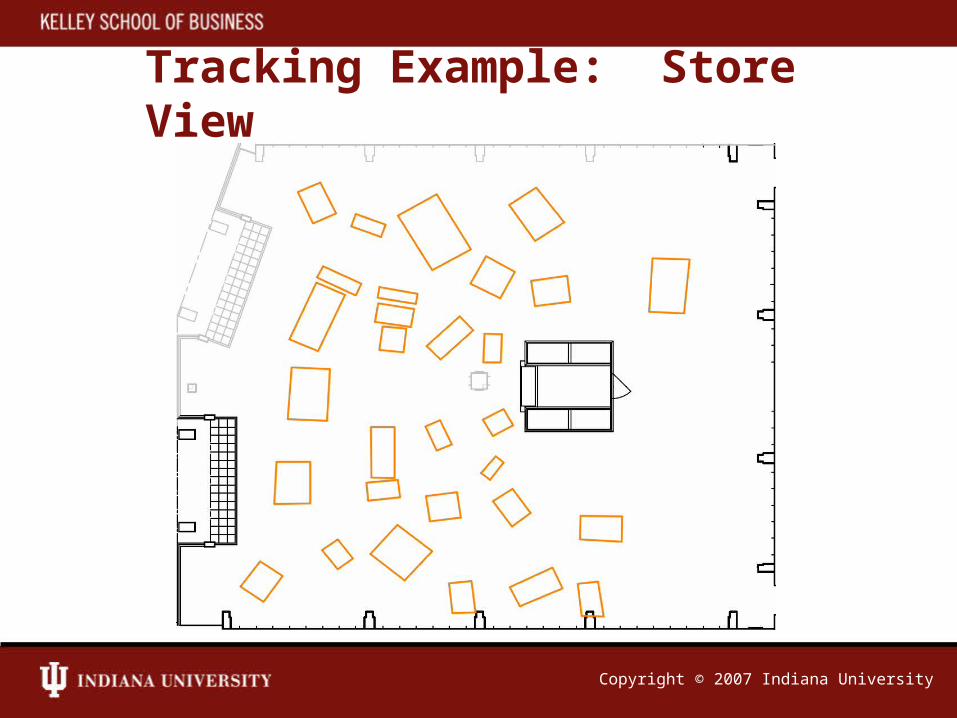
Tracking Example: Store View
Copyright © 2007 Indiana UniversityCopyright © 2007 Indiana University
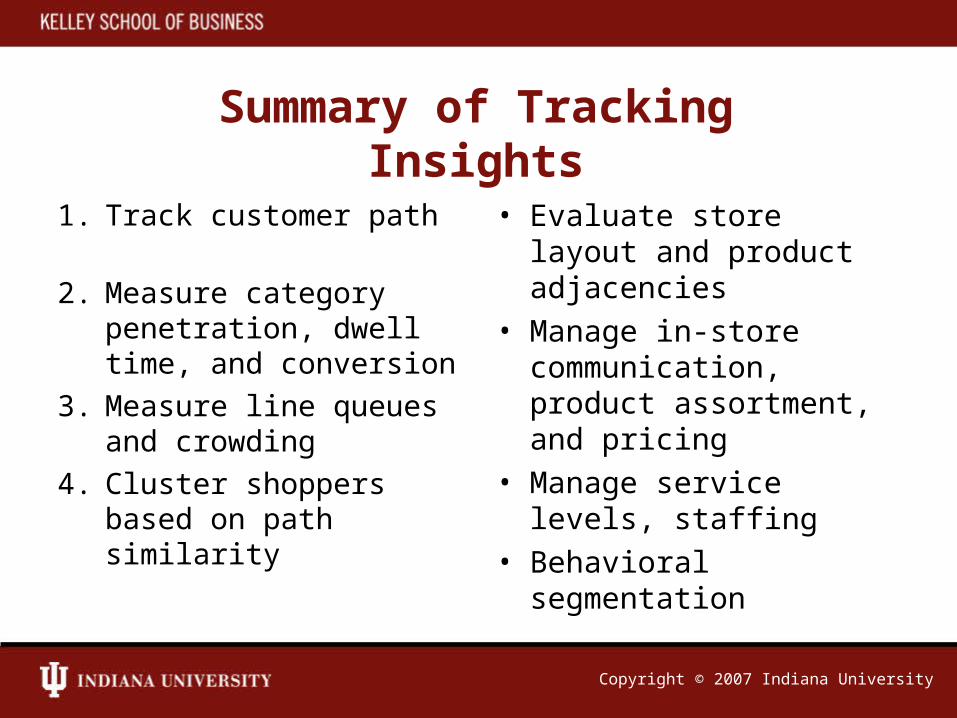
Summary of Tracking Insights
1. Track customer path
2. Measure category penetration, dwell time, and conversion
3. Measure line queues and crowding
4. Cluster shoppers based on path similarity
• Evaluate store layout and product adjacencies
• Manage in-store communication, product assortment, and pricing
• Manage service levels, staffing
• Behavioral segmentation

Copyright © 2007 Indiana UniversityCopyright © 2007 Indiana University
Resources
Questions?
Indiana University’s Kelley School of Business
www.kelley.iu.edu