Embed Size (px)
Citation preview
Copyright © 2006 Six Sigma Solutions LLCThe scientific approach to operations performance improvement
SIGMAS o l u t i o n s
SIX
1
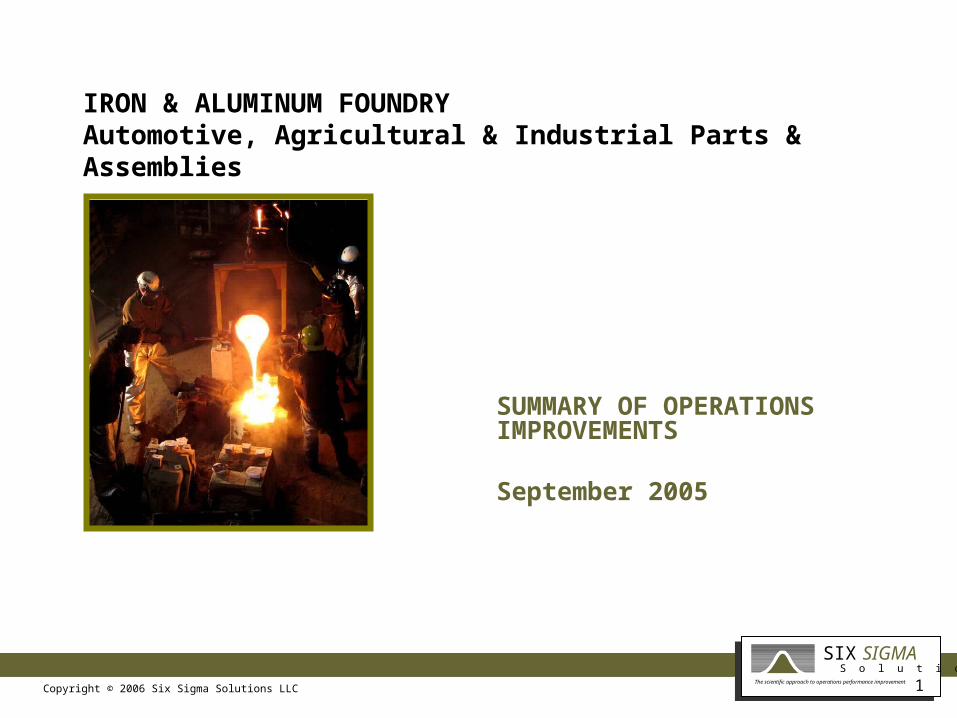
SUMMARY OF OPERATIONS IMPROVEMENTS
September 2005
IRON & ALUMINUM FOUNDRYAutomotive, Agricultural & Industrial Parts & Assemblies
Copyright © 2006 Six Sigma Solutions LLCThe scientific approach to operations performance improvement
SIGMAS o l u t i o n s
SIX
2
FOREWARD
This document outlines the financial benefits of operations improvements made across 5 iron & aluminum foundries over a 6 month period in 2005.
The scope of each operations improvement was defined by the client.
The financial benefits were achieved as a direct result of improvements in productivity, reductions in inventory, increases in labor efficiency, reductions in headcount, better quality products & faster throughput.
Copyright © 2006 Six Sigma Solutions LLCThe scientific approach to operations performance improvement
SIGMAS o l u t i o n s
SIX
3
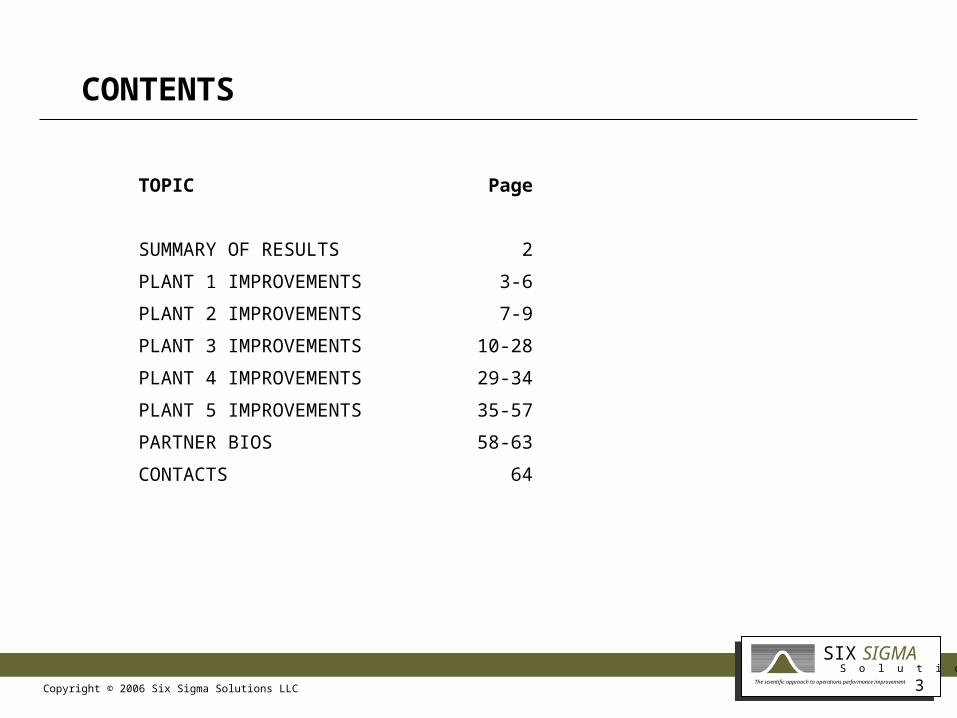
CONTENTS
TOPIC Page
SUMMARY OF RESULTS 2
PLANT 1 IMPROVEMENTS 3-6
PLANT 2 IMPROVEMENTS 7-9
PLANT 3 IMPROVEMENTS 10-28
PLANT 4 IMPROVEMENTS 29-34
PLANT 5 IMPROVEMENTS 35-57
PARTNER BIOS 58-63
CONTACTS 64
Copyright © 2006 Six Sigma Solutions LLCThe scientific approach to operations performance improvement
SIGMAS o l u t i o n s
SIX
4
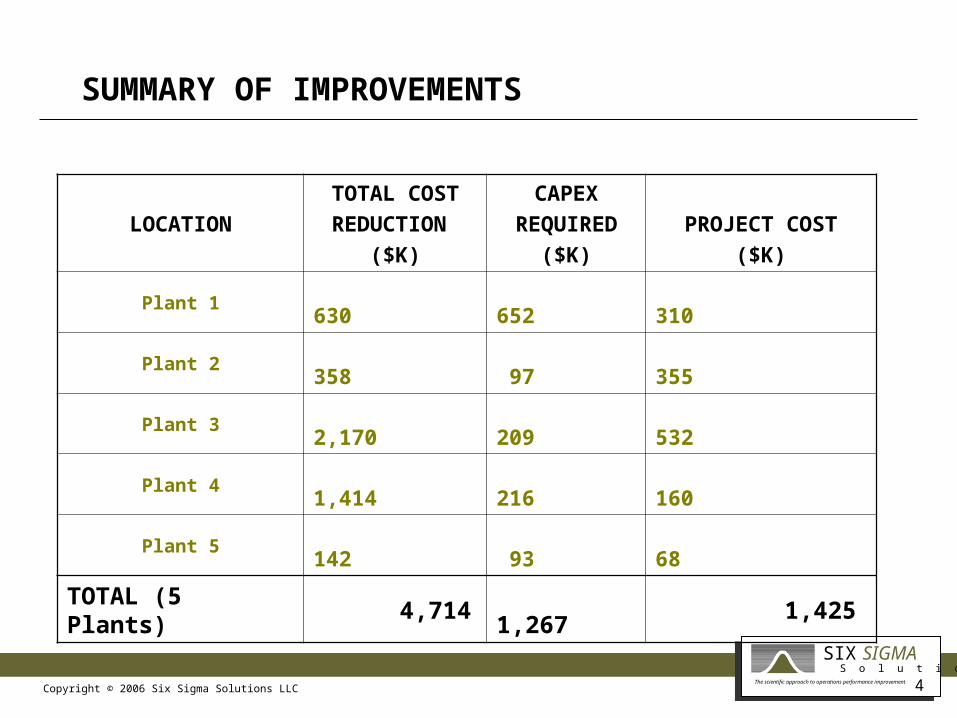
SUMMARY OF IMPROVEMENTS
LOCATION
TOTAL COST
REDUCTION
($K)
CAPEX
REQUIRED
($K)
PROJECT COST
($K)
Plant 1 630 652 310
Plant 2 358 97 355
Plant 3 2,170 209 532
Plant 4 1,414 216 160
Plant 5 142 93 68
TOTAL (5 Plants) 4,714 1,267 1,425

Copyright © 2006 Six Sigma Solutions LLCThe scientific approach to operations performance improvement
SIGMAS o l u t i o n s
SIX
5
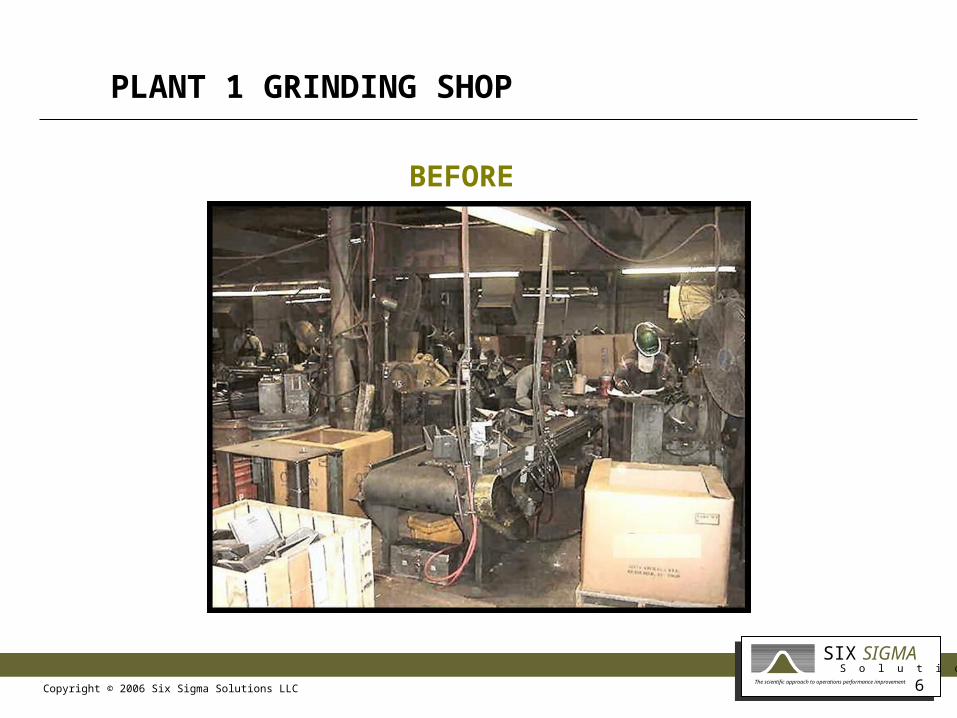
PLANT 1
Implement a Lean methodology in the grinding room to reduce costs & improve productivity
Copyright © 2006 Six Sigma Solutions LLCThe scientific approach to operations performance improvement
SIGMAS o l u t i o n s
SIX
6
PLANT 1 GRINDING SHOP
BEFORE
Copyright © 2006 Six Sigma Solutions LLCThe scientific approach to operations performance improvement
SIGMAS o l u t i o n s
SIX
7
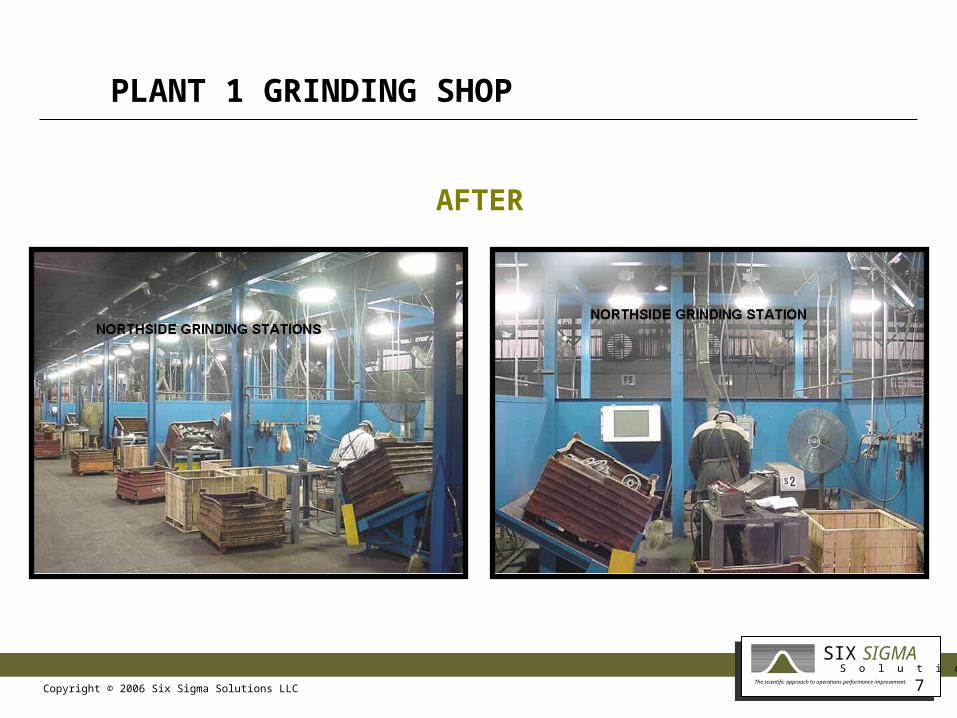
PLANT 1 GRINDING SHOP
AFTER
Copyright © 2006 Six Sigma Solutions LLCThe scientific approach to operations performance improvement
SIGMAS o l u t i o n s
SIX
8
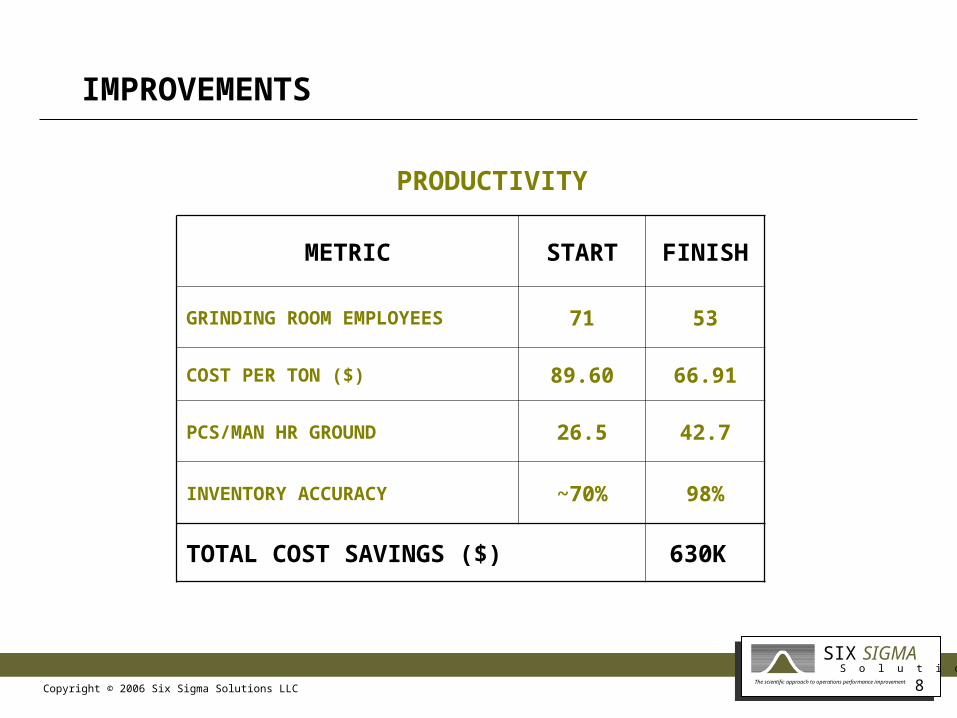
IMPROVEMENTS
METRIC START FINISH
GRINDING ROOM EMPLOYEES 71 53
COST PER TON ($) 89.60 66.91
PCS/MAN HR GROUND 26.5 42.7
INVENTORY ACCURACY ~70% 98%
TOTAL COST SAVINGS ($) 630K
PRODUCTIVITY

Copyright © 2006 Six Sigma Solutions LLCThe scientific approach to operations performance improvement
SIGMAS o l u t i o n s
SIX
9
PLANT 2
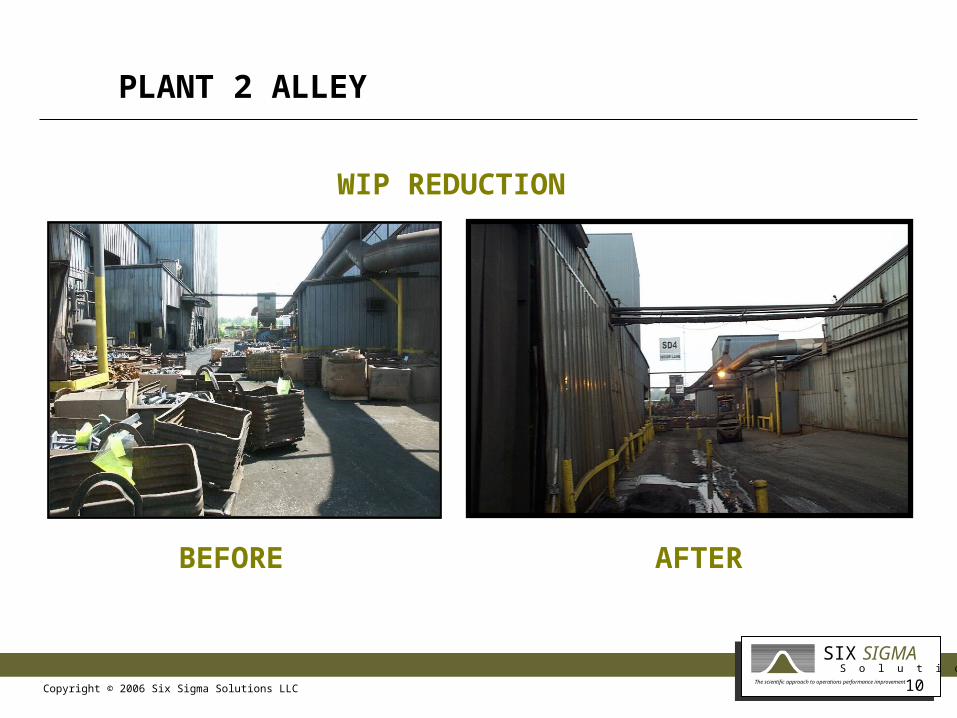
Reduce grinding/shipping labor & reduce WIP/finished goods inventory
Copyright © 2006 Six Sigma Solutions LLCThe scientific approach to operations performance improvement
SIGMAS o l u t i o n s
SIX
10
PLANT 2 ALLEY
BEFORE AFTER
WIP REDUCTION
Copyright © 2006 Six Sigma Solutions LLCThe scientific approach to operations performance improvement
SIGMAS o l u t i o n s
SIX
11
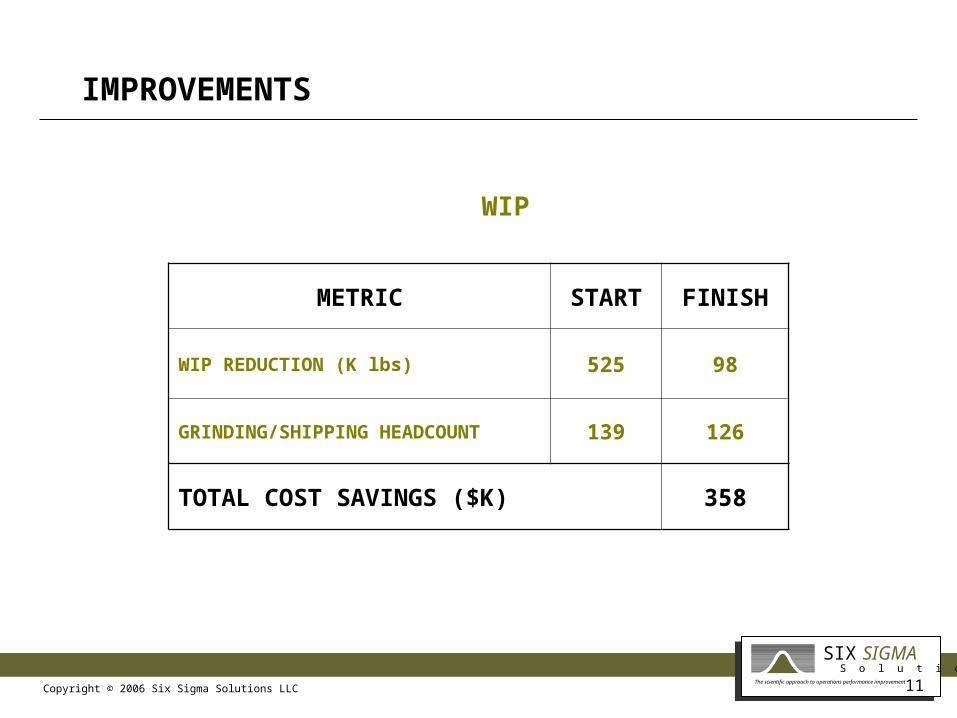
IMPROVEMENTS
METRIC START FINISH
WIP REDUCTION (K lbs) 525 98
GRINDING/SHIPPING HEADCOUNT 139 126
TOTAL COST SAVINGS ($K) 358
WIP
Copyright © 2006 Six Sigma Solutions LLCThe scientific approach to operations performance improvement
SIGMAS o l u t i o n s
SIX
12
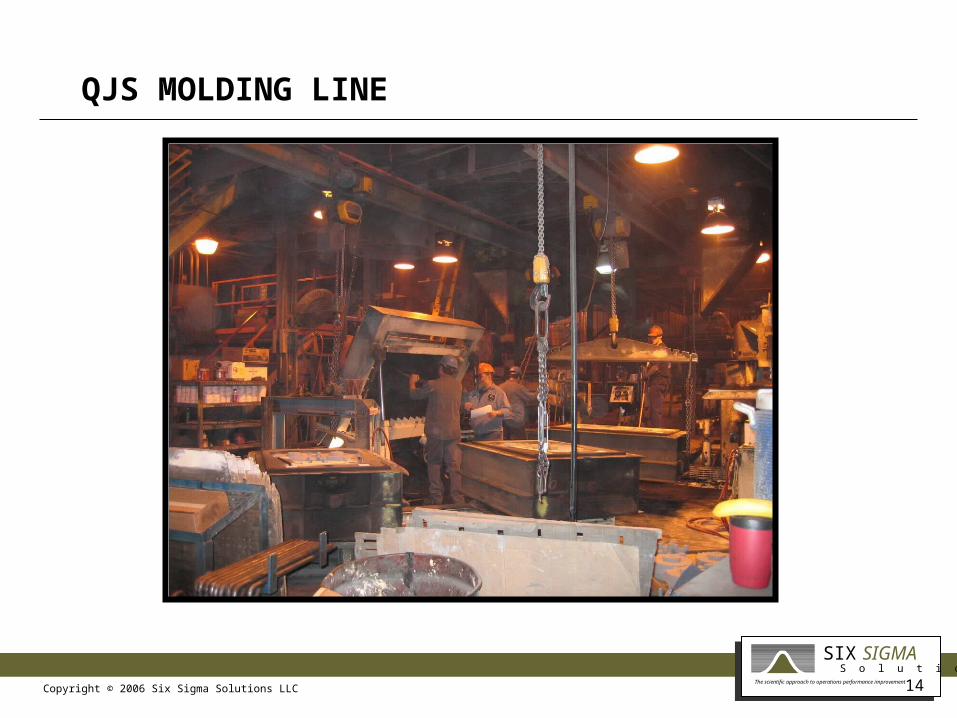
PLANT 3
Coordinate QJS molding improvement project for improved output (molds/hr) and labor savings
Copyright © 2006 Six Sigma Solutions LLCThe scientific approach to operations performance improvement
SIGMAS o l u t i o n s
SIX
13
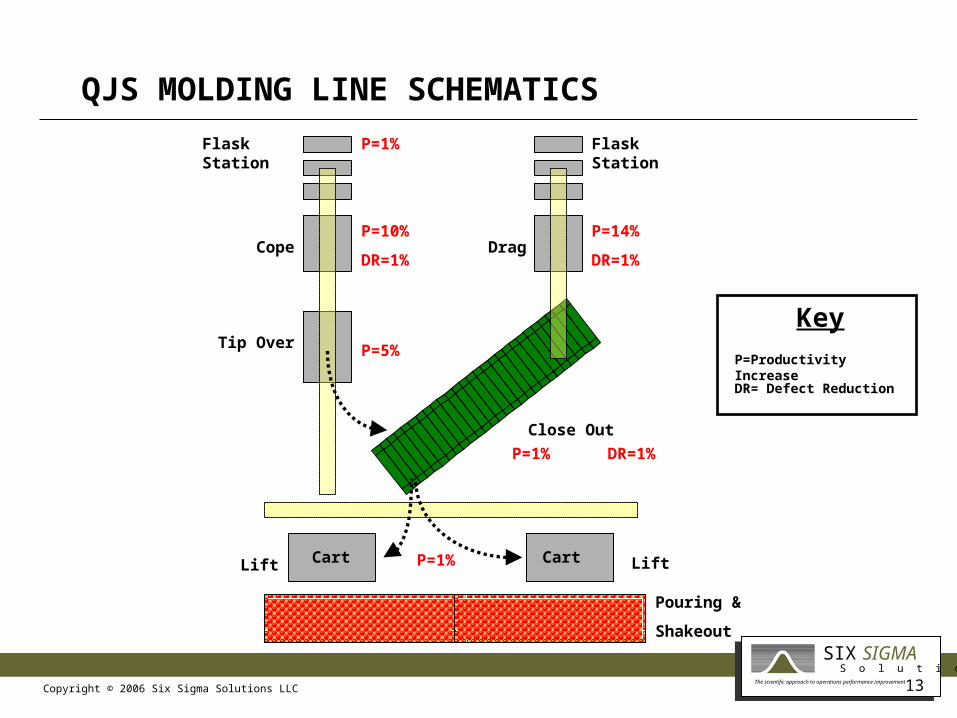
QJS MOLDING LINE SCHEMATICS
Flask StationFlask Station
Drag
Lift
Close Out
Tip Over
Cope
Lift
Pouring &
Shakeout
CartCart
Key
P=Productivity Increase
DR= Defect Reduction
P=10%
DR=1%
P=1%
P=14%
DR=1%
P=1%
P=5%
P=1% DR=1%
Copyright © 2006 Six Sigma Solutions LLCThe scientific approach to operations performance improvement
SIGMAS o l u t i o n s
SIX
14
QJS MOLDING LINE
Copyright © 2006 Six Sigma Solutions LLCThe scientific approach to operations performance improvement
SIGMAS o l u t i o n s
SIX
15
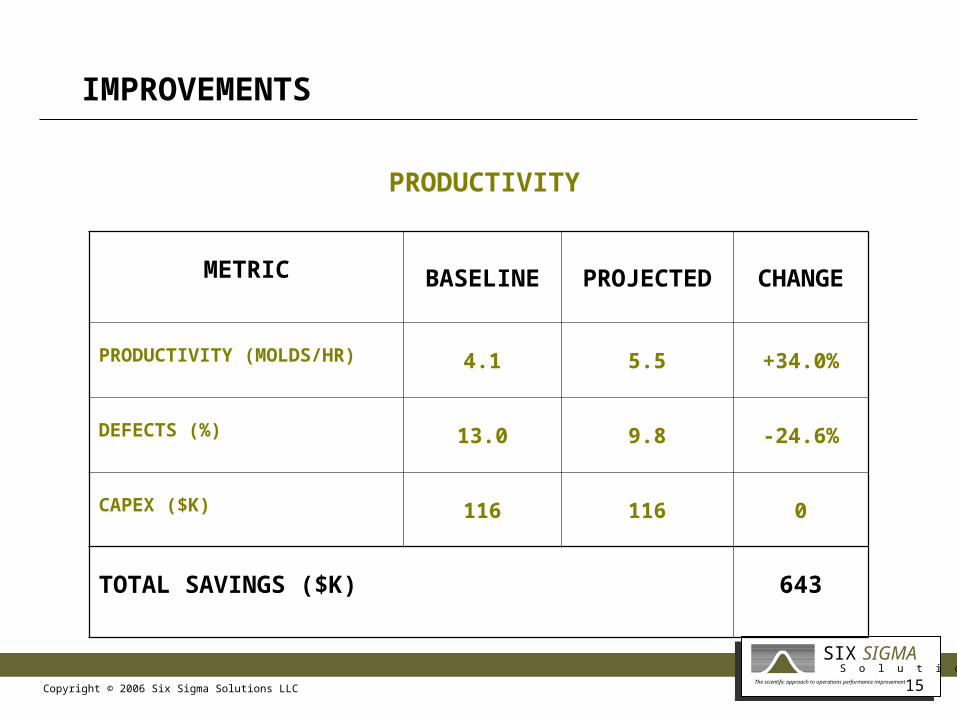
IMPROVEMENTS
METRIC BASELINE PROJECTED CHANGE
PRODUCTIVITY (MOLDS/HR) 4.1 5.5 +34.0%
DEFECTS (%) 13.0 9.8 -24.6%
CAPEX ($K) 116 116 0
TOTAL SAVINGS ($K) 643
PRODUCTIVITY

Copyright © 2006 Six Sigma Solutions LLCThe scientific approach to operations performance improvement
SIGMAS o l u t i o n s
SIX
16
PLANT 3
Improve labor productivity, material handling logistics & scheduling in core making department to improve core machine utilization & percent uptime yielding more core blows per hour, cores per hour
Copyright © 2006 Six Sigma Solutions LLCThe scientific approach to operations performance improvement
SIGMAS o l u t i o n s
SIX
17
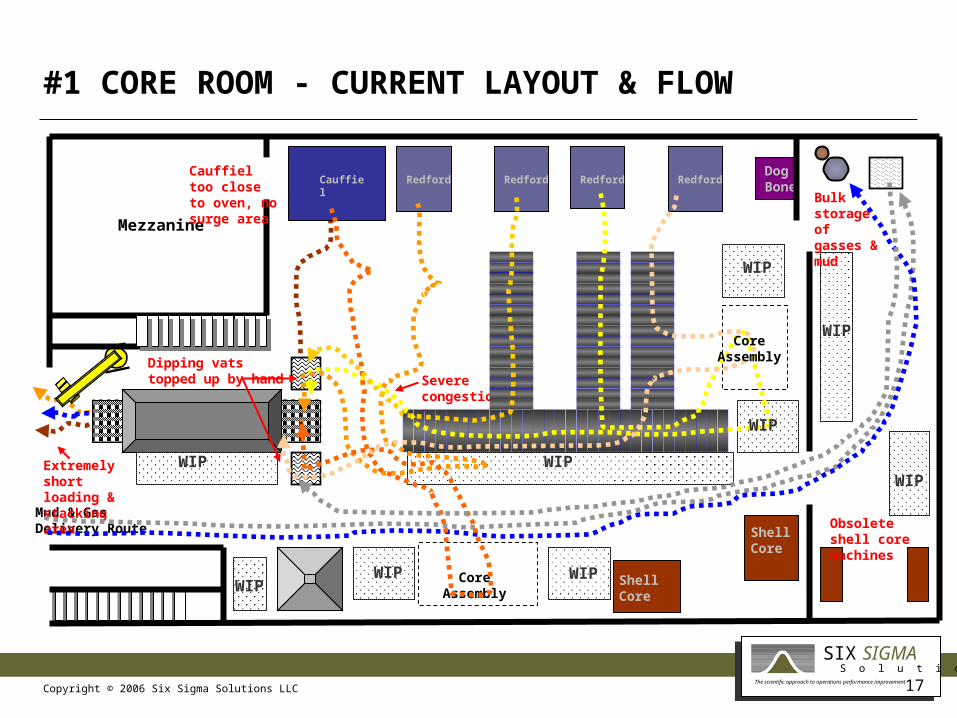
#1 CORE ROOM - CURRENT LAYOUT & FLOW
Mud & Gas Delivery Route
Extremely short loading & stacking area
Severe congestion
Mezzanine
Cauffiel too close to oven, no surge area
Dog Bone
RedfordRedford Redford RedfordCauffiel
WIP
WIP
WIPWIP
WIP
WIP
Bulk storage of gasses & mud
Obsolete shell core machines
WIPWIP
Core Assembly Shell Core
Shell Core
Dipping vats topped up by hand
CoreAssembly
WIP

Copyright © 2006 Six Sigma Solutions LLCThe scientific approach to operations performance improvement
SIGMAS o l u t i o n s
SIX
18
INEFFICIENCIES - SCHEDULING
Typical Schedule
Suggested Schedule
Example: Part # - X62008367, Quantity = 100
Laempe
Redford
Corefit
Queue Queue
Queue
Redford (1370 mins)
Cauffiel (548 mins)
Corefit (1454 mins)
T=1370 mins
Cauffiel (548 mins)
Corefit (1454 mins)
Redford (1370 mins)
T=1868 mins
Potential Time Saving,
Δt = - 498 mins
Process
Copyright © 2006 Six Sigma Solutions LLCThe scientific approach to operations performance improvement
SIGMAS o l u t i o n s
SIX
19
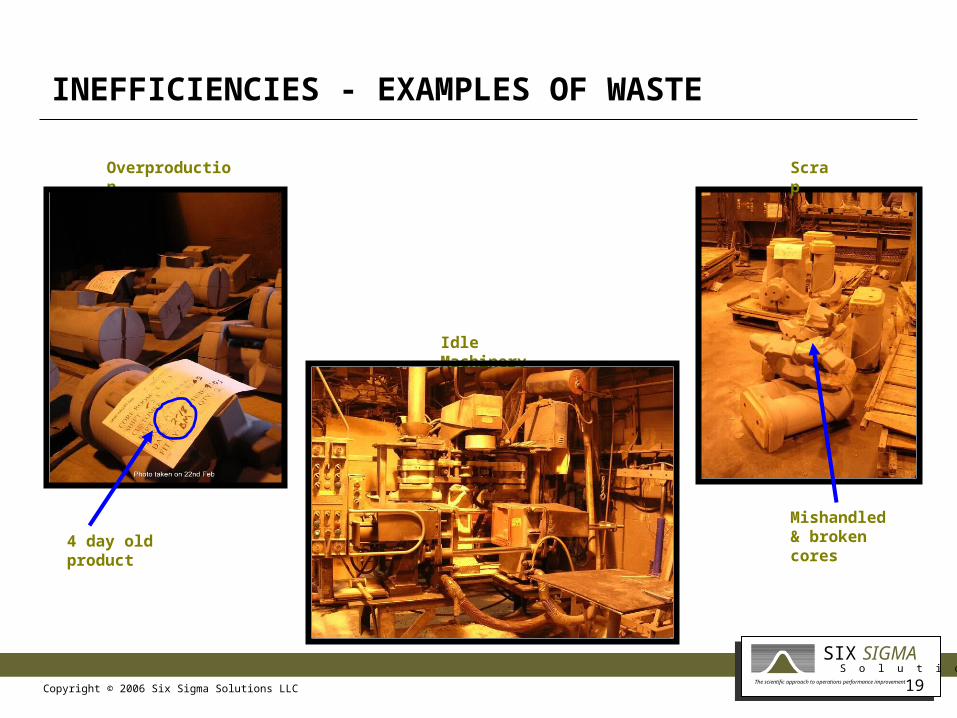
INEFFICIENCIES - EXAMPLES OF WASTE
Overproduction
Idle Machinery
Scrap
4 day old product
Mishandled & broken cores
Copyright © 2006 Six Sigma Solutions LLCThe scientific approach to operations performance improvement
SIGMAS o l u t i o n s
SIX
20
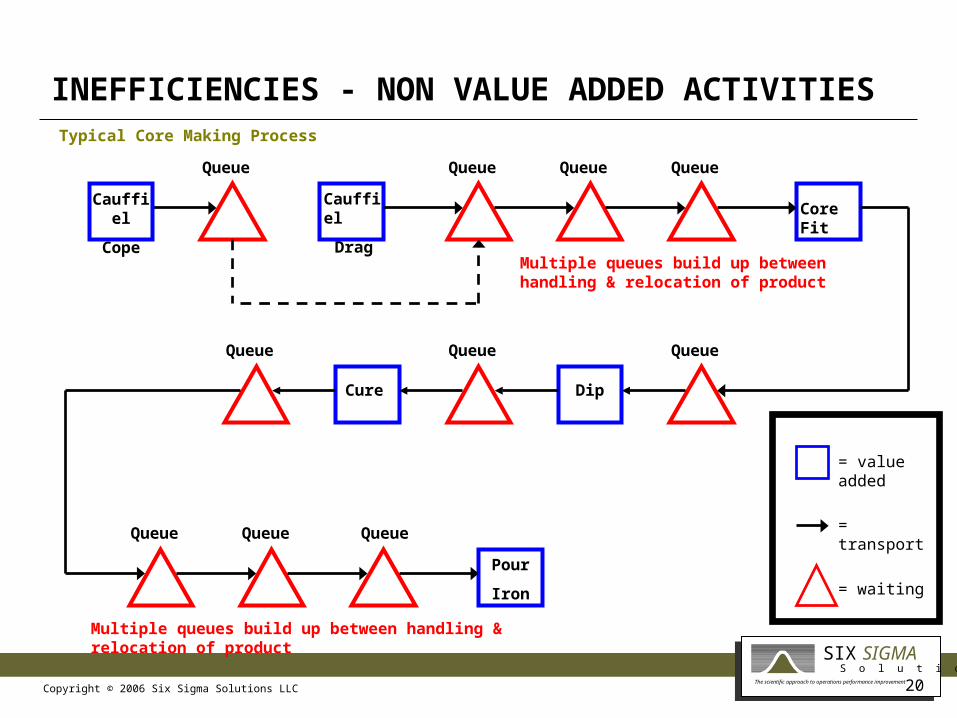
INEFFICIENCIES - NON VALUE ADDED ACTIVITIES
Cauffiel
Cope
Dip
Pour
Iron
QueueQueue
Cure
Cauffiel
DragCore Fit
Queue
Queue Queue
QueueQueue
Queue Queue Queue = transport
= waiting
= value added
Typical Core Making Process
Multiple queues build up between handling & relocation of product
Multiple queues build up between handling & relocation of product

Copyright © 2006 Six Sigma Solutions LLCThe scientific approach to operations performance improvement
SIGMAS o l u t i o n s
SIX
21
INEFFICIENCIES - BOTTLENECKS
Oven capacity lower than dipping
Long queues
Dipping capacity lower than core fit & assembly
Excessive WIP

Copyright © 2006 Six Sigma Solutions LLCThe scientific approach to operations performance improvement
SIGMAS o l u t i o n s
SIX
22
#1 CORE ROOM - PROPOSED LAYOUT & FLOW
MezzanineDog Bone RedfordRedford
RedfordRedford Cauffiel
Shell Core
Shell Core
RedfordRedford RedfordRedford
Tooling delivery route
Mud & gas delivery route
Oven stretched & moved back
All dipping vats auto refilled
Supervisors’ Office
Copyright © 2006 Six Sigma Solutions LLCThe scientific approach to operations performance improvement
SIGMAS o l u t i o n s
SIX
23
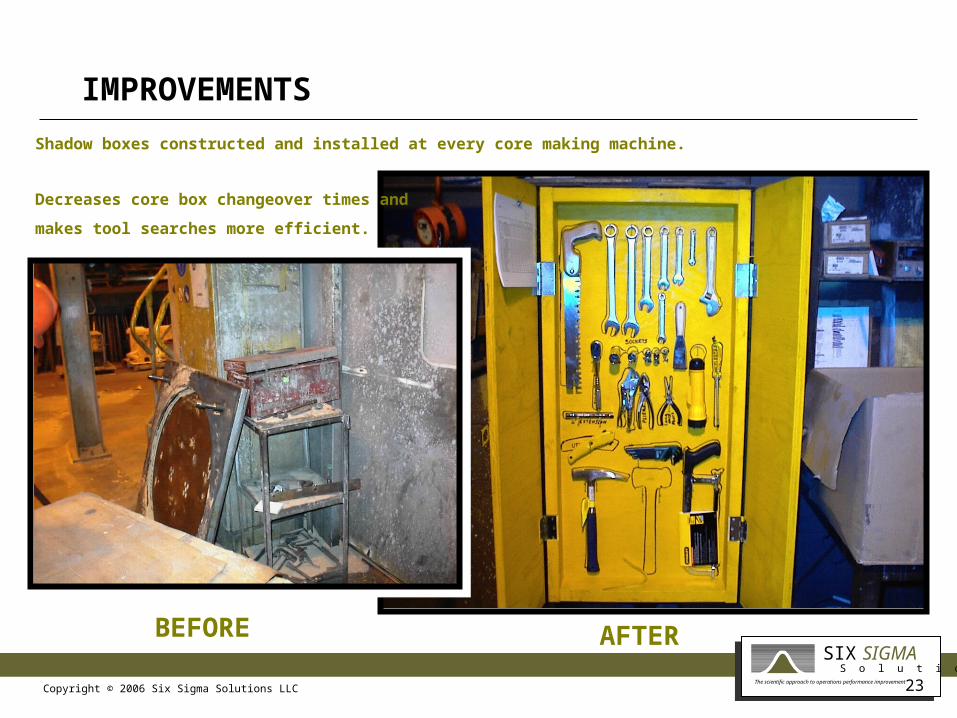
IMPROVEMENTS
Decreases core box changeover times and
makes tool searches more efficient.
BEFORE AFTER
Shadow boxes constructed and installed at every core making machine.

Copyright © 2006 Six Sigma Solutions LLCThe scientific approach to operations performance improvement
SIGMAS o l u t i o n s
SIX
24
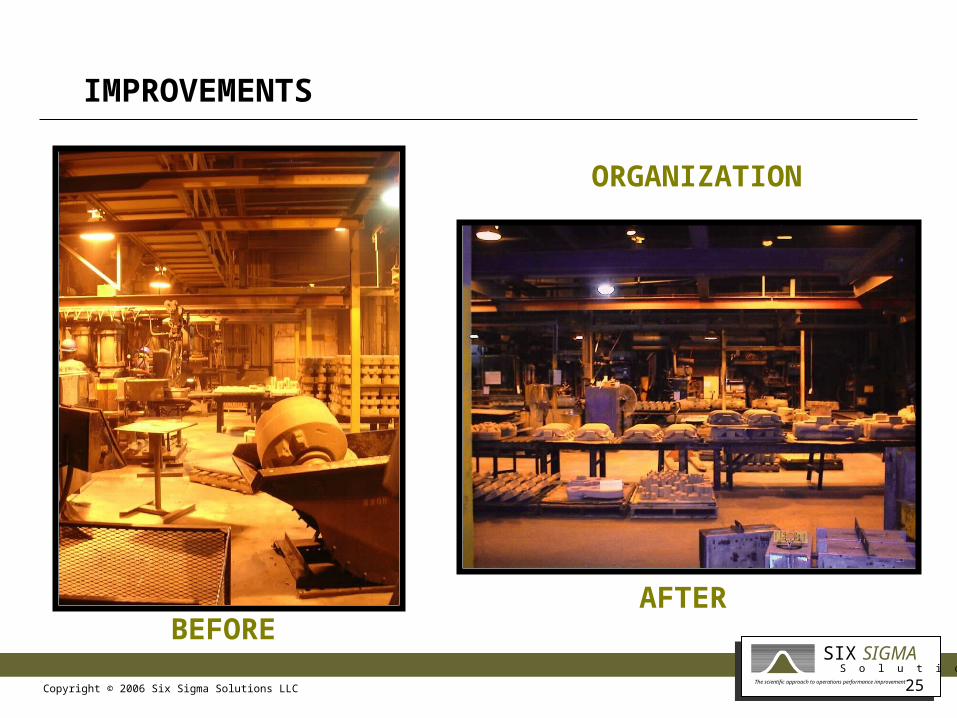
IMPROVEMENTS
BEFORE AFTER
LINE OF SITE
Copyright © 2006 Six Sigma Solutions LLCThe scientific approach to operations performance improvement
SIGMAS o l u t i o n s
SIX
25
IMPROVEMENTS
ORGANIZATION
BEFOREAFTER
Copyright © 2006 Six Sigma Solutions LLCThe scientific approach to operations performance improvement
SIGMAS o l u t i o n s
SIX
26
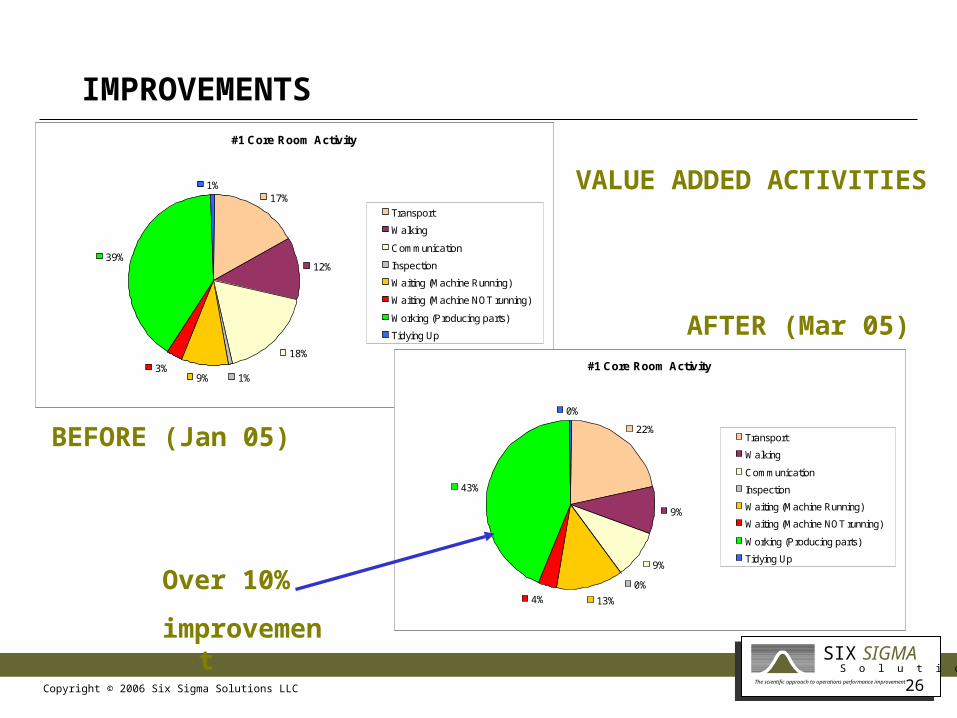
IMPROVEMENTS#1 Core Room Activity
17%
12%
18%
1%9%3%
39%
1%
Transport
Walking
Communication
Inspection
Waiting (Machine Running)
Waiting (Machine NOT running)
Working (Producing parts)
Tidying Up
#1 Core Room Activity
22%
9%
9%
0%
13%4%
43%
0%
Transport
Walking
Communication
Inspection
Waiting (Machine Running)
Waiting (Machine NOT running)
Working (Producing parts)
Tidying Up
BEFORE (Jan 05)
AFTER (Mar 05)
VALUE ADDED ACTIVITIES
Over 10%
improvement
Copyright © 2006 Six Sigma Solutions LLCThe scientific approach to operations performance improvement
SIGMAS o l u t i o n s
SIX
27
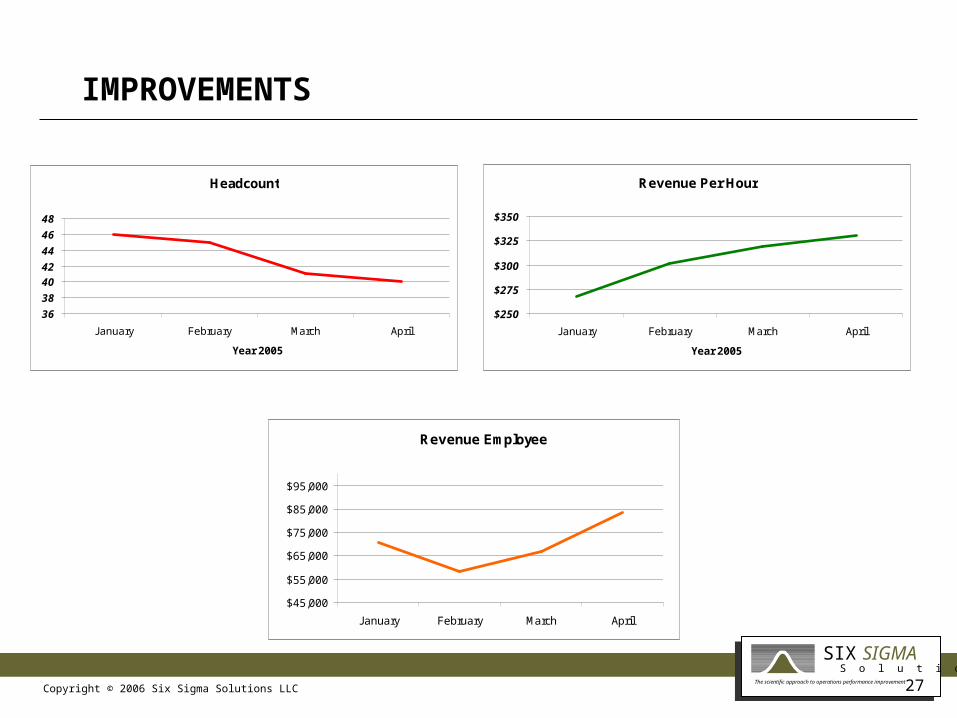
IMPROVEMENTS
Headcount
36
38
40
42
44
46
48
January February March April
Year 2005
Revenue Per Hour
$250
$275
$300
$325
$350
January February March April
Year 2005
Revenue Employee
$45,000
$55,000
$65,000
$75,000
$85,000
$95,000
January February March April
Copyright © 2006 Six Sigma Solutions LLCThe scientific approach to operations performance improvement
SIGMAS o l u t i o n s
SIX
28
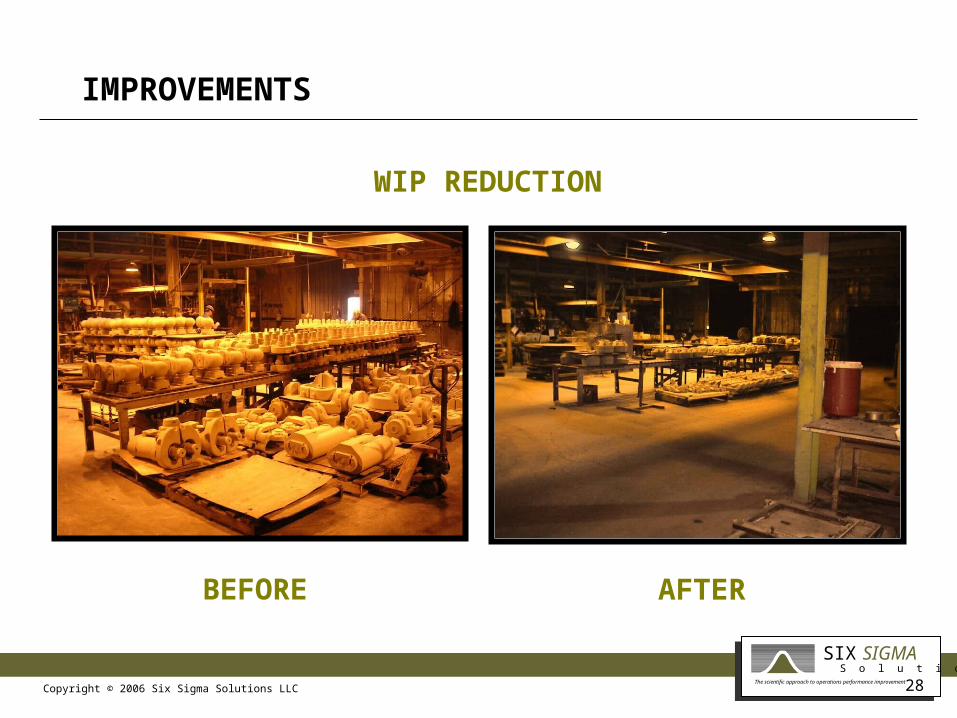
BEFORE AFTER
IMPROVEMENTS
WIP REDUCTION
Copyright © 2006 Six Sigma Solutions LLCThe scientific approach to operations performance improvement
SIGMAS o l u t i o n s
SIX
29
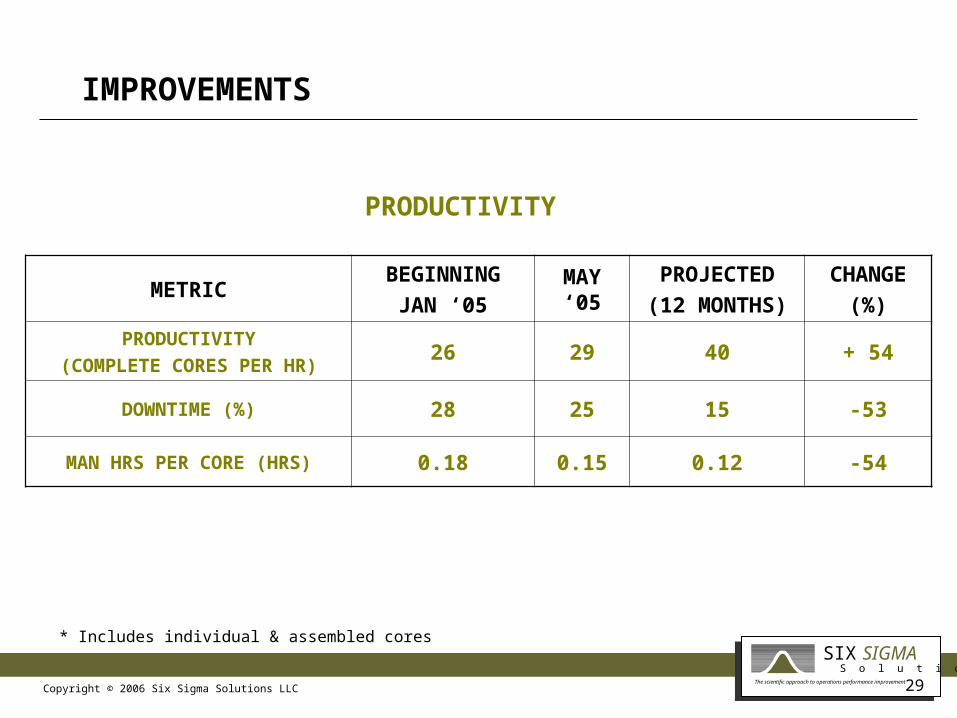
IMPROVEMENTS
METRICBEGINNING
JAN ‘05MAY ‘05
PROJECTED
(12 MONTHS)
CHANGE
(%)
PRODUCTIVITY
(COMPLETE CORES PER HR)26 29 40 + 54
DOWNTIME (%) 28 25 15 -53
MAN HRS PER CORE (HRS) 0.18 0.15 0.12 -54
* Includes individual & assembled cores
PRODUCTIVITY
Copyright © 2006 Six Sigma Solutions LLCThe scientific approach to operations performance improvement
SIGMAS o l u t i o n s
SIX
30
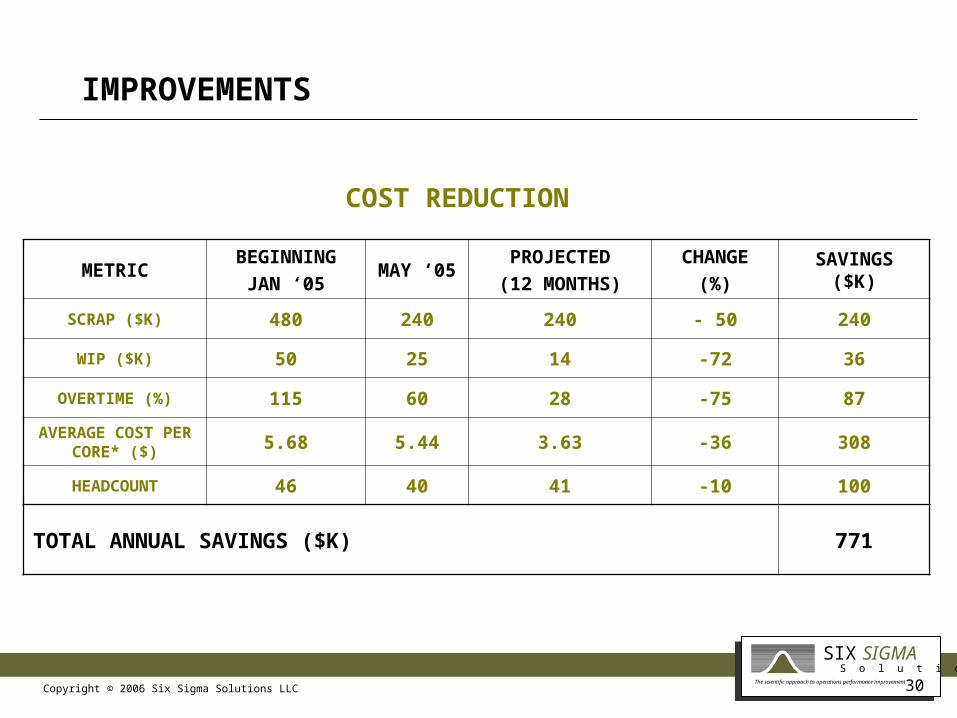
IMPROVEMENTS
METRICBEGINNING
JAN ‘05MAY ‘05
PROJECTED
(12 MONTHS)
CHANGE
(%)SAVINGS ($K)
SCRAP ($K) 480 240 240 - 50 240
WIP ($K) 50 25 14 -72 36
OVERTIME (%) 115 60 28 -75 87
AVERAGE COST PER CORE* ($) 5.68 5.44 3.63 -36 308
HEADCOUNT 46 40 41 -10 100
TOTAL ANNUAL SAVINGS ($K) 771
COST REDUCTION
Copyright © 2006 Six Sigma Solutions LLCThe scientific approach to operations performance improvement
SIGMAS o l u t i o n s
SIX
31
PLANT 4
Assess benefit of real time monitoring of the grinding/finishing output through the application of touch screens concept installed at Plant 1
Copyright © 2006 Six Sigma Solutions LLCThe scientific approach to operations performance improvement
SIGMAS o l u t i o n s
SIX
32
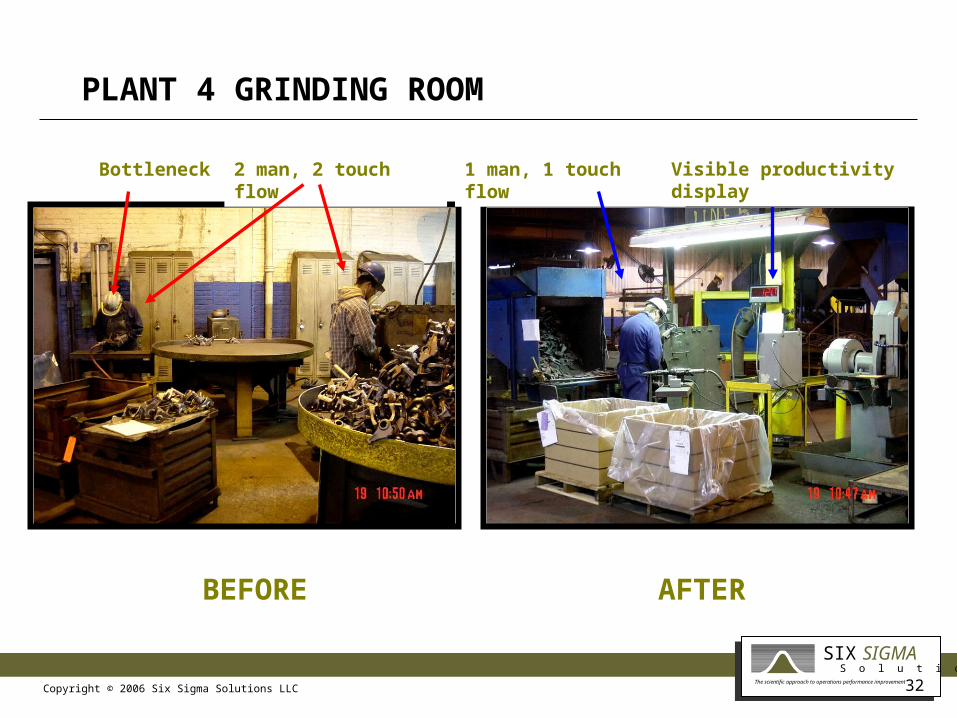
PLANT 4 GRINDING ROOM
BEFORE AFTER
Bottleneck 1 man, 1 touch flow2 man, 2 touch flow Visible productivity display
Copyright © 2006 Six Sigma Solutions LLCThe scientific approach to operations performance improvement
SIGMAS o l u t i o n s
SIX
33
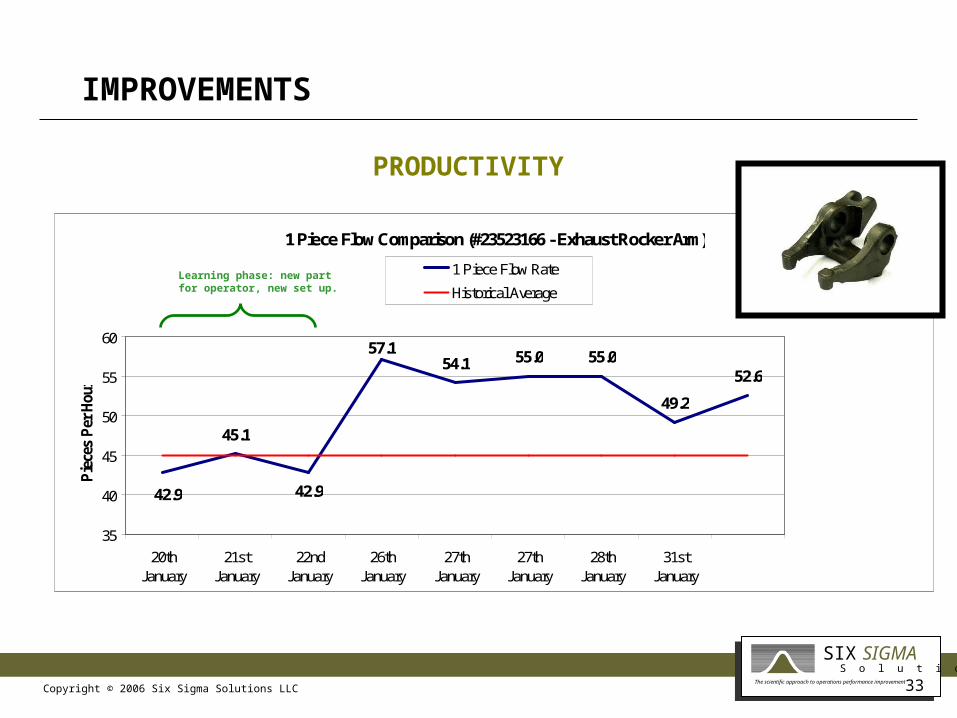
IMPROVEMENTS
1 Piece Flow Comparison (#23523166 - Exhaust Rocker Arm)
45.1
54.1 55.0 55.052.6
49.2
42.9 42.9
57.1
35
40
45
50
55
60
20thJanuary
21stJanuary
22ndJanuary
26thJanuary
27thJanuary
27thJanuary
28thJanuary
31stJanuary
Pie
ces
Per
Hou
r
1 Piece Flow Rate
Historical AverageLearning phase: new partfor operator, new set up.
PRODUCTIVITY
Copyright © 2006 Six Sigma Solutions LLCThe scientific approach to operations performance improvement
SIGMAS o l u t i o n s
SIX
34
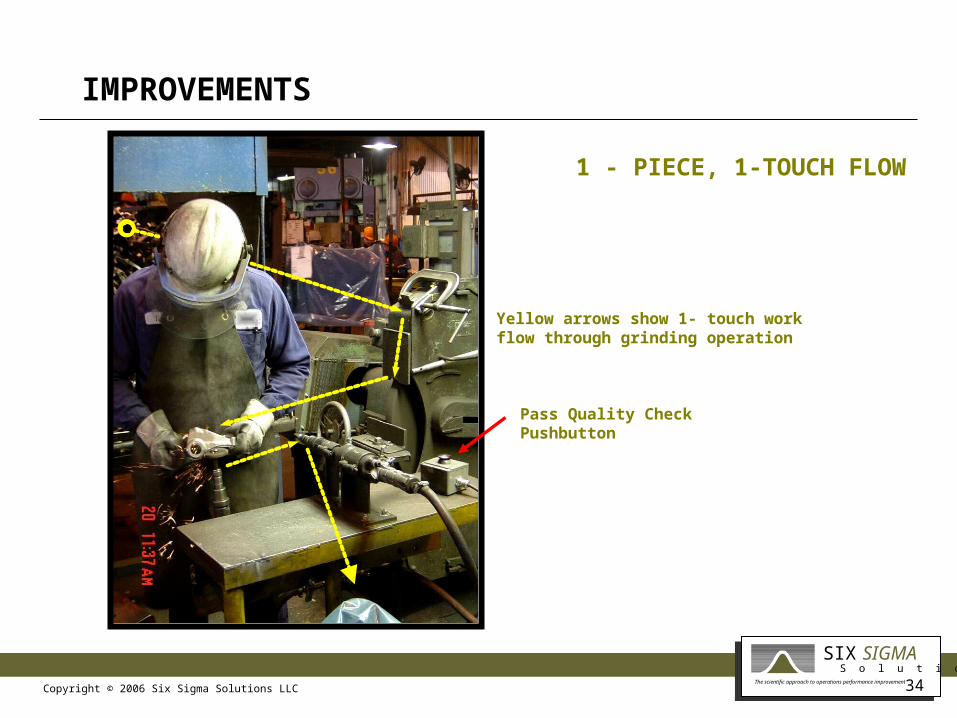
IMPROVEMENTS
Pass Quality Check Pushbutton
Yellow arrows show 1- touch work flow through grinding operation
1 - PIECE, 1-TOUCH FLOW
Copyright © 2006 Six Sigma Solutions LLCThe scientific approach to operations performance improvement
SIGMAS o l u t i o n s
SIX
35
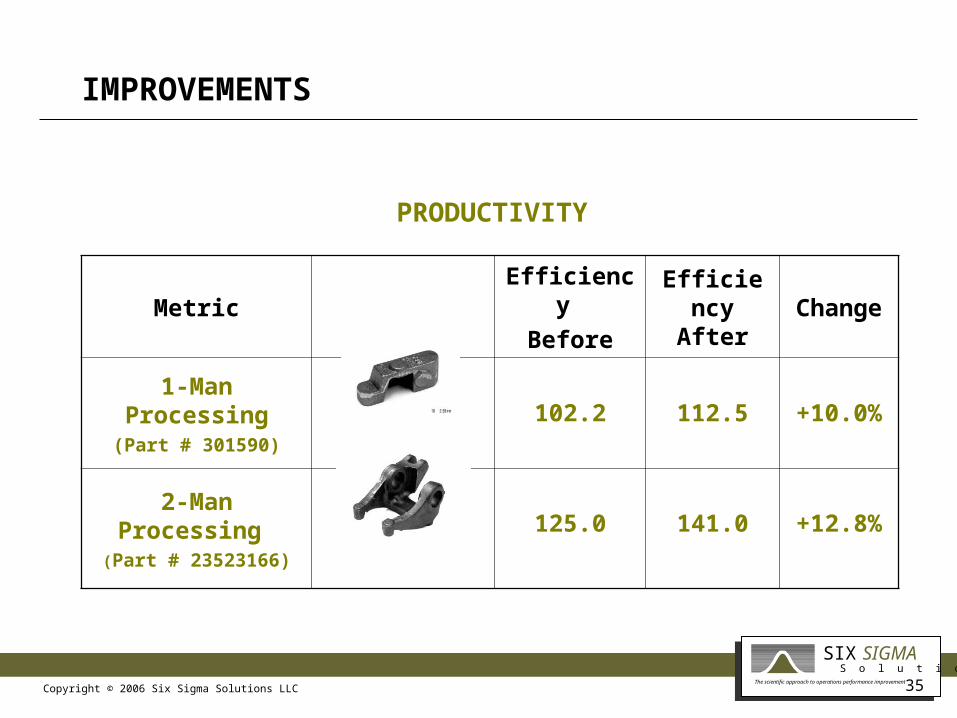
IMPROVEMENTS
MetricEfficiency
BeforeEfficiency
AfterChange
1-Man Processing(Part # 301590)
102.2 112.5 +10.0%
2-Man Processing (Part # 23523166)
125.0 141.0 +12.8%
PRODUCTIVITY
Copyright © 2006 Six Sigma Solutions LLCThe scientific approach to operations performance improvement
SIGMAS o l u t i o n s
SIX
36
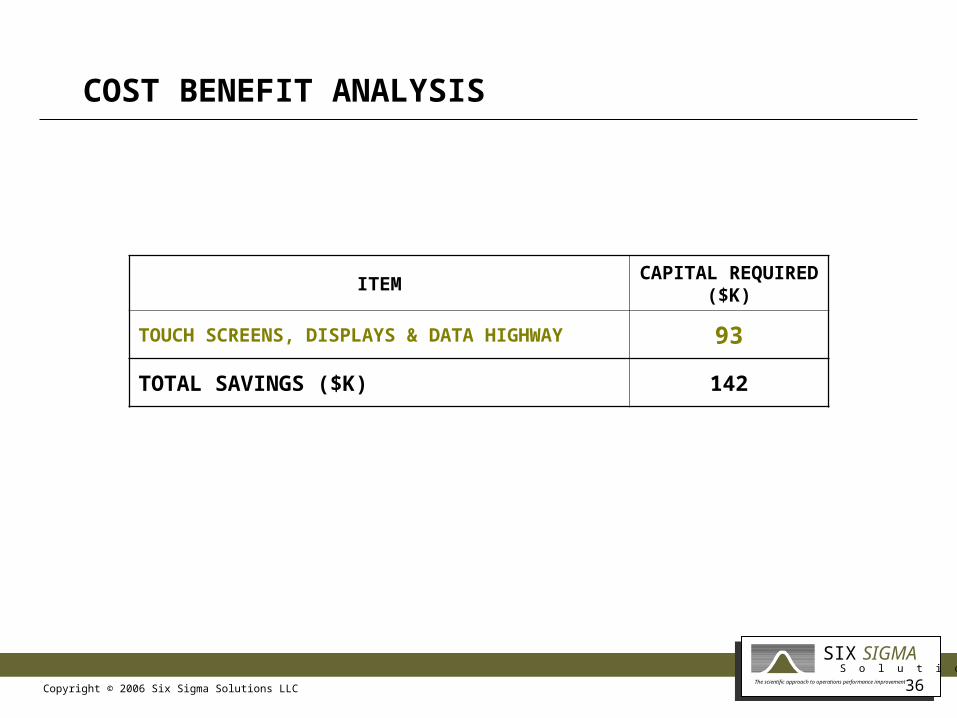
COST BENEFIT ANALYSIS
ITEMCAPITAL
REQUIRED ($K)
TOUCH SCREENS, DISPLAYS & DATA HIGHWAY 93
TOTAL SAVINGS ($K) 142
Copyright © 2006 Six Sigma Solutions LLCThe scientific approach to operations performance improvement
SIGMAS o l u t i o n s
SIX
37
PLANT 5
Assess benefit of “real time” monitoring of grinding-finishing output through application of “touch screens”
Copyright © 2006 Six Sigma Solutions LLCThe scientific approach to operations performance improvement
SIGMAS o l u t i o n s
SIX
38
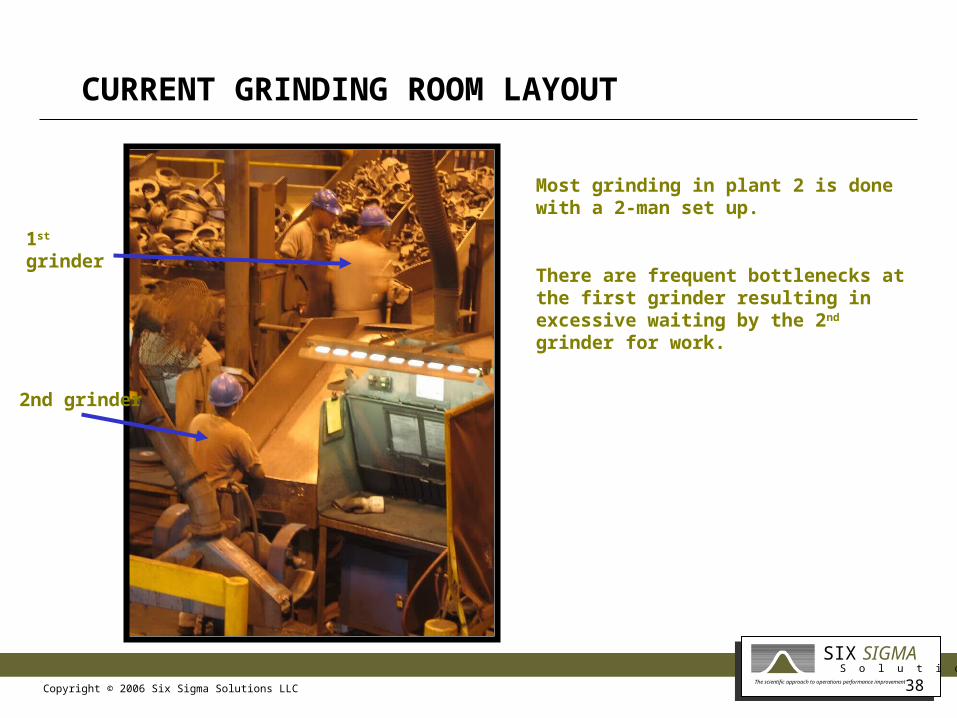
CURRENT GRINDING ROOM LAYOUT
Most grinding in plant 2 is done with a 2-man set up.
There are frequent bottlenecks at the first grinder resulting in excessive waiting by the 2nd grinder for work.
1st grinder
2nd grinder
Copyright © 2006 Six Sigma Solutions LLCThe scientific approach to operations performance improvement
SIGMAS o l u t i o n s
SIX
39
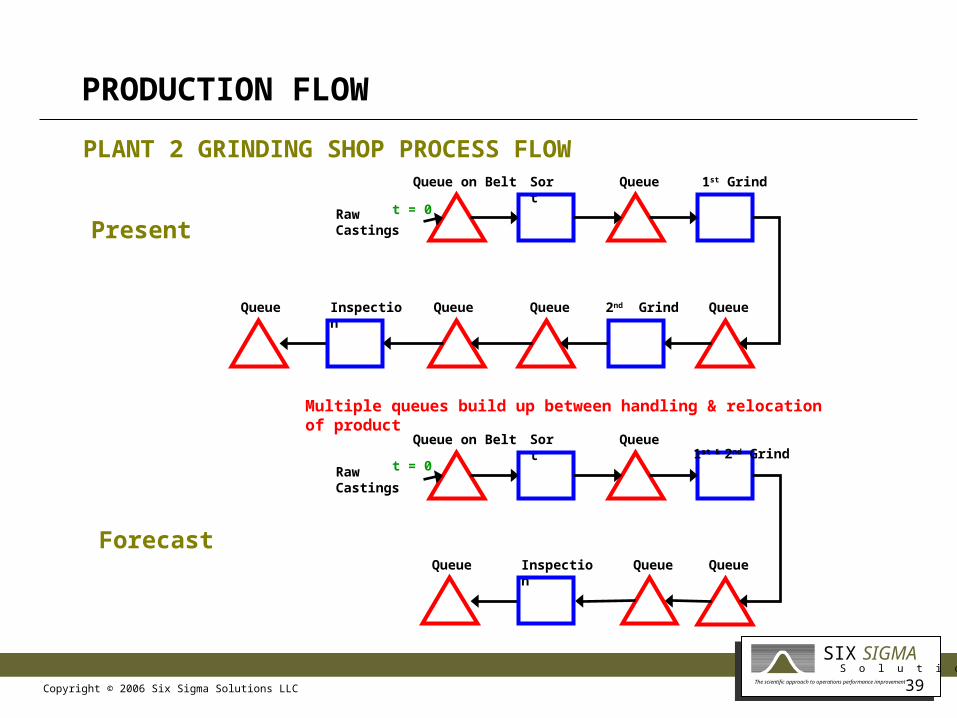
PRODUCTION FLOW
Raw Castings
Queue on Belt Queue 1st Grind
Inspection
Sort
2nd Grind QueueQueueQueueQueue
PLANT 2 GRINDING SHOP PROCESS FLOW
Raw Castings
Queue on Belt Queue1st & 2nd Grind
Inspection
Sort
QueueQueueQueue
t = 0
t = 0
Present
Forecast
Multiple queues build up between handling & relocation of product

Copyright © 2006 Six Sigma Solutions LLCThe scientific approach to operations performance improvement
SIGMAS o l u t i o n s
SIX
40
PROPOSED GRINDING ROOM LAYOUT
1st / 2nd Grinder
Sorter
Forklift driver
Gravity Feed
• Headcount reduced
• Bottlenecks removed
• Faster throughput
Copyright © 2006 Six Sigma Solutions LLCThe scientific approach to operations performance improvement
SIGMAS o l u t i o n s
SIX
41
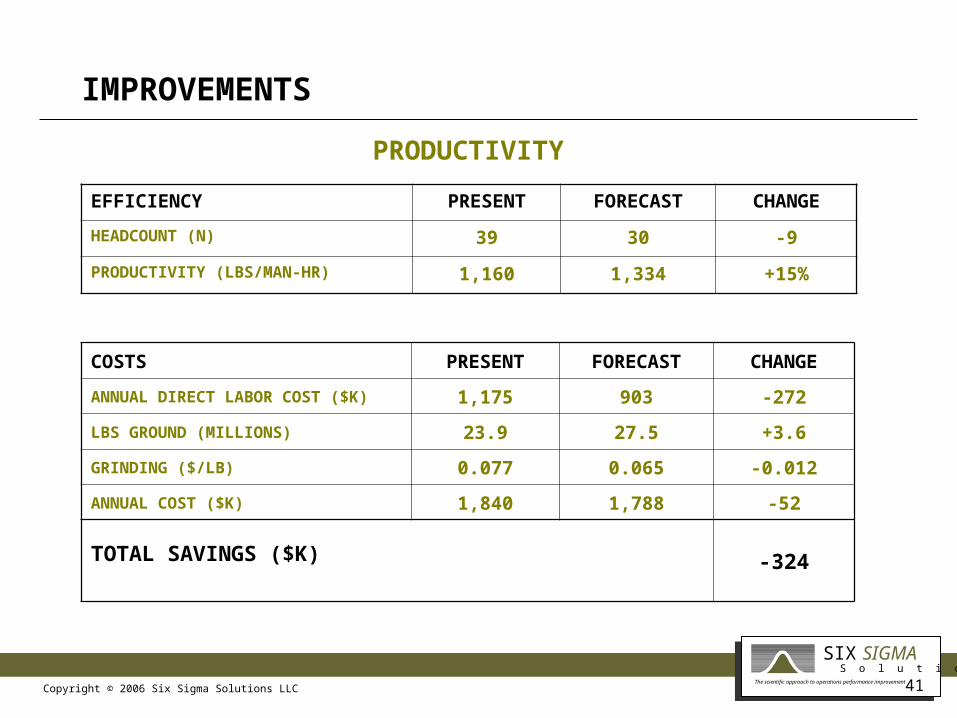
IMPROVEMENTS
EFFICIENCY PRESENT FORECAST CHANGE
HEADCOUNT (N) 39 30 -9
PRODUCTIVITY (LBS/MAN-HR) 1,160 1,334 +15%
COSTS PRESENT FORECAST CHANGE
ANNUAL DIRECT LABOR COST ($K) 1,175 903 -272
LBS GROUND (MILLIONS) 23.9 27.5 +3.6
GRINDING ($/LB) 0.077 0.065 -0.012
ANNUAL COST ($K) 1,840 1,788 -52
TOTAL SAVINGS ($K) -324
PRODUCTIVITY

Copyright © 2006 Six Sigma Solutions LLCThe scientific approach to operations performance improvement
SIGMAS o l u t i o n s
SIX
42
.
PLANT 5
Improve scheduling (melt-mold-core making-finishing-shipping-outside vendor) systems and logistics to improve material flow, reduce lead time (receipt order-to-ship) and improve on-time delivery to customers

Copyright © 2006 Six Sigma Solutions LLCThe scientific approach to operations performance improvement
SIGMAS o l u t i o n s
SIX
43
SUMMARY
Value Streamed “Order - To - Cash” Identified Process Breakdowns Identified Corrective Actions ABC’d Cores By Priority (Cost & Complexity)
Recommended Formal Cycle Counting Program Recommended Samples Included As Part Of Master Schedule Formalized Plan To Realize Inventory Accuracy Goals
Copyright © 2006 Six Sigma Solutions LLCThe scientific approach to operations performance improvement
SIGMAS o l u t i o n s
SIX
44
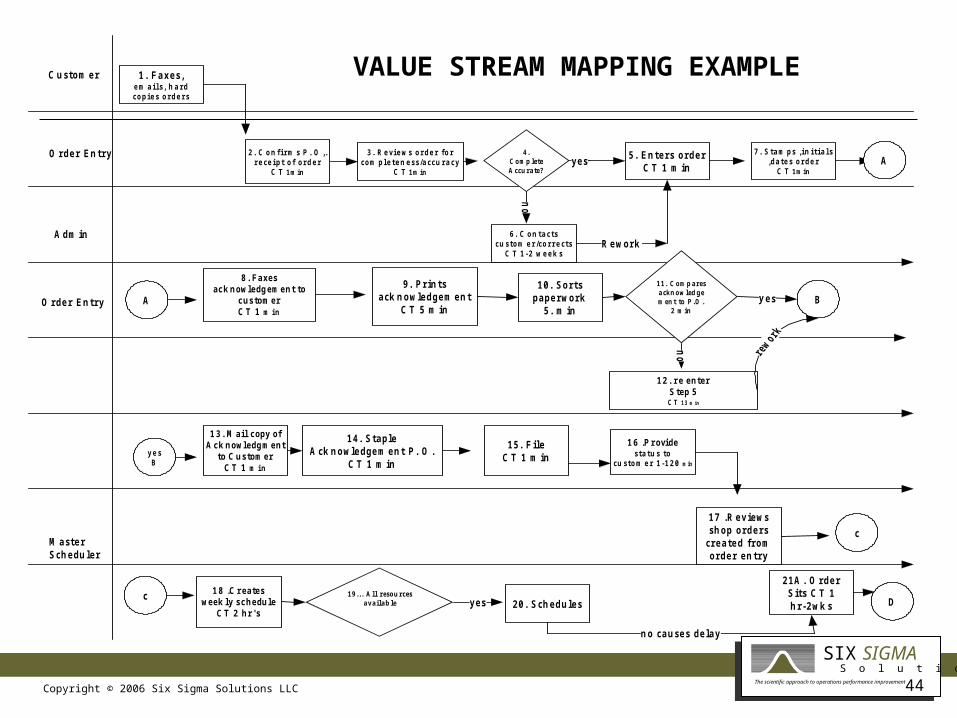
C u s to m e r 1 . Fa x e s ,e m a i l s , h a r dc o p i e s o r d e r s
2 . C o n f i r m s P . O ,.r e c e i p t o f o r d e r
C T 1m in
O rde r En try 3 . R e vi e w s o r d e r f o rc o m p l e te n e s s /a c c u r a c y
C T 1m in
4 .C om p leteA ccu rate?
y e s5 . En te rs o rde r
C T 1 m in
no
6 . C o n t a c t sc u s to m e r /c o r r e c t s
C T 1 -2 w e e k s
A dm inR e wo rk
7 . S ta m p s , i n i t i a l s,d a te s o r d e r
C T 1m inA
O rde r En try A
8 . Faxe sac k n owle dg e m e n t to
c u s tom e rC T 1 m i n
9 . Prin t sa ck n o wle dg e m e n t
C T 5 m in
1 0 . S o rtspa pe rwo rk
5 . m in
11 . C om p aresackn ow led gem en t to P .O .
2 m inB
no
1 2 . r e e n te rS te p 5C T 1 3 m in
y e sB
1 3 . M ai l c opy ofA c k n owle dg m e n t
to C u s tom e rC T 1 m i n
1 4 . S ta pleA ck n o wle dg e m e n t P . O .
C T 1 m in
1 5 . F ileC T 1 m in
1 6 .P r ovides ta tu s t o
c u s to m e r 1 -1 2 0 m in
M a s te rS ch e du le r
1 7 .R e v ie wss h o p o rde rs
cre a te d f ro mo rde r e n try
c 1 8 .C r e ate swe e k ly s c h e du le
C T 2 h r ' s
19 . . . A ll resou rcesava ilab le y e s 2 0 . S ch e du le s
2 1 A . O rde rS it s C T 1h r-2 wk s
n o ca u s e s de la y
D
c
VALUE STREAM MAPPING EXAMPLE

Copyright © 2006 Six Sigma Solutions LLCThe scientific approach to operations performance improvement
SIGMAS o l u t i o n s
SIX
45
STEP #3 - IDENTIFICATION OF PROCESS BREAKDOWNS EXAMPLE
Wrong Pricing (Customer Documentation / Old Pricing) Wrong Delivery Dates Incorrect Revision Level
No Set Up Charge Wrong Quantities Wrong Shipping Address
Copyright © 2006 Six Sigma Solutions LLCThe scientific approach to operations performance improvement
SIGMAS o l u t i o n s
SIX
46
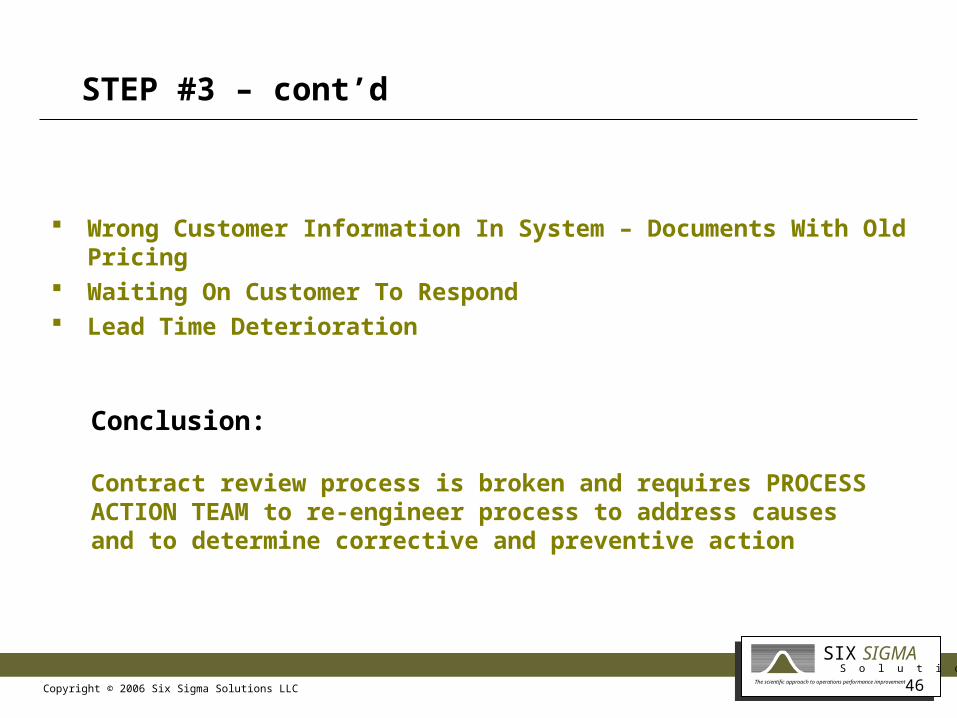
STEP #3 – cont’d
Wrong Customer Information In System – Documents With Old Pricing Waiting On Customer To Respond Lead Time Deterioration
Conclusion:
Contract review process is broken and requires PROCESS ACTION TEAM to re-engineer process to address causes and to determine corrective and preventive action

Copyright © 2006 Six Sigma Solutions LLCThe scientific approach to operations performance improvement
SIGMAS o l u t i o n s
SIX
47
PLANT 5
Improve productivity and through-put in core making operations to reduce costs and improve scheduling logistics for molding operations
Copyright © 2006 Six Sigma Solutions LLCThe scientific approach to operations performance improvement
SIGMAS o l u t i o n s
SIX
48
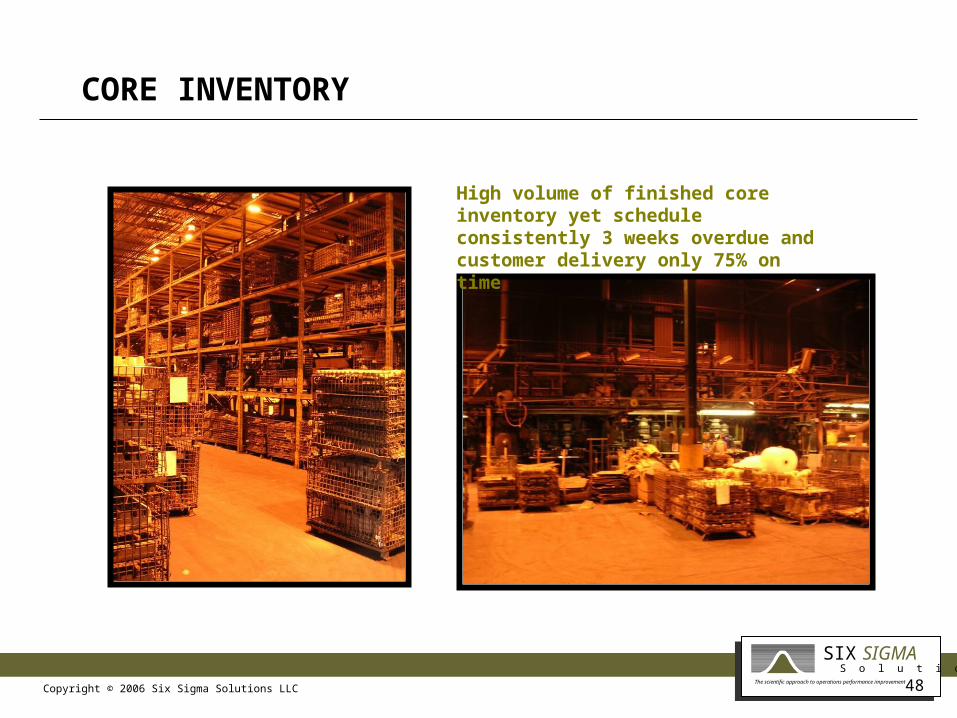
CORE INVENTORY
High volume of finished core inventory yet schedule consistently 3 weeks overdue and customer delivery only 75% on time

Copyright © 2006 Six Sigma Solutions LLCThe scientific approach to operations performance improvement
SIGMAS o l u t i o n s
SIX
49
IMPROVEMENTS
SAVINGS % SAVINGS %
PRE-STAGE TOOLING 3 OPERATIONS 6
PRIORITIZING JOBS 2 IMPROVED YIELD 3
START UP PROCESS 3
GOALS & METRICS 2 FASTER SET UP 3
TOTAL SETUP 10 TOTAL CYCLE TIME 12
Through Value Stream Mapping, set up time was reduced by 10% and cycle time was reduced by 12% for a total saving of $372K.
SPEED
Copyright © 2006 Six Sigma Solutions LLCThe scientific approach to operations performance improvement
SIGMAS o l u t i o n s
SIX
50
PLANT 5
Create process improvement – scrap rate reduction methodology/team to reduce in-house scrap rate and customer returns
Copyright © 2006 Six Sigma Solutions LLCThe scientific approach to operations performance improvement
SIGMAS o l u t i o n s
SIX
51
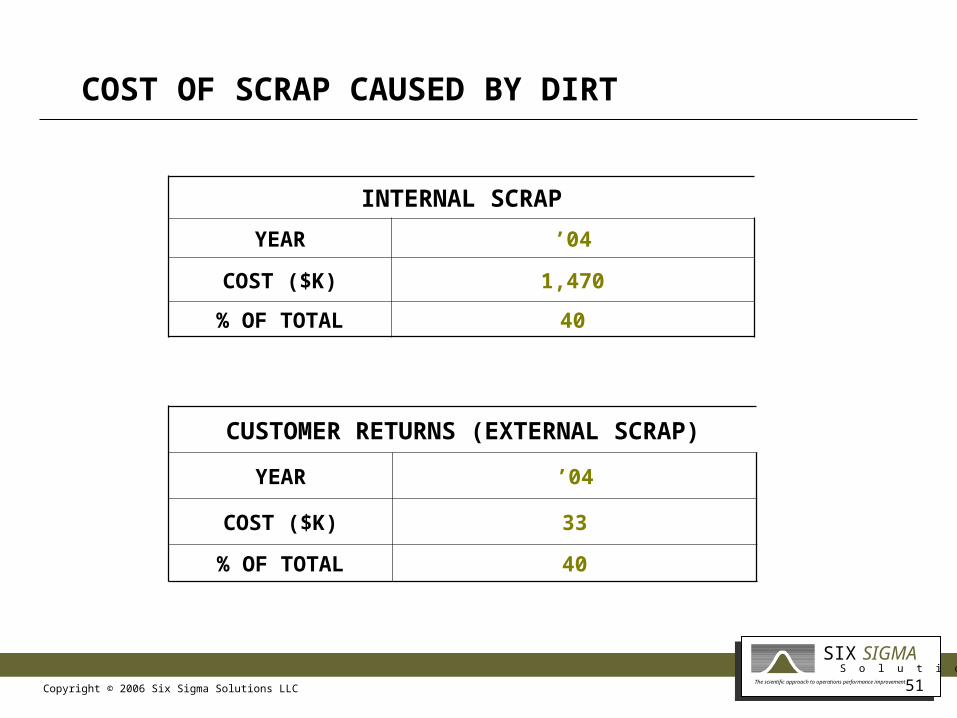
COST OF SCRAP CAUSED BY DIRT
INTERNAL SCRAP
YEAR ’04
COST ($K) 1,470
% OF TOTAL 40
CUSTOMER RETURNS (EXTERNAL SCRAP)
YEAR ’04
COST ($K) 33
% OF TOTAL 40

Copyright © 2006 Six Sigma Solutions LLCThe scientific approach to operations performance improvement
SIGMAS o l u t i o n s
SIX
52
SCRAP REDUCTION METHODOLOGY TRAINING
Pareto AnalysisSet priorities & ensure efficient use of resources
Fishbone Identify root cause
Action Plan (PAT – Process Action Teams)Identify, re-engineer processes & take corrective action
Line GraphMeasure effectiveness
ImplementAccountability & management
review
Copyright © 2006 Six Sigma Solutions LLCThe scientific approach to operations performance improvement
SIGMAS o l u t i o n s
SIX
53
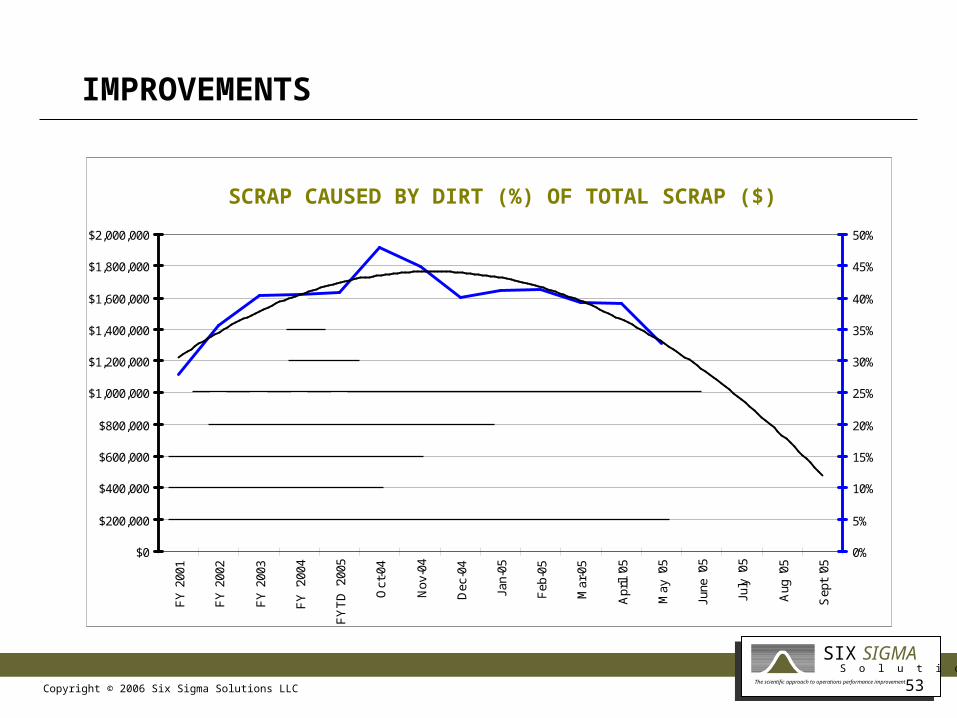
IMPROVEMENTS
SCRAP CAUSED BY DIRT (%) OF TOTAL SCRAP ($)
$0
$200,000
$400,000
$600,000
$800,000
$1,000,000
$1,200,000
$1,400,000
$1,600,000
$1,800,000
$2,000,000
FY
200
1
FY
200
2
FY
200
3
FY
'200
4
FY
TD
'200
5
Oct
-04
Nov
-04
Dec
-04
Jan-
05
Feb
-05
Mar
-05
Apr
il '0
5
May
'05
June
'05
July
'05
Aug
'05
Sep
t '0
5
0%
5%
10%
15%
20%
25%
30%
35%
40%
45%
50%
SCRAP CAUSED BY DIRT (%) OF TOTAL SCRAP ($)
Copyright © 2006 Six Sigma Solutions LLCThe scientific approach to operations performance improvement
SIGMAS o l u t i o n s
SIX
54
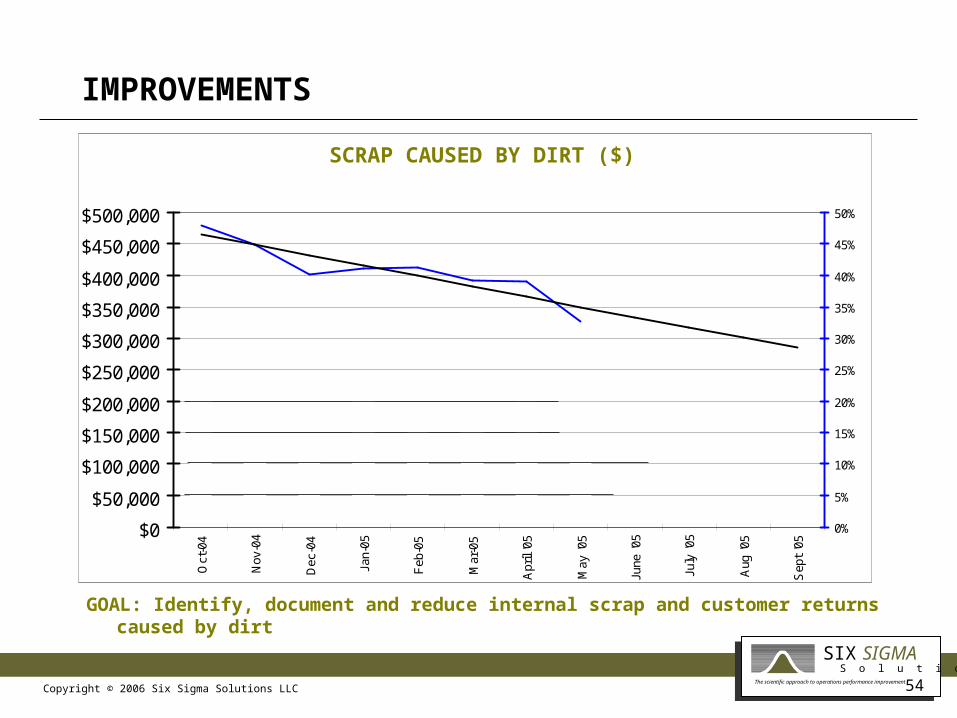
IMPROVEMENTS
GOAL: Identify, document and reduce internal scrap and customer returns caused by dirt
SCRAP CAUSED BY DIRT ($)
$0
$50,000
$100,000
$150,000
$200,000
$250,000
$300,000
$350,000
$400,000
$450,000
$500,000O
ct-0
4
Nov
-04
Dec
-04
Jan-
05
Feb
-05
Mar
-05
Apr
il '0
5
May
'05
June
'05
July
'05
Aug
'05
Sep
t '0
5
0%
5%
10%
15%
20%
25%
30%
35%
40%
45%
50%
SCRAP CAUSED BY DIRT ($)
Copyright © 2006 Six Sigma Solutions LLCThe scientific approach to operations performance improvement
SIGMAS o l u t i o n s
SIX
55
PLANT 5
Implement line-of-sight visual management techniques
Copyright © 2006 Six Sigma Solutions LLCThe scientific approach to operations performance improvement
SIGMAS o l u t i o n s
SIX
56
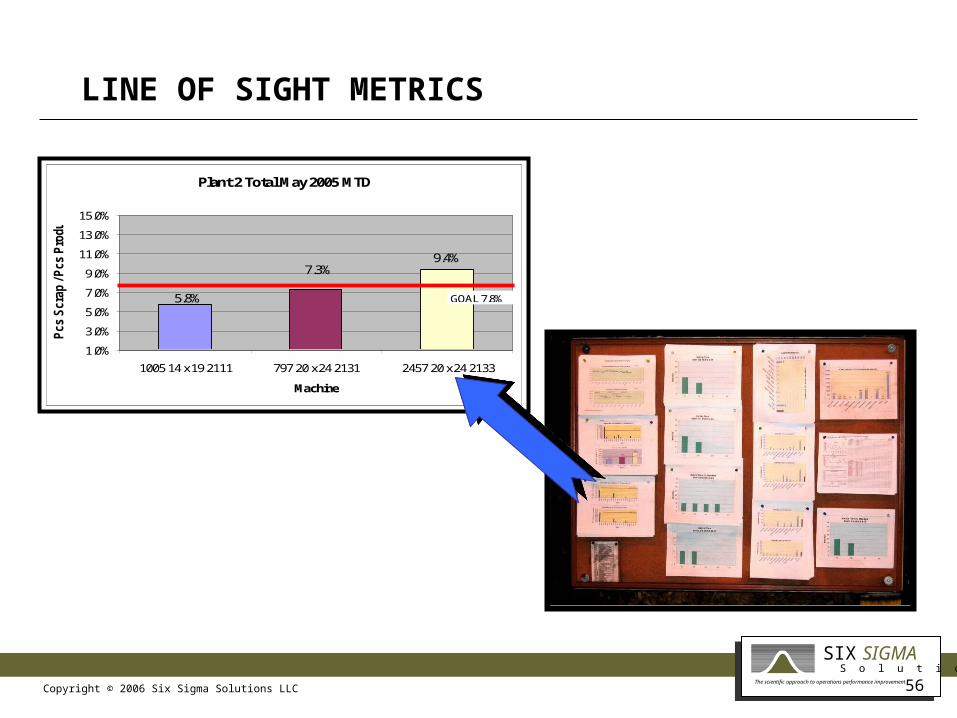
LINE OF SIGHT METRICS
Plant 2 Total May 2005 MTD
9.4%7.3%
5.8%
1.0%
3.0%
5.0%
7.0%
9.0%
11.0%
13.0%
15.0%
1005 14 x 19 2111 797 20 x 24 2131 2457 20 x 24 2133
Machine
Pcs S
cra
p /
Pcs P
roduced
GOAL 7.8%
Copyright © 2006 Six Sigma Solutions LLCThe scientific approach to operations performance improvement
SIGMAS o l u t i o n s
SIX
57
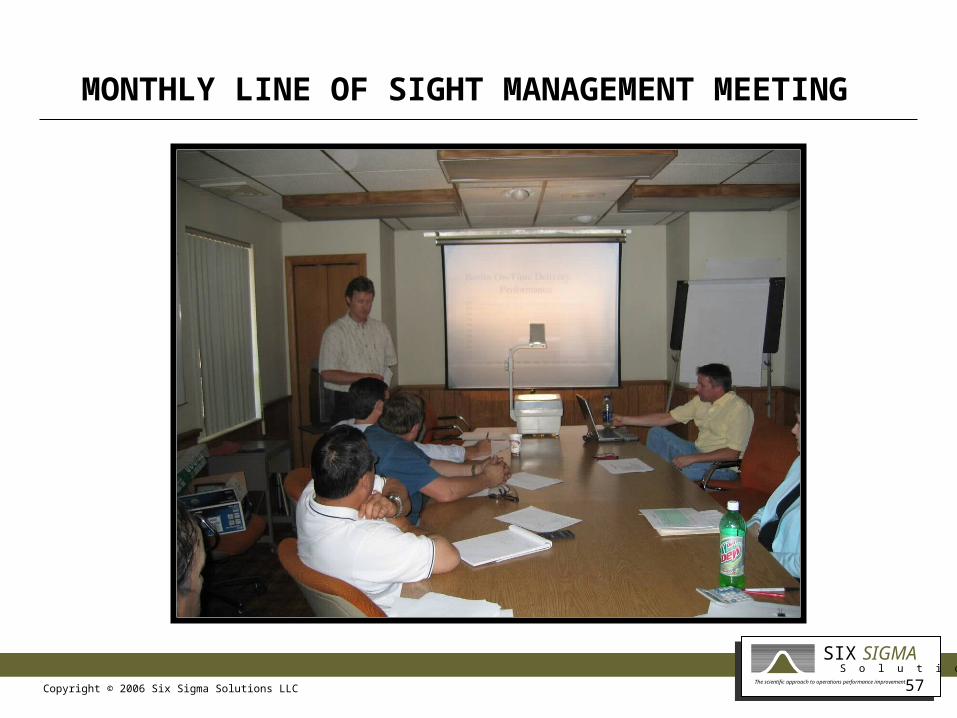
MONTHLY LINE OF SIGHT MANAGEMENT MEETING

Copyright © 2006 Six Sigma Solutions LLCThe scientific approach to operations performance improvement
SIGMAS o l u t i o n s
SIX
58
IMPROVEMENTS
IMPROVEMENT ACTION
REDUCED INTERNAL SCRAPTrained Six Sigma tools & creation of Process Action Teams who focused on dirt
BETTER ON TIME DELIVERYEliminated process breakdowns identified in “Order-to-Cash” process map
HIGHER CORE ROOM INVENTORY ACCURACY
Implemented cycle count program
LOWER CUSTOMER RETURNSTraining Six Sigma tools & creation of Process Action Teams who focused on dirt
Copyright © 2006 Six Sigma Solutions LLCThe scientific approach to operations performance improvement
SIGMAS o l u t i o n s
SIX
59
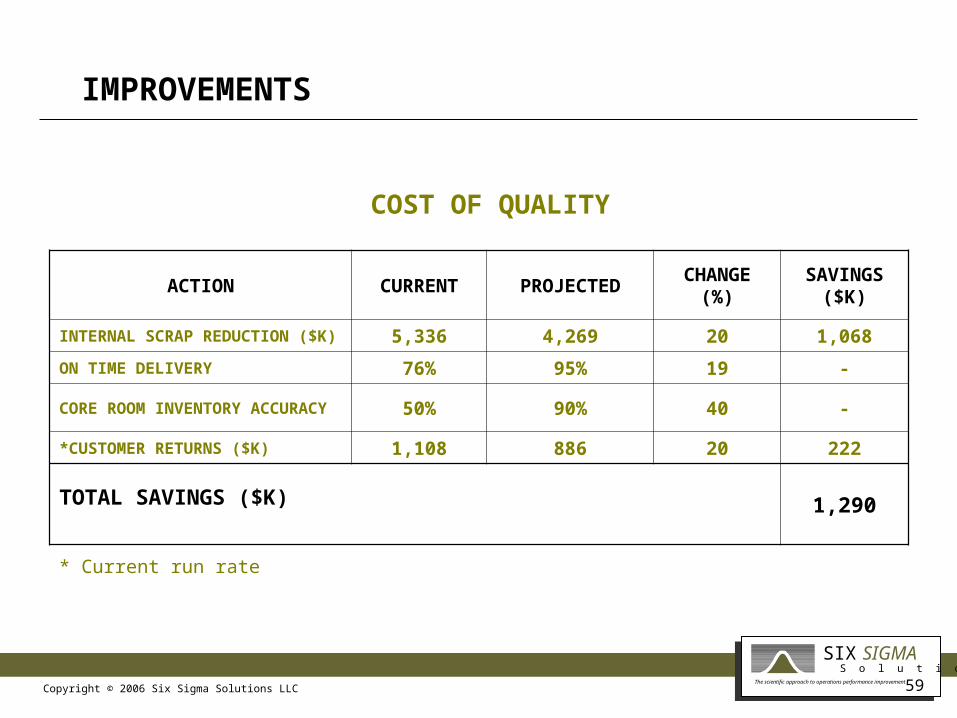
ACTION CURRENT PROJECTEDCHANGE
(%)SAVINGS
($K)
INTERNAL SCRAP REDUCTION ($K) 5,336 4,269 20 1,068
ON TIME DELIVERY 76% 95% 19 -
CORE ROOM INVENTORY ACCURACY 50% 90% 40 -
*CUSTOMER RETURNS ($K) 1,108 886 20 222
TOTAL SAVINGS ($K) 1,290
IMPROVEMENTS
* Current run rate
COST OF QUALITY
Copyright © 2006 Six Sigma Solutions LLCThe scientific approach to operations performance improvement
SIGMAS o l u t i o n s
SIX
60
BIOS cont’d
Carl has a Master Lean Certificate, a Six Sigma - Master Black Belt Certificate and a Six Sigma - Green Belt Certificate from Villanova University, PA.
He earned his Bachelor of Science Degree in Technical Business from Athens State College, Alabama. He also has a Machine Shop and Tool and Die Certificate from John C. Calhoun State Community College, Alabama and a CNC Machine Technology Certificate from Drake Community College, Alabama.
As Vice President for MTSI in Huntsville, AL he grew the firm’s revenues from $1 million to $6.6 million in four years by meeting tough defense contract specifications and exceeded expectations by winning contracts for programs such as Bell Helicopter: 609 Program Tooling, PPG Bombardier: Aircraft Windshields Design and Modeling, and General Motors: Saturn Manufacturing Tooling. He also led hardware implementations for Operations Support and Engineering Personnel for the International Space Station.
On behalf of Vought Aircraft Industries, Carl served as a Member of their Corrective Action Board to implement Lean Manufacturing for key programs such as Airbus, Gulfstream GIV, GV Wing Assembly and the revolutionary V22 Osprey. This resulted in reduced costs, improved quality, retention and extensions of various defense and commercial contracts.
CARL E. WATSON Jr.
Copyright © 2006 Six Sigma Solutions LLCThe scientific approach to operations performance improvement
SIGMAS o l u t i o n s
SIX
61
BIOS cont’d
At GKN Aerospace Services, he worked with Industrial Engineering Estimating and Lean Manufacturing Optimization where he helped them retain and win new defense and commercial contracts by developing highly efficient methods of manufacturing.
At Pratt and Whitney, he was the Lead Senior Manufacturing Engineer in the Advanced Systems Division where he worked on the Advanced Cruise Missile and the Tomahawk Cruise Missile. He was also a member of their Material Review Board for Manufacturing and as SPC Team Captain, he conducted statistical process control training classes and wrote SPC procedural policies for their operations personnel to improve the quality and efficiency of their manufacturing operations.
During work on various defense contracts, he completed a Government Compliance Seminar, Federal Acquisition Regulation and Total Quality Management training.
CARL E. WATSON Jr. cont’d
Copyright © 2006 Six Sigma Solutions LLCThe scientific approach to operations performance improvement
SIGMAS o l u t i o n s
SIX
62
CONTACT US
PARTNERS
Carl E. Watson Jr. BSc, Master Lean, Six Sigma Master Black Belt
Cell: 256-337-9811
OFFICE
PO Box 3375
Hunstville
AL 35810
http://www.sixsigmasolutionsllc.com
Copyright © 2006 Six Sigma Solutions LLCThe scientific approach to operations performance improvement
SIGMAS o l u t i o n s
SIX
63
END