Embed Size (px)
Citation preview
Copyright © 2005 Pearson Education, Inc. publishing as Benjamin Cummings
– POPULATION ECOLOGY
Copyright © 2005 Pearson Education, Inc. publishing as Benjamin Cummings
Overview: Earth’s Fluctuating Populations
• To understand human population growth, we must consider general principles of population ecology
Copyright © 2005 Pearson Education, Inc. publishing as Benjamin Cummings
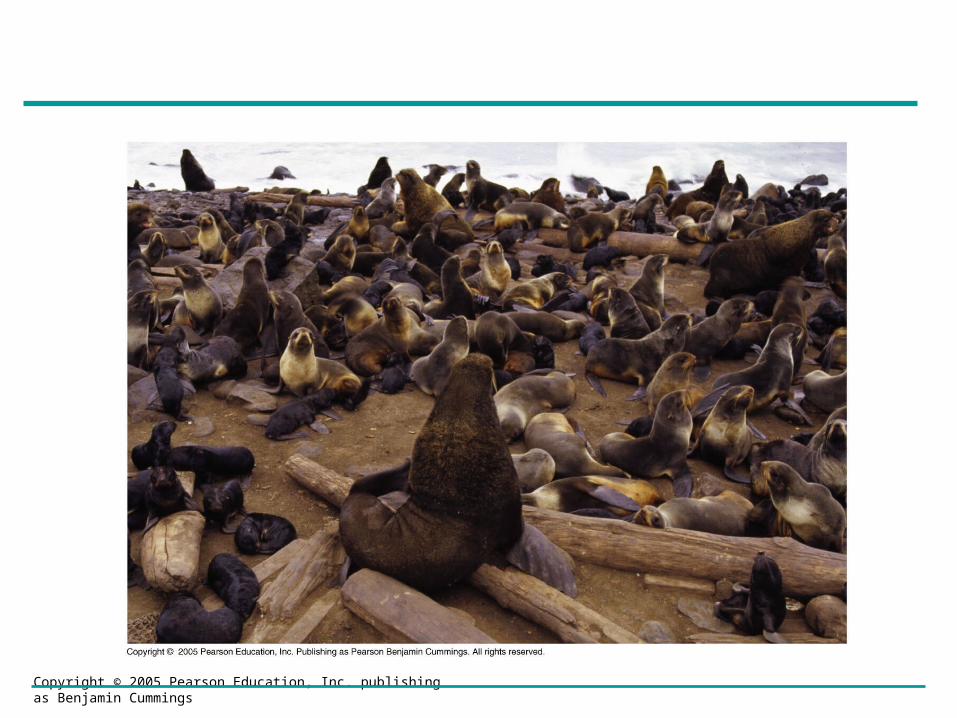
• Population ecology is the study of populations in relation to environment, including environmental influences on density and distribution, age structure, and population size
• The fur seal population of St. Paul Island, off the coast of Alaska, has experienced dramatic fluctuations in size
Copyright © 2005 Pearson Education, Inc. publishing as Benjamin Cummings

Copyright © 2005 Pearson Education, Inc. publishing as Benjamin Cummings
Concept 52.1: Dynamic biological processes influence population density, dispersion, and demography
• A population is a group of individuals of a single species living in the same general area
Copyright © 2005 Pearson Education, Inc. publishing as Benjamin Cummings
Density and Dispersion
• Density is the number of individuals per unit area or volume
• Dispersion is the pattern of spacing among individuals within the boundaries of the population
Copyright © 2005 Pearson Education, Inc. publishing as Benjamin Cummings
Density: A Dynamic Perspective
• Determining the density of natural populations is difficult
• In most cases, it is impractical or impossible to count all individuals in a population
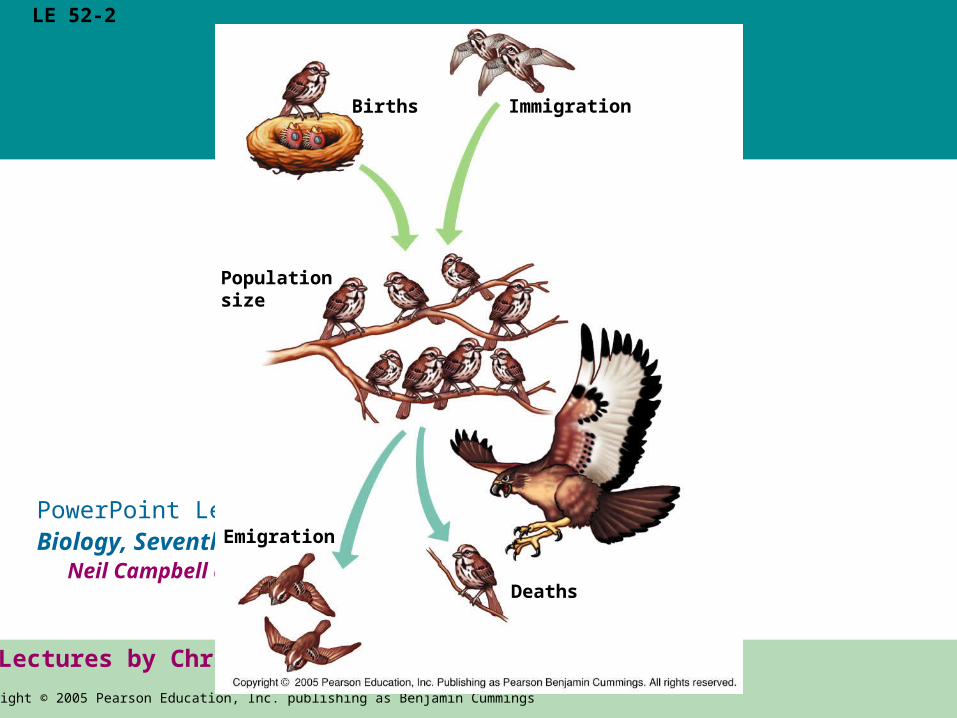
• Density is the result of an interplay between processes that add individuals to a population and those that remove individuals
Copyright © 2005 Pearson Education, Inc. publishing as Benjamin CummingsCopyright © 2005 Pearson Education, Inc. publishing as Benjamin Cummings
PowerPoint Lectures for Biology, Seventh Edition
Neil Campbell and Jane Reece
Lectures by Chris Romero
LE 52-2
Populationsize
Emigration
Deaths
ImmigrationBirths
Copyright © 2005 Pearson Education, Inc. publishing as Benjamin Cummings
Patterns of Dispersion
• Environmental and social factors influence spacing of individuals in a population
Copyright © 2005 Pearson Education, Inc. publishing as Benjamin Cummings
• In a clumped dispersion, individuals aggregate in patches
• A clumped dispersion may be influenced by resource availability and behavior
Video: Flapping Geese (clumped)

Copyright © 2005 Pearson Education, Inc. publishing as Benjamin CummingsCopyright © 2005 Pearson Education, Inc. publishing as Benjamin Cummings
PowerPoint Lectures for Biology, Seventh Edition
Neil Campbell and Jane Reece
Lectures by Chris Romero
LE 52-3a
Clumped. For many animals, such as these wolves, living in groups increases the effectiveness of hunting, spreads the work of protecting and caring for young, and helps exclude other individuals from their territory.
Copyright © 2005 Pearson Education, Inc. publishing as Benjamin Cummings
• A uniform dispersion is one in which individuals are evenly distributed
• It may be influenced by social interactions such as territoriality
Video: Albatross Courtship (uniform)

Copyright © 2005 Pearson Education, Inc. publishing as Benjamin CummingsCopyright © 2005 Pearson Education, Inc. publishing as Benjamin Cummings
PowerPoint Lectures for Biology, Seventh Edition
Neil Campbell and Jane Reece
Lectures by Chris Romero
LE 52-3b
Uniform. Birds nesting on small islands, such as these king penguins on South Georgia Island in the South Atlantic Ocean, often exhibit uniform spacing, maintained by aggressive interactions between neighbors.
Copyright © 2005 Pearson Education, Inc. publishing as Benjamin Cummings
• In a random dispersion, the position of each individual is independent of other individuals
Video: Prokaryotic Flagella (Salmonella typhimurium) (random)

Copyright © 2005 Pearson Education, Inc. publishing as Benjamin CummingsCopyright © 2005 Pearson Education, Inc. publishing as Benjamin Cummings
PowerPoint Lectures for Biology, Seventh Edition
Neil Campbell and Jane Reece
Lectures by Chris Romero
LE 52-3c
Random. Dandelions grow from windblown seeds that land at random and later germinate.

Copyright © 2005 Pearson Education, Inc. publishing as Benjamin Cummings
Demography
• Demography is the study of the vital statistics of a population and how they change over time
• Death rates and birth rates are of particular interest to demographers

Copyright © 2005 Pearson Education, Inc. publishing as Benjamin Cummings
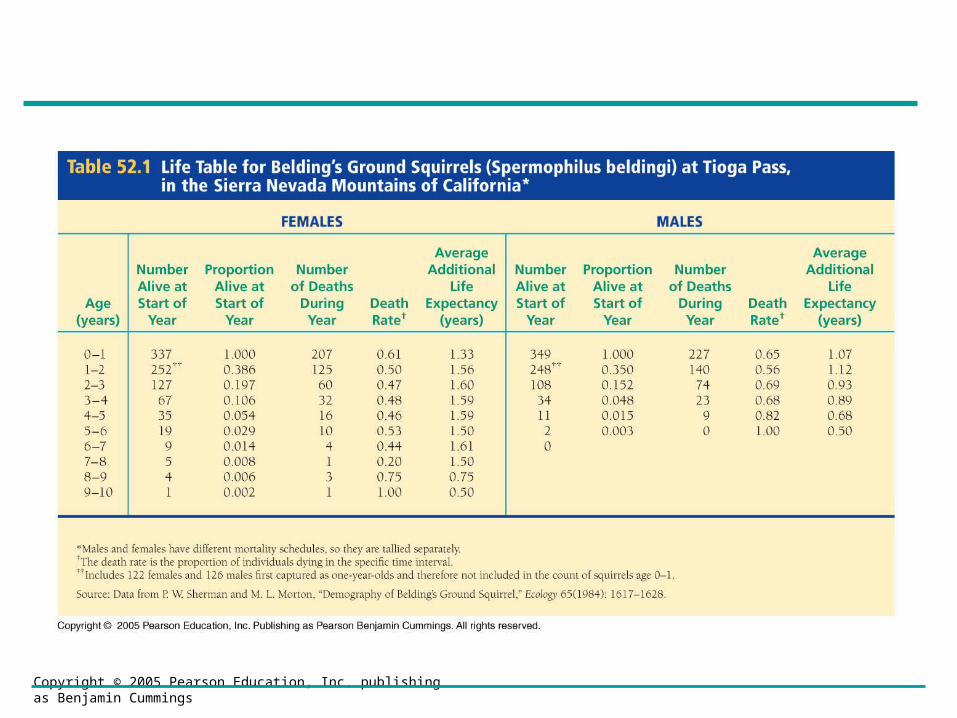
Life Tables
• A life table is an age-specific summary of the survival pattern of a population
• It is best made by following the fate of a cohort
• The life table of Belding’s ground squirrels reveals many things about this population
Copyright © 2005 Pearson Education, Inc. publishing as Benjamin Cummings
Copyright © 2005 Pearson Education, Inc. publishing as Benjamin Cummings
Survivorship Curves
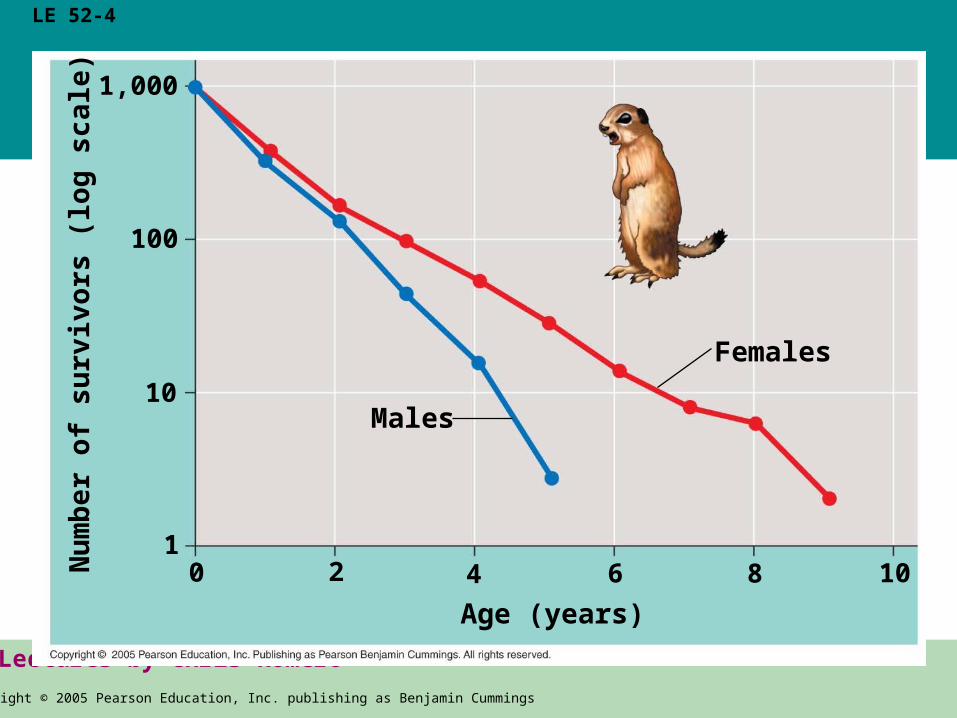
• A survivorship curve is a graphic way of representing the data in a life table
• The survivorship curve for Belding’s ground squirrels shows a relatively constant death rate
Copyright © 2005 Pearson Education, Inc. publishing as Benjamin CummingsCopyright © 2005 Pearson Education, Inc. publishing as Benjamin Cummings
PowerPoint Lectures for Biology, Seventh Edition
Neil Campbell and Jane Reece
Lectures by Chris Romero
LE 52-4
Males
Females
10
Age (years)
Nu
mb
er o
f su
rviv
ors
(lo
g s
cale
)
4 6 80 2
1,000
100
10
1
Copyright © 2005 Pearson Education, Inc. publishing as Benjamin Cummings
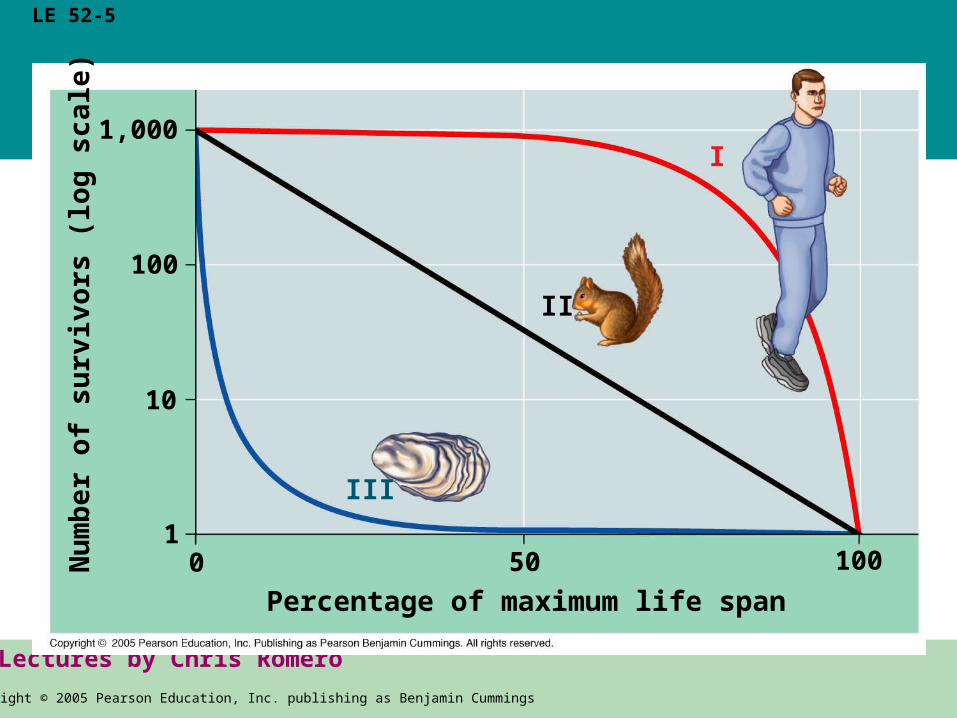
• Survivorship curves can be classified into three general types: Type I, Type II, and Type III
Copyright © 2005 Pearson Education, Inc. publishing as Benjamin CummingsCopyright © 2005 Pearson Education, Inc. publishing as Benjamin Cummings
PowerPoint Lectures for Biology, Seventh Edition
Neil Campbell and Jane Reece
Lectures by Chris Romero
LE 52-5
III
II
100
Percentage of maximum life span
Nu
mb
er o
f su
rviv
ors
(lo
g s
cale
)
0 50
1,000
100
10
1
I
Copyright © 2005 Pearson Education, Inc. publishing as Benjamin Cummings
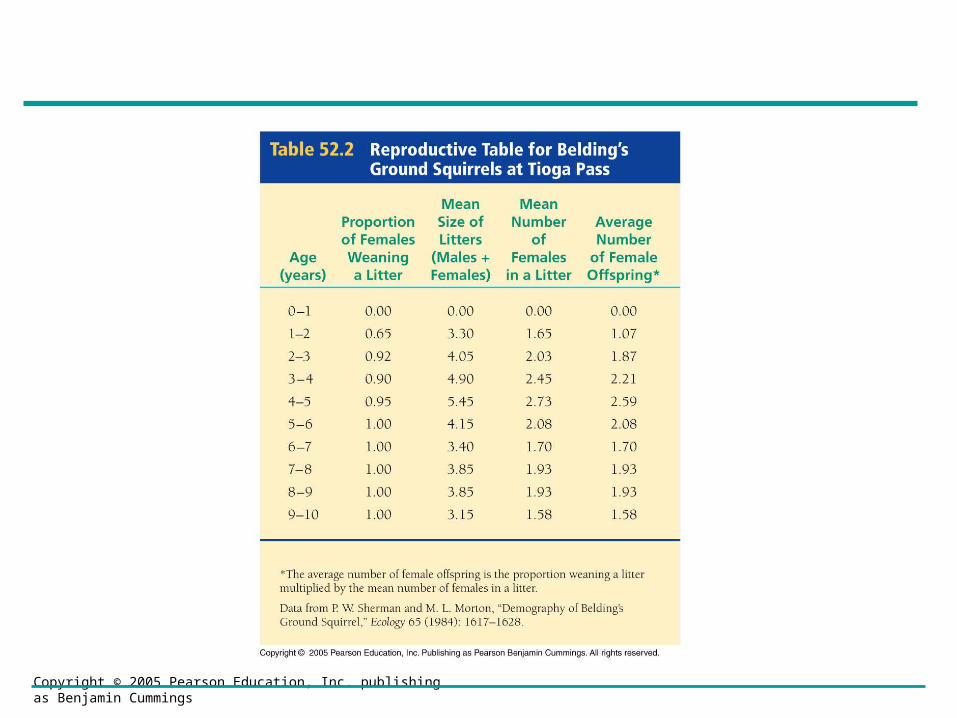
Reproductive Rates
• A reproductive table, or fertility schedule, is an age-specific summary of the reproductive rates in a population
• It describes reproductive patterns of a population
Copyright © 2005 Pearson Education, Inc. publishing as Benjamin Cummings
Copyright © 2005 Pearson Education, Inc. publishing as Benjamin Cummings
Concept 52.2: Life history traits are products of natural selection
• Life history traits are evolutionary outcomes reflected in the development, physiology, and behavior of an organism

Copyright © 2005 Pearson Education, Inc. publishing as Benjamin Cummings
Life History Diversity
• Life histories are very diverse
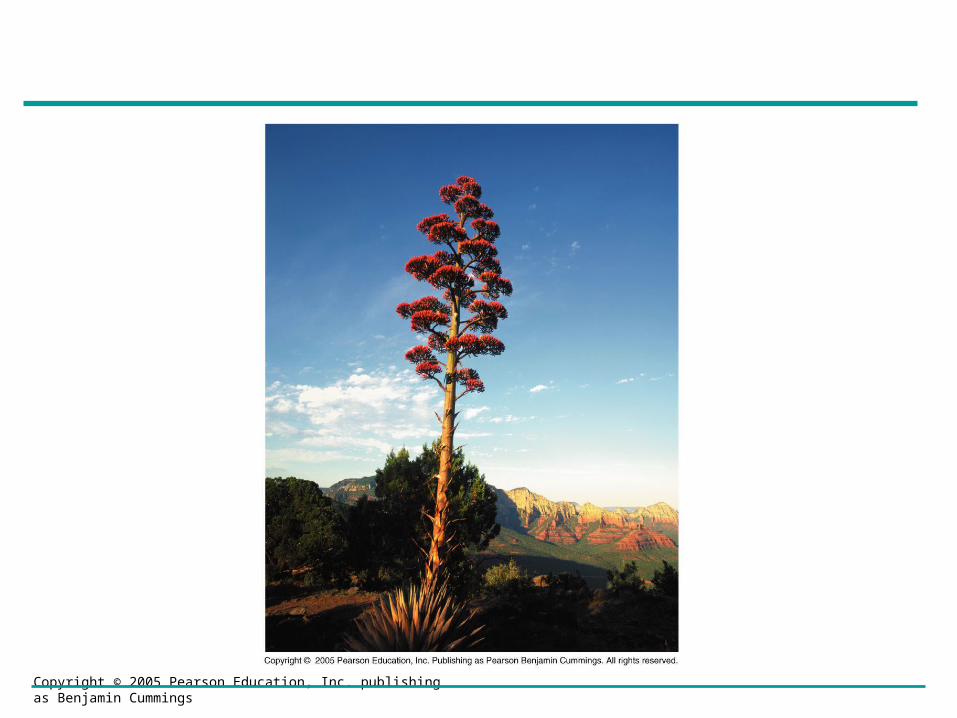
• Species that exhibit semelparity, or “big-bang” reproduction, reproduce once and die
• Species that exhibit iteroparity, or repeated reproduction, produce offspring repeatedly
Copyright © 2005 Pearson Education, Inc. publishing as Benjamin Cummings
Copyright © 2005 Pearson Education, Inc. publishing as Benjamin Cummings
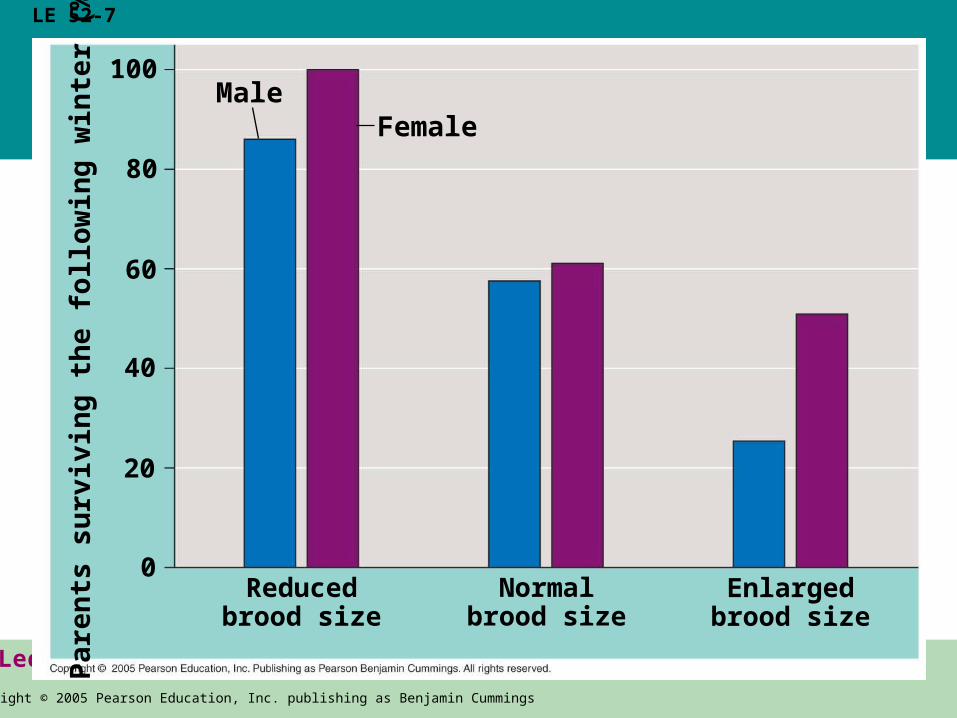
“Trade-offs” and Life Histories
• Organisms have finite resources, which may lead to trade-offs between survival and reproduction
Copyright © 2005 Pearson Education, Inc. publishing as Benjamin CummingsCopyright © 2005 Pearson Education, Inc. publishing as Benjamin Cummings
PowerPoint Lectures for Biology, Seventh Edition
Neil Campbell and Jane Reece
Lectures by Chris Romero
LE 52-7
Female
Par
ents
su
rviv
ing
th
e fo
llo
win
g w
inte
r (%
)
Normalbrood size
100
80
60
0Reduced
brood sizeEnlarged
brood size
Male
40
20

Copyright © 2005 Pearson Education, Inc. publishing as Benjamin Cummings
• Some plants produce a large number of small seeds, ensuring that at least some of them will grow and eventually reproduce

Copyright © 2005 Pearson Education, Inc. publishing as Benjamin CummingsCopyright © 2005 Pearson Education, Inc. publishing as Benjamin Cummings
PowerPoint Lectures for Biology, Seventh Edition
Neil Campbell and Jane Reece
Lectures by Chris Romero
LE 52-8a
Most weedy plants, such as this dandelion, grow quickly and produce a large number of seeds, ensuring that at least some will grow into plants and eventually produce seeds themselves.
Copyright © 2005 Pearson Education, Inc. publishing as Benjamin Cummings
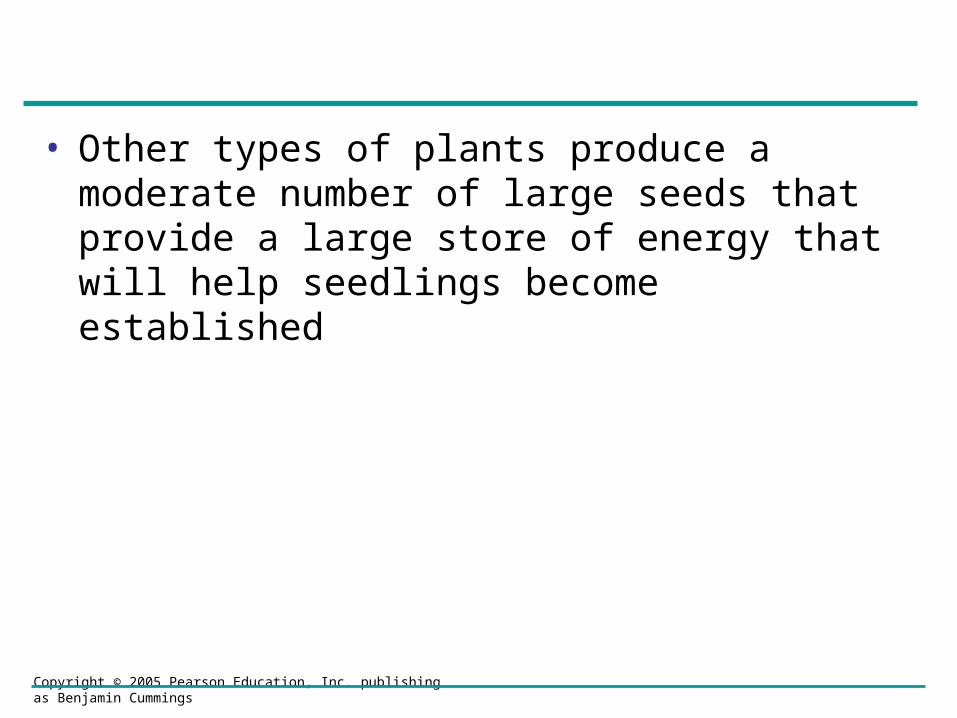
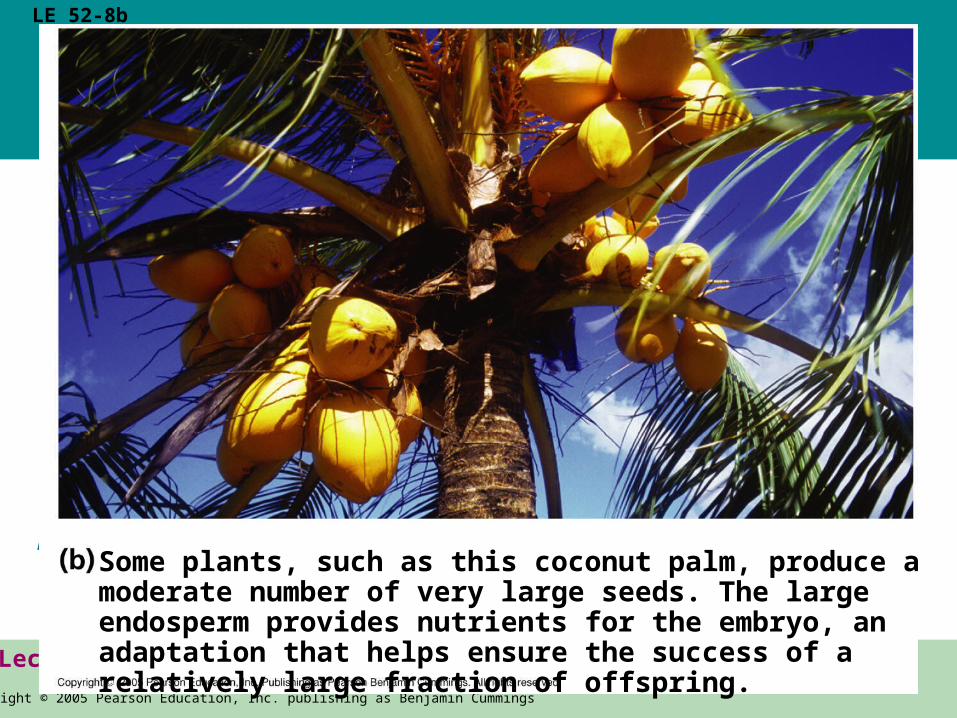
• Other types of plants produce a moderate number of large seeds that provide a large store of energy that will help seedlings become established
Copyright © 2005 Pearson Education, Inc. publishing as Benjamin CummingsCopyright © 2005 Pearson Education, Inc. publishing as Benjamin Cummings
PowerPoint Lectures for Biology, Seventh Edition
Neil Campbell and Jane Reece
Lectures by Chris Romero
LE 52-8b
Some plants, such as this coconut palm, produce a moderate number of very large seeds. The large endosperm provides nutrients for the embryo, an adaptation that helps ensure the success of a relatively large fraction of offspring.
Copyright © 2005 Pearson Education, Inc. publishing as Benjamin Cummings
• In animals, parental care of smaller broods may facilitate survival of offspring

Copyright © 2005 Pearson Education, Inc. publishing as Benjamin Cummings
Concept 52.3: The exponential model describes population growth in an idealized, unlimited environment
• It is useful to study population growth in an idealized situation
• Idealized situations help us understand the capacity of species to increase and the conditions that may facilitate this growth
Copyright © 2005 Pearson Education, Inc. publishing as Benjamin Cummings
Per Capita Rate of Increase
• If immigration and emigration are ignored, a population’s growth rate (per capita increase) equals birth rate minus death rate
Copyright © 2005 Pearson Education, Inc. publishing as Benjamin Cummings
• Zero population growth occurs when the birth rate equals the death rate
• Most ecologists use differential calculus to express population growth as growth rate at a particular instant in time:
dNdt rN
Copyright © 2005 Pearson Education, Inc. publishing as Benjamin Cummings
Exponential Growth
• Exponential population growth is population increase under idealized conditions
• Under these conditions, the rate of reproduction is at its maximum, called the intrinsic rate of increase
Copyright © 2005 Pearson Education, Inc. publishing as Benjamin Cummings
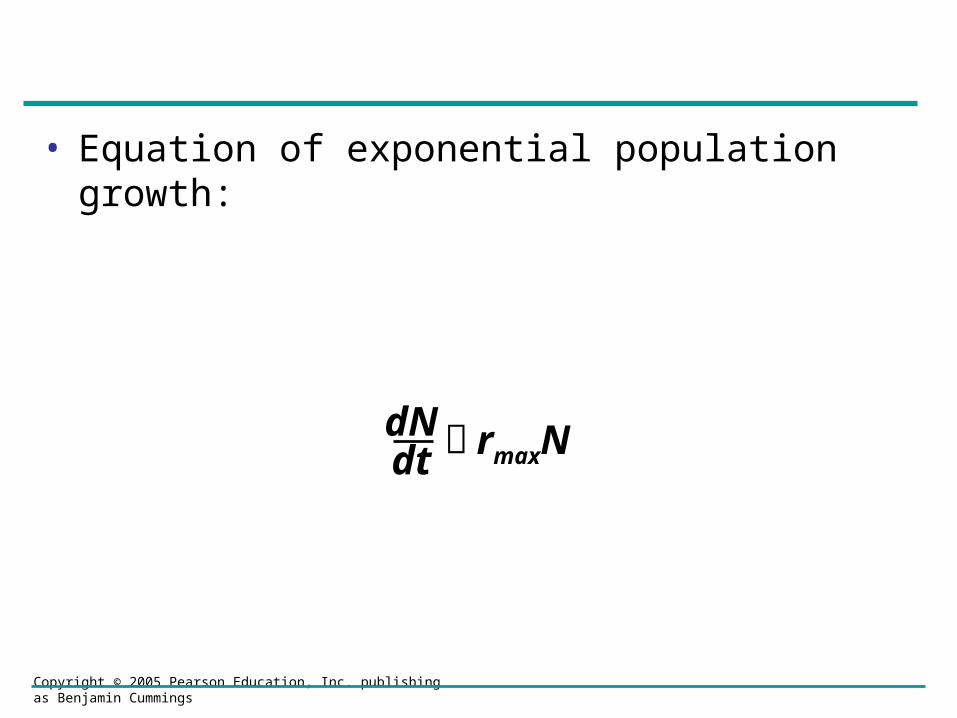
• Equation of exponential population growth:
dNdt rmaxN
Copyright © 2005 Pearson Education, Inc. publishing as Benjamin Cummings
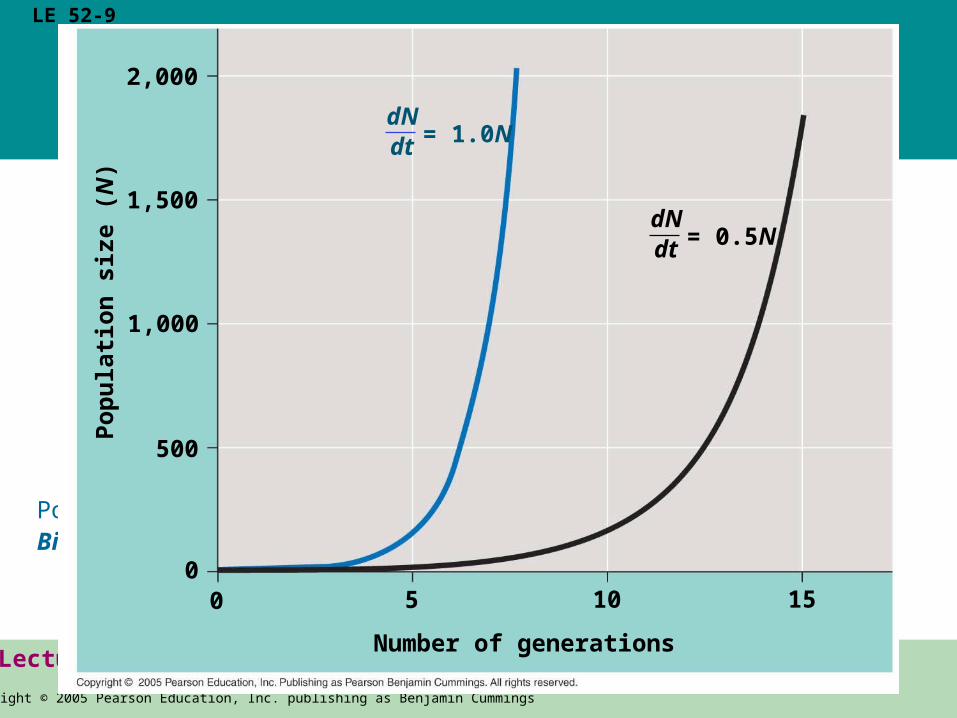
• Exponential population growth results in a J-shaped curve
Copyright © 2005 Pearson Education, Inc. publishing as Benjamin CummingsCopyright © 2005 Pearson Education, Inc. publishing as Benjamin Cummings
PowerPoint Lectures for Biology, Seventh Edition
Neil Campbell and Jane Reece
Lectures by Chris Romero
LE 52-9
Number of generations
Po
pu
lati
on
siz
e (N
)2,000
= 1.0N
1,000
1,500
500
0151050
dNdt
= 0.5NdNdt

Copyright © 2005 Pearson Education, Inc. publishing as Benjamin Cummings
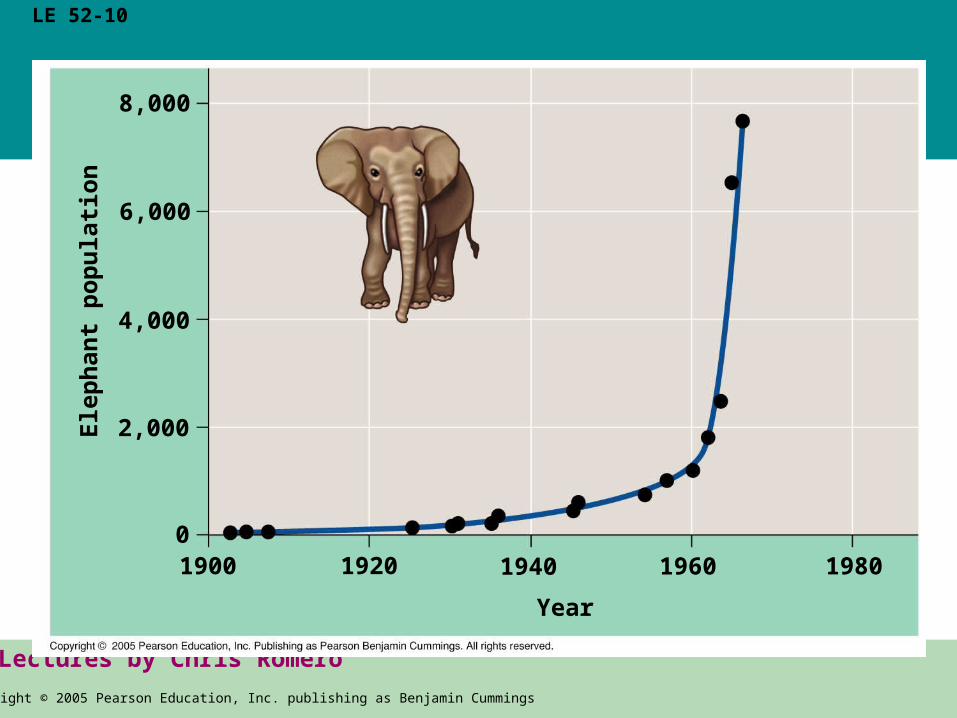
• The J-shaped curve of exponential growth characterizes some rebounding populations
Copyright © 2005 Pearson Education, Inc. publishing as Benjamin CummingsCopyright © 2005 Pearson Education, Inc. publishing as Benjamin Cummings
PowerPoint Lectures for Biology, Seventh Edition
Neil Campbell and Jane Reece
Lectures by Chris Romero
LE 52-10
Year
Ele
ph
ant
po
pu
lati
on
8,000
4,000
6,000
2,000
019801960194019201900
Copyright © 2005 Pearson Education, Inc. publishing as Benjamin Cummings
Concept 52.4: The logistic growth model includes the concept of carrying capacity
• Exponential growth cannot be sustained for long in any population
• A more realistic population model limits growth by incorporating carrying capacity
Copyright © 2005 Pearson Education, Inc. publishing as Benjamin Cummings
• Carrying capacity (K) is the maximum population size the environment can support
Copyright © 2005 Pearson Education, Inc. publishing as Benjamin Cummings
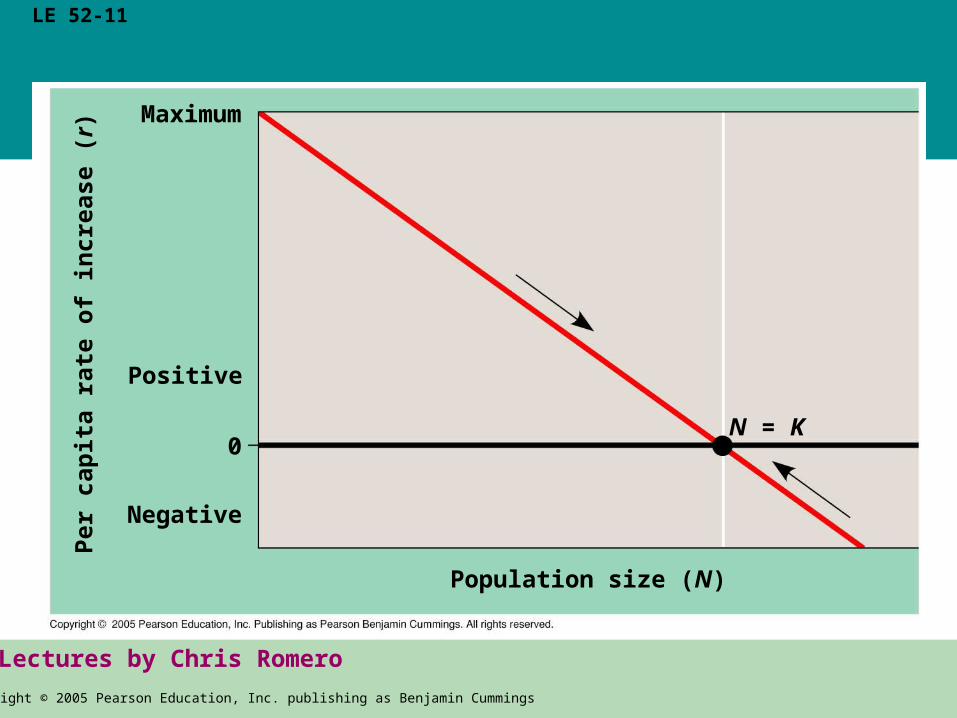
The Logistic Growth Model
• In the logistic population growth model, the per capita rate of increase declines as carrying capacity is reached
• We construct the logistic model by starting with the exponential model and adding an expression that reduces per capita rate of increase as N increases
Copyright © 2005 Pearson Education, Inc. publishing as Benjamin CummingsCopyright © 2005 Pearson Education, Inc. publishing as Benjamin Cummings
PowerPoint Lectures for Biology, Seventh Edition
Neil Campbell and Jane Reece
Lectures by Chris Romero
LE 52-11
Population size (N)
Per
cap
ita
rate
of
incr
ease
(r)
Maximum
Positive
Negative
N = K0
Copyright © 2005 Pearson Education, Inc. publishing as Benjamin Cummings
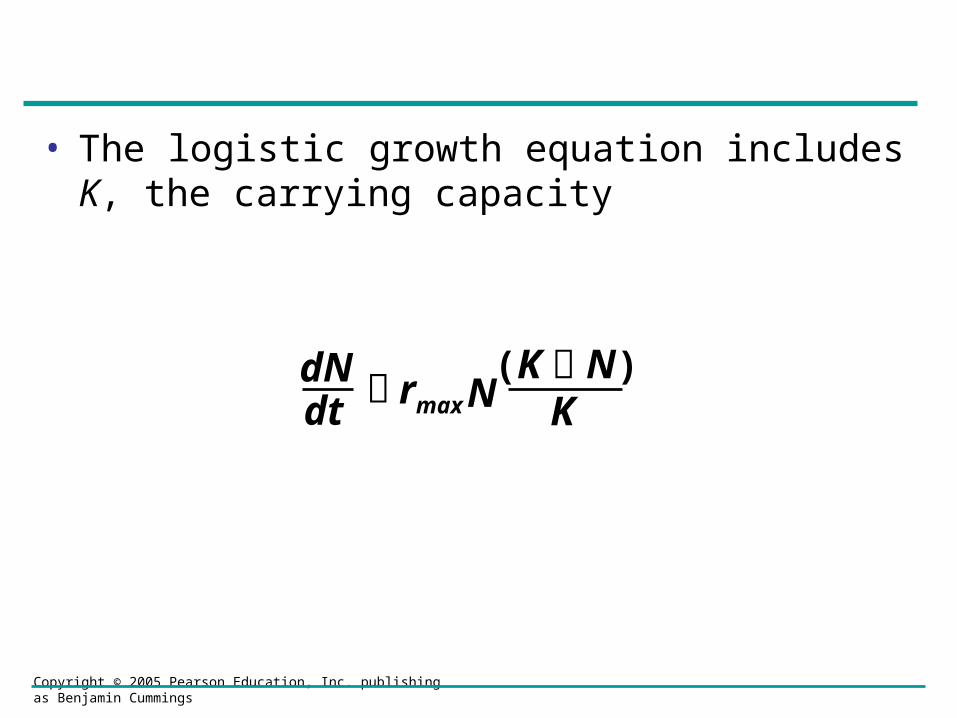
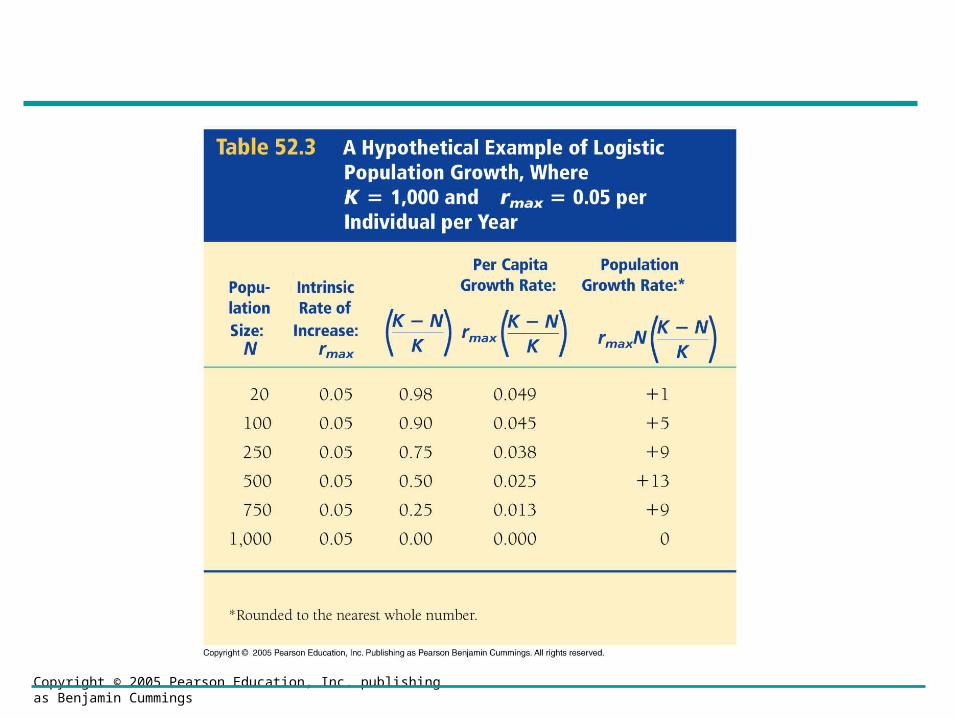
• The logistic growth equation includes K, the carrying capacity
dNdt
(K N)
Krmax N
Copyright © 2005 Pearson Education, Inc. publishing as Benjamin Cummings
Copyright © 2005 Pearson Education, Inc. publishing as Benjamin Cummings
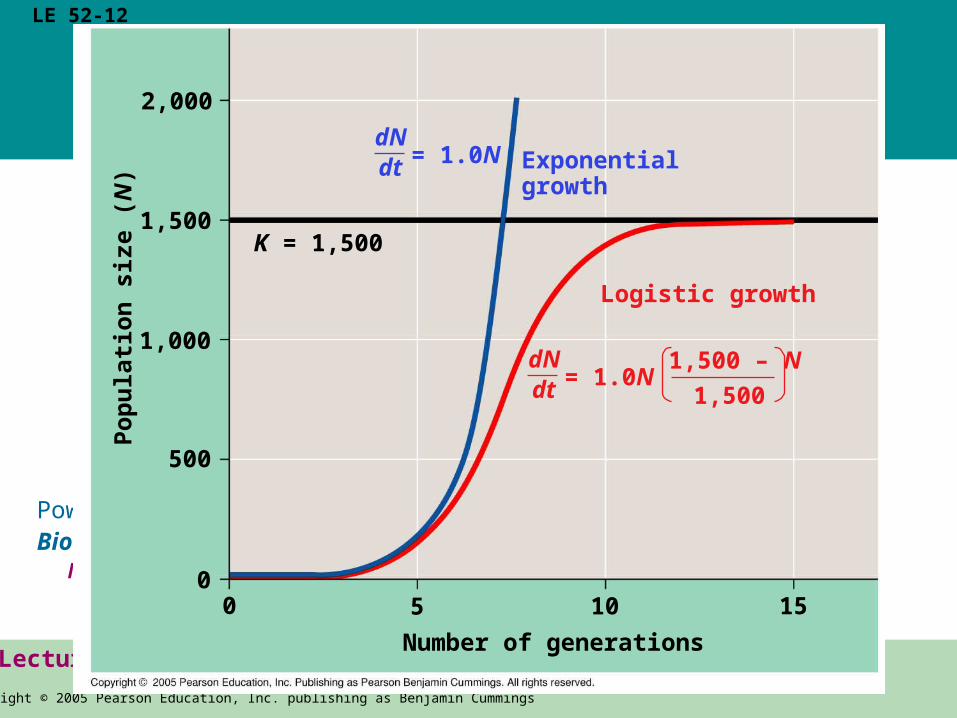
• The logistic model of population growth produces a sigmoid (S-shaped) curve
Copyright © 2005 Pearson Education, Inc. publishing as Benjamin CummingsCopyright © 2005 Pearson Education, Inc. publishing as Benjamin Cummings
PowerPoint Lectures for Biology, Seventh Edition
Neil Campbell and Jane Reece
Lectures by Chris Romero
LE 52-12
Number of generations
Po
pu
lati
on
siz
e (N
)
K = 1,5001,500
2,000
1,000
500
1510500
Logistic growth
Exponentialgrowth
= 1.0NdNdt
= 1.0NdNdt
1,500 – N
1,500
Copyright © 2005 Pearson Education, Inc. publishing as Benjamin Cummings
The Logistic Model and Real Populations
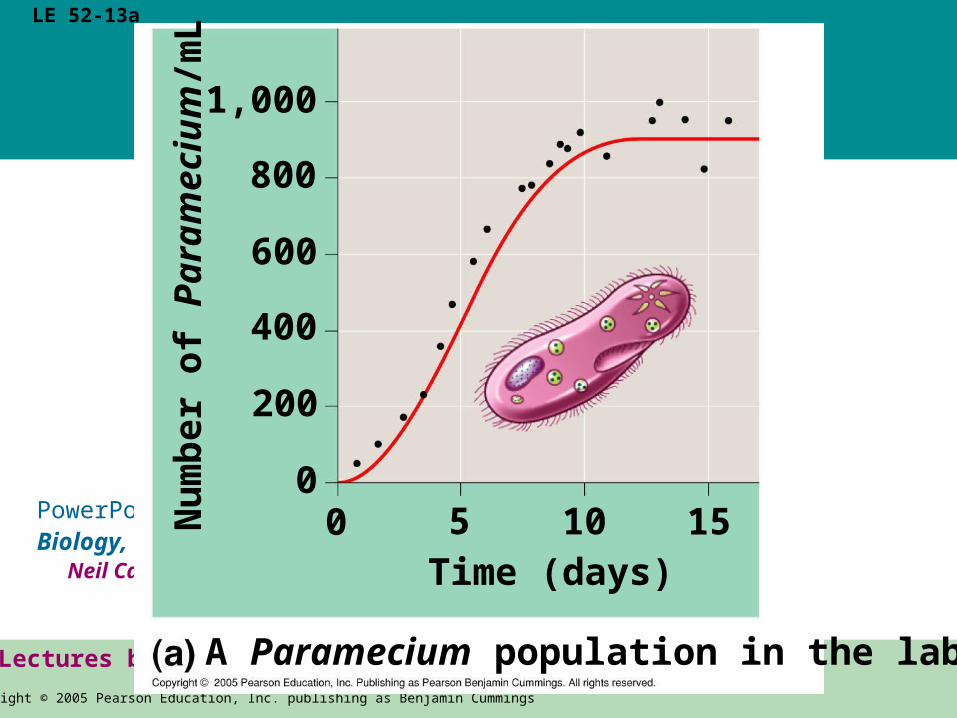
• The growth of laboratory populations of paramecia fits an S-shaped curve
Copyright © 2005 Pearson Education, Inc. publishing as Benjamin CummingsCopyright © 2005 Pearson Education, Inc. publishing as Benjamin Cummings
PowerPoint Lectures for Biology, Seventh Edition
Neil Campbell and Jane Reece
Lectures by Chris Romero
LE 52-13a
Time (days)
Nu
mb
er o
f P
aram
eciu
m/m
L
1,000
0
400
5
200
100
15
800
600
A Paramecium population in the lab
Copyright © 2005 Pearson Education, Inc. publishing as Benjamin Cummings
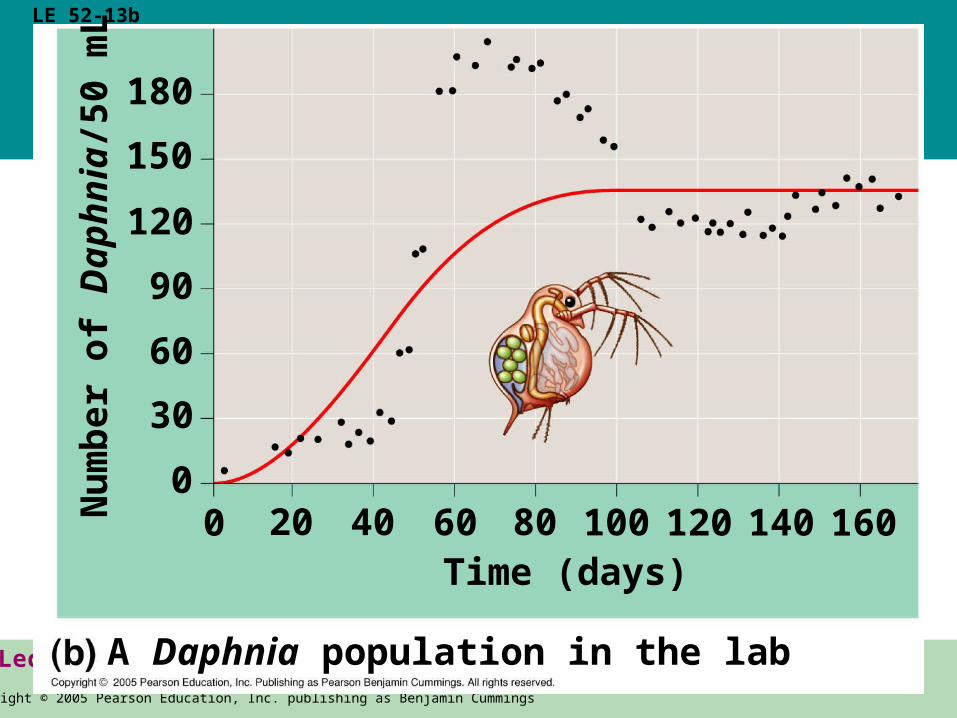
• Some populations overshoot K before settling down to a relatively stable density
Copyright © 2005 Pearson Education, Inc. publishing as Benjamin CummingsCopyright © 2005 Pearson Education, Inc. publishing as Benjamin Cummings
PowerPoint Lectures for Biology, Seventh Edition
Neil Campbell and Jane Reece
Lectures by Chris Romero
LE 52-13b
Time (days)
Nu
mb
er o
f D
aph
nia
/50
mL
180
0
90
20
60
400
60
150
120
A Daphnia population in the lab
30
80 100 120 140 160
Copyright © 2005 Pearson Education, Inc. publishing as Benjamin Cummings
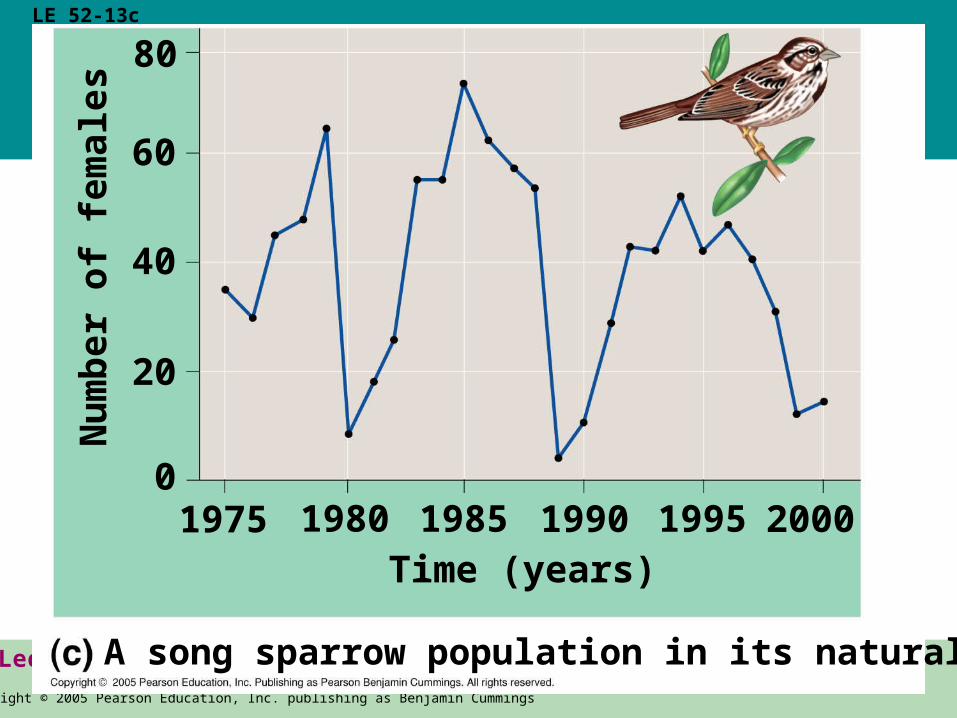
• Some populations fluctuate greatly around K
Copyright © 2005 Pearson Education, Inc. publishing as Benjamin CummingsCopyright © 2005 Pearson Education, Inc. publishing as Benjamin Cummings
PowerPoint Lectures for Biology, Seventh Edition
Neil Campbell and Jane Reece
Lectures by Chris Romero
LE 52-13c
Time (years)
Nu
mb
er o
f fe
mal
es80
1975 1980
40
19850
1990
60
A song sparrow population in its natural habitat
20
1995 2000

Copyright © 2005 Pearson Education, Inc. publishing as Benjamin Cummings
• The logistic model fits few real populations but is useful for estimating possible growth
Copyright © 2005 Pearson Education, Inc. publishing as Benjamin Cummings
The Logistic Model and Life Histories
• Life history traits favored by natural selection may vary with population density and environmental conditions
• K-selection, or density-dependent selection, selects for life history traits that are sensitive to population density
• r-selection, or density-independent selection, selects for life history traits that maximize reproduction

Copyright © 2005 Pearson Education, Inc. publishing as Benjamin Cummings
• The concepts of K-selection and r-selection are somewhat controversial and have been criticized by ecologists as oversimplifications
Copyright © 2005 Pearson Education, Inc. publishing as Benjamin Cummings
Concept 52.5: Populations are regulated by a complex interaction of biotic and abiotic influences
• There are two general questions about regulation of population growth:
– What environmental factors stop a population from growing?
– Why do some populations show radical fluctuations in size over time, while others remain stable?

Copyright © 2005 Pearson Education, Inc. publishing as Benjamin Cummings
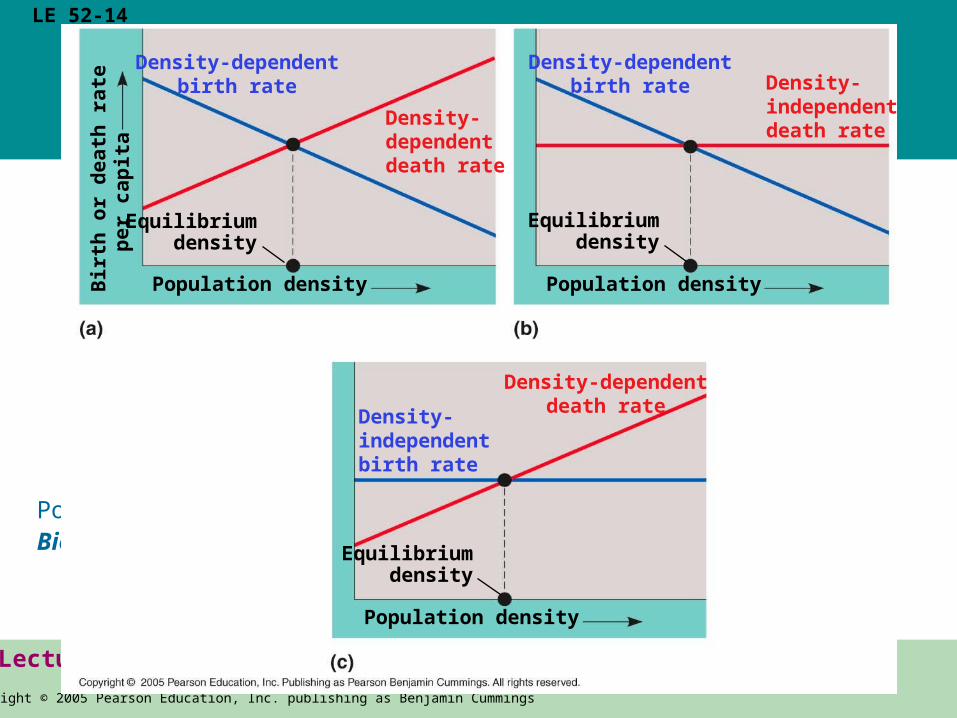
Population Change and Population Density
• In density-independent populations, birth rate and death rate do not change with population density
• In density-dependent populations, birth rates fall and death rates rise with population density
Copyright © 2005 Pearson Education, Inc. publishing as Benjamin CummingsCopyright © 2005 Pearson Education, Inc. publishing as Benjamin Cummings
PowerPoint Lectures for Biology, Seventh Edition
Neil Campbell and Jane Reece
Lectures by Chris Romero
LE 52-14
Population density
Equilibriumdensity
Density-independentbirth rate
Density-dependentdeath rate
Population density
Equilibriumdensity
Density-independentdeath rate
Density-dependentbirth rate
Population density
Equilibriumdensity
Density-dependentdeath rate
Density-dependentbirth rate
pe
r c
ap
ita
Bir
th o
r d
ea
th r
ate
Copyright © 2005 Pearson Education, Inc. publishing as Benjamin Cummings
Density-Dependent Population Regulation
• Density-dependent birth and death rates are an example of negative feedback that regulates population growth
• They are affected by many factors, such as competition for resources, territoriality, health, predation, toxic wastes, and intrinsic factors
Copyright © 2005 Pearson Education, Inc. publishing as Benjamin Cummings
Competition for Resources
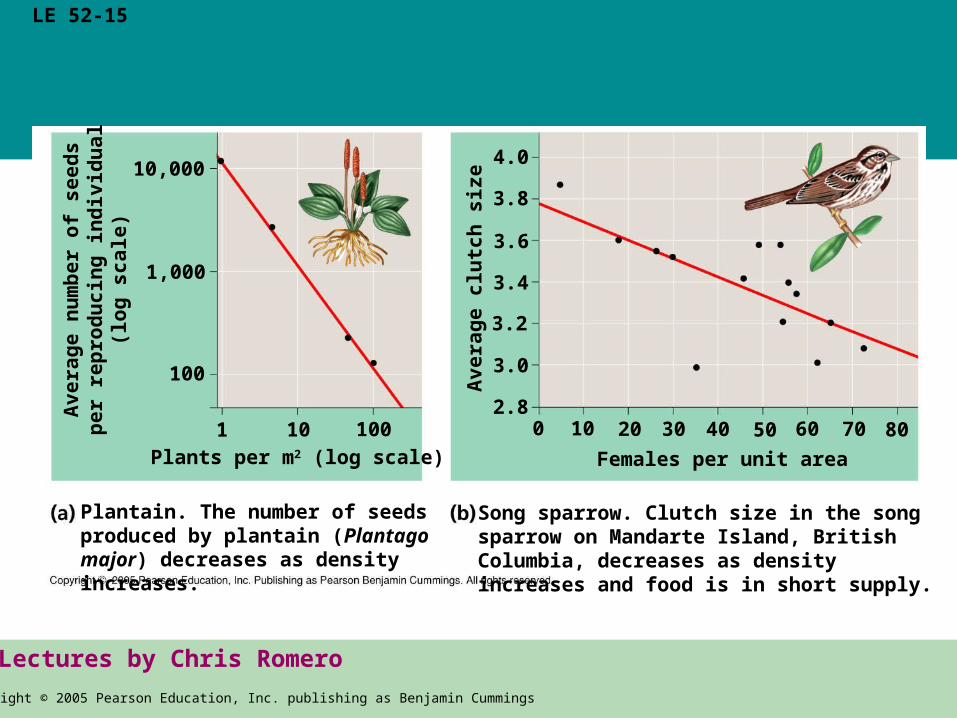
• In crowded populations, increasing population density intensifies intraspecific competition for resources
Copyright © 2005 Pearson Education, Inc. publishing as Benjamin CummingsCopyright © 2005 Pearson Education, Inc. publishing as Benjamin Cummings
PowerPoint Lectures for Biology, Seventh Edition
Neil Campbell and Jane Reece
Lectures by Chris Romero
LE 52-15
10,000
Av
era
ge
nu
mb
er
of
se
ed
sp
er
rep
rod
uc
ing
in
div
idu
al
(lo
g s
ca
le)
1,000
100
100101Plants per m2 (log scale)
Plantain. The number of seeds produced by plantain (Plantago major) decreases as density increases.
Song sparrow. Clutch size in the song sparrow on Mandarte Island, British Columbia, decreases as density increases and food is in short supply.
Av
era
ge
clu
tch
siz
e
2.880
Females per unit area
3.0
3.8
4.0
3.4
3.6
3.2
60 705030 40200 10
Copyright © 2005 Pearson Education, Inc. publishing as Benjamin Cummings
Territoriality
• In many vertebrates and some invertebrates, territoriality may limit density

Copyright © 2005 Pearson Education, Inc. publishing as Benjamin Cummings
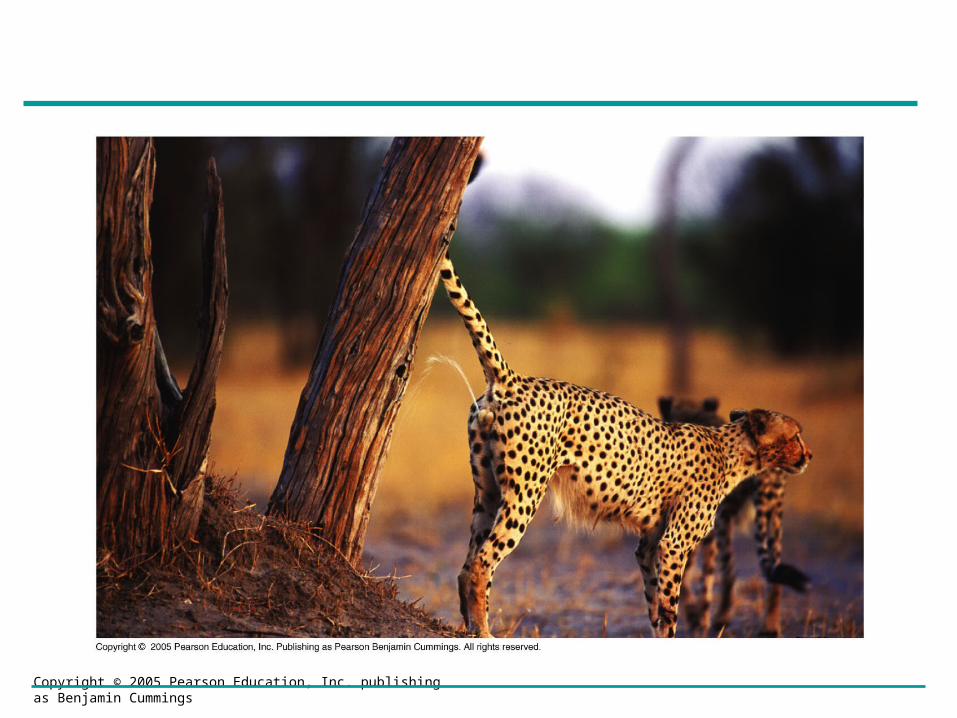
• Cheetahs are highly territorial, using chemical communication to warn other cheetahs of their boundaries
Copyright © 2005 Pearson Education, Inc. publishing as Benjamin Cummings
Copyright © 2005 Pearson Education, Inc. publishing as Benjamin Cummings
• Oceanic birds exhibit territoriality in nesting behavior
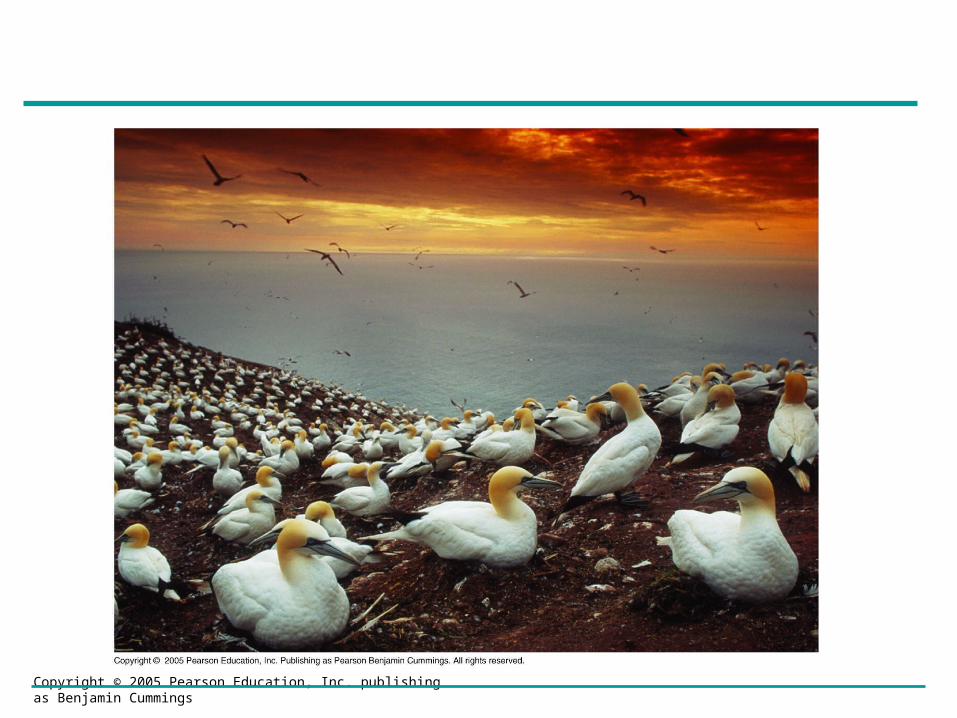
Copyright © 2005 Pearson Education, Inc. publishing as Benjamin Cummings
Copyright © 2005 Pearson Education, Inc. publishing as Benjamin Cummings
Health
• Population density can influence the health and survival of organisms
• In dense populations, pathogens can spread more rapidly
Copyright © 2005 Pearson Education, Inc. publishing as Benjamin Cummings
Predation
• As a prey population builds up, predators may feed preferentially on that species
Copyright © 2005 Pearson Education, Inc. publishing as Benjamin Cummings
Toxic Wastes
• Accumulation of toxic wastes can contribute to density-dependent regulation of population size
Copyright © 2005 Pearson Education, Inc. publishing as Benjamin Cummings
Intrinsic Factors
• For some populations, intrinsic (physiological) factors appear to regulate population size

Copyright © 2005 Pearson Education, Inc. publishing as Benjamin Cummings
Population Dynamics
• The study of population dynamics focuses on the complex interactions between biotic and abiotic factors that cause variation in population size
Copyright © 2005 Pearson Education, Inc. publishing as Benjamin Cummings
Stability and Fluctuation
• Long-term population studies have challenged the hypothesis that populations of large mammals are relatively stable over time

Copyright © 2005 Pearson Education, Inc. publishing as Benjamin CummingsCopyright © 2005 Pearson Education, Inc. publishing as Benjamin Cummings
PowerPoint Lectures for Biology, Seventh Edition
Neil Campbell and Jane Reece
Lectures by Chris Romero
LE 52-18
1960
Year
Mo
ose
po
pu
lati
on
siz
e
2,500
Steady decline probably caused largely by wolf predation
2,000
1,500
1,000
500
01970 1980 1990 2000
Dramatic collapse caused by severe winter weather and food shortage, leading to starvation of more than 75% of the population
Copyright © 2005 Pearson Education, Inc. publishing as Benjamin Cummings
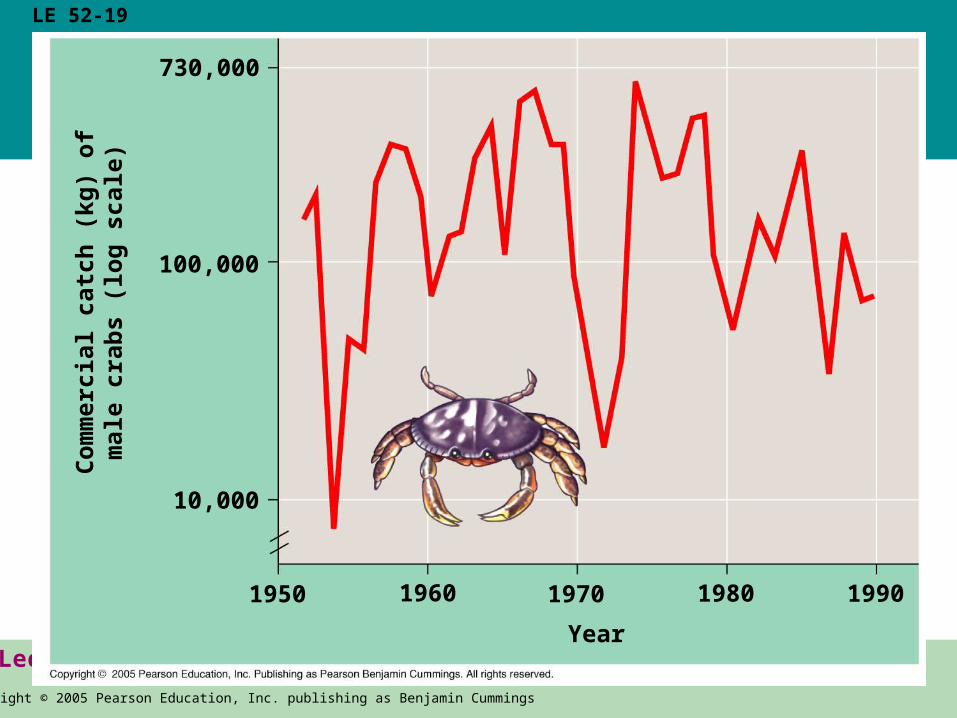
• Extreme fluctuations in population size are typically more common in invertebrates than in large mammals
Copyright © 2005 Pearson Education, Inc. publishing as Benjamin CummingsCopyright © 2005 Pearson Education, Inc. publishing as Benjamin Cummings
PowerPoint Lectures for Biology, Seventh Edition
Neil Campbell and Jane Reece
Lectures by Chris Romero
LE 52-19
1960
Year
Co
mm
erci
al c
atch
(kg
) o
fm
ale
crab
s (l
og
sca
le)
730,000
100,000
10,000
1970 1980 19901950

Copyright © 2005 Pearson Education, Inc. publishing as Benjamin Cummings
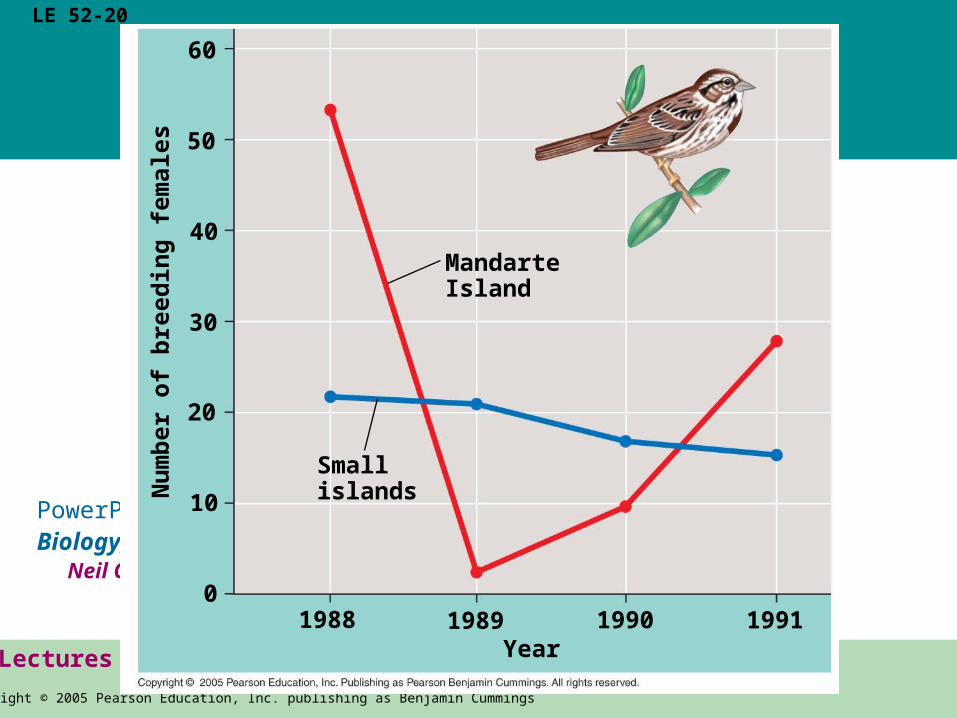
Metapopulations and Immigration
• Metapopulations are groups of populations linked by immigration and emigration
• High levels of immigration combined with higher survival can result in greater stability in populations
Copyright © 2005 Pearson Education, Inc. publishing as Benjamin CummingsCopyright © 2005 Pearson Education, Inc. publishing as Benjamin Cummings
PowerPoint Lectures for Biology, Seventh Edition
Neil Campbell and Jane Reece
Lectures by Chris Romero
LE 52-20
1988Year
Nu
mb
er o
f b
reed
ing
fem
ales
60
1989 1990 1991
Smallislands
MandarteIsland
50
40
30
20
10
0

Copyright © 2005 Pearson Education, Inc. publishing as Benjamin Cummings
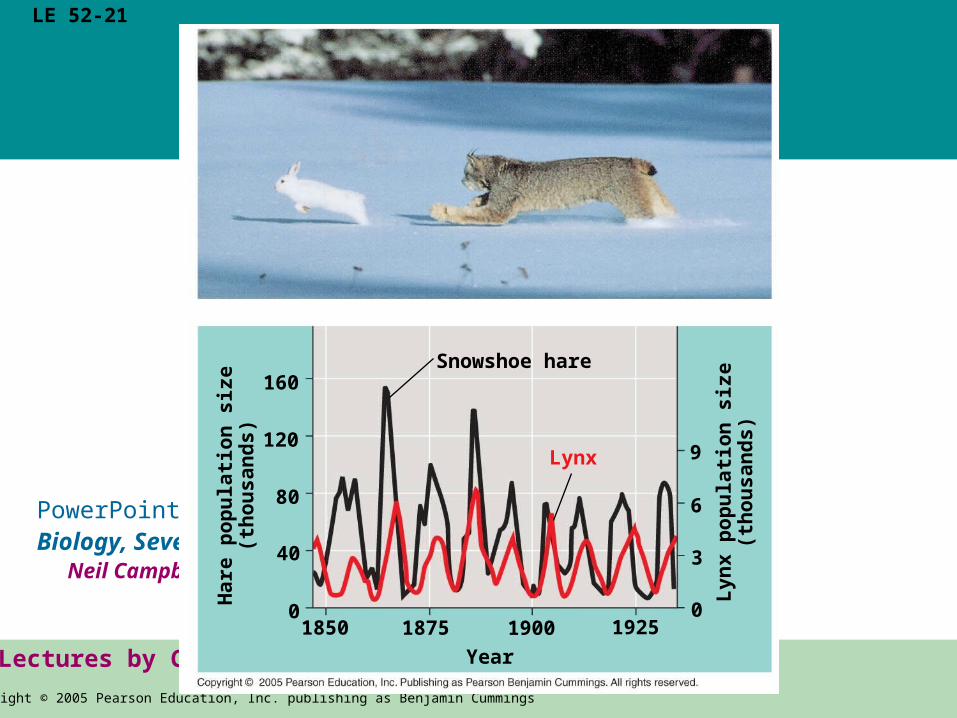
• Many populations undergo boom-and-bust cycles
• Boom-and-bust cycles are influenced by complex interactions between biotic and abiotic factors
Copyright © 2005 Pearson Education, Inc. publishing as Benjamin CummingsCopyright © 2005 Pearson Education, Inc. publishing as Benjamin Cummings
PowerPoint Lectures for Biology, Seventh Edition
Neil Campbell and Jane Reece
Lectures by Chris Romero
LE 52-21
Year
Ha
re p
op
ula
tio
n s
ize
(th
ou
sa
nd
s)
1850
Snowshoe hare
01875 1900 1925
40
80
120
160
Ly
nx
po
pu
lati
on
siz
e(t
ho
us
an
ds
)
Lynx
0
3
6
9
Copyright © 2005 Pearson Education, Inc. publishing as Benjamin Cummings
Concept 52.6: Human population growth has slowed after centuries of exponential increase
• No population can grow indefinitely, and humans are no exception
Copyright © 2005 Pearson Education, Inc. publishing as Benjamin Cummings
The Global Human Population
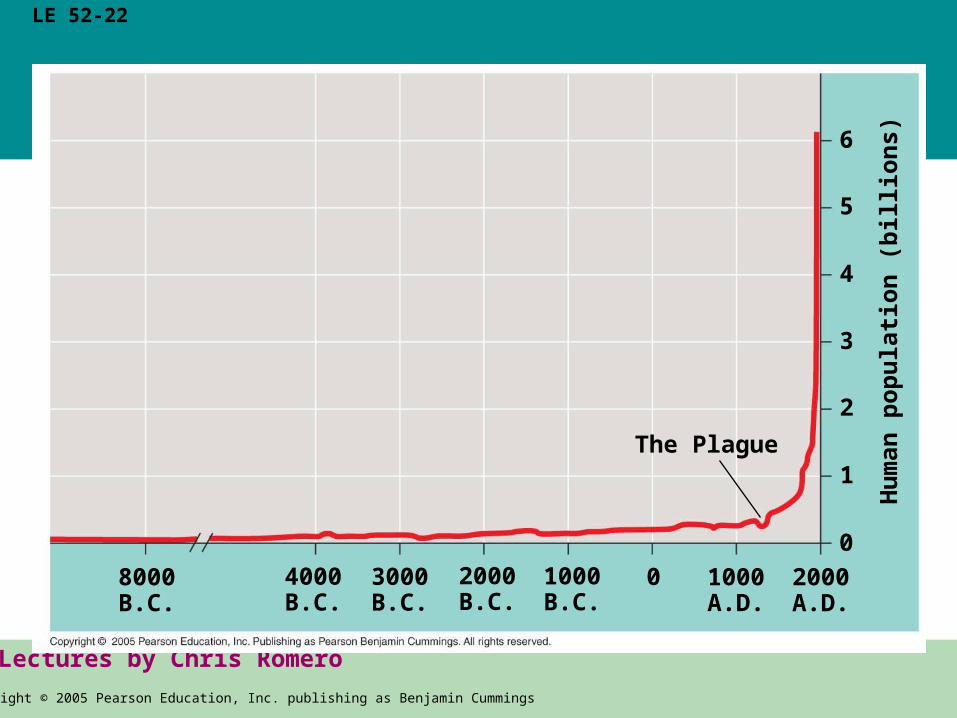
• The human population increased relatively slowly until about 1650 and then began to grow exponentially
Copyright © 2005 Pearson Education, Inc. publishing as Benjamin CummingsCopyright © 2005 Pearson Education, Inc. publishing as Benjamin Cummings
PowerPoint Lectures for Biology, Seventh Edition
Neil Campbell and Jane Reece
Lectures by Chris Romero
LE 52-22
8000B.C.
Hu
man
po
pu
lati
on
(b
illi
on
s)
6
5
4
3
2
1
0
4000B.C.
3000B.C.
2000B.C.
1000B.C.
The Plague
0 1000A.D.
2000A.D.
Copyright © 2005 Pearson Education, Inc. publishing as Benjamin Cummings
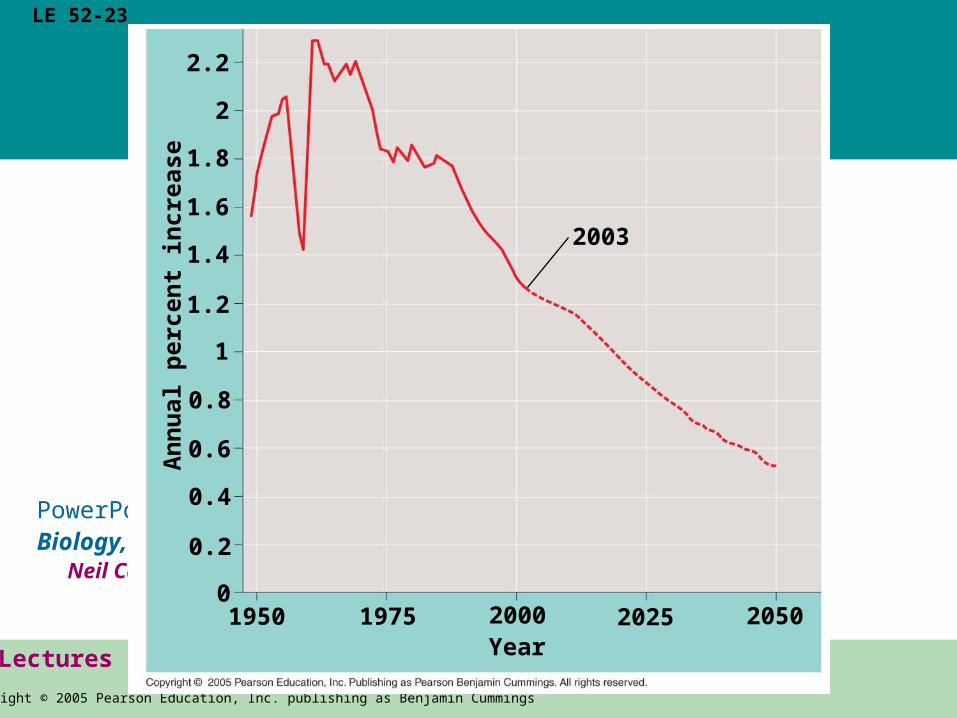
• Though the global population is still growing, the rate of growth began to slow about 40 years ago
Copyright © 2005 Pearson Education, Inc. publishing as Benjamin CummingsCopyright © 2005 Pearson Education, Inc. publishing as Benjamin Cummings
PowerPoint Lectures for Biology, Seventh Edition
Neil Campbell and Jane Reece
Lectures by Chris Romero
LE 52-23
An
nu
al p
erce
nt
incr
ease
2.2
2
1.8
1.6
1.4
1.2
1
2003
2050Year
2025200019751950
0.8
0.6
0.4
0.2
0
Copyright © 2005 Pearson Education, Inc. publishing as Benjamin Cummings
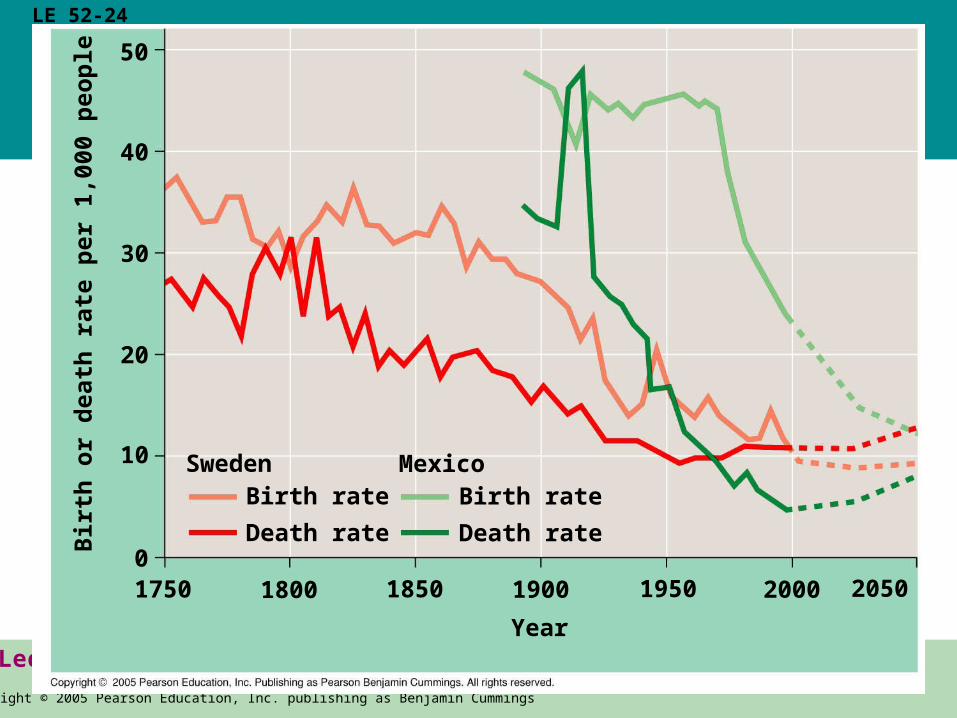
Regional Patterns of Population Change
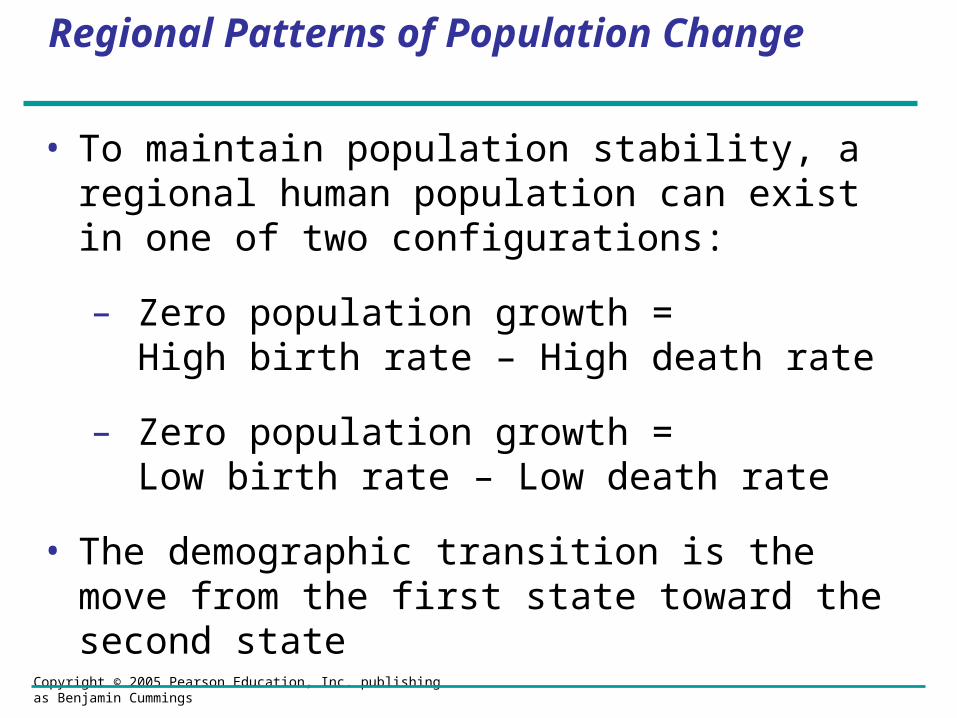
• To maintain population stability, a regional human population can exist in one of two configurations:
– Zero population growth = High birth rate – High death rate
– Zero population growth =Low birth rate – Low death rate
• The demographic transition is the move from the first state toward the second state
Copyright © 2005 Pearson Education, Inc. publishing as Benjamin CummingsCopyright © 2005 Pearson Education, Inc. publishing as Benjamin Cummings
PowerPoint Lectures for Biology, Seventh Edition
Neil Campbell and Jane Reece
Lectures by Chris Romero
LE 52-24
Bir
th o
r d
eath
rat
e p
er 1
,000
peo
ple
50
40
30
20
10 Sweden
2050
Year
20001900 195018500
18001750
Birth rate
Death rate
MexicoBirth rate
Death rate
Copyright © 2005 Pearson Education, Inc. publishing as Benjamin Cummings
• The demographic transition is associated with various factors in developed and developing countries
Copyright © 2005 Pearson Education, Inc. publishing as Benjamin Cummings
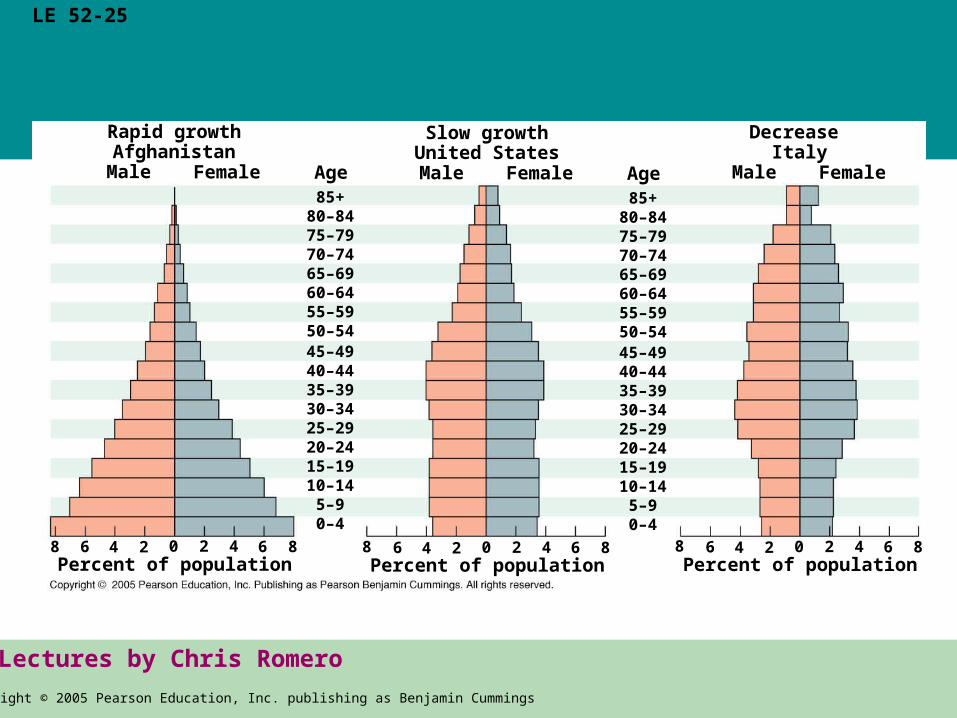
Age Structure
• One important demographic factor in present and future growth trends is a country’s age structure
• Age structure is the relative number of individuals at each age
• It is commonly represented in pyramids
Copyright © 2005 Pearson Education, Inc. publishing as Benjamin CummingsCopyright © 2005 Pearson Education, Inc. publishing as Benjamin Cummings
PowerPoint Lectures for Biology, Seventh Edition
Neil Campbell and Jane Reece
Lectures by Chris Romero
LE 52-25
Rapid growthAfghanistan
AgeMale
Percent of population
Female
8 6 4 2 2 4 6 80
45–4940–4435–3930–3425–2920–2415–1910–14
5–90–4
85+80–8475–7970–7465–6960–6455–5950–54
Slow growthUnited States
AgeMale
Percent of population
Female
6 4 2 2 4 6 80
45–4940–4435–3930–3425–2920–2415–1910–14
5–90–4
85+80–8475–7970–7465–6960–6455–5950–54
8
Decrease Italy
Male
Percent of population
Female
6 4 2 2 4 6 808
Copyright © 2005 Pearson Education, Inc. publishing as Benjamin Cummings
• Age structure diagrams can predict a population’s growth trends
• They can illuminate social conditions and help us plan for the future
Copyright © 2005 Pearson Education, Inc. publishing as Benjamin Cummings
Infant Mortality and Life Expectancy
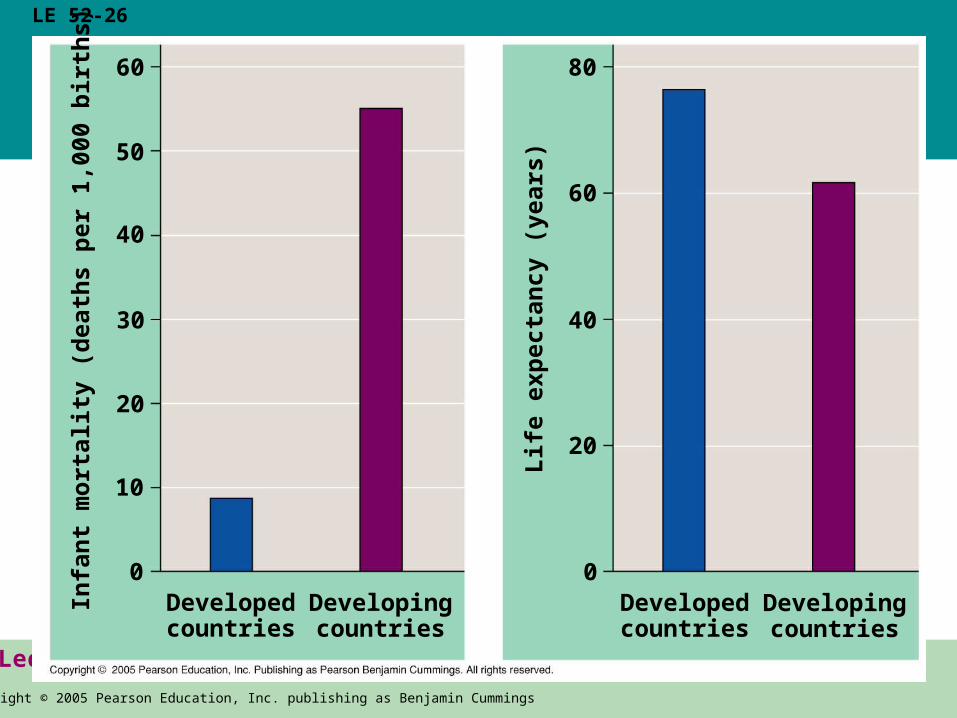
• Infant mortality and life expectancy at birth vary greatly among developed and developing countries but do not capture the wide range of the human condition
Copyright © 2005 Pearson Education, Inc. publishing as Benjamin CummingsCopyright © 2005 Pearson Education, Inc. publishing as Benjamin Cummings
PowerPoint Lectures for Biology, Seventh Edition
Neil Campbell and Jane Reece
Lectures by Chris Romero
LE 52-26
Infa
nt
mo
rtal
ity
(dea
ths
per
1,0
00 b
irth
s)
50
40
30
20
10
0Developedcountries
60
Developingcountries
Lif
e ex
pec
tan
cy (
year
s)
80
40
20
0Developedcountries
60
Developingcountries
Copyright © 2005 Pearson Education, Inc. publishing as Benjamin Cummings
Global Carrying Capacity
• How many humans can the biosphere support?
Copyright © 2005 Pearson Education, Inc. publishing as Benjamin Cummings
Estimates of Carrying Capacity
• The carrying capacity of Earth for humans is uncertain

Copyright © 2005 Pearson Education, Inc. publishing as Benjamin Cummings
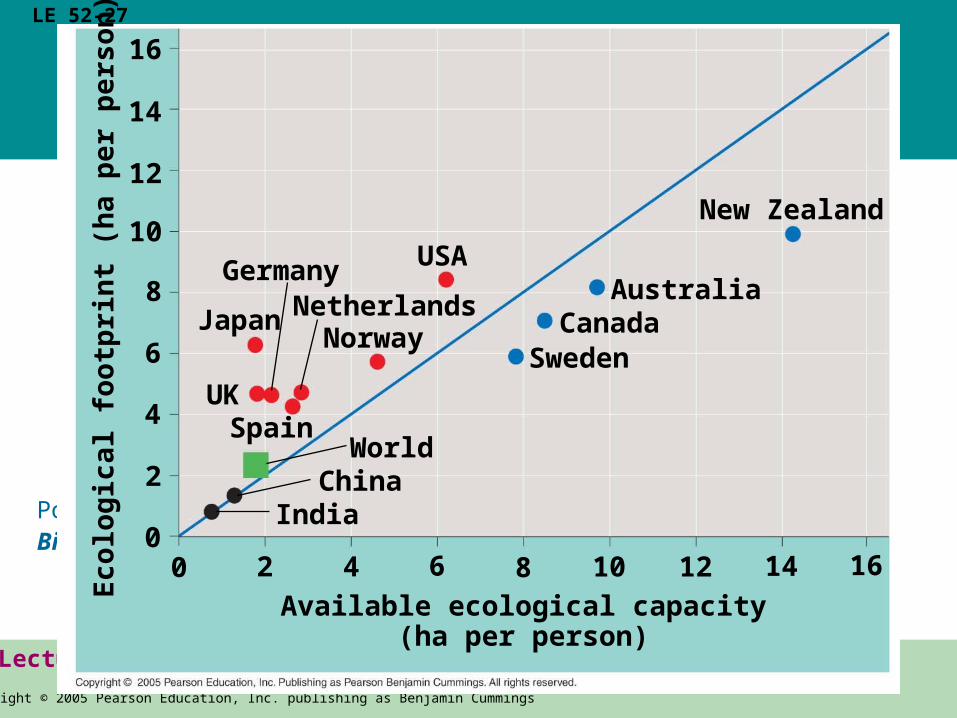
Ecological Footprint
• The ecological footprint concept summarizes the aggregate land and water area needed to sustain the people of a nation
• It is one measure of how close we are to the carrying capacity of Earth
• Countries vary greatly in footprint size and available ecological capacity
Copyright © 2005 Pearson Education, Inc. publishing as Benjamin CummingsCopyright © 2005 Pearson Education, Inc. publishing as Benjamin Cummings
PowerPoint Lectures for Biology, Seventh Edition
Neil Campbell and Jane Reece
Lectures by Chris Romero
LE 52-27
Eco
log
ical
fo
otp
rin
t (h
a p
er p
erso
n)
14
12
10
8
6
4
16
0
2
02 4 6 8 10 12 14 16
Available ecological capacity(ha per person)
New Zealand
AustraliaCanada
Sweden
WorldChina
India
SpainUK
Japan
Germany
Norway
USA
Netherlands
Copyright © 2005 Pearson Education, Inc. publishing as Benjamin Cummings
• At more than 6 billion people, the world is already in ecological deficit