Embed Size (px)
Citation preview
Copyright © 2004 Center for Farm Financial Management, University of Minnesota. All Rights Reserved.
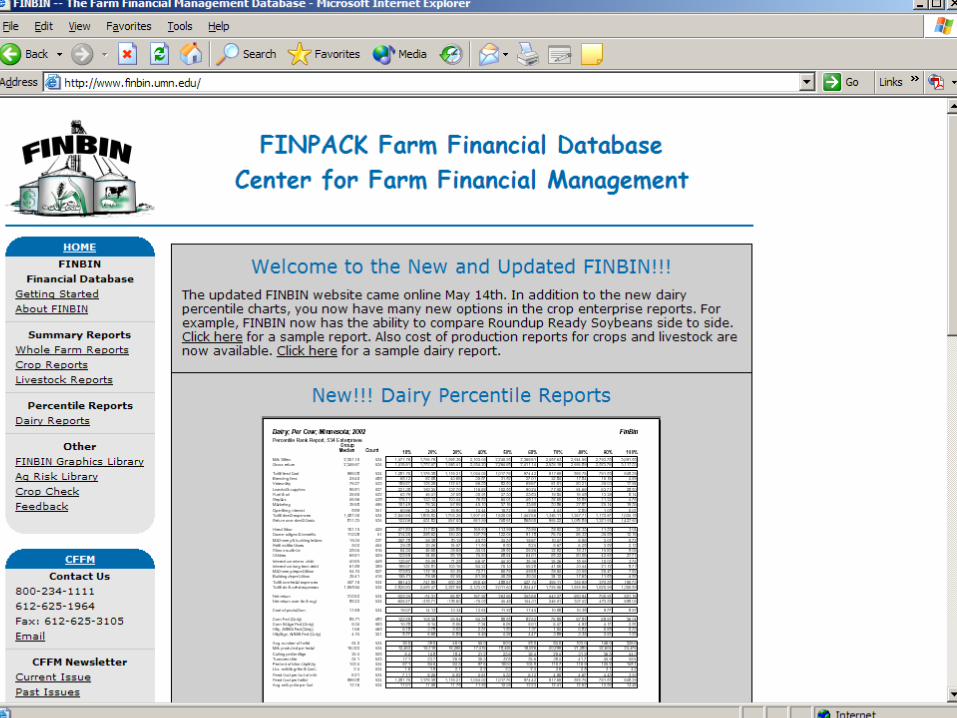
Farm Financial Database
www.finbin.umn.edu
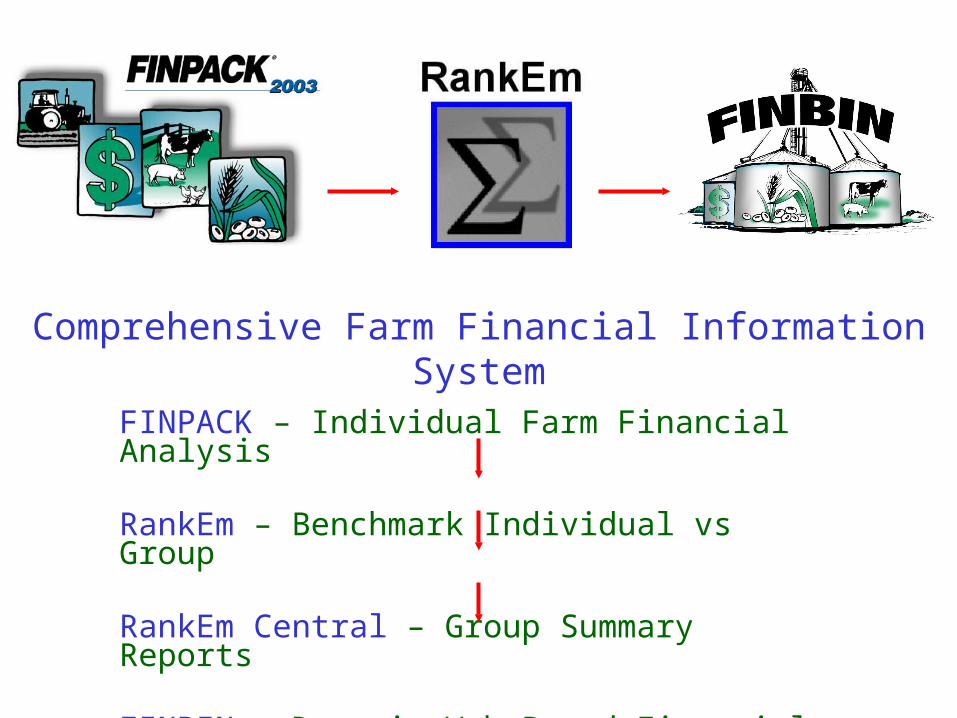
Comprehensive Farm Financial Information System
FINPACK – Individual Farm Financial Analysis
RankEm – Benchmark Individual vs Group
RankEm Central – Group Summary Reports
FINBIN – Dynamic Web-Based Financial Reports
Copyright © 2004 Center for Farm Financial Management, University of Minnesota. All Rights Reserved.
Copyright © 2004 Center for Farm Financial Management, University of Minnesota. All Rights Reserved.
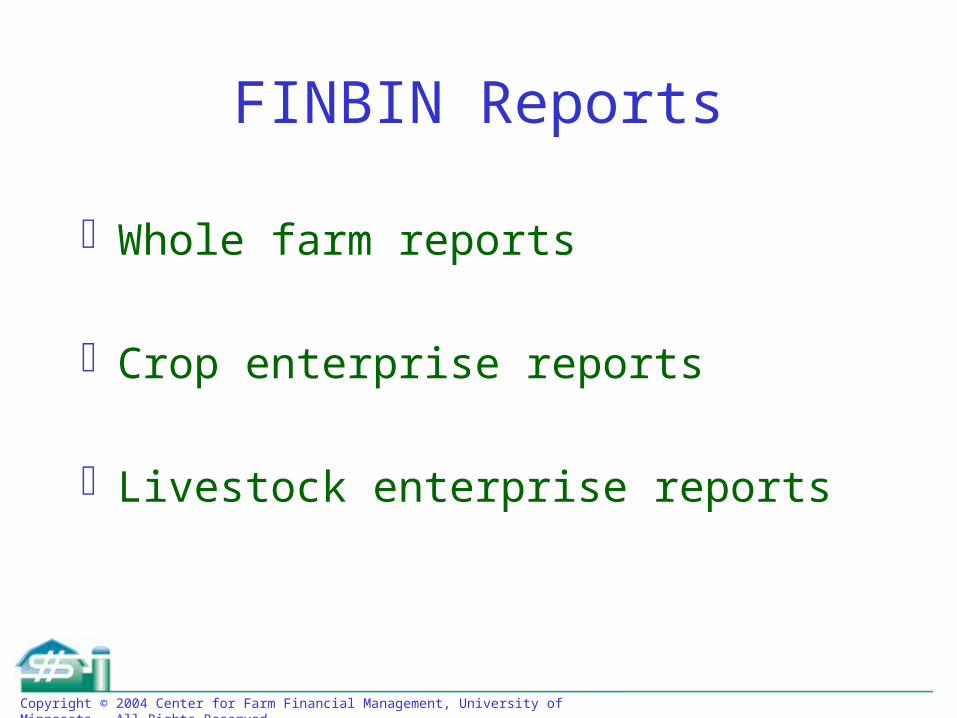
FINBIN Reports
Whole farm reports
Crop enterprise reports
Livestock enterprise reports
Copyright © 2004 Center for Farm Financial Management, University of Minnesota. All Rights Reserved.
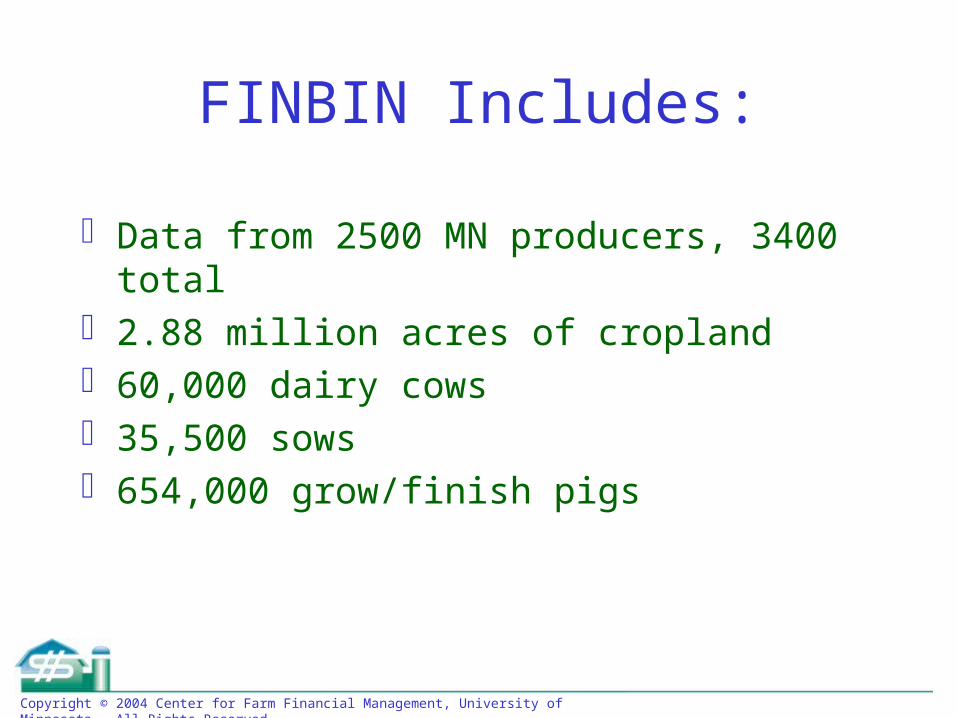
FINBIN Includes:
Data from 2500 MN producers, 3400 total
2.88 million acres of cropland60,000 dairy cows35,500 sows654,000 grow/finish pigs
Copyright © 2004 Center for Farm Financial Management, University of Minnesota. All Rights Reserved.
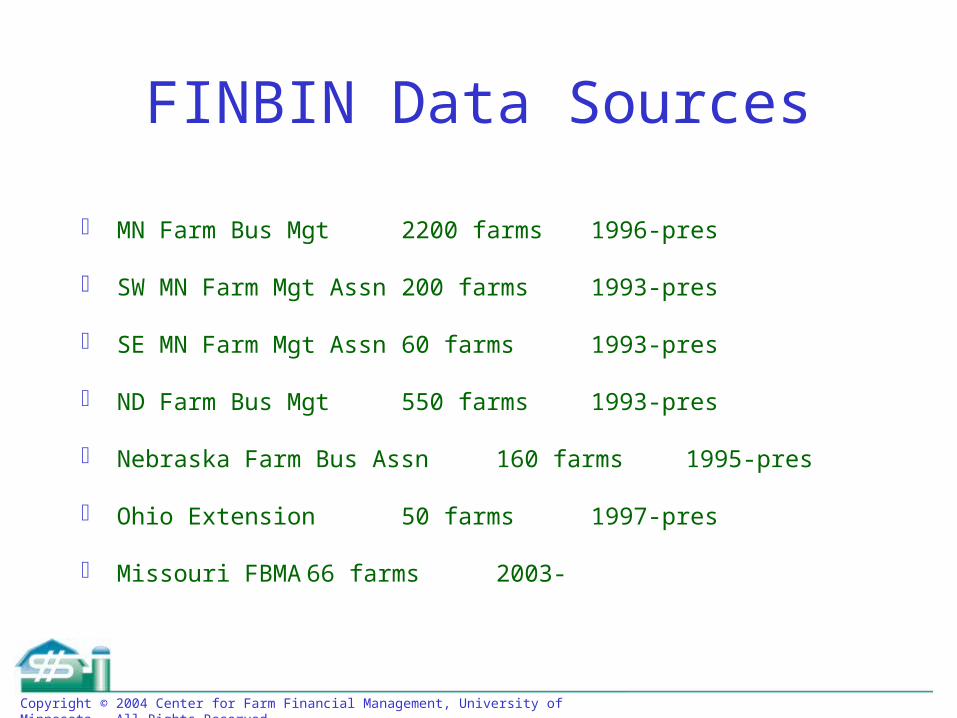
FINBIN Data Sources
MN Farm Bus Mgt 2200 farms 1996-pres
SW MN Farm Mgt Assn 200 farms 1993-pres
SE MN Farm Mgt Assn 60 farms1993-pres
ND Farm Bus Mgt 550 farms 1993-pres
Nebraska Farm Bus Assn 160 farms 1995-pres
Ohio Extension 50 farms 1997-pres
Missouri FBMA 66 farms2003-
Copyright © 2004 Center for Farm Financial Management, University of Minnesota. All Rights Reserved.
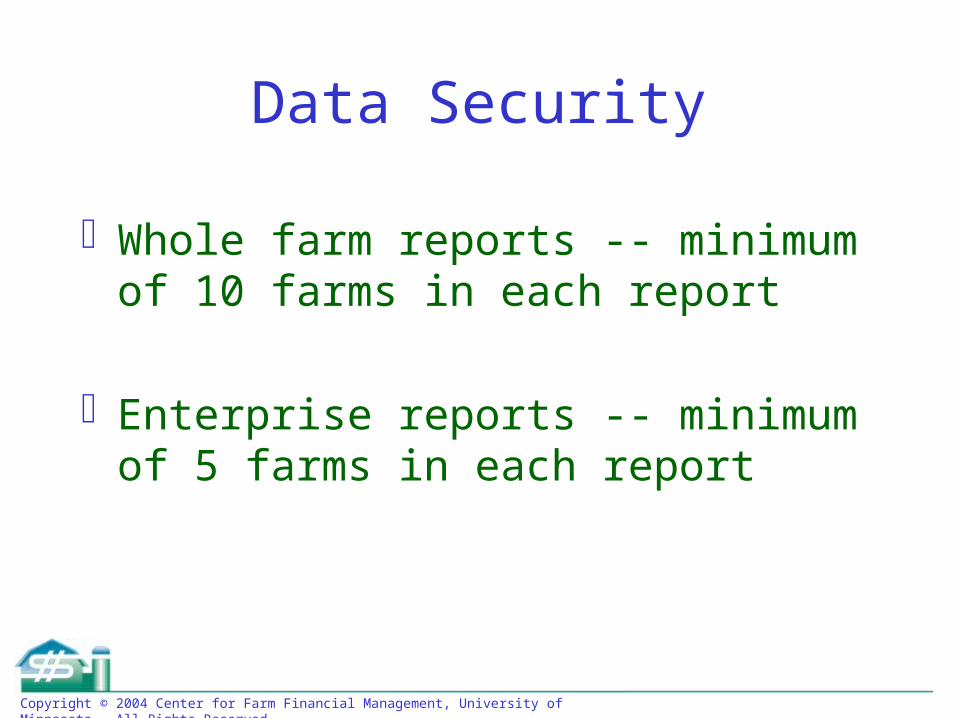
Data Security
Whole farm reports -- minimum of 10 farms in each report
Enterprise reports -- minimum of 5 farms in each report
Copyright © 2004 Center for Farm Financial Management, University of Minnesota. All Rights Reserved.
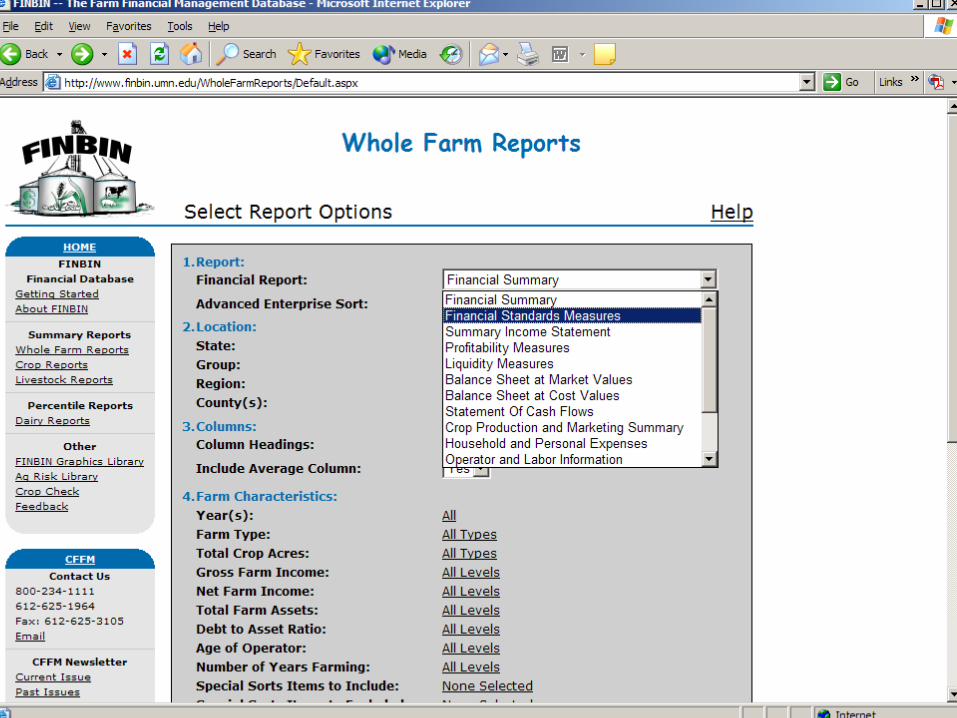
5 Steps to Generating a FINBIN Report
Select a report type/enterprise
Copyright © 2004 Center for Farm Financial Management, University of Minnesota. All Rights Reserved.
Copyright © 2004 Center for Farm Financial Management, University of Minnesota. All Rights Reserved.
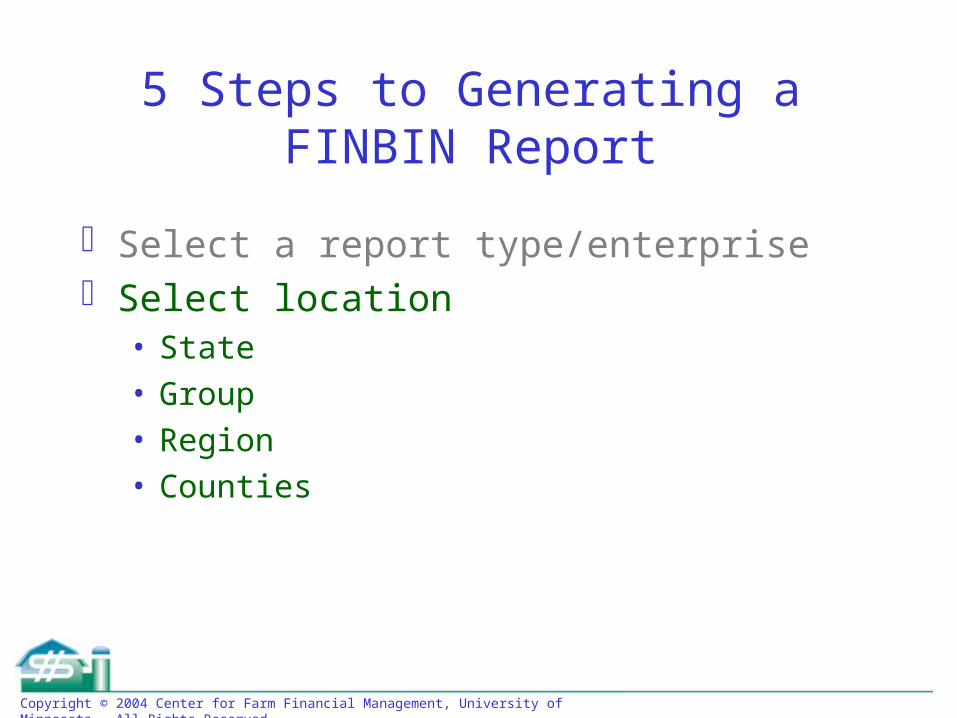
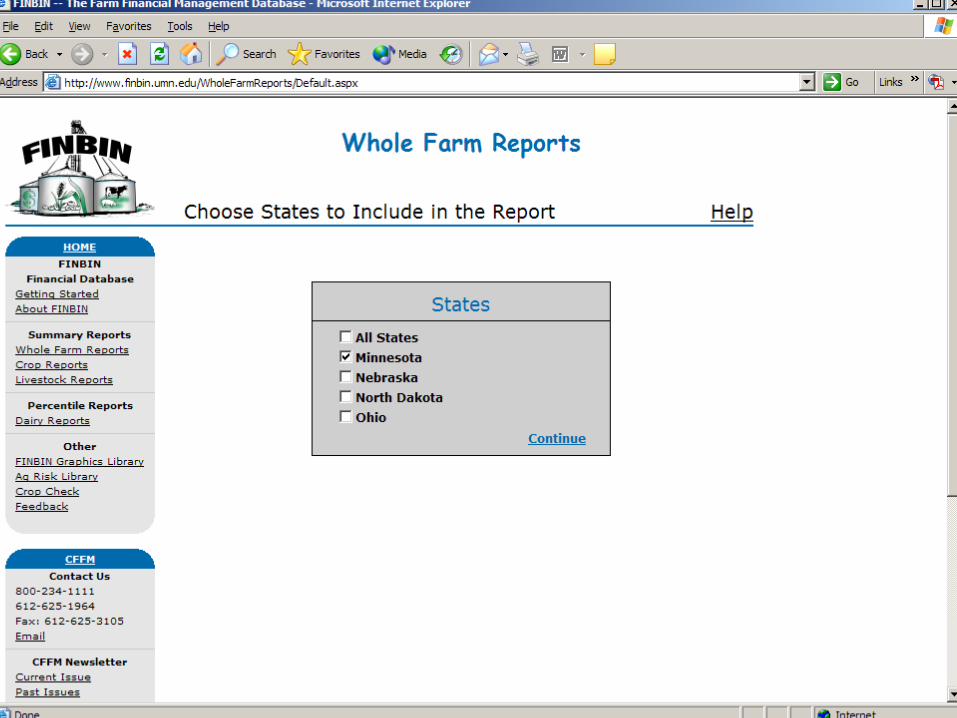
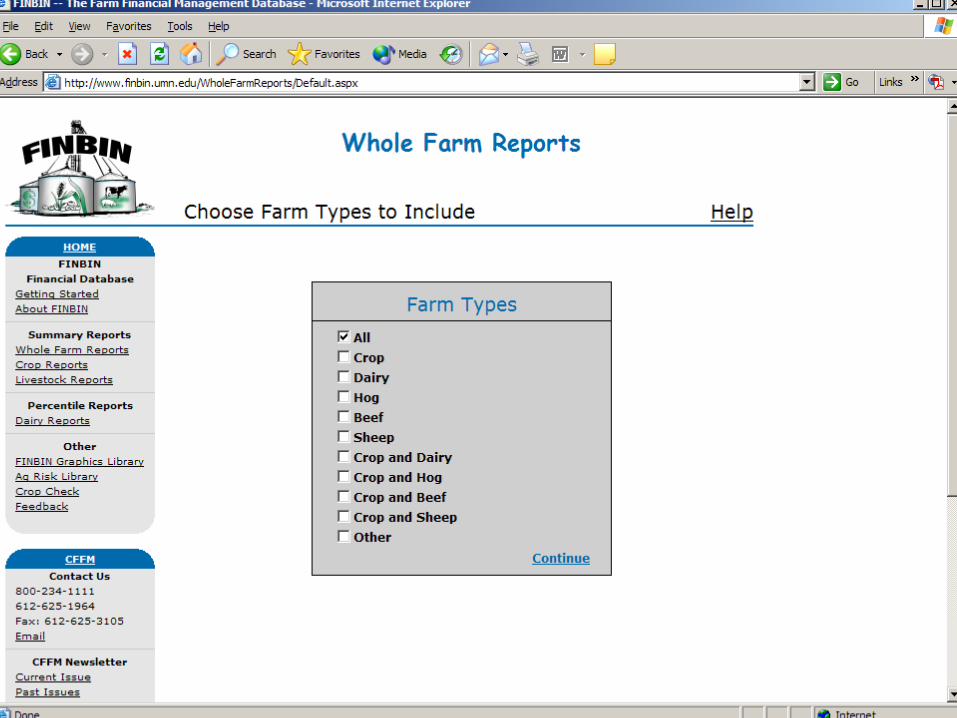
5 Steps to Generating a FINBIN Report
Select a report type/enterpriseSelect location
• State• Group• Region• Counties
Copyright © 2004 Center for Farm Financial Management, University of Minnesota. All Rights Reserved.
Copyright © 2004 Center for Farm Financial Management, University of Minnesota. All Rights Reserved.
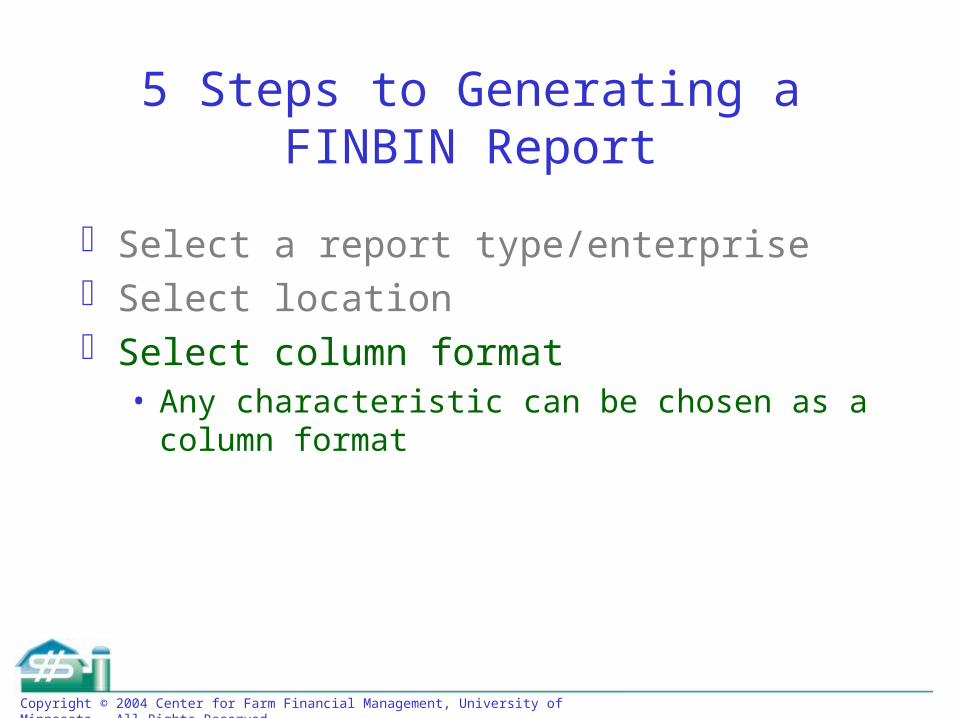
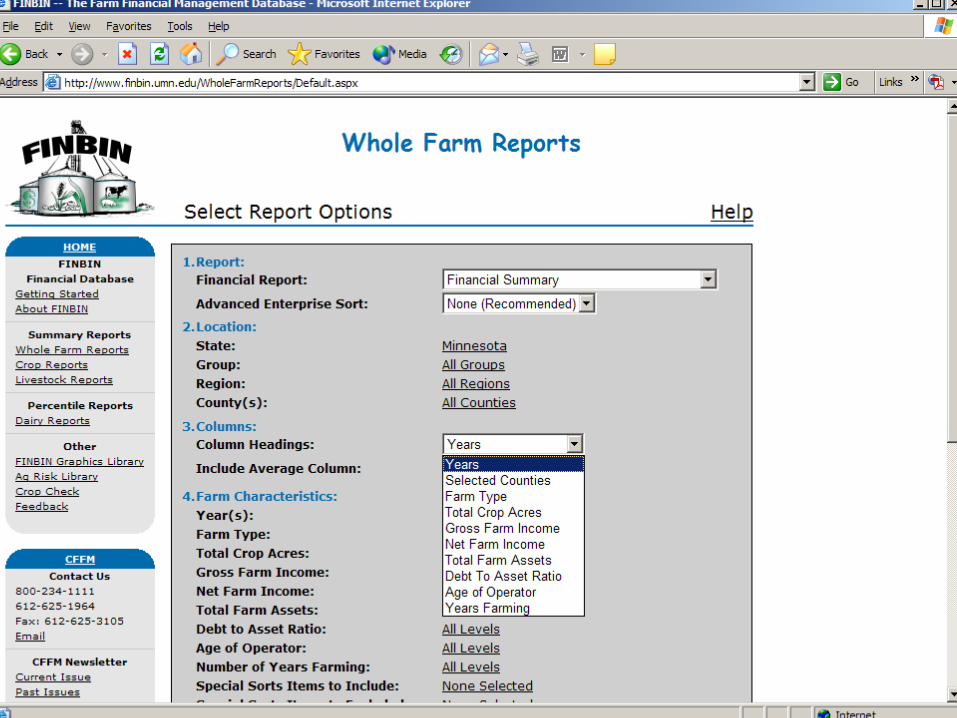
5 Steps to Generating a FINBIN Report
Select a report type/enterpriseSelect locationSelect column format
• Any characteristic can be chosen as a column format
Copyright © 2004 Center for Farm Financial Management, University of Minnesota. All Rights Reserved.
Copyright © 2004 Center for Farm Financial Management, University of Minnesota. All Rights Reserved.
5 Steps to Generating a FINBIN Report
Select a report type/enterpriseSelect locationSelect column formatSelect characteristics
• Years• Type of farm • etc
Copyright © 2004 Center for Farm Financial Management, University of Minnesota. All Rights Reserved.
Copyright © 2004 Center for Farm Financial Management, University of Minnesota. All Rights Reserved.
Copyright © 2004 Center for Farm Financial Management, University of Minnesota. All Rights Reserved.
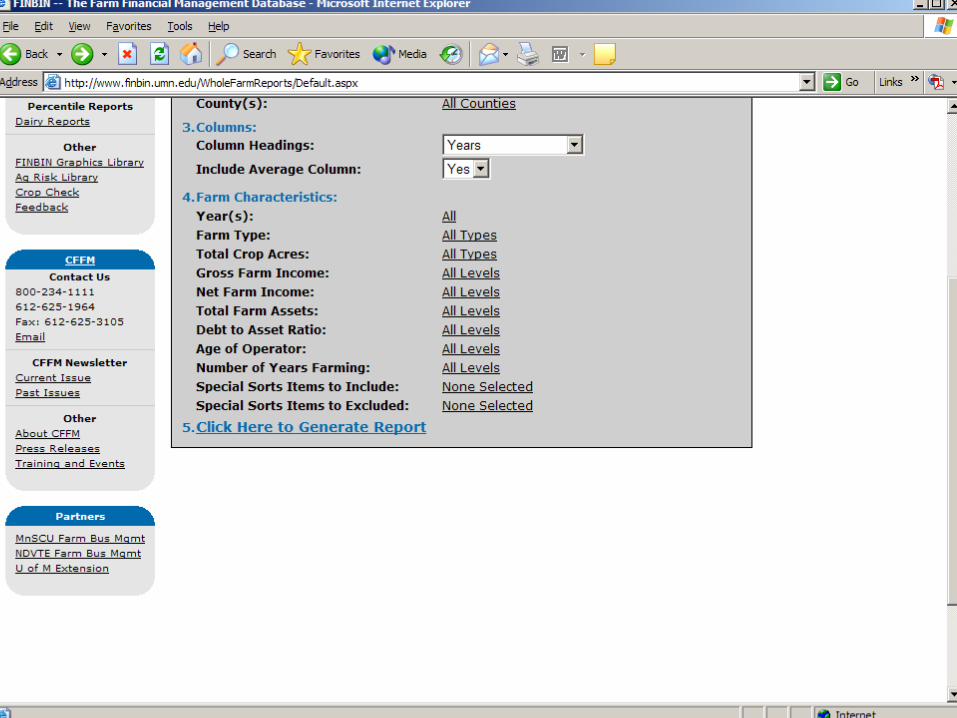
5 Steps to Generating a FINBIN Report
Select a report type/enterpriseSelect locationSelect column formatSelect characteristicsRun the report
Copyright © 2004 Center for Farm Financial Management, University of Minnesota. All Rights Reserved.
Whole Farm Report Characteristics
YearsType of farm (70 % rule)Size of farm (gross farm income)Size of farm (total assets)Size of farm (total crop acres)Net farm income (high/low profit farms)Debt to asset ratioAge of operator
Copyright © 2004 Center for Farm Financial Management, University of Minnesota. All Rights Reserved.
Crop Enterprise Report Characteristics
Years Tenure (owned, cash, share rent) Net return (high vs. low return) Acres (total on farm) Production practices
• Tillage system• Row width• Roundup ready• Bt• Organic• Manure application
Copyright © 2004 Center for Farm Financial Management, University of Minnesota. All Rights Reserved.
Livestock Enterprise Report Characteristics
YearsNet return (high vs. low return)Enterprise size
Copyright © 2004 Center for Farm Financial Management, University of Minnesota. All Rights Reserved.
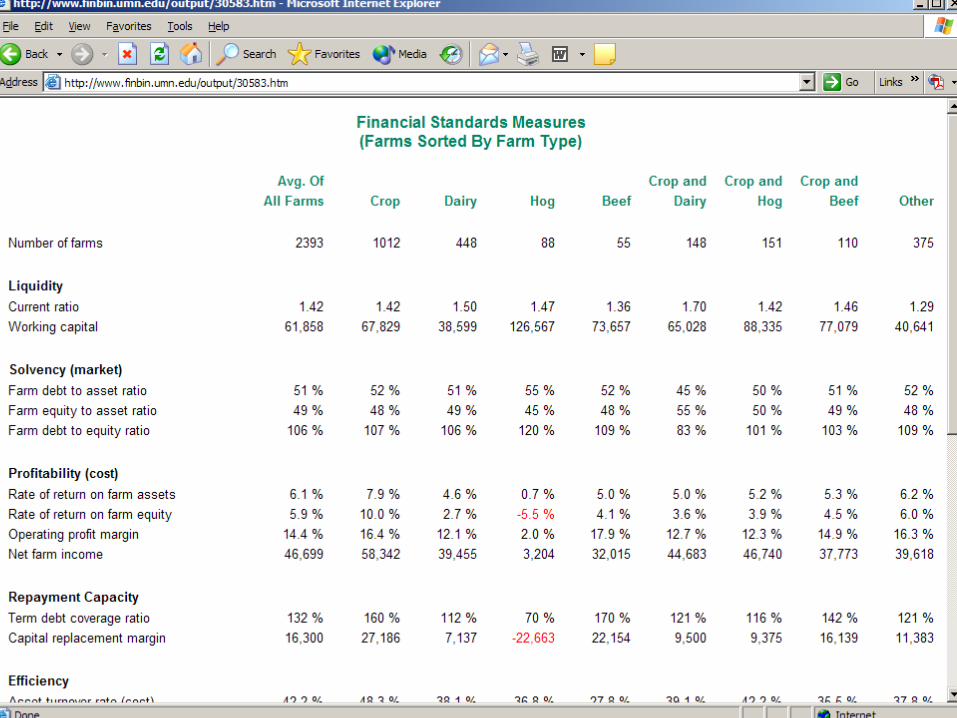
Example Whole Farm Report
Farm Financial Standards Sweet 16 by type of farm
Copyright © 2004 Center for Farm Financial Management, University of Minnesota. All Rights Reserved.
Copyright © 2004 Center for Farm Financial Management, University of Minnesota. All Rights Reserved.
Copyright © 2004 Center for Farm Financial Management, University of Minnesota. All Rights Reserved.
Copyright © 2004 Center for Farm Financial Management, University of Minnesota. All Rights Reserved.
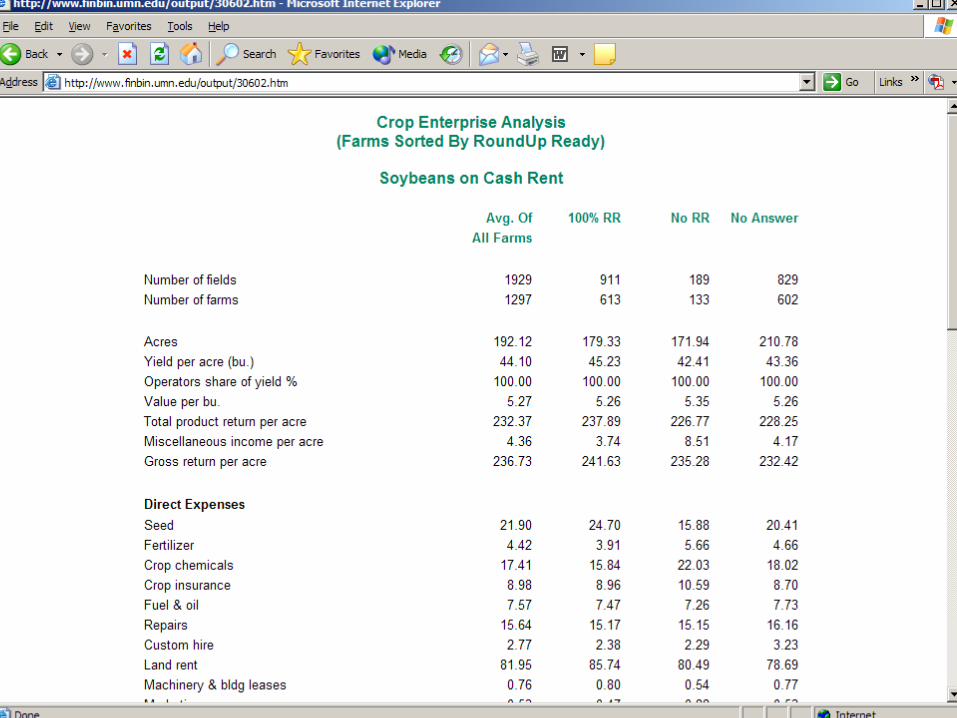
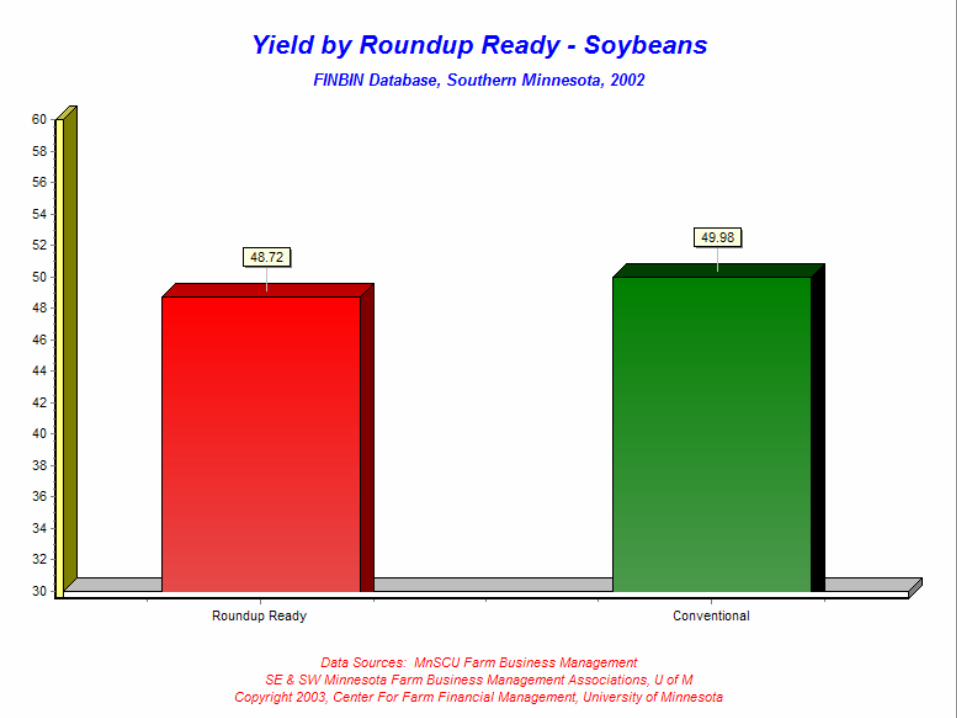
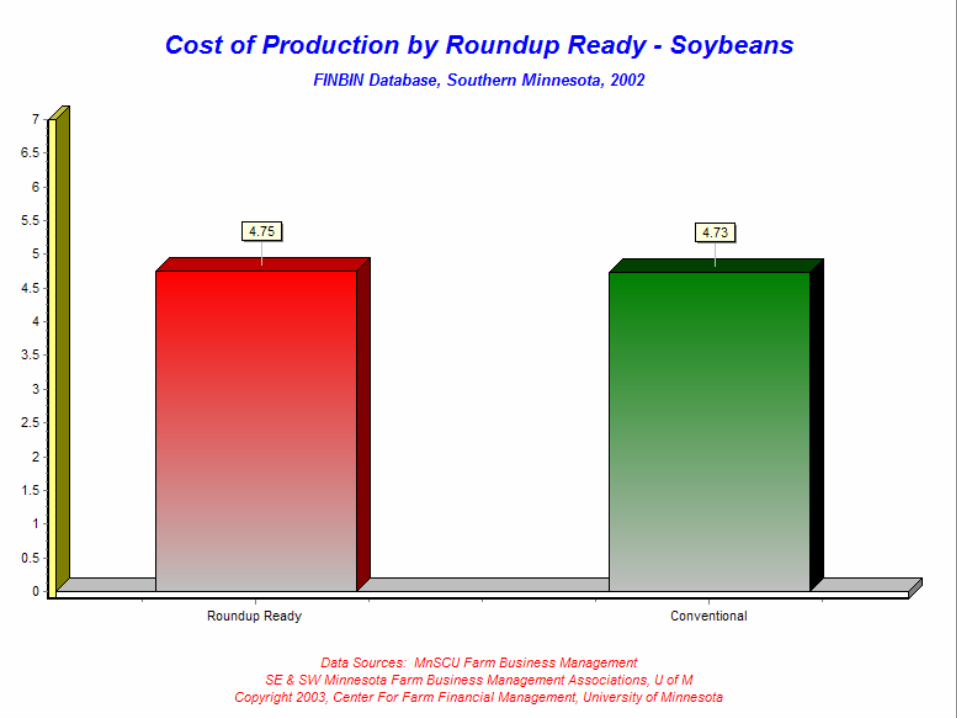
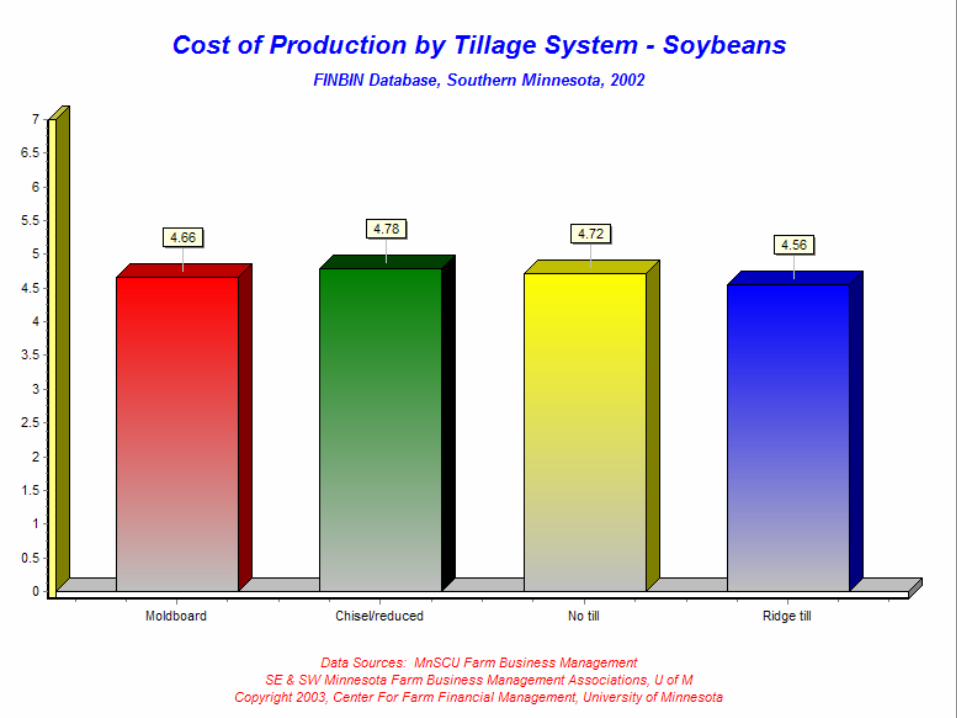
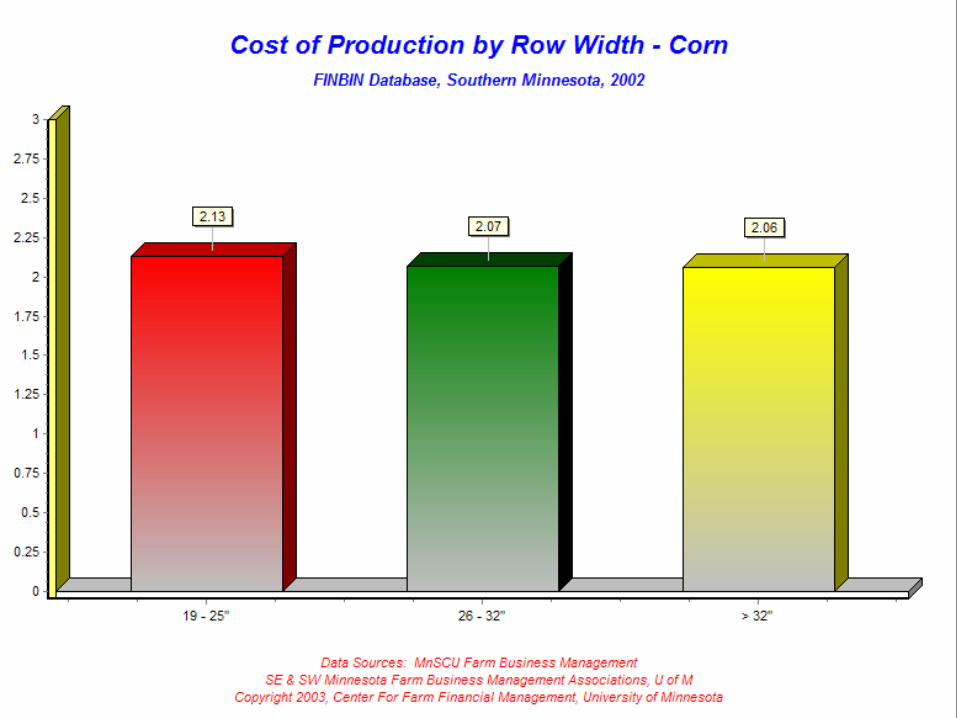
Example Crop Report
Roundup Ready vs. Conventional Soybeans
Copyright © 2004 Center for Farm Financial Management, University of Minnesota. All Rights Reserved.
Copyright © 2004 Center for Farm Financial Management, University of Minnesota. All Rights Reserved.
Copyright © 2004 Center for Farm Financial Management, University of Minnesota. All Rights Reserved.
Copyright © 2004 Center for Farm Financial Management, University of Minnesota. All Rights Reserved.
Copyright © 2004 Center for Farm Financial Management, University of Minnesota. All Rights Reserved.
Copyright © 2004 Center for Farm Financial Management, University of Minnesota. All Rights Reserved.
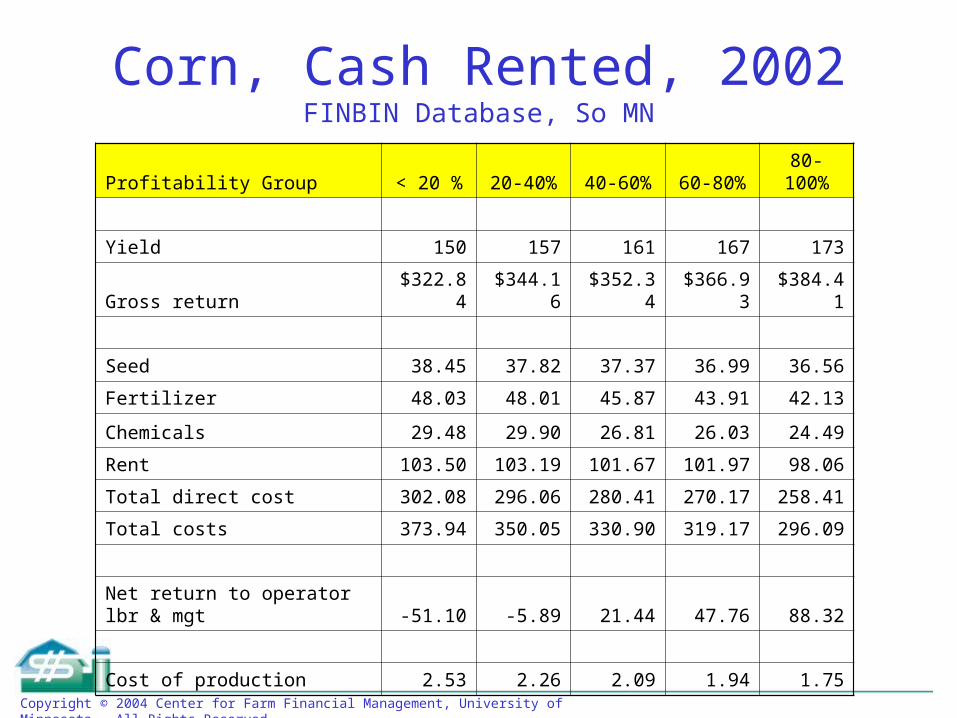
Corn, Cash Rented, 2002FINBIN Database, So MN
Profitability Group < 20 % 20-40% 40-60% 60-80% 80-100%
Yield 150 157 161 167 173
Gross return $322.84 $344.16 $352.34 $366.93 $384.41
Seed 38.45 37.82 37.37 36.99 36.56
Fertilizer 48.03 48.01 45.87 43.91 42.13
Chemicals 29.48 29.90 26.81 26.03 24.49
Rent 103.50 103.19 101.67 101.97 98.06
Total direct cost 302.08 296.06 280.41 270.17 258.41
Total costs 373.94 350.05 330.90 319.17 296.09
Net return to operator lbr & mgt -51.10 -5.89 21.44 47.76 88.32
Cost of production 2.53 2.26 2.09 1.94 1.75
Copyright © 2004 Center for Farm Financial Management, University of Minnesota. All Rights Reserved.
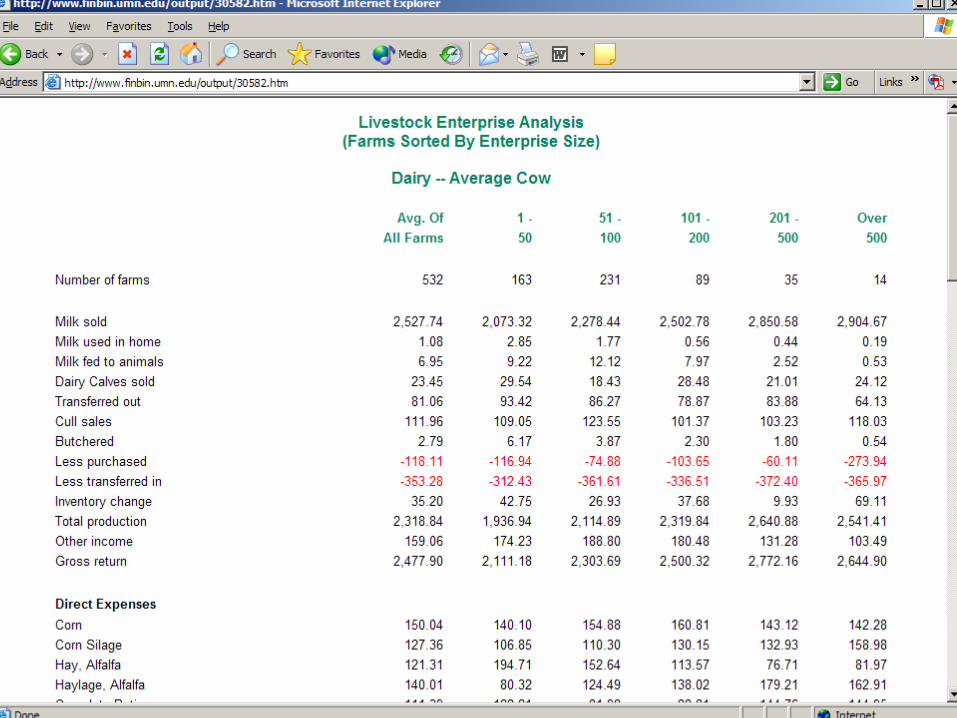
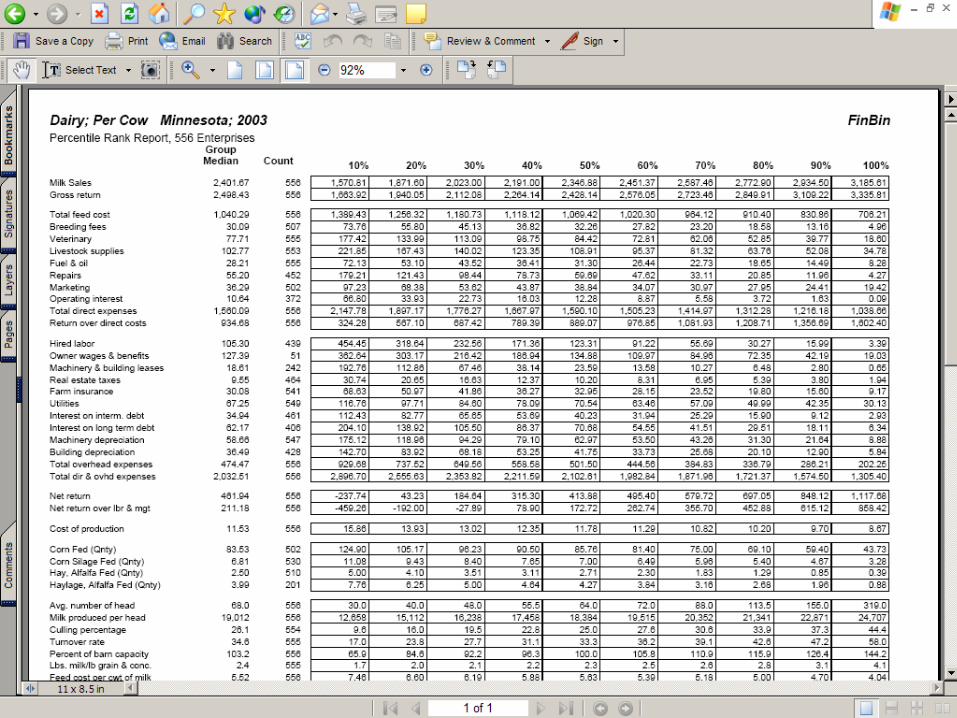
Example Livestock Report
Dairy by Herd Size
Copyright © 2004 Center for Farm Financial Management, University of Minnesota. All Rights Reserved.
Copyright © 2004 Center for Farm Financial Management, University of Minnesota. All Rights Reserved.