Embed Size (px)
Citation preview
Copyright 2002, Pearson Education Canada1
Demand, Supply and Market Equilibrium
Chapter 4

Copyright 2002, Pearson Education Canada2
The Basic Decision-Making Units in the Economy:
Firms and Households

Copyright 2002, Pearson Education Canada3
Firms and Households
A firm is an organization that transforms resources (inputs) into products (outputs). Firms are the primary producing units in a market economy.
Households are the consuming unit in the economy.

Copyright 2002, Pearson Education Canada4
The Entrepreneur
The entrepreneur is the person who organizes, manages, and assumes the risks of a firm, taking a new idea or a new product and turning it into a successful business.
Copyright 2002, Pearson Education Canada5
Markets
Product or output markets are the markets in which goods and services are exchanged.
Input or factor markets are the markets in which resources used to produce products are exchanged
Copyright 2002, Pearson Education Canada6
Labour Markets
Labour markets are the input/factor markets in which households supply work for wages to firms that demand labour.
Copyright 2002, Pearson Education Canada7
Capital Markets
Capital markets are the input/factor markets in which households supply their savings, for interest or for claims to future profits, to firms that demand funds in order to buy capital goods.
Copyright 2002, Pearson Education Canada8
Land Markets
Land markets are the input/factor markets in which households supply land or other real property in exchange for rent.
Copyright 2002, Pearson Education Canada9
Factors of Production
The inputs into the production process. Land, labour, and capital are the three key factors of production.
Copyright 2002, Pearson Education Canada10
The Circular Flow
A circular flow diagram describes the interaction of firms and households in markets for outputs and inputs.

Copyright 2002, Pearson Education Canada11
The Circular Flow of Economic Activity (Figure 4.1)

Copyright 2002, Pearson Education Canada12
Determinants of Household Demand:
The price of the product in questionThe income available to the householdThe households amount of accumulated
wealthThe prices of other products availableTastes and preferencesExpectations about future income, wealth,
and prices
Copyright 2002, Pearson Education Canada13
Quantity Demanded
The quantity demanded represents the amount (number of units) of a product that a household would buy in a given period if it could buy all it wanted at the current market price.

Copyright 2002, Pearson Education Canada14
Changes in Quantity Demanded vs. Changes in Demand
Changes in the price of a product affect the quantity demanded per period. Changes in any other factor, such as income or preferences, affect demand. An increase in income, for instance, tends to increase demand. While a drop in prices will increase the quantity demanded.
Copyright 2002, Pearson Education Canada15
The Demand Schedule
A demand schedule is a table or chart showing how much of a given product a household would be willing to buy at different prices.
Copyright 2002, Pearson Education Canada16
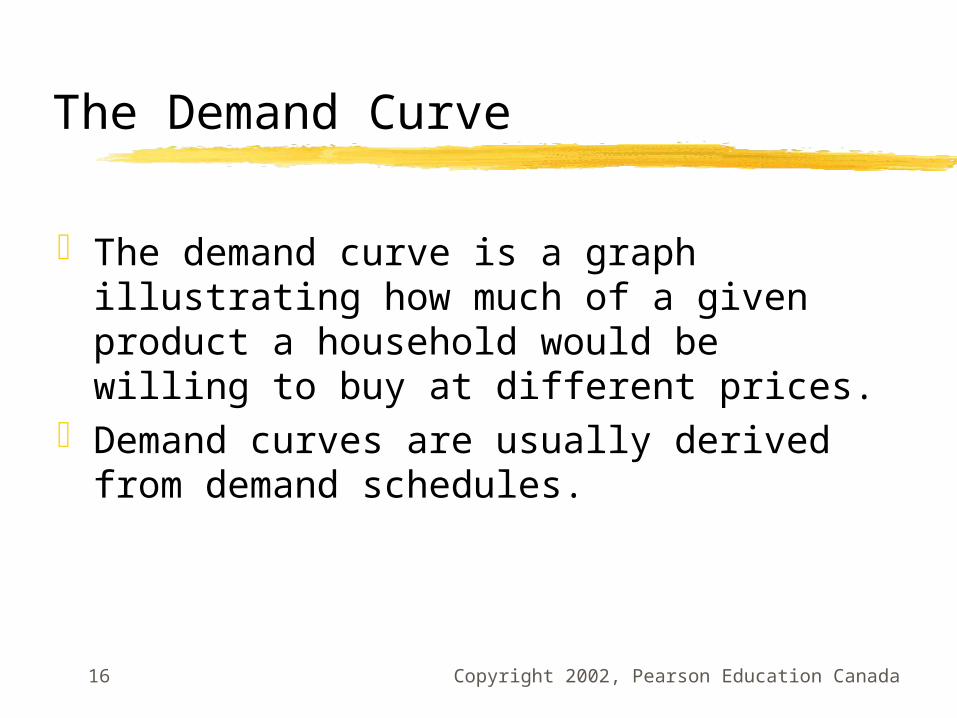
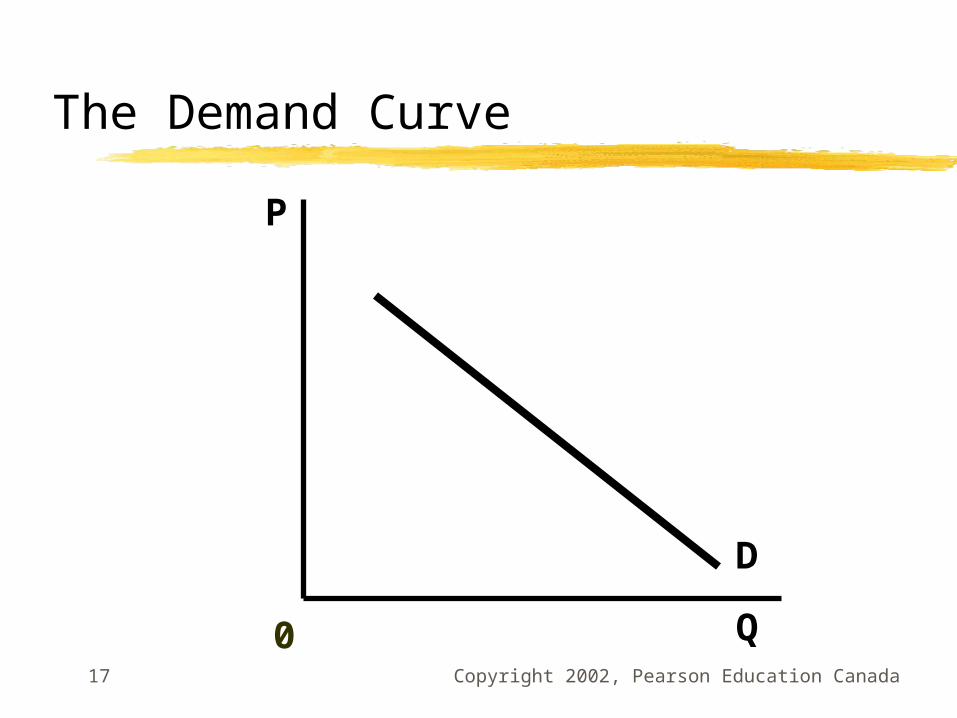
The Demand Curve
The demand curve is a graph illustrating how much of a given product a household would be willing to buy at different prices.
Demand curves are usually derived from demand schedules.
Copyright 2002, Pearson Education Canada17
D
P
Q0
The Demand Curve
Copyright 2002, Pearson Education Canada18
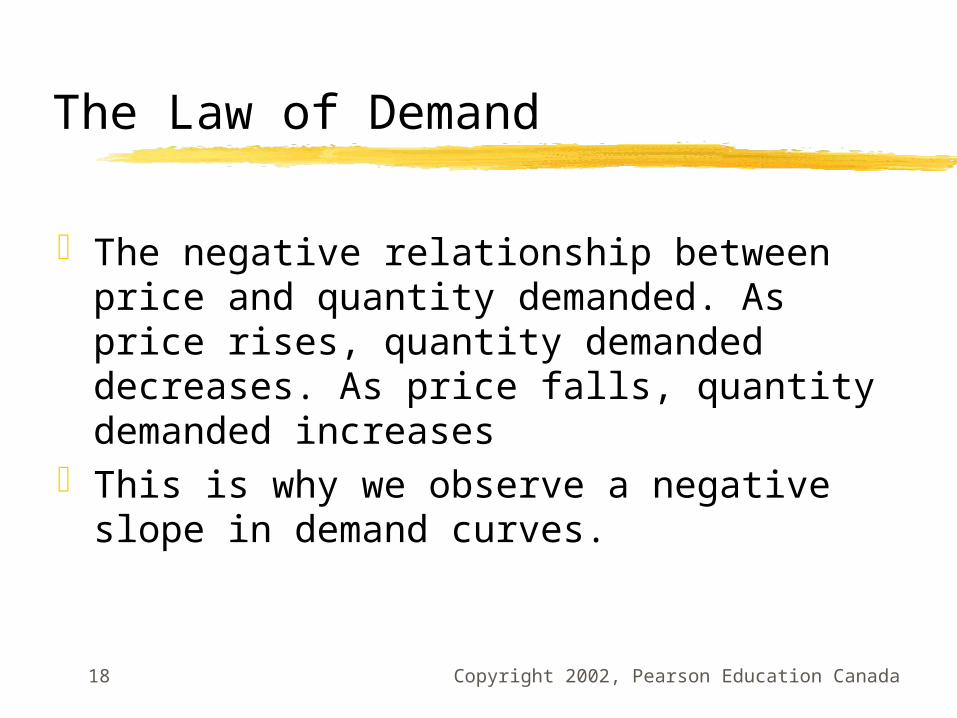
The Law of Demand
The negative relationship between price and quantity demanded. As price rises, quantity demanded decreases. As price falls, quantity demanded increases
This is why we observe a negative slope in demand curves.

Copyright 2002, Pearson Education Canada19
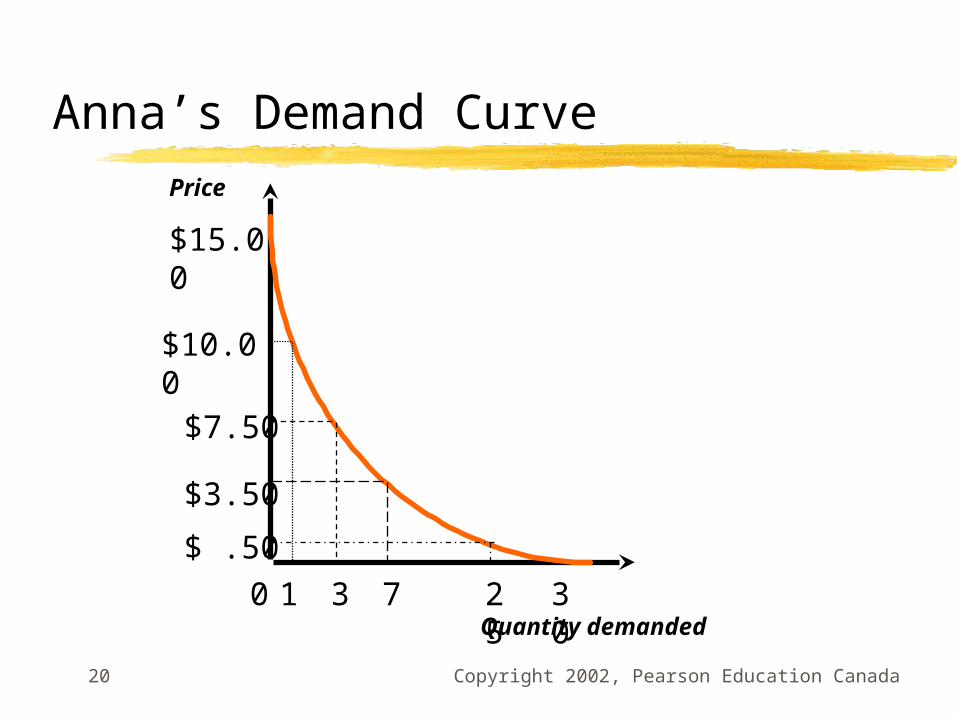
Anna’s Demand Schedule for Telephone Calls (Table 4.1)
Price per call Quantity Demanded incalls per month
0 30
0.50 25
3.50 7
7.00 3
10.00 1
15.00 0
Copyright 2002, Pearson Education Canada20
Anna’s Demand Curve
$15.00
30
$10.00
$7.50
$3.50
$ .50
25
7310Quantity demanded
Price
Copyright 2002, Pearson Education Canada21
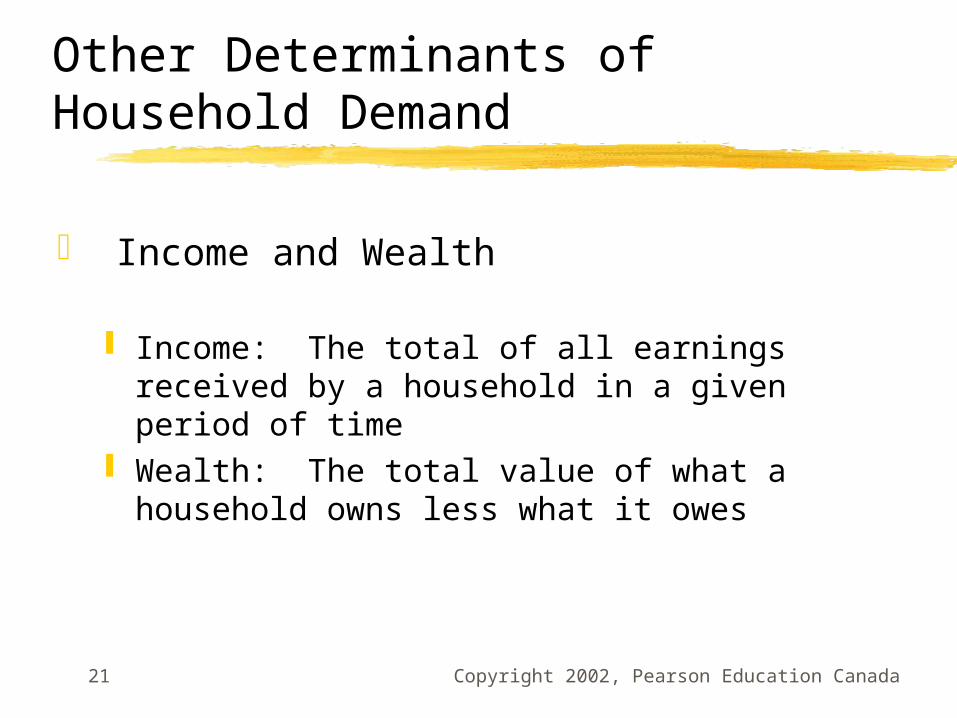
Other Determinants of Household Demand
Income and Wealth
Income: The total of all earnings received by a household in a given period of time
Wealth: The total value of what a household owns less what it owes
Copyright 2002, Pearson Education Canada22
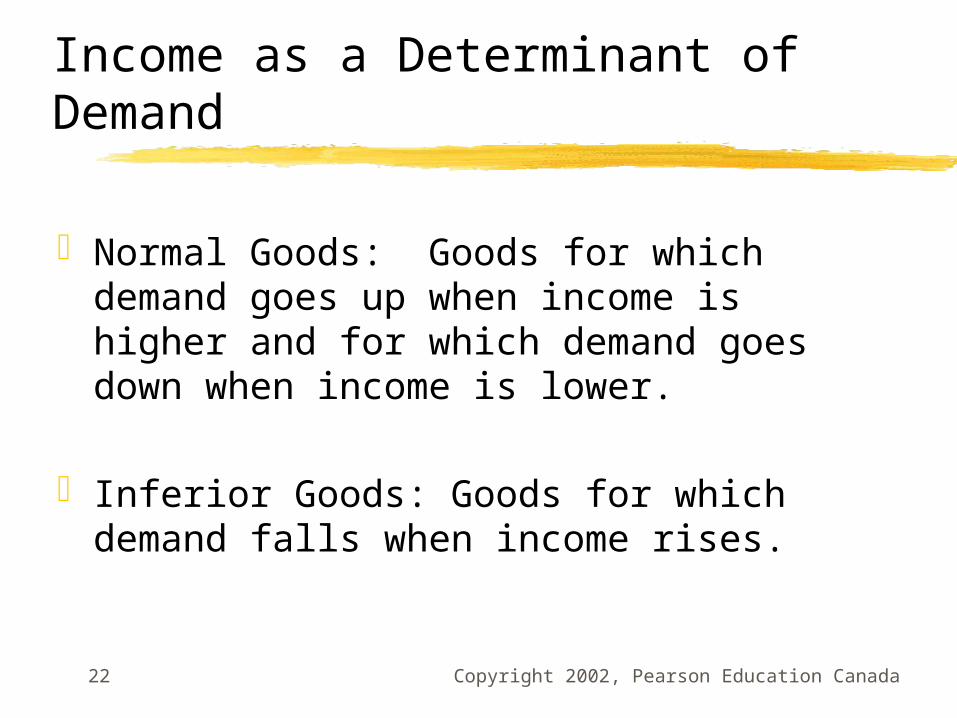
Income as a Determinant of Demand
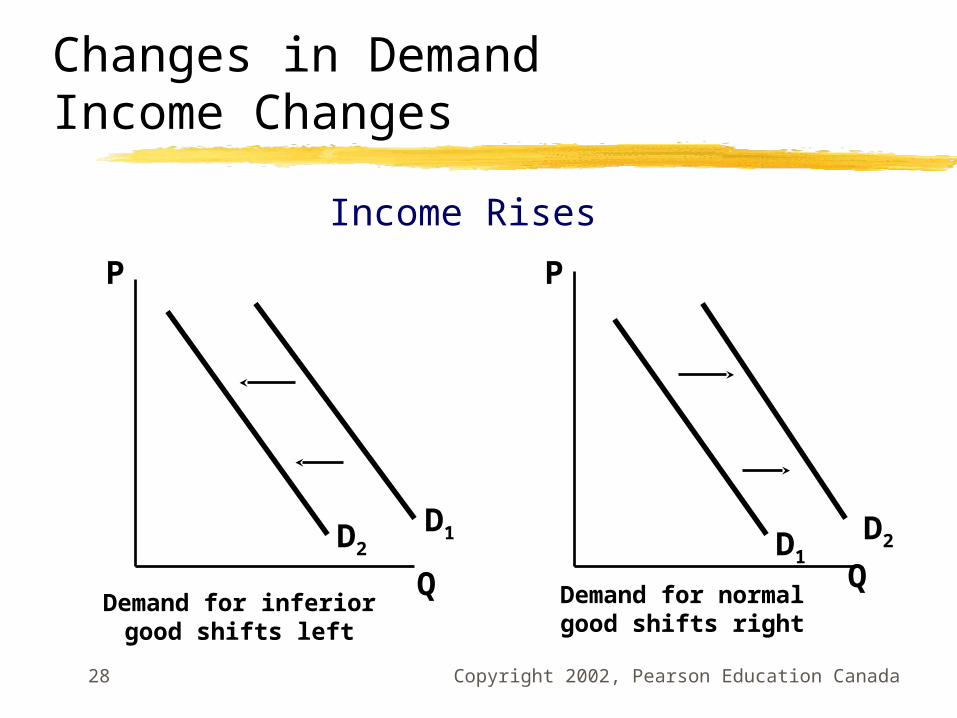
Normal Goods: Goods for which demand goes up when income is higher and for which demand goes down when income is lower.
Inferior Goods: Goods for which demand falls when income rises.
Copyright 2002, Pearson Education Canada23
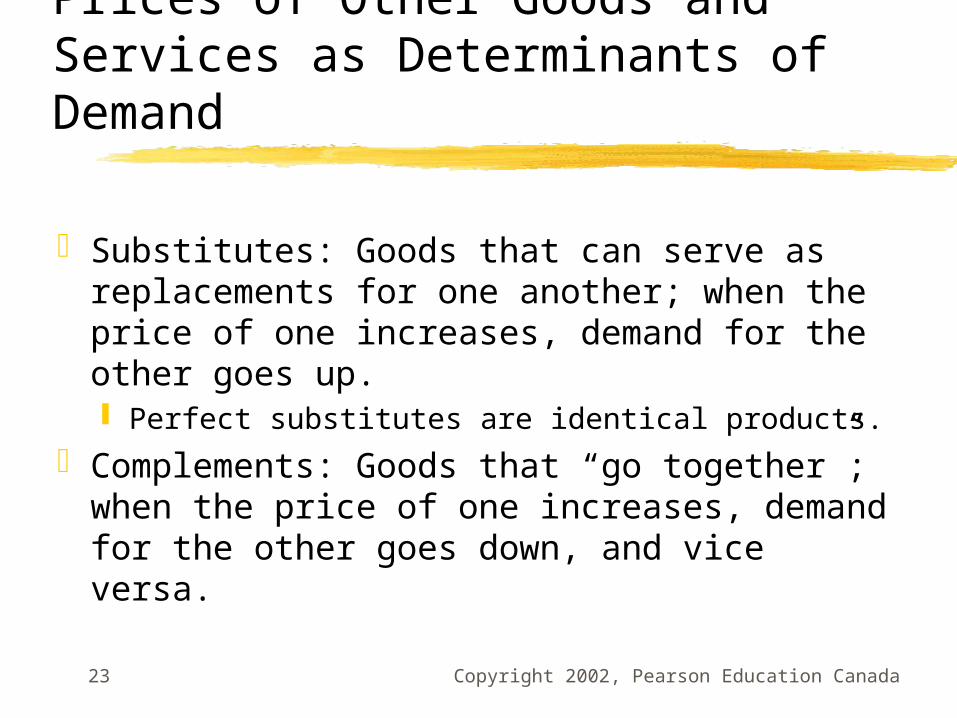
Prices of Other Goods and Services as Determinants of Demand
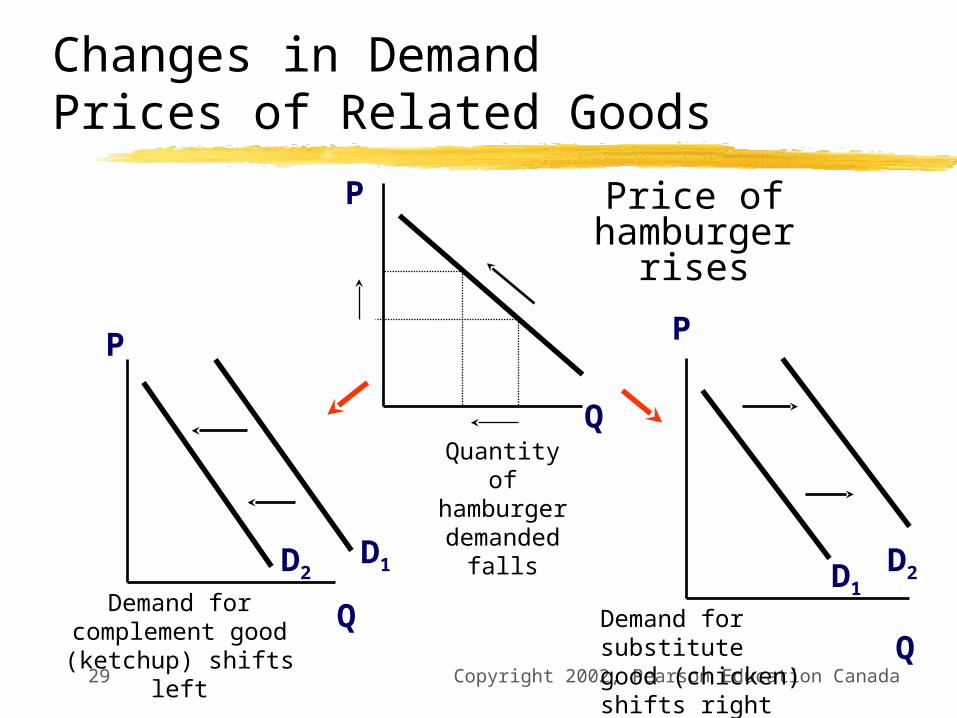
Substitutes: Goods that can serve as replacements for one another; when the price of one increases, demand for the other goes up. Perfect substitutes are identical products.
Complements: Goods that “go together”; when the price of one increases, demand for the other goes down, and vice versa.

Copyright 2002, Pearson Education Canada24
Other Determinants of Household Demand:
Tastes and Preferences - These are quite subjective and tend to change over time.
Expectations - With respect to future income, wealth, prices, and availability.
Copyright 2002, Pearson Education Canada25
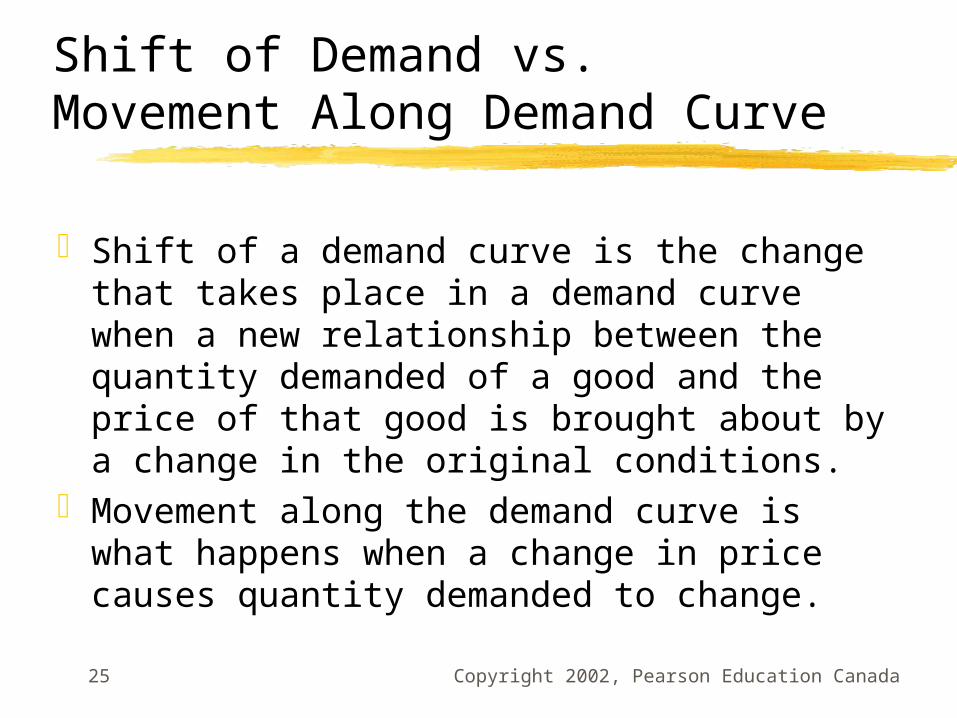
Shift of Demand vs. Movement Along Demand Curve
Shift of a demand curve is the change that takes place in a demand curve when a new relationship between the quantity demanded of a good and the price of that good is brought about by a change in the original conditions.
Movement along the demand curve is what happens when a change in price causes quantity demanded to change.
Copyright 2002, Pearson Education Canada26
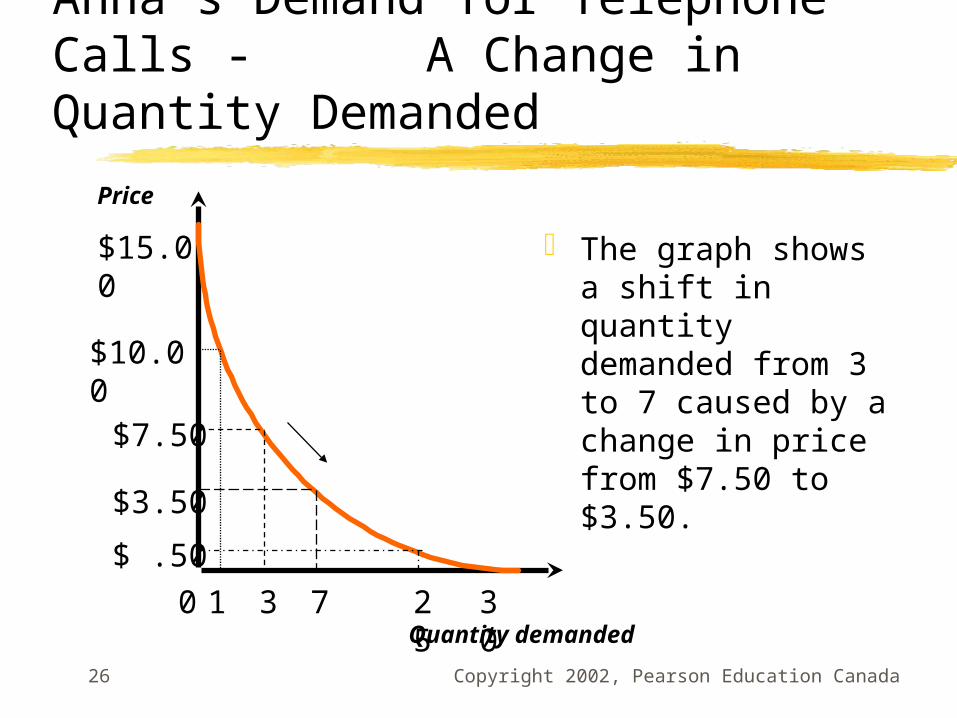
Anna’s Demand for Telephone Calls - A Change in Quantity Demanded
The graph shows a shift in quantity demanded from 3 to 7 caused by a change in price from $7.50 to $3.50.
$15.00
30
$10.00
$7.50
$3.50
$ .50
25
7310Quantity demanded
Price
Copyright 2002, Pearson Education Canada27
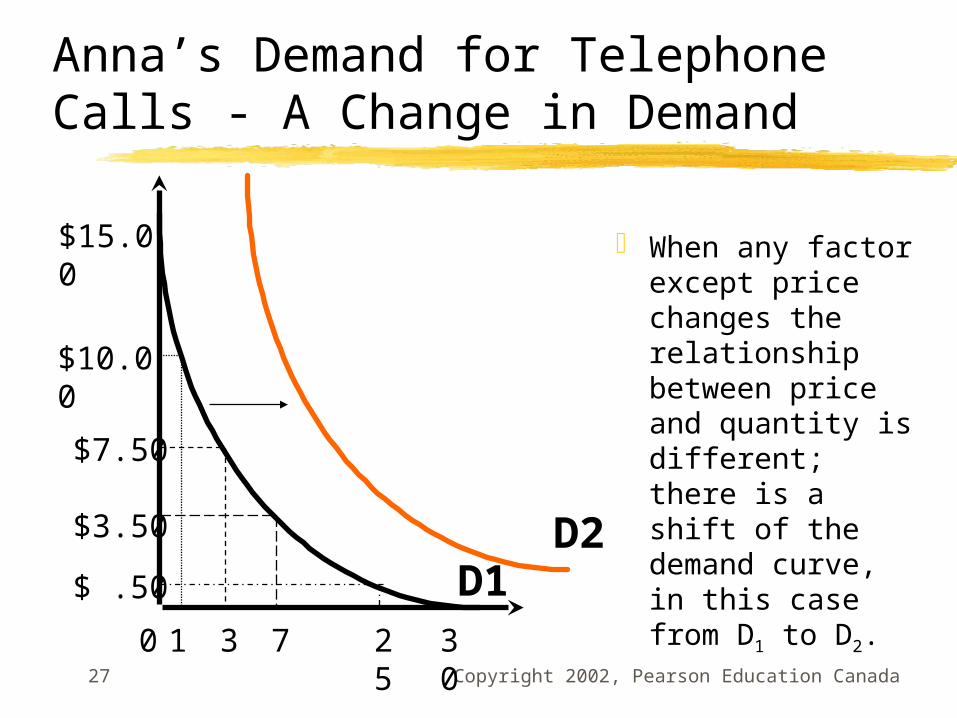
Anna’s Demand for Telephone Calls - A Change in Demand
When any factor except price changes the relationship between price and quantity is different; there is a shift of the demand curve, in this case from D1 to D2.
$15.00
$10.00
$7.50
$3.50
$ .50
7310 30
25
D1D2
Copyright 2002, Pearson Education Canada28
Changes in DemandIncome Changes
Income Rises
P
Q
P
QDemand for normal
good shifts right
D1 D1D2
Demand for inferior good shifts left
D2
Copyright 2002, Pearson Education Canada29
Price of hamburger
rises
P
Q
P
D1D2
Q
P
D1D2
Quantity of hamburger demanded
falls
Demand for complement good
(ketchup) shifts left
Demand for substitute good (chicken) shifts right
Q
Changes in DemandPrices of Related Goods
Copyright 2002, Pearson Education Canada30
From Household to Market Demand
Demand for a good or service can be defined for an individual household, or for a group of households that make up a market.
Copyright 2002, Pearson Education Canada31
Market Demand Defined
Market demand may be defined as the sum of all the quantities of a good or service demanded per period by all the households buying in the market for that good or service.

Copyright 2002, Pearson Education Canada32
DA
P
04 8 Qd 30
$1.50
$3.50DB
Qd0
P
$1.50
$3.50 DC
94 Qd
0
Price
$3.50
$1.50
208 Qd
Market Demand
Deriving market demand from the individual demand curves:
P
$3.50
$1.50

Copyright 2002, Pearson Education Canada33
Supply
A firm’s decision about what quantity of product to supply depends on:
The price of the good or service The cost of producing the product which
depends on:The price of required inputs (land, labour, capital)The technologies to be used to produce the product
The prices of related products
Copyright 2002, Pearson Education Canada34
Quantity Supplied
The amount of a particular product that a firm would be willing and able to offer for sale at a particular price during a given time period.
Copyright 2002, Pearson Education Canada35
The Law of Supply
The positive relationship between price and quantity of a good supplied. An increase in market price will lead to an increase in quantity supplied, and a decrease in market price will lead to a decrease in quantity supplied.
Copyright 2002, Pearson Education Canada36
The Supply Schedule and Supply Curve
A supply schedule is a table, or chart, showing how much of a product firms will supply at different prices.
A supply curve is a graph illustrating how much of a product a firm will supply at different prices.
Copyright 2002, Pearson Education Canada37
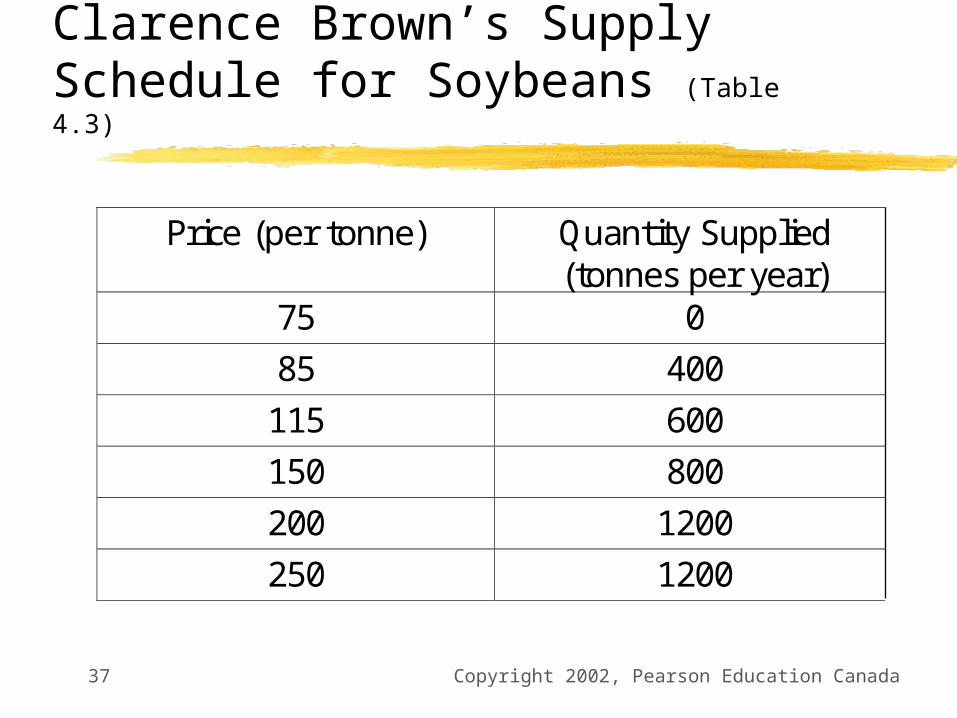
Clarence Brown’s Supply Schedule for Soybeans (Table 4.3)
Price (per tonne) Quantity Supplied(tonnes per year)
75 0
85 400
115 600
150 800
200 1200
250 1200
Copyright 2002, Pearson Education Canada38
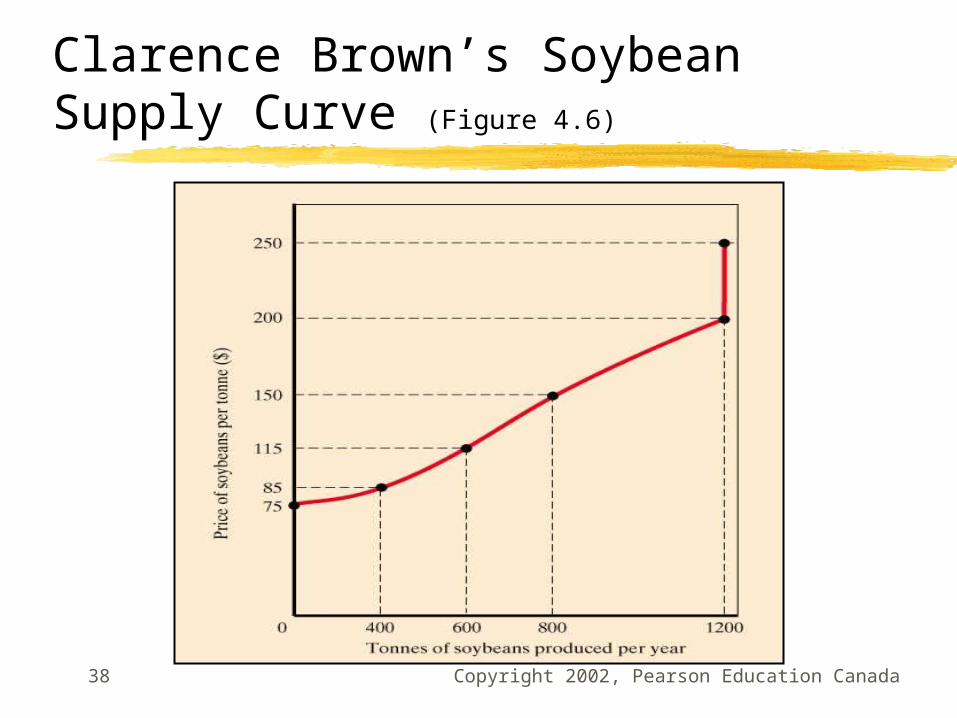
Clarence Brown’s Soybean Supply Curve (Figure 4.6)
Copyright 2002, Pearson Education Canada39
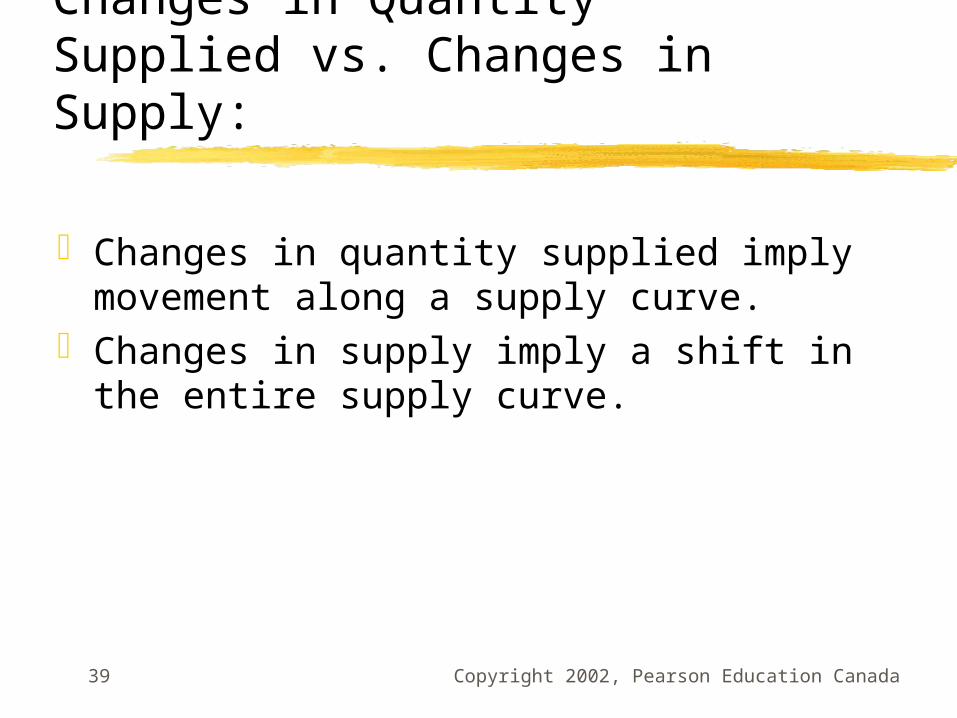
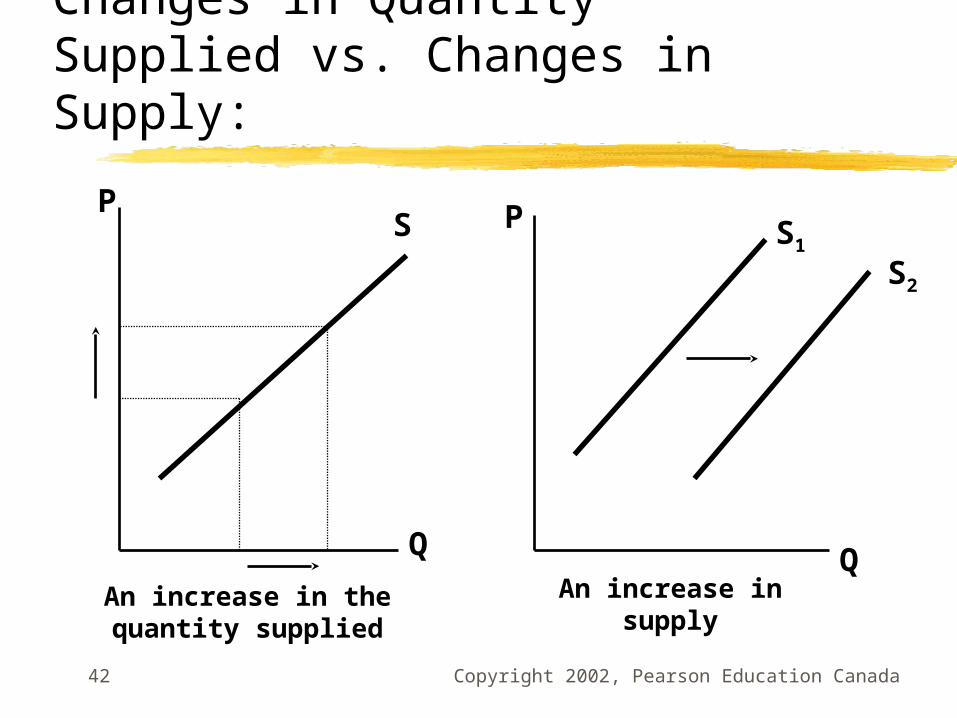
Changes in Quantity Supplied vs. Changes in Supply:
Changes in quantity supplied imply movement along a supply curve.
Changes in supply imply a shift in the entire supply curve.
Copyright 2002, Pearson Education Canada40
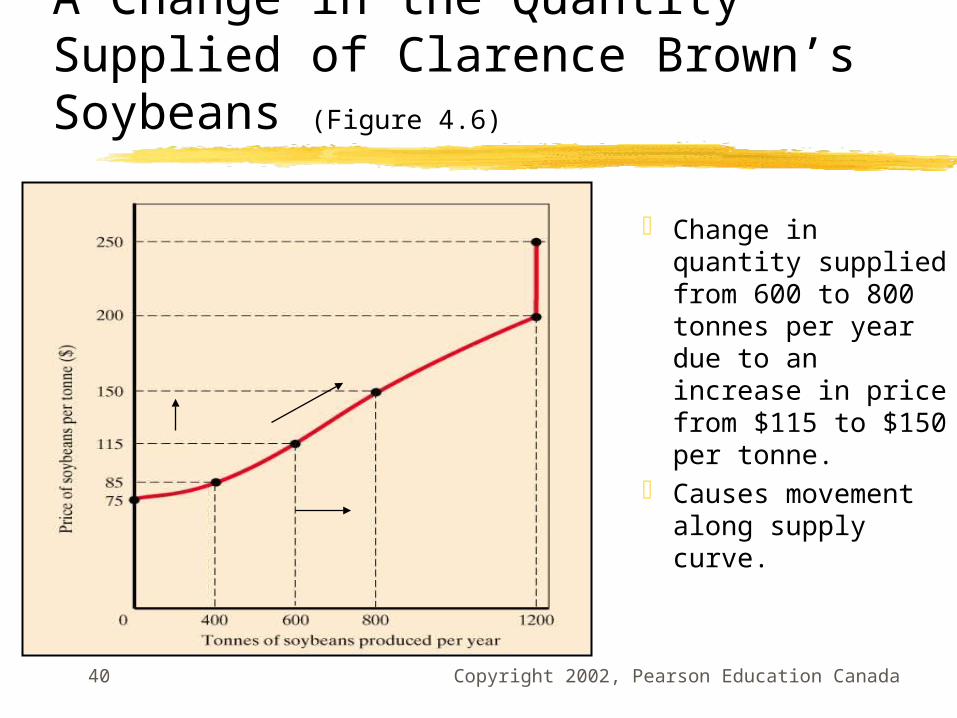
Change in quantity supplied from 600 to 800 tonnes per year due to an increase in price from $115 to $150 per tonne.
Causes movement along supply curve.
A Change in the Quantity Supplied of Clarence Brown’s Soybeans (Figure 4.6)
Copyright 2002, Pearson Education Canada41
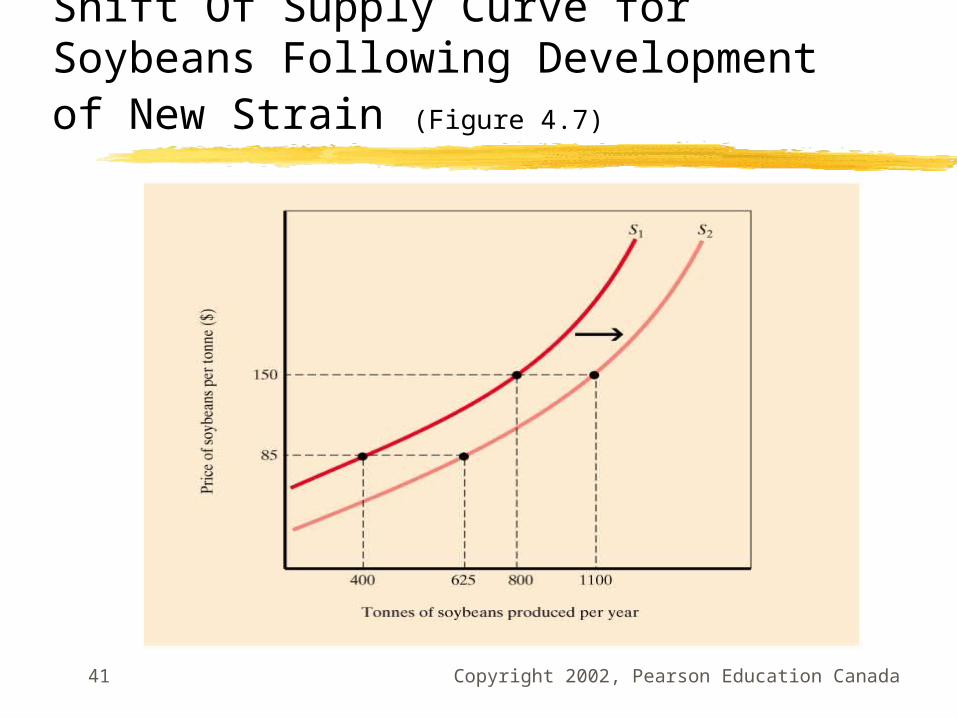
Shift Of Supply Curve for Soybeans Following Development of New Strain (Figure 4.7)
Copyright 2002, Pearson Education Canada42
Q
PS S1
S2
P
Q An increase in the quantity supplied
An increase in supply
Changes in Quantity Supplied vs. Changes in Supply:
Copyright 2002, Pearson Education Canada43
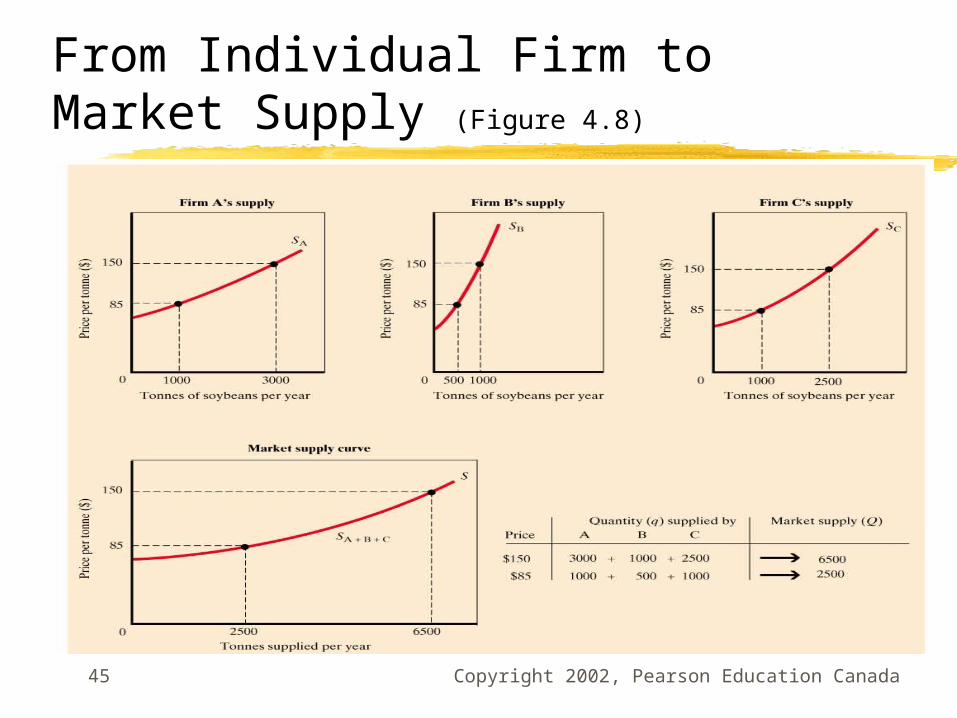
From Individual Firm to Market Supply
The supply of a good or service can be defined for an individual firm, or for a group of firms that make up a market or an industry.
Copyright 2002, Pearson Education Canada44
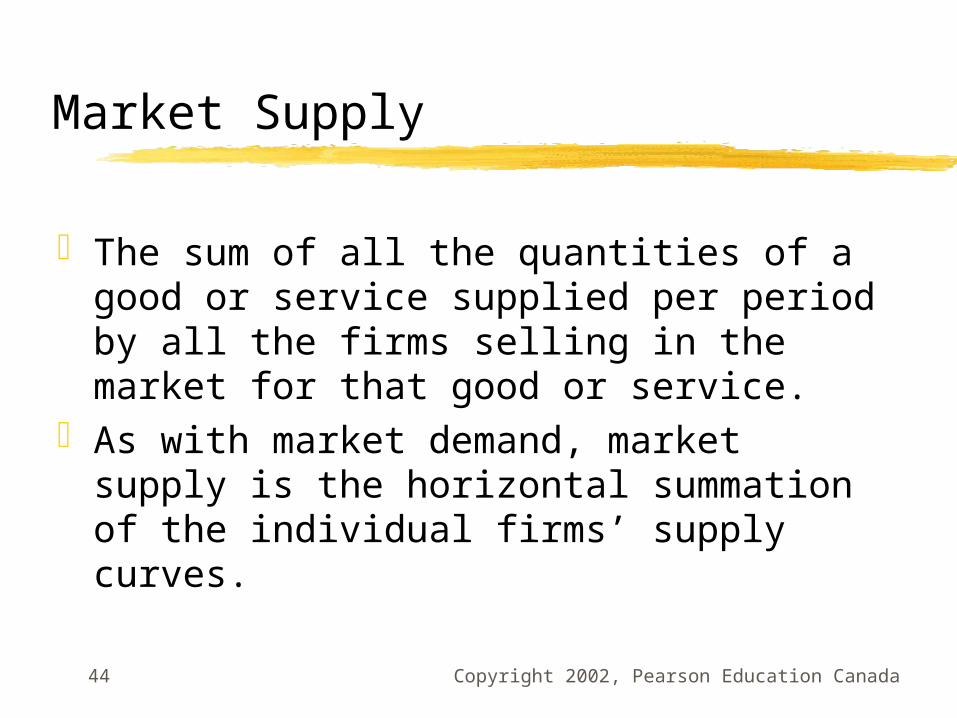
Market Supply
The sum of all the quantities of a good or service supplied per period by all the firms selling in the market for that good or service.
As with market demand, market supply is the horizontal summation of the individual firms’ supply curves.
Copyright 2002, Pearson Education Canada45
From Individual Firm to Market Supply (Figure 4.8)

Copyright 2002, Pearson Education Canada46
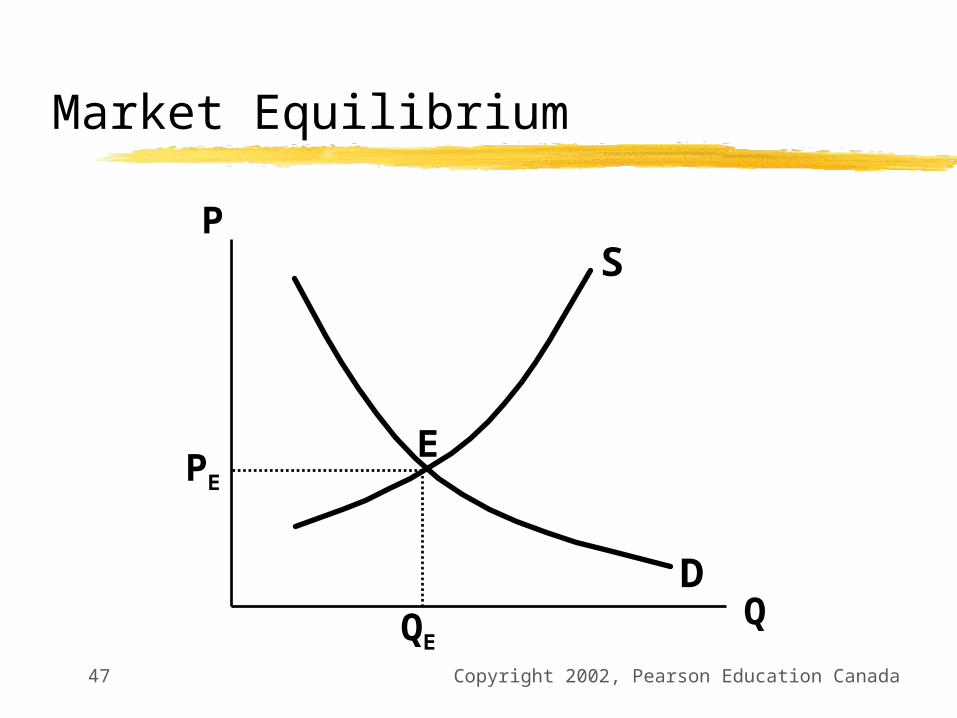
Market Equilibrium
The operation of the market depends on the interaction between suppliers and demanders.
An equilibrium is the condition that exists when quantity supplied and quantity demanded are equal.
At equilibrium, there is no tendency for the price to change.
Copyright 2002, Pearson Education Canada47
Market Equilibrium
P
Q
PE
QE
E
S
D
Copyright 2002, Pearson Education Canada48
0 Tonnes of Soybeans
D
S
125
3500
P
$ per tonne
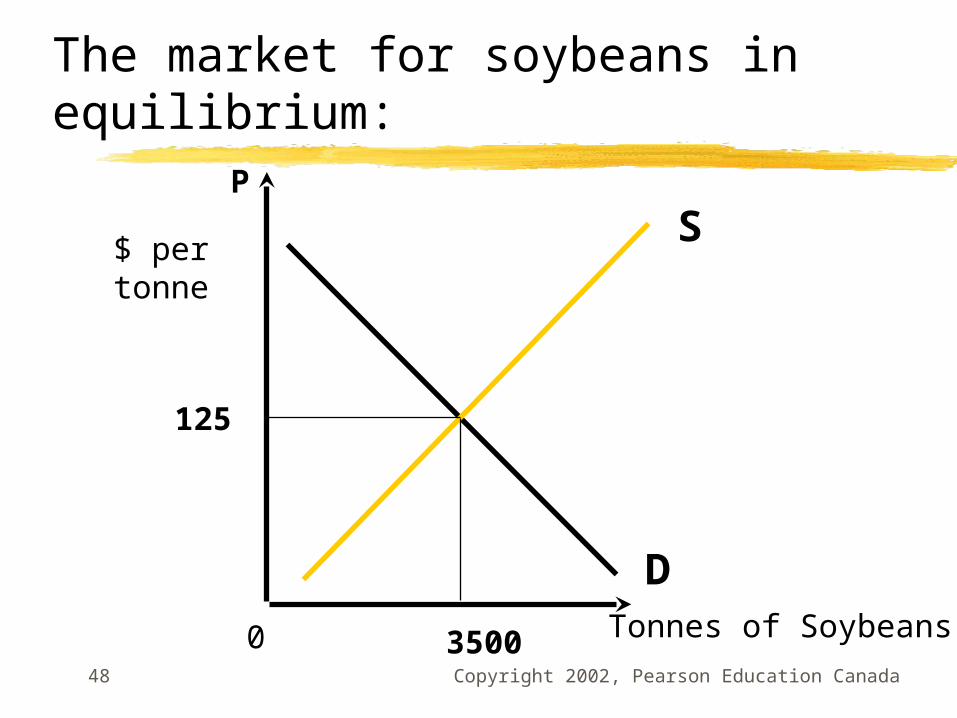
The market for soybeans in equilibrium:

Copyright 2002, Pearson Education Canada49
Excess Demand
Excess Demand is the condition that exists when quantity demanded exceeds quantity supplied at the current price.
Copyright 2002, Pearson Education Canada50
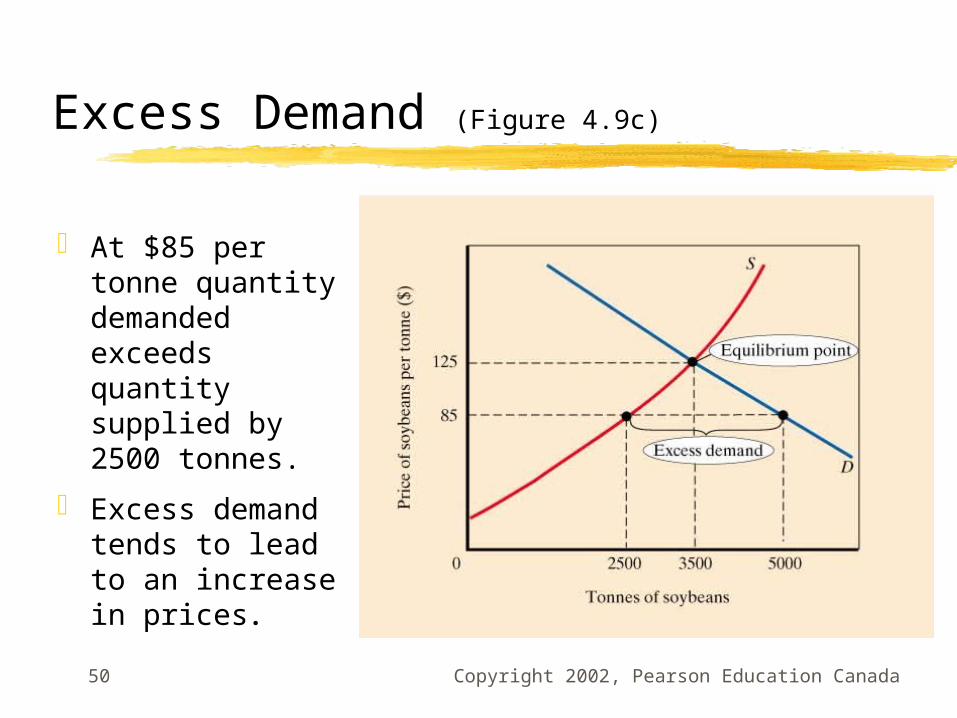
Excess Demand (Figure 4.9c)
At $85 per tonne quantity demanded exceeds quantity supplied by 2500 tonnes.
Excess demand tends to lead to an increase in prices.

Copyright 2002, Pearson Education Canada51
Excess Supply
Excess supply is the condition that exists when quantity supplied exceeds quantity demanded at the current price.
Copyright 2002, Pearson Education Canada52
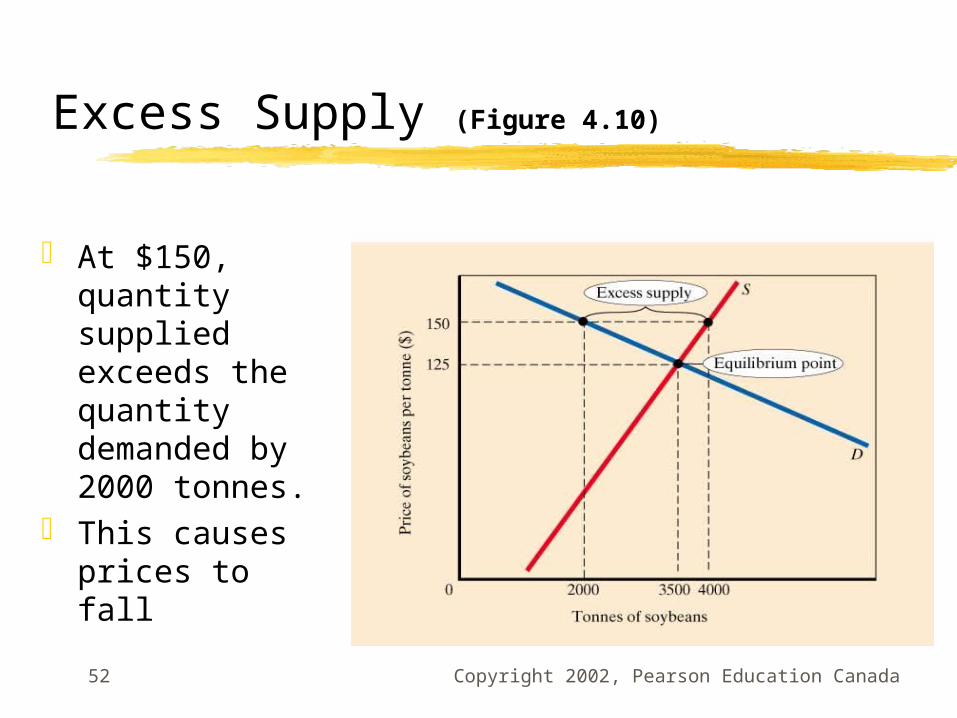
Excess Supply (Figure 4.10)
At $150, quantity supplied exceeds the quantity demanded by 2000 tonnes.
This causes prices to fall
Copyright 2002, Pearson Education Canada53
D1D2
S
Q
P
Q1 Q2
P2
P1
D2
SP
QQ 2
Q1
P1
P2
Increase in Demand
Decrease in Demand
D1
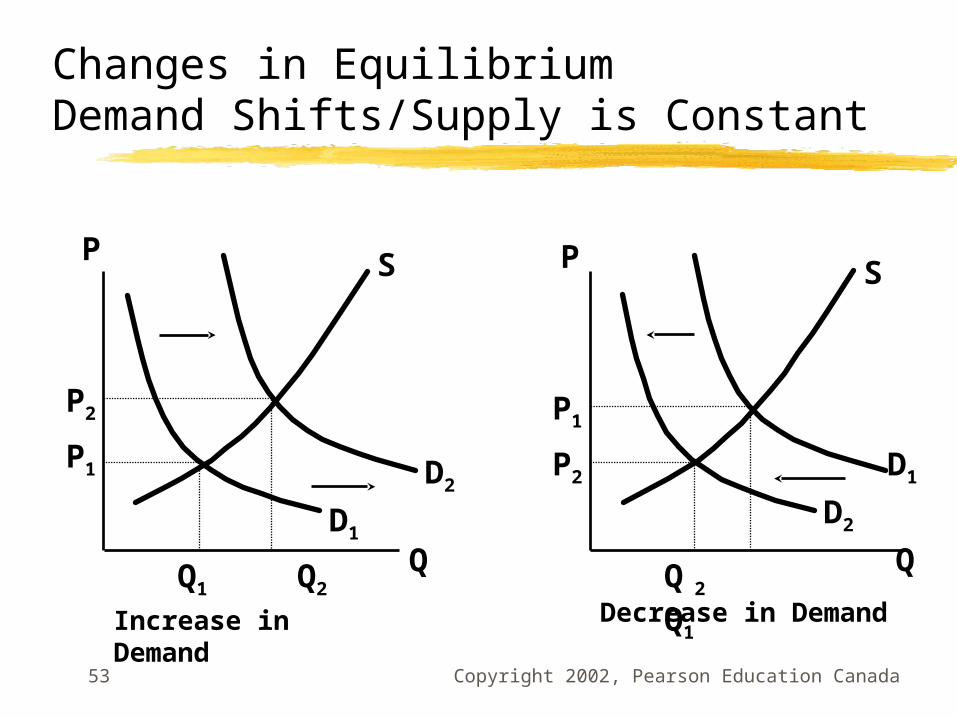
Changes in EquilibriumDemand Shifts/Supply is Constant
Copyright 2002, Pearson Education Canada54
DD
S1
Q
P
Q1 Q2
P2
P1
S1P
QQ 2
Q1
P1
P2
Increase in Supply
Decrease in Supply
S2
S2
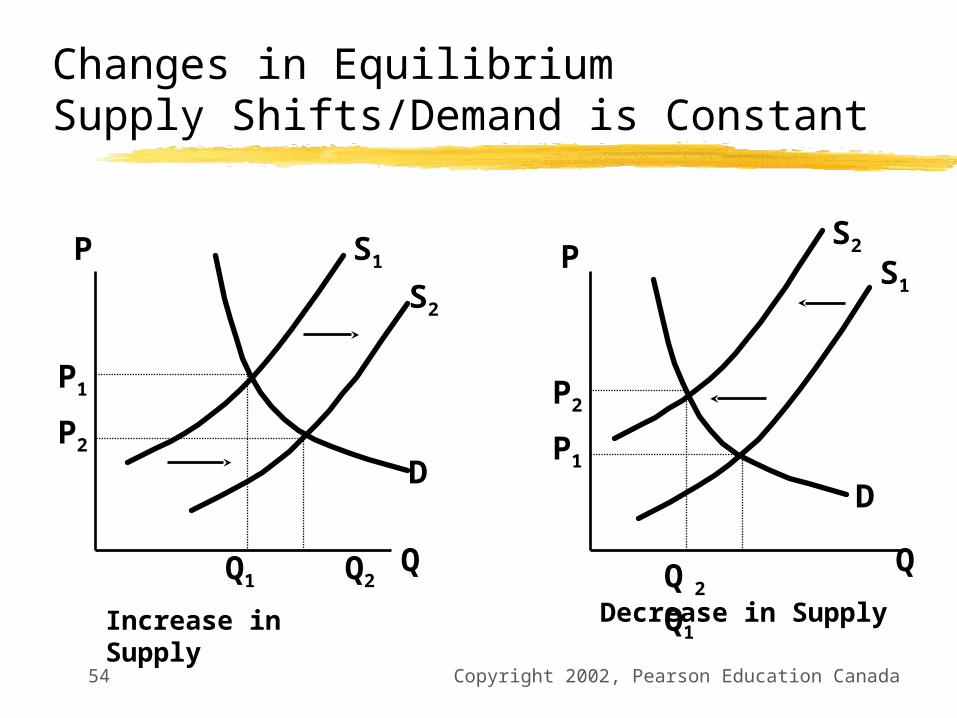
Changes in EquilibriumSupply Shifts/Demand is Constant
Copyright 2002, Pearson Education Canada55
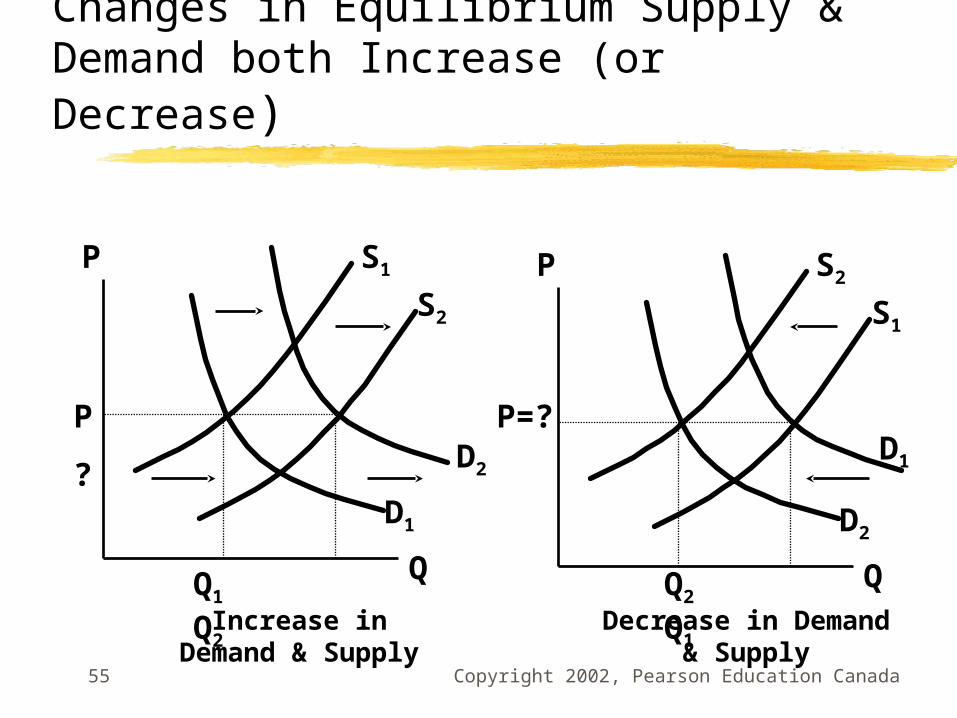
D1
S1
Q
P
Q1 Q2
P
?
Increase in Demand & Supply
Decrease in Demand & Supply
S2
D2
D2
S2
Q
P
Q2 Q1
S1
D1
P=?
Changes in Equilibrium Supply & Demand both Increase (or Decrease)
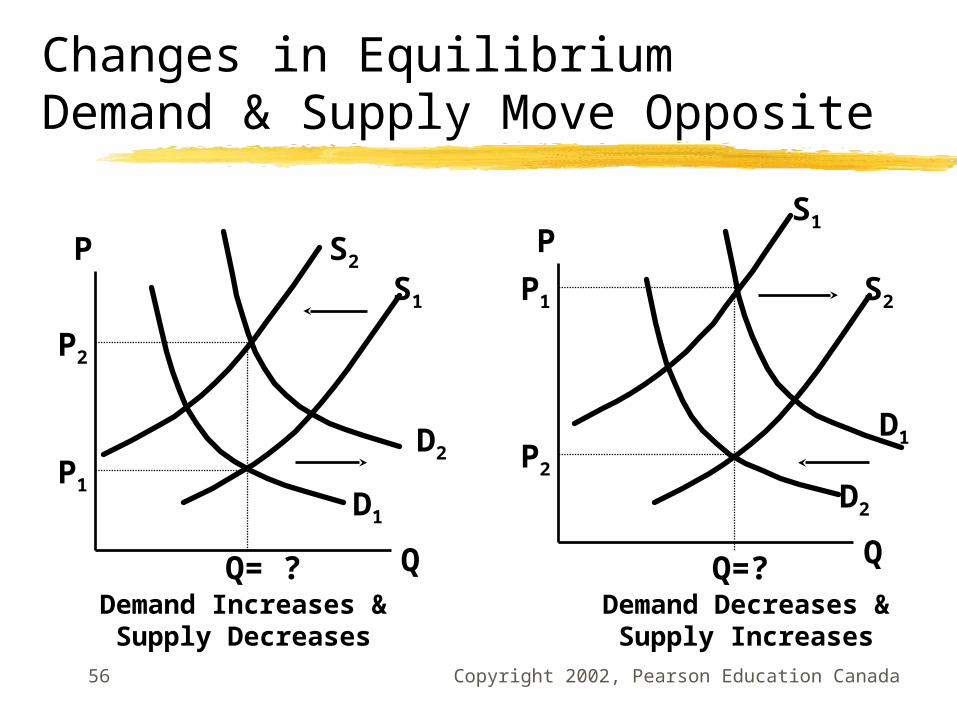
Copyright 2002, Pearson Education Canada56
D1
S1
Q
P
Q= ?Demand Increases &
Supply DecreasesDemand Decreases & Supply Increases
S2
D2
D2
S2
Q
P
Q=?
S1
D1
P1
P2
P1
P2
Changes in EquilibriumDemand & Supply Move Opposite

Copyright 2002, Pearson Education Canada57
Review Terms & Concepts
capital Market complements,
complementary Goods demand curve demand schedule entrepreneur equilibrium excess demand excess supply
factors of production firm households income inferior goods input or factor
markets labour market land market
Copyright 2002, Pearson Education Canada58
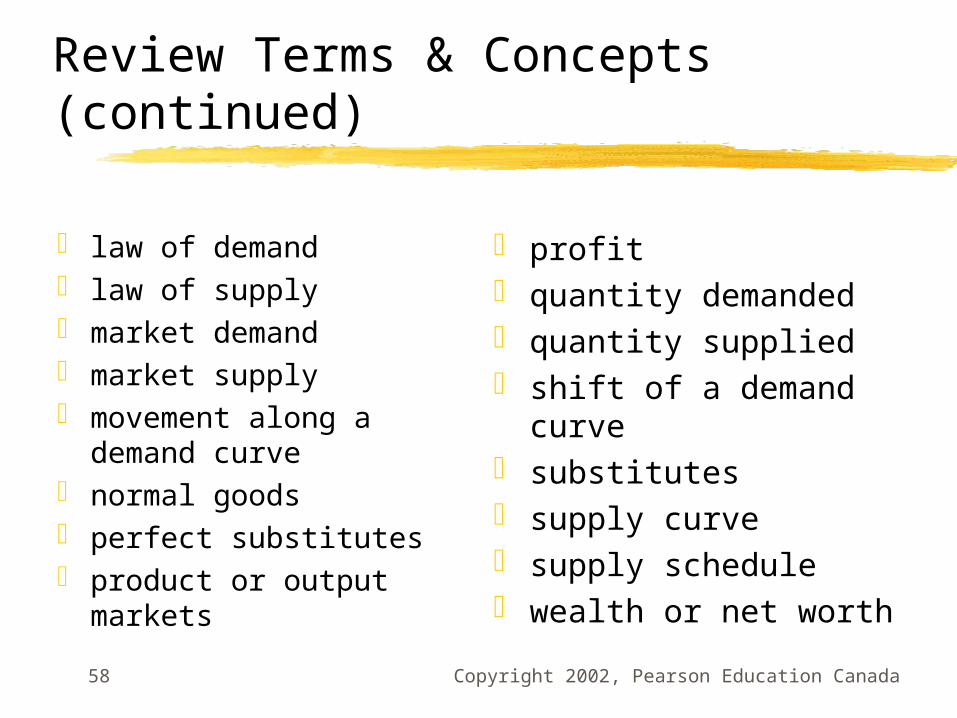
Review Terms & Concepts(continued)
law of demand law of supply market demand market supply movement along a
demand curve normal goods perfect substitutes product or output
markets
profit quantity demanded quantity supplied shift of a demand
curve substitutes supply curve supply schedule wealth or net worth