Embed Size (px)
Citation preview

Copyright, 1996 © Dale Carnegie & Associates, Inc.
National symposium at Elphinston college, Mumbai7th Jan, 2012
“Relative sensitivity of a marine clams to WSFs of crude oil”
Dr Snehal. S. Donde, Principal,
PNDC, Santacruz. (E), Mumbai- 400055 Email Id: [email protected]

Inevitable oil spills
Two Panamanian cargo ships - MSC Chitra and the MV Khalijia-III collided off the Mumbai coast, triggering an oil spill, on August 7, 2010-800 tonnes
Mumbai-Uran pipeline spill- January 21, 2011-55 tones
The oil slick as seen from space by NASA’s Terra satellite on May 24, 2010 Location Gulf of Mexico near
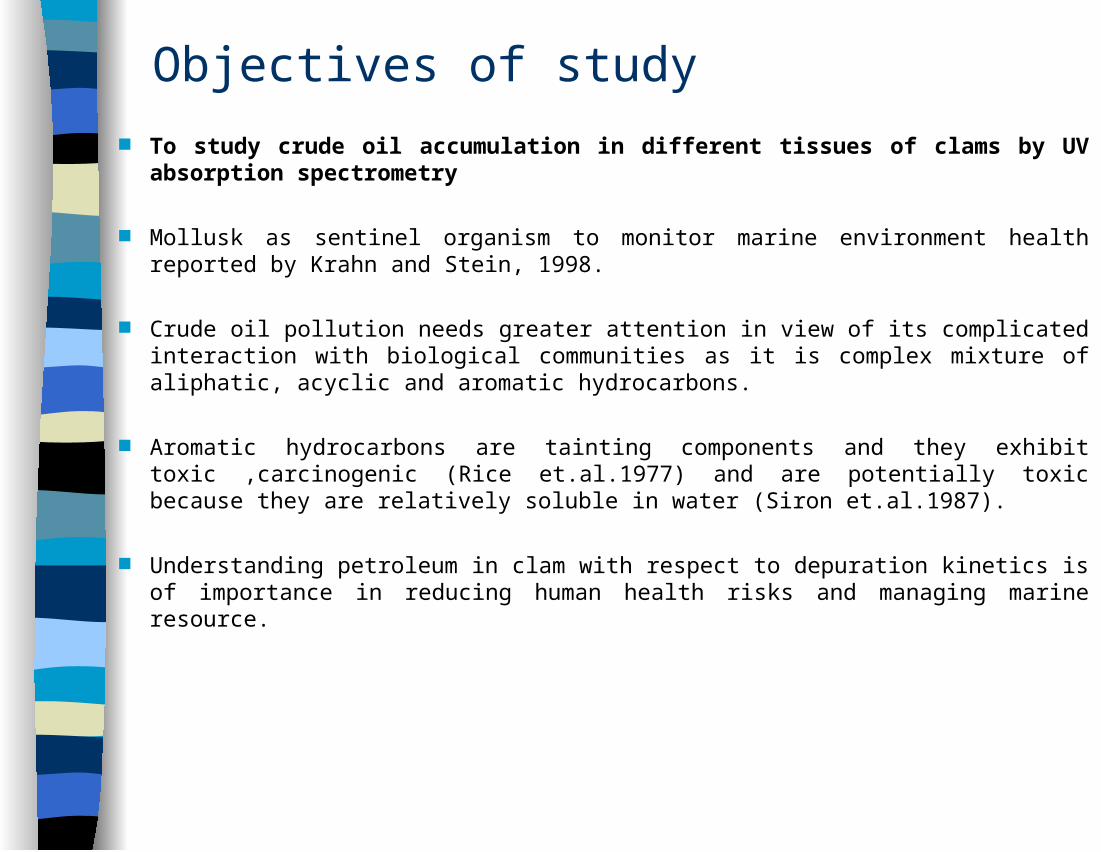
Objectives of study
To study crude oil accumulation in different tissues of clams by UV absorption spectrometry
Mollusk as sentinel organism to monitor marine environment health reported by Krahn and Stein, 1998.
Crude oil pollution needs greater attention in view of its complicated interaction with
biological communities as it is complex mixture of aliphatic, acyclic and aromatic hydrocarbons.
Aromatic hydrocarbons are tainting components and they exhibit toxic ,carcinogenic (Rice et.al.1977) and are potentially toxic because they are relatively soluble in water (Siron et.al.1987).
Understanding petroleum in clam with respect to depuration kinetics is of importance in reducing human health risks and managing marine resource.

Introduction After a spill, hydrocarbons are subjected to physicochemical processes such as evaporation or
photochemical oxidation which produce changes in oil composition.
But the most important process acting on the spilled oil is biodegradation. Most crude oils are biodegradable to a great extent, especially components as short linear alkanes or simple aromatic hydrocarbons.
However, the heavy fraction, made of long-chain saturated and polyaromatic hydrocarbons and a considerable fraction of asphaltenes and resins, is generally recalcitrant to degradation.
Intertidal organisms are vulnerable to chronic pollution through oil spills on beaches and coated habitat may retain oil for long periods
Comparative acute toxicity study of WSFs of BH and PG crude oil on commercially important bivalves by static bioassay method .
Investigate effect of WSFs of crude oil on species of Venerid clams namely, hard shelled Gafrarium divaricatum and soft shelled Dosinia fibula ( Reeve).

Materials and methods Collection of experimental clams (length 30-35mm) and their acclimatization (7days). The clams
were kept in filtered sea water during experimental period of 120 hrs.
Preparation of Water Soluble Fractions of PG/BH crude oil.
Evaluations of effects of WSFs on clams by static oil bioassay method (Rice et al., 1979, Lee et al.,1972).
All the samples were analysed five times and all values are averages of five extractions of clams
A series of stock WSFs were prepared (10%, 20%, and 30 % concentrations by v/v oil-water mixing ) by proportional oil and sea water mixing at constant temperature (Neff and Anderson,1977).
Weights of hydrocarbon residues in the test solutions ranged from 5.8 ppb to 583.6 ppb. (The sub-lethal petroleum hydrocarbon concentrations ranged from 1750.8 ugl –1 (30%WSF stock ) to 175.80ug l-1 (10%WSF stock dilutions ).

Material & Method Cont-----
Tissue PAH was determined as per the method of Pierce et. al., 1986.
WSFs measured by UV fluorescence analysis of hexane extracts using an excitation wavelength of 310 nm and an emission wavelength of 360 nm.
The sub samples extracted were scanned for absorbance at 2930 cm-1 with a Perkin Elmer Model 700 Infrared spectrophotometer
Hydrocarbon concentrations were determined by comparison with standard curves prepared for BH crude oil used in this study
Computation of LC50 values by PROBIT analysis (Finney,1978) and values were then subjected to the test for parallelism and relative potency of WSFs of crude oil for 48, 72, 96 and 120hrs according to the nomographic method given by Litchfield and Wilcoxon (1949).
Relative PHC concentration in various tissues i.e. Gill, hepatopancreas, adductor muscles and whole body burden were determined in clams exposed for 96hr in WSF dilutions and followed by depuration period.

Tissue PAH by Pierce et. al., (1986) method To estimate PAH levels, the clam specimens were carefully rinsed several times in
distilled water to remove surface absorbed petroleum hydrocarbons, blotted dry and weighed.
Tissues were saponified with 5N KOH and were extracted with hexane (50 ml x 3), the organic layer was dried over Na2SO4 and the residues were collected.
The aliphatic and aromatic fractions were separated by column chromatography on alumina by using n-hexane and n-hexane-dichloromethane (7:3) as the eluents.
The tissue and water samples were analyzed routinely for PAH concentration by UV spectrophotometer by analysis of hexane extracts using an excitation wavelength of 310 nm and an emission wavelength of 360 nm
Infrared (IR) spectra of the samples were scanned in the range 4000 - 6000 cm-1 as thin liquid films in NaCl disc on infrared spectrophotometer Perkin Elmer 938 G.

General observations
All clams in pure concentration of WSF stock were found dead by first week.
In 1%, 10%, and 25% dilution concentrations all clams survived till the end of exposure period
The clams generally showed high accumulation in higher concentrations exposure initially and there after the levels dropped by the end of experiment and gragual increase in lower concentrations.
Mainly the depuration was more rapid.
WSFs of PG crude oil was found more toxic than BH crude oil and the Potency Ratio of the two differed significantly in all experimental periods.

Shell thickness
0
0.05
0.1
0.15
0.2
0.25
0.3
0.35
Upper Middle Lower
G. divaricatumD. fibula

LC50
LC50 values of WSF (ppb) of PG crude oil
0
100
200
300
400
500
600
700
48hrs 96hrs
G. divaricatumD. fibula
48, 72, 96 and 120hrs readings recorded

Slope Function Slope Function of the values suggest that LC50 values of the two clam
differed significantly.
0
0.5
1
1.5
2
2.5
3
3.5
4
48hrs 96hrs
G. divaricatumD. fibula

Relative Potency and Parallelism between WSFs of BH and PG crude oil (1.5 times greater) during different exposure periods in Gafrarium divaricatm
Particulars 48 hrs 72 hrs 96 hrs 120 hrs
BH PG BH PG BH PG BH PG
LC50 981.94 629.4 583.66 530.3 437.68 412.7 350.1 350.08
95% Confidence Limit
980.48 983.39
627.22 631.58
581.81585.51
529.3531.22
431.44443.92
412.14413.26
347.533352.66
348.28351.88
Slop Function 2.250 2.2705 2.2537 2.2502 2.0 2.2498 1.583 1.4331
Slop Function Ratio ( SR )
1.00911
1.00155
1.1249
1.1045
Factor of SR ( fSR )
1.65
1.60 1.50 1.18
Potency Ratio( PR )
1.85505
1.39106 1.5462 1.1126
Factor of PR (fPR )
1.36
1.35 1.34 1.08
Remarks: ( a ) SR < fSR - Hence curves are parallel within limits of experimental error. ( b ) PR > fPR - Hence the WSFs of two crude oils compared differ significantly in their potency *Factors fSR and fPR read from Nomograph no: 4 ( Litchfield and Wilcoxon, 1949 ) .

Relative potency and parallelism between Gafrarium divaricatum and Dodinia fibula toWSFs of PG crude oil. (Values are mean + SD of five determinations)
Particulars48 hrs 72 hrs 96 hrs 120 hrs
G.D. D. F. G.D. D.F. G.D. D.F. G.D. D.F.
LC 50629.4 489.25 529.4 358.80 412.7 243.0 351.0 127.9
95% Confidence
limit638.39
485.48
492.24
523.02
535.77
357.61
359.99
408.51
416.89
239.39
246.61
346.86
355.14
122.66
133.14
Slop Function 2.27 3.61 2.25 3.25 1.83 2.25 1.58 2.18Slop Function Ratio
( SR ) 1.45 1.40 1.13 0.63
Factor of SR ( f SR ) 1.5 1.45 1.28 1.1
Potency Ratio (PR ) 1.617 2.156 3.234 2.696
Factor of PR ( f PR ) 1.5 1.46 1.32 1.28
SR < fSR hence curves are parallel within experimental error. PR > fPR the two compared differ significantly in their potency

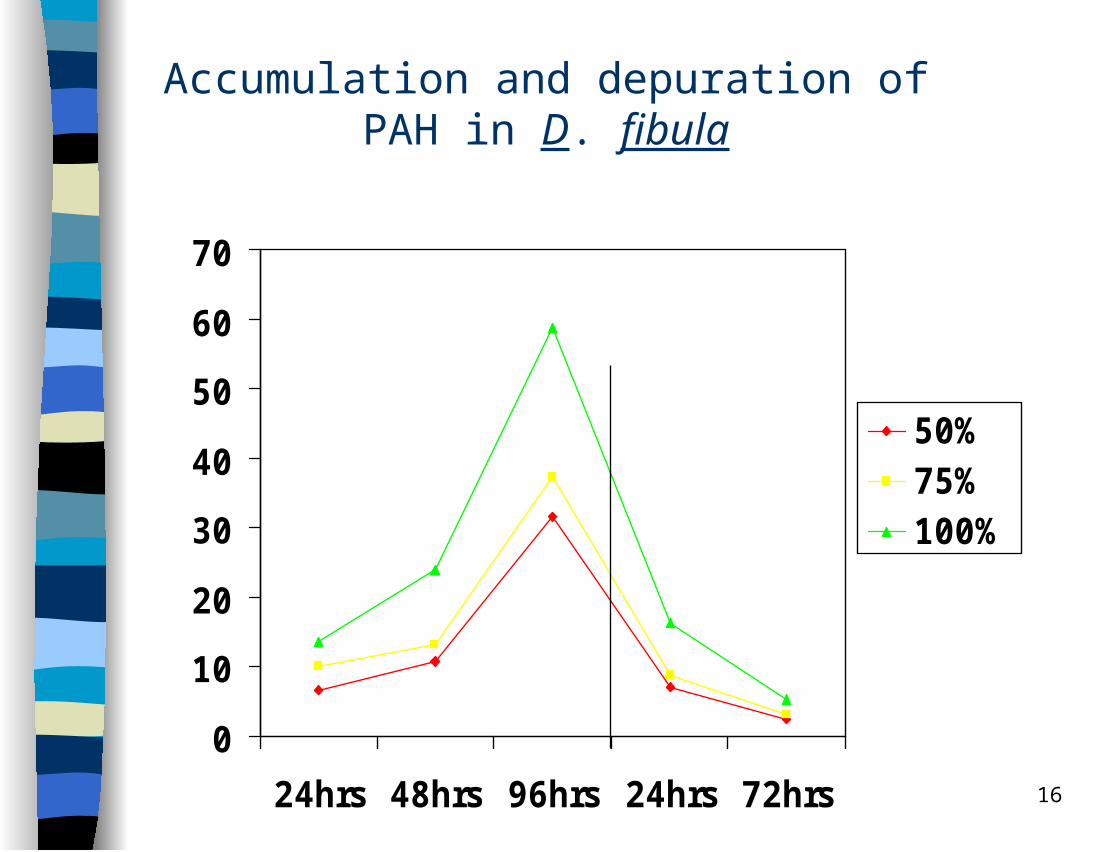
Accumulation and depuration of PAH in two species of marine bivalve in 10% WSF stock ( g / g )
WSF dilutions
Exposure period Depuration period
(%) 24 hr 48 hr 96hr 24 hr 72hr
G.d D.f. G.d. D.f. G.d. D.f. G.d. D.f. G.d D.f.
50% 3.51 6.66 4.08* 10.23 7.49 31.66 2.03** 6.93 0.25 2.49+0.01 +0.12 +0.06 +0.02 +0.08 +0.03 +0.17 +0.23 +0.09 +0.01
75% 4.77 10.07 5.55 13.17* 13.21 37.4 2.68 8.88 0.6** 3.01+0.09 +0.14 +0.02 +0.11 +0.07 +0.21 +0.19 +0.03 +0.04 +0.09
100% 5.67** 13.52 6.61 23.83 19.92 58.79 3.2* 16.23 0.73 5.2+0.012 +0.06 +0.08 +0.07 +0.02 +0.19 +0.11 +0.08 +0.06 +0.21
(Values are mean + SD of five determinations )
PH- 7.5+1.5 ; Dissolved Oxygen - 5.8+ 0.9 mg / l ; Temperature - 27 + 2 o C ; Salinity - 30.2+ 1.05 %o
G.d.- Gafrarium divaricatum D.f. - Dosinia fibula *P < 0.01 **P <0.05.

15
Accumulation and depuration of PAH (g / g) in
G. divaricatum
0
5
10
15
20
25
24hrs 48hrs 96hrs 24hrs 72hrs
50%75%100%
16
Accumulation and depuration of PAH in D. fibula
0
10
20
30
40
50
60
70
24hrs 48hrs 96hrs 24hrs 72hrs
50%75%100%

Accumulation of PAH in different tissues of Gafrarium divaricatum(µg/g wet wt). ( Mean values + SD of 5 determinations )
Conc. of WSF dilutions (%) Tissues Control
Exposure period (Days)
7 14 21 28
5Gill 0.02+0.01 2.82 +0.11 3.19+0.25 5.21+0.17 6.88+3.13
Gut 0.01+0.05 5.09+3.31* 10.33+4.62 16.46+7.91 20.32+4.98Adductor muscle
0.01+0.01 1.07 +0.11 1.98+1.21. 2.55+0.55* 3.54+1.11
10Gill 0.01+0.01 3.09 +0.02 6.29+1.24 8.32+0.32* 11.021+5.1
Gut 0.02+0.01 7.31+2.99* 15.41+5.68 21.66+3.07 39.01+6.63Adductor muscle
0.01+0.01 2.25 +0.31 3.06+0.09 5.37+0.21 6.51+3.49
25Gill 0.01+0.02 7.11+0.05 12.04+0.32 17.29+0.91 48.92+4.29
Gut 0.02+0.01 16.09+4.03 27.83+2.39 43.61+8.05 63.89+9.64Adduct. muscle
0.01+0.01 4.01+0.16**
6.77+0.22 8.55+0.22 21.11+2.18
highest concentration in the digestive gland (63.89 + 9.64 μg/g ) followed by gills (48.92 + 4.29 μg/g), adductor muscle (21.11 + 2.18 μg/ g)
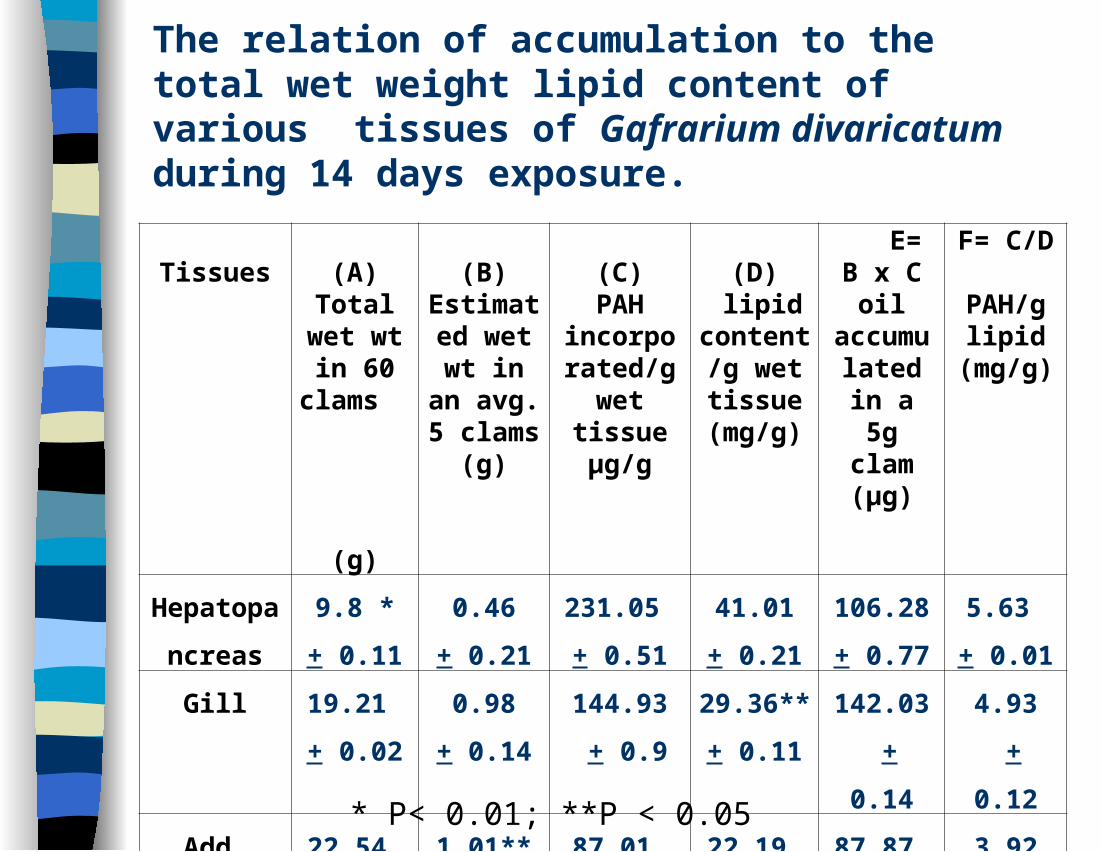
The relation of accumulation to the total wet weight lipid content of various tissues of Gafrarium divaricatum during 14 days exposure.
Tissues (A)
Total wet wt in 60
clams
(g)
(B) Estimated wet wt in an avg. 5 clams (g)
(C) PAH
incorporated/g wet
tissue μg/g
(D) lipid
content /g wet tissue
(mg/g)
E= B x C oil
accumulated in a 5g clam
(μg)
F= C/D PAH/g lipid
(mg/g)
Hepatopan
creas
9.8 *
+ 0.11
0.46
+ 0.21
231.05
+ 0.51
41.01
+ 0.21
106.28
+ 0.77
5.63
+ 0.01
Gill 19.21
+ 0.02
0.98
+ 0.14
144.93
+ 0.9
29.36**
+ 0.11
142.03
+ 0.14
4.93
+ 0.12
Add.
Muscle
22.54
+ 0.11
1.01**
+ 0.01
87.01
+ 0.21
22.19
+ 0.09
87.87
+ .01
3.92
+ 0.11
Mantle 28.04
+ 0.03
1.25
+ 0.16
63.32
+ 0.01
19.77
+ 0.14
78.75
+ 0.13
3.18*
+ 0.4* P< 0.01; **P < 0.05
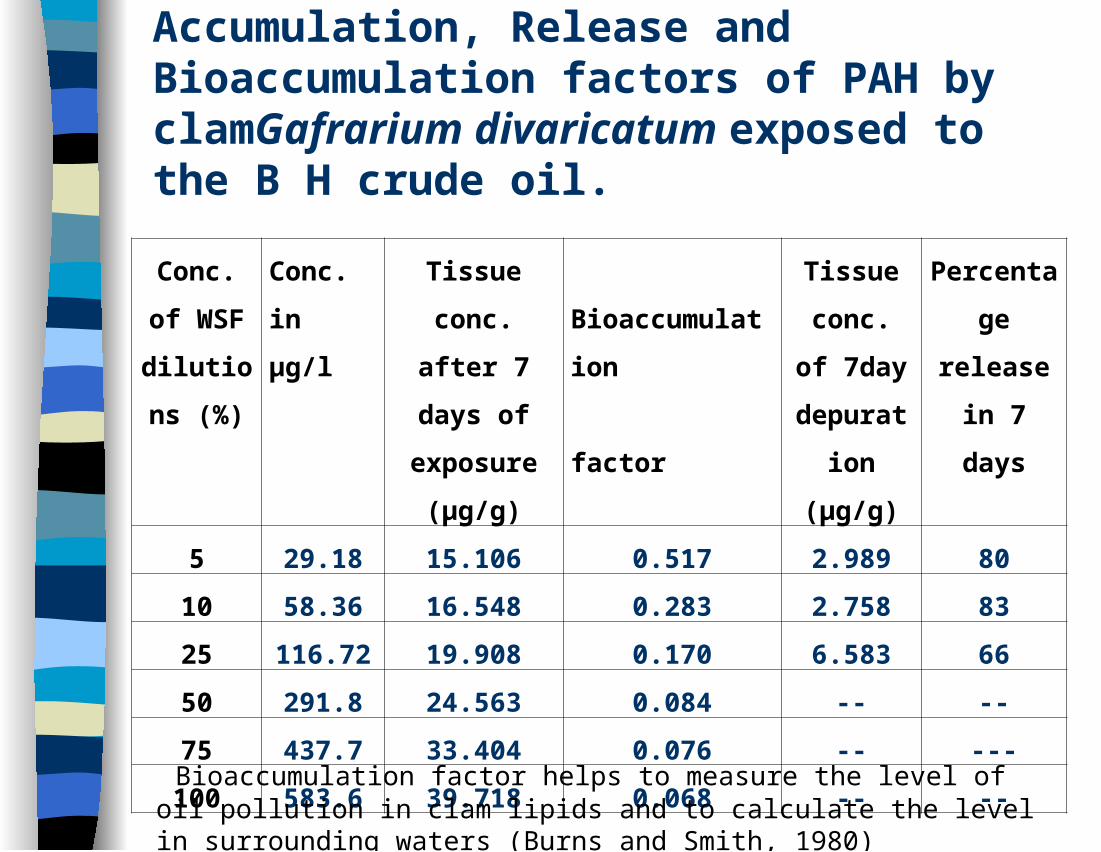
Accumulation, Release and Bioaccumulation factors of PAH by clamGafrarium divaricatum exposed to the B H crude oil.
Conc. of
WSF
dilutions
(%)
Conc. in
µg/l
Tissue conc.
after 7 days of
exposure
(µg/g)
Bioaccumulation
factor
Tissue
conc. of
7day
depuratio
n (µg/g)
Percentage
release in 7
days
5 29.18 15.106 0.517 2.989 80
10 58.36 16.548 0.283 2.758 83
25 116.72 19.908 0.170 6.583 66
50 291.8 24.563 0.084 -- --
75 437.7 33.404 0.076 -- ---
100 583.6 39.718 0.068 -- -- Bioaccumulation factor helps to measure the level of oil pollution in clam lipids and to calculate the level in surrounding waters (Burns and Smith, 1980)

Concentration of PAH in the various tissues of D fibula
0
10
20
30
40
50
60
0 5 10 25 0 5 10 25 0 5 10 25 0 5 10 25
Conc
. of P
AH (
ug /g
wet
wt t
issue
)
Concentration of WSF dilutions (%)
Fig 6.1B : Concentration of PAH in the various tissues of Dosinis fibula
28 th day accumulation 3rd day depuration 7th day depuration 14 th day depuration

The relation of oil accumulation to the wet wt and lipid content of Gafrarium divaricatum and Dosinia fibula during 96 hr of exposure
Experimental animal
Size of Clam (mm)
Wet weight
of avg. 5 clams
(g)
WSF conc./g wet wt tissue (ug /g)
Lipid Content/g
wet weight tissue (mg/g)
PAH accumulated
in 5 clams (ug/g)
PAH /g lipid
(mg/g)
G.
divaricatum
22.07 -
28.03
2.36 212.615 28.411 29.77 7.465
D. fibula 21.88 -
27.22
2.71 323.83 32.196 51.71 10.034
Shell Morphology: shell thicknessGafrarium divaricatum - upper (0.250 + 0.11 cm), middle (0.272 + 0.09 cm) and lower (0.305 + 0.01 cm)Dosinia fibula upper (0.228 + 0.03), middle (0.161 +0.01cm) and lower (0.152 + 0.10 cm).
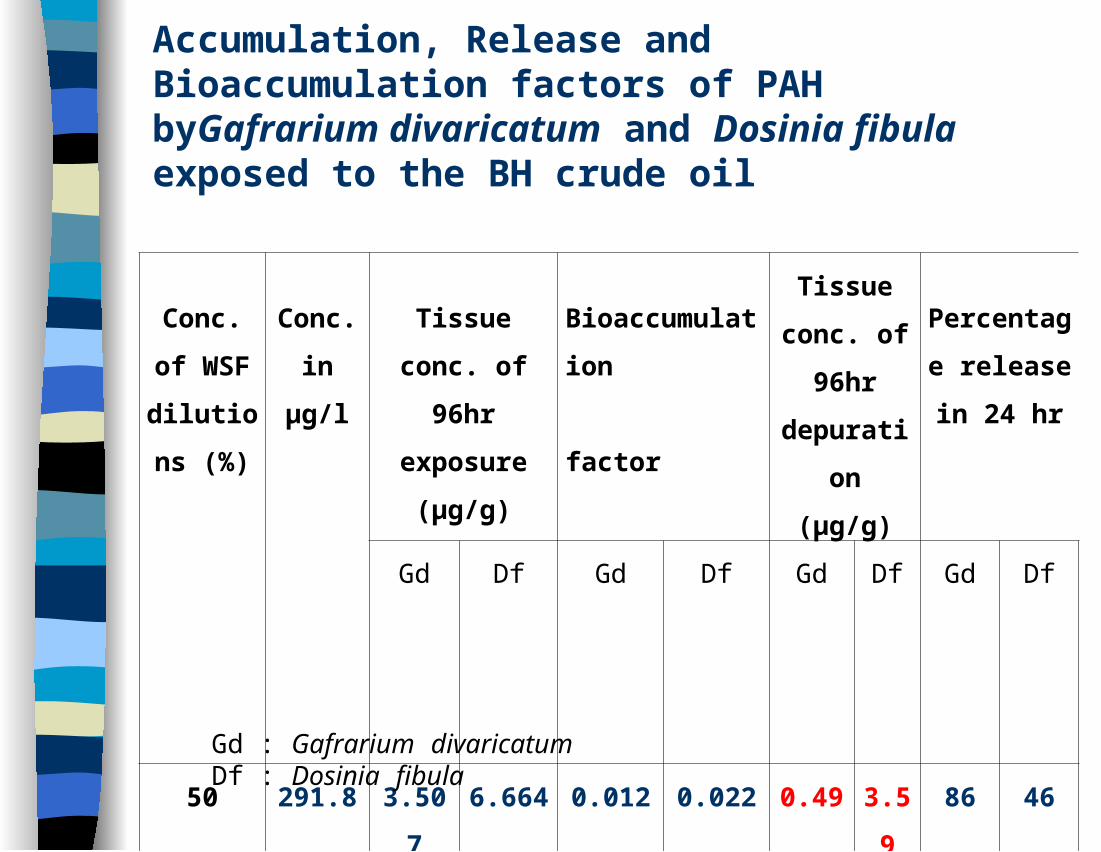
Accumulation, Release and Bioaccumulation factors of PAH byGafrarium divaricatum and Dosinia fibula exposed to the BH crude oil
Conc. of
WSF
dilutions
(%)
Conc.
in µg/l
Tissue conc. of
96hr exposure
(µg/g)
Bioaccumulation
factor
Tissue
conc. of
96hr
depuration
(µg/g)
Percentage
release in 24
hr
Gd Df Gd Df Gd Df Gd Df
50 291.8 3.507 6.664 0.012 0.022 0.49 3.59 86 46
75 437.7 4.767 10.073 0.011 0.073 1.66 5.78 65 43
100 583.6 5.67 13.524 0.009 0.023 2.59 8.27 54 39
Gd : Gafrarium divaricatum Df : Dosinia fibula

Plausible Reasons of Accumulation Hydrophobic characteristic of PAHs allow to persist in aqueous environment, thus
contaminating the food chain by accumulating in aquatic species (Vander - Oost, 1991).
PAHs with high molecular weight are readily soluble and absorbed by clams.
Bivalves are known to accumulate pollutants in their body from surrounding medium either passively or by active absorption (Broman et al., 1985).
Some alteration of behavior in Bivalve initially minimize hydrocarbon stress by burrowing and closing their shells tightly.
The temporal trends in PAH accumulation pattern in G divaricatum and D fibula reflects
selective retention and depuration of different hydrocarbons (Shaw et al., 1986).
Precise site of these aromatic hydrocarbons includes the lipid stores of the tissues because of their lipophilic nature (Metcalf and Carlton, 1990).

Plausible Reasons of depuration Mainly depuration was faster in test organisms. The loss of hydrocarbons by
metabolism and depuration (Anderson et al., 1974).
Initial rapid drop in tissue hydrocarbon during first week of depuration is probably due to loss of hydrocarbon adhering to exposed epithelial surface such as the mantle and gills and excretion of oiled debris already in the gut (Neff et al., 1976)
Factors influencing depuration rate:
Firstly, lower molecular weight and more water soluble compounds
discharged rapidly
Secondly, animals shortly exposed to petroleum depurate rapidly to
low residual concentrations
Third, chronically exposed animals depurate slowly and have
higher residual concentrations which are lost very slowly
(Farrington et al., 1982).

Conclusion
Gap in shell in thin shelled clam affected D fibula faster.
G divaricatum minimize pollutant stress by burrowing and closing their shells reducing the intake of pollutants and thus required much longer period to accumulate sufficient quantity of hydrocarbon in their tissues to affect the animal adversely by oil exposure.
It is well established that bivalve mollusks are not passive accumulators of petroleum but actively depurate those compounds (Shaw et al., 1986).
Fast depuration may be as Stegeman (1985) reported the presence of Aryl Hydrocarbon Hydroxylase (for PAH) and Kobayashi et al., (1994) reported the activity of Phenol - sulfate transferase (phenol compounds) in mid gut gland of bivalve as characteristics of the metabolizing system.
The ecological consequences of slow and incomplete depuration with the tendency of these compounds to accumulate in their tissue entering the food chain .

Conclusion for tissue Lipid related accumulation Relative uptake of PAH from WSF of Bombay High and Persian gulf crude oil by two filter
feeders like Gafrarium divaricatum and Dosinia fibula were determined on the basis of their lipid pool.
The highest average PAH values was measured in D. fibula exposed to various WSF dilutions (94.68 + 1.25 μg/g wet wt) and inG. divaricatum was considerably lower (62.11 + 2.18 μg/g wet wt) after 96 hrs.
During depuration PAH levels decreased by almost half in 2 days in Gafrarium species and they continued to fall throughout the depuration period. Where as in Dosinia species subsequent decrease was less marked (PAH in the end were 9.08 μg/g wet wt against 26.03 μg/g wet wt respectively).
These hydrocarbons because of their low solubility appear to be retained in tissues with lipid stores (Clark and Finley, 1967).
Hydrocarbon release indicated that binding of hydrocarbons to tissue lipids is probably through hydrophobic interaction (Stone, 1975).

Cont-----
Boehm, et al., (1995) observed an initial rapid loss of lenear alkanes and light aromatics followed by the slower breakdown of branched alkanes, unresolved complex material, and alkylated 3-ring and higher polynuclear aromatics and dibenzothiophenes.
Fast and slow depurating compartments is probably a function of exposure time, nature of the petroleum product absorbed, and physiological state of the organism.
The slower depuration in G divaricatum exposed to high concentrations reflect the poor physiological state of the animal where lower amounts of total body lipid observed.
Hydrocarbon binding to tissue lipids is probably through hydrophobic interaction and the rate of release depends (the lipid water partition coefficient for hydrocarbon) in part on metabolic turnover rate of tissue lipid pool. The observed increase in bioaccumulation factor support this view

Future strategy:
The research study is conducted in cooperation of NIO, versova & Zoology Department, GM Momin College, Bhiwandi. Research project with awareness programme are further planned as follows:
Conducting regular surveys.
Public awareness programs.
Collaborative work in direction of bioremediation. (Microbially mediated removal of contaminants)
Oil-Eating Enzyme pseudomonas bacteria contained enzymes that enabled them to break down hydrocarbons
Research in efficacy and effects Oil spill dispersants
Publication of data

References: Anderson, J.W., J.M. Neff, B.A. Cox, H.E. Tatem, G.M.Hightower 1974. Mar. Biol.
27,75-88. Cohen. 1997. Environ. Pollut. 12: 173-189. Farrington, J.W., A.C. Davis, N.M. Frew, K.S. Rabin 1982. Mar. Biol. 6:15-26. Gilek, M., M. Bjoerk, C. Naef. 1996. Mar Biol. vol. 125 no.3: 499-510. Lee, R.F., R. Sauerber, A.A. Benson 1972. Science 177, 344. Moles,A. 1998. Environ. Contam. Toxicol. 61: 102-107. Metcalf, J.L., M.N. Carlton 1990. Sci. Tot. Environ. 97/98: 595-615. Neff, J.M., B.A. Cox, D. Dixit and J.W. Anderson 1976. Mar. Biol. 38(3): 279-289. Neff,J.M. and J.W. Anderson 1975. In 1975 oil spill conference proceedings. American
Petroleum Institute. Washington D.C. pp. 469-472. Rice, S.D., D.A. Moles, T.L. Taylor, J.I. Karinen 1979. In Proceeding of the 1979 oil
spill conference, American Petroleum Institute. Shaw,G.David, Thomas.E.Hogan, Douglas, J. McIntosh 1986. Estuarine. Coastal and
Shelf Science. 23: 863-872. Stainken, D.M. 1976. Environ. Cont. Toxicol. 16: 730-738. Stegeman, J.J. and J.M. Teal 1973. Mar. Biol. 22: 37-44.

Websites/search engine
marinebiotech.org
http://edac_ecowatch.northerngulfinstitute.org/activity/survey.html (my paper)
http://perdurabo10.tripod.com/storagej/id96.html
http://www.bowdoin.edu/faculty/d/dpage/html/oilspill.shtml
http://www.nap.edu/catalog.php?record_id=11283
http://wiki.ask.com/Deepwater_Horizon_oil_spill


![[XLS]KDCB Music Library - Home | SESD Music Department · Web viewZoot Suit Riot Perry, Steve Kennard-Dale Kennard-Dale Kennard-Dale Kennard-Dale Kennard-Dale Kennard-Dale Kennard-Dale](https://img.pdfslide.us/doc/110x75/5b1a7c437f8b9a28258d8e9a/xlskdcb-music-library-home-sesd-music-web-viewzoot-suit-riot-perry-steve.jpg)