Embed Size (px)
Citation preview
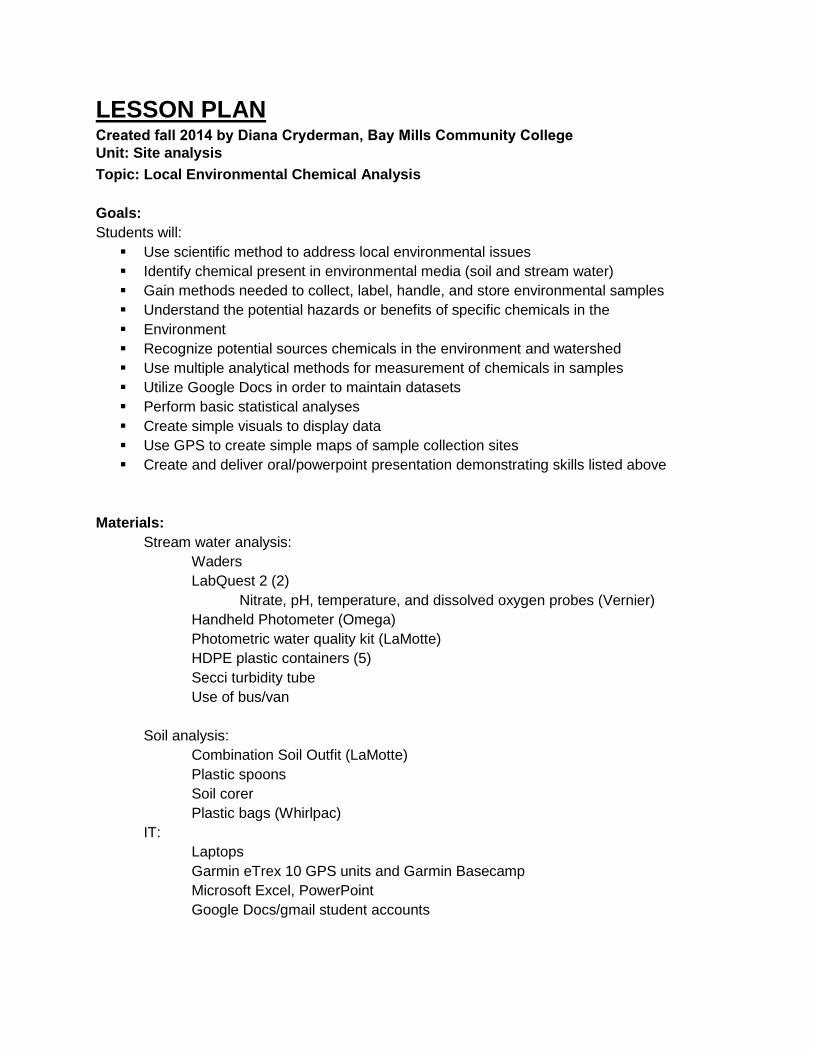
LESSON PLANCreated fall 2014 by Diana Cryderman, Bay Mills Community CollegeUnit: Site analysis
Topic: Local Environmental Chemical Analysis
Goals:
Students will:
Use scientific method to address local environmental issues
Identify chemical present in environmental media (soil and stream water)
Gain methods needed to collect, label, handle, and store environmental samples
Understand the potential hazards or benefits of specific chemicals in the
Environment
Recognize potential sources chemicals in the environment and watershed
Use multiple analytical methods for measurement of chemicals in samples
Utilize Google Docs in order to maintain datasets
Perform basic statistical analyses
Create simple visuals to display data
Use GPS to create simple maps of sample collection sites
Create and deliver oral/powerpoint presentation demonstrating skills listed above
Materials:
Stream water analysis:
Waders
LabQuest 2 (2)
Nitrate, pH, temperature, and dissolved oxygen probes (Vernier)
Handheld Photometer (Omega)
Photometric water quality kit (LaMotte)
HDPE plastic containers (5)
Secci turbidity tube
Use of bus/van
Soil analysis:
Combination Soil Outfit (LaMotte)
Plastic spoons
Soil corer
Plastic bags (Whirlpac)
IT:
Laptops
Garmin eTrex 10 GPS units and Garmin Basecamp
Microsoft Excel, PowerPoint
Google Docs/gmail student accounts
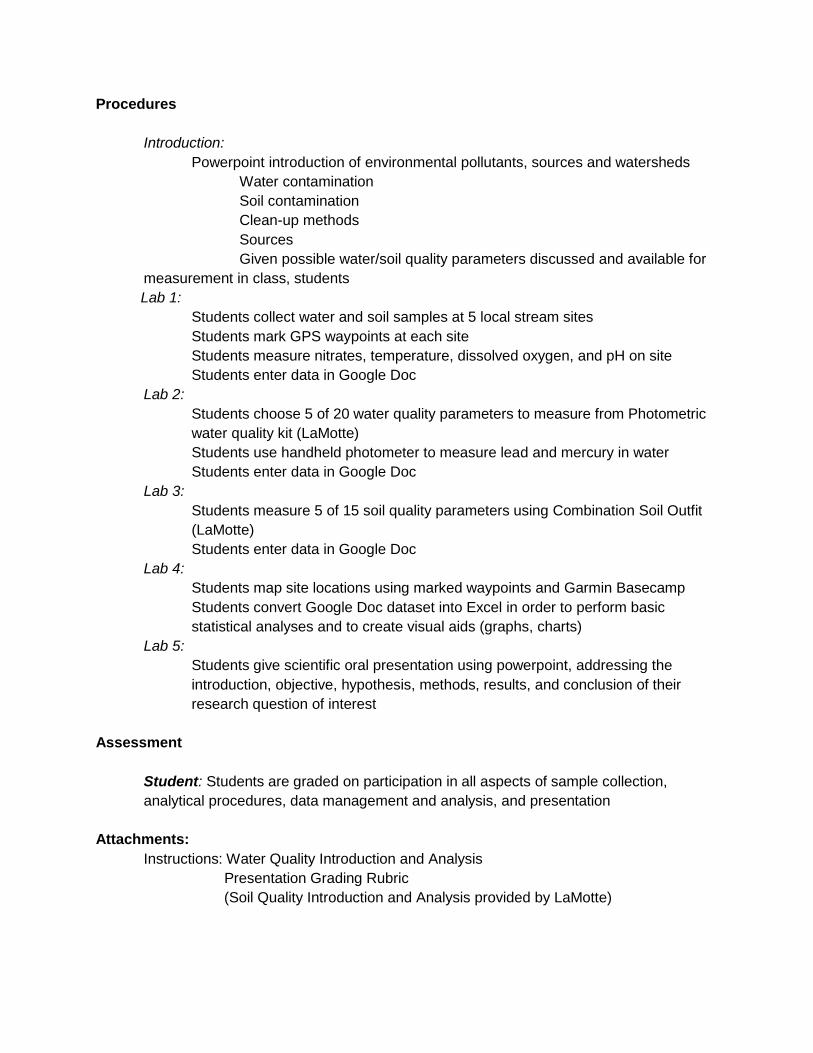
Procedures
Introduction:
Powerpoint introduction of environmental pollutants, sources and watersheds
Water contamination
Soil contamination
Clean-up methods
Sources
Given possible water/soil quality parameters discussed and available for
measurement in class, students
Lab 1:
Students collect water and soil samples at 5 local stream sites
Students mark GPS waypoints at each site
Students measure nitrates, temperature, dissolved oxygen, and pH on site
Students enter data in Google Doc
Lab 2:
Students choose 5 of 20 water quality parameters to measure from Photometric
water quality kit (LaMotte)
Students use handheld photometer to measure lead and mercury in water
Students enter data in Google Doc
Lab 3:
Students measure 5 of 15 soil quality parameters using Combination Soil Outfit
(LaMotte)
Students enter data in Google Doc
Lab 4:
Students map site locations using marked waypoints and Garmin Basecamp
Students convert Google Doc dataset into Excel in order to perform basic
statistical analyses and to create visual aids (graphs, charts)
Lab 5:
Students give scientific oral presentation using powerpoint, addressing the
introduction, objective, hypothesis, methods, results, and conclusion of their
research question of interest
Assessment
Student: Students are graded on participation in all aspects of sample collection,
analytical procedures, data management and analysis, and presentation
Attachments:
Instructions: Water Quality Introduction and Analysis
Presentation Grading Rubric
(Soil Quality Introduction and Analysis provided by LaMotte)
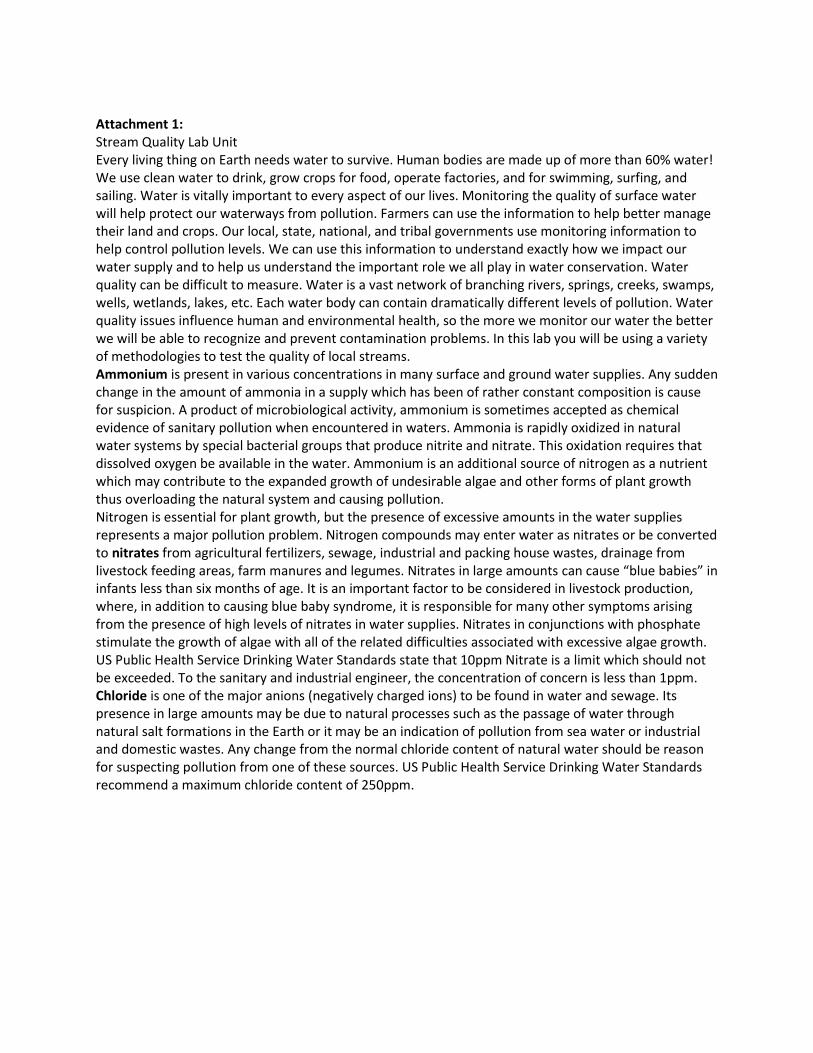
Attachment 1: Stream Quality Lab Unit Every living thing on Earth needs water to survive. Human bodies are made up of more than 60% water! We use clean water to drink, grow crops for food, operate factories, and for swimming, surfing, and sailing. Water is vitally important to every aspect of our lives. Monitoring the quality of surface water will help protect our waterways from pollution. Farmers can use the information to help better manage their land and crops. Our local, state, national, and tribal governments use monitoring information to help control pollution levels. We can use this information to understand exactly how we impact our water supply and to help us understand the important role we all play in water conservation. Water quality can be difficult to measure. Water is a vast network of branching rivers, springs, creeks, swamps, wells, wetlands, lakes, etc. Each water body can contain dramatically different levels of pollution. Water quality issues influence human and environmental health, so the more we monitor our water the better we will be able to recognize and prevent contamination problems. In this lab you will be using a variety of methodologies to test the quality of local streams. Ammonium is present in various concentrations in many surface and ground water supplies. Any sudden change in the amount of ammonia in a supply which has been of rather constant composition is cause for suspicion. A product of microbiological activity, ammonium is sometimes accepted as chemical evidence of sanitary pollution when encountered in waters. Ammonia is rapidly oxidized in natural water systems by special bacterial groups that produce nitrite and nitrate. This oxidation requires that dissolved oxygen be available in the water. Ammonium is an additional source of nitrogen as a nutrient which may contribute to the expanded growth of undesirable algae and other forms of plant growth thus overloading the natural system and causing pollution. Nitrogen is essential for plant growth, but the presence of excessive amounts in the water supplies represents a major pollution problem. Nitrogen compounds may enter water as nitrates or be converted to nitrates from agricultural fertilizers, sewage, industrial and packing house wastes, drainage from livestock feeding areas, farm manures and legumes. Nitrates in large amounts can cause “blue babies” in infants less than six months of age. It is an important factor to be considered in livestock production, where, in addition to causing blue baby syndrome, it is responsible for many other symptoms arising from the presence of high levels of nitrates in water supplies. Nitrates in conjunctions with phosphate stimulate the growth of algae with all of the related difficulties associated with excessive algae growth. US Public Health Service Drinking Water Standards state that 10ppm Nitrate is a limit which should not be exceeded. To the sanitary and industrial engineer, the concentration of concern is less than 1ppm. Chloride is one of the major anions (negatively charged ions) to be found in water and sewage. Its presence in large amounts may be due to natural processes such as the passage of water through natural salt formations in the Earth or it may be an indication of pollution from sea water or industrial and domestic wastes. Any change from the normal chloride content of natural water should be reason for suspecting pollution from one of these sources. US Public Health Service Drinking Water Standards recommend a maximum chloride content of 250ppm.
Oxygen is vital to the life cycle common to water. It is essential to keep organisms living, to sustain species reproduction, and for the development of populations. Oxygen is soluble in water in direct proportion to the partial pressure in the gas phase and solubility decreases as temperature increases. Salt water holds less oxygen than fresh water. Oxygen enters the water by absorption directly from the atmosphere or by plant photosynthesis. It is removed by respiration of organisms and by organic decomposition. During respiration and decomposition, animals and plants consume dissolved oxygen (DO)and release carbon dioxide. Organic wastes overload the natural system causing a serious depletion of the oxygen supply in the water. Waters rich in nutrients produce algae in quantity which upon decomposition deplete the oxygen supply. Fish kills are often associated with this process of eutrophication. Standards for DO vary but the following recommendations serve as a guide for fresh water fish. Habitats for warm water fish population should contain DO concentrations of not less than 4.0ppm. Habitat for cold water fish populations should not be less than 5.0ppm. pH is an important preliminary test to consider. Small changes in pH, 0.3 units or less, are usually associated with relatively large changes in other water qualities parameters- the solubility of iron, copper, calcium, manganese, and other metals, and the proportions of carbon dioxide, bicarbonate, and carbonate are greatly changed by small numerical changes in the pH measurement. Biological processes in water- especially in ponds, lakes, and quiet waters- are indicated by pH changes. DO measurements are also useful in tracking down biological processes in water. The carbon dioxide produced by respiration of animals and plants in water is sufficient to depress pH- the carbon dioxide and bicarbonate taken up by photosynthetic processes of aquatic plants is sufficient to raise pH. The same during respiration and decomposition; oxygen drops during respiration and decomposition; it rises with photosynthetic activity. The most common physical assessment of water quality is the measurement of temperature. Temperature impacts both the chemical and biological characteristics of surface water. It affects the DO level in the water, photosynthesis of aquatic plants, metabolic rates of aquatic organisms, and the sensitivity of these organisms to pollution, parasites and disease. Thermal pollution is the introduction of water that is warmer than the body of water into which it flows. It generally occurs near power plants. These industries discharge hot water that has been used to cool equipment directly into streams. Another source of thermal pollution is urban runoff. This is water that has been heated as it flowed over parking lots, streets and sidewalks. Plowing near streams or the removal of the forest canopy during construction also contributes to thermal pollution by decreasing shade, thereby increasing solar heating of the water's surface. In addition to increasing the amount of solar radiation reaching the water's surface, removal of vegetation near streams often results in increased erosion and increased amounts of sediments in the water. The sediments absorb heat from sunlight rather than reflect it. This heats the water further. Warm water is less capable of holding dissolved oxygen. For this reason, temperature should be measured at the same place within the stream at which dissolved oxygen is measured. This allows the correlation between the two parameters to be observed. The problem of low dissolved oxygen levels is magnified by the fact that the metabolic rates of aquatic plants increase as water temperature rises, thus increasing their biochemical oxygen demand. Low dissolved oxygen levels leave aquatic organisms in a weakened physical state and more susceptible to disease, parasites, and other pollutants.
Mercury is a naturally occurring metallic element found in trace amounts in air, water, and soil. Mercury is toxic to both aquatic life and humans, but its toxicity is primarily a human health concern. Inorganic mercury occurs naturally due to its presence in rocks and soils, where it is slowly released through erosion and weathering into surface waters. Most of the mercury in surface waters remains inorganic, but in certain environments (low pH, low dissolved oxygen, and high organic matter, such as are found in the bottoms of lakes, marshes, and wetlands), some of it is converted to a much more toxic organic form—methylmercury. Airborne mercury from coal-fired power plants, mining operations, and other industrial sources can settle into soil and rivers, lakes, and oceans, where aquatic microbes convert it to methylmercury through a biochemical reaction. Elemental mercury released to the atmosphere can circulate around the world. The mercury people are exposed to comes not just from locally caught fish, but also, and for some primarily, from fish and shellfish caught elsewhere and sold in the market. Mercury pollution is truly a global problem. Methylmercury tends to accumulate in the tissue of fish as they feed on other aquatic organisms. As larger fish eat smaller ones, concentrations of the pollutant increase in the bigger fish, a process known as bioaccumulation. Thus, mercury enters the food chain and becomes concentrated and is of particular interest from a human health standpoint. By far the most common route of mercury exposure in humans is eating fish and shellfish contaminated by methylmercury, according to the federal Centers for Disease Control. To help protect public health, the Idaho Department of Health and Welfare through the Idaho Fish Consumption Advisory Program issues fish consumption advisories when fish in Idaho water bodies are found to have methylmercury levels above what is considered safe. The need for fish consumption advisories for some Idaho water bodies indicates that mercury pollution is a factor in Idaho, as do the results of water quality studies that show some water bodies in Idaho are impaired and fail to meet water quality standards for mercury. Fish consumption advisories don't mean you should stop eating fish from affected water bodies, just that you should be aware of the risks and may need to limit your consumption to be safe. Fish are a good source of protein and low in saturated fat. Simply limit fish consumption to amounts specified in the advisory. Lead is a toxic heavy metal that can be found on earth's crust. Lead does not usually naturally occur in drinking water, but it can be present in household plumbing or water service lines and contaminate drinking water through corrosion of plumbing materials. Soft, acidic water is more likely to dissolve lead from solder or pipes than hard water. Houses built before 1986 have an increased risk of having lead fixtures. However, newer homes may be at risk as well. Legally defined "lead-free plumbing" can contain up to 8 percent lead. Lead is also present in the air and some food because of lead in automobile exhaust and industrial emissions. The United States Environmental Protection Agency (USEPA) estimates that 20 percent of our total exposure to lead comes from drinking water. Children have the highest health risk from exposure to lead. Exposure to lead can lead to premature birth, reduce birth weight, delayed physical and mental development in babies and toddlers and cause learning disabilities and slight deficits in attention span in children. Accumulation of lead in adults can cause high blood pressure and kidney problems. Long-term exposure of high levels of lead may also potentially cause anemia, stroke, damage to the nervous system and cancer. The normal conditions of the alkalinity of natural waters are associated with the carbon dioxide, bicarbonate, carbonate, and hydroxide components. These factors are characteristic of the source of water and the natural processes taking place at any given time. For particular industrial and domestic use, it is often desirable to change these characteristics by treatments such as aeration, neutralization,
softening, etc. The particular treatment and the extent to which it is employed will depend upon the end use of the water. Carbon dioxide is present in water supplies in the form of a dissolved gas. Surface waters normally contain less than 10ppm free carbon dioxide while some ground waters may easily exceed that concentration. Corrosion is the principal problem by high concentrations of carbon dioxide in water. This is due to lowering of the pH of the water when carbon dioxide dissolves to form carbonic acid. Carbon dioxide is readily soluble in pure water, much more so than oxygen. Calcium and magnesium combine with carbon dioxide to form carbonates and bicarbonates. Aquatic plant life depends upon carbon dioxide and bicarbonates in water for growth. When the oxygen concentration in waters containing organic wastes is reduced, the carbon dioxide concentration rises. The rise in carbon dioxide makes it more difficult for fish to use the limited amount of oxygen present. To take on fresh oxygen, fish must first discharge the carbon dioxide in their blood streams and this is a much slower process when there are high concentrations of carbon dioxide in the water itself. Chromium may be present in water containing waste from industry such as the metal plating industry or in overflow water from large air conditioning units where chromate compounds are frequently added to cooling water for corrosion control. It is considered to be a toxic chemical and, if present in an amount of over 0.5ppm, it is evidence of contamination from untreated or incompletely treated industrial waste. This calls for more careful waste disposal control by the offending plant. Chromium is one of a class of heavy metals found in the bottom muds of polluted bodies of waters. Certain shellfish are capable of concentrating this element and thus endanger the health of tis ultimate consumer-whether it is man or animal. The copper content of drinking water generally falls below 0.03ppm and a copper content as high as 1.0ppm (do not taste the stream water!) will impart a bitter taste. Waters testing as high as 1.0ppm have probably been treated with a copper compound such as is used by the control of algae, or have become contaminated from untreated industrial wastes. The addition of copper sulfate to lakes causes an increase in the copper content of the sediments. Acid waters and those high in free carbon dioxide may cause the corrosion of copper, brass, and bronze in pipes and fittings. This results in the addition of copper into the water supply. Cyanide may be present in water containing waste from a metal finishing plant. It is very toxic and should not be present in water. A positive test is evidence of untreated or incompletely treated waste which calls for more careful disposal control by the offending plant. The US Public Health Service recommends that the total dissolved solids of potable water be limited to 500ppm but if such water is not available, a total solids content of up to 1000ppm may be permitted. From the standpoint of irrigation of agricultural crops, total solids of 175ppm or less would be considered low, between 175 and 500 medium, 500 to 1500 high and above 1500ppm very high. The term salinity is also used to describe the solids content of irrigation water. In addition to potable and irrigation uses, high solids content is undesirable in most industrials process waters.
Fluoride may be present in natural water supplies as well as industrial and municipal effluents. Many municipal water supplies are supplemented with up to 1.0ppm of fluoride to strengthen teeth and reduce dental cavities. An excessive amount causes unsightly mottling of tooth enamel and hinders brain development. Some fluoride compounds are used as toxic agents for pest control and the residue of these compounds may appear in water. Calcium, magnesium and total hardness factors of water are considered as a group since the total hardness of water generally represents the total concentration of calcium and magnesium ions expressed as calcium carbonate. Other ions may contribute to the hardness of water but in natural waters all but calcium and magnesium are present in insignificant quantities. When the hardness of water is greater than the sum of the carbonate and bicarbonate alkalinity, there will be considerable amounts of chloride and sulfate ions. This is an important factor to consider when treating potable water by ion exchange methods. The hardness of water may range from 0 to 100s ppm depending on the source of the water or the treatment. Calcium and magnesium may be added to natural water as it passes through soil and rock containing large amounts of these elements. Waters containing small concentrations are referred to as soft and water containing high levels is considered hard. The soft waters are mainly derived from the draining of acidic igneous rocks, the very hard water from the drainage of calcareous sediments. Some industrial processes may also produce significant amounts of these elements that are later discharged into streams. Magnesium hardness is determined by subtracting the calcium hardness result from the total hardness result. Most natural waters contain some iron. Its presence may vary from the smallest trace to very large amounts in water which is contaminated by acid mine wastes. For domestic use the concentration should not exceed 0.2ppm and for some industrial applications not even a trace of iron can be tolerated. Manganese is a trace element important to the life cycle of plants and animals. It may enter natural water as a result of organic decomposition, solution of mineral rocks, or by industrial dumping. Nutrient pollution is one of America's most widespread, costly and challenging environmental problems, and is caused by excess nitrogen and phosphorus in the air and water. Nitrogen and phosphorus are nutrients that are natural parts of aquatic ecosystems. Nitrogen is also the most abundant element in the air we breathe. Nitrogen and phosphorus support the growth of algae and aquatic plants, which provide food and habitat for fish, shellfish and smaller organisms that live in water. But when too much nitrogen and phosphorus enter the environment - usually from a wide range of human activities - the air and water can become polluted. Nutrient pollution has impacted many streams, rivers, lakes, bays and coastal waters for the past several decades, resulting in serious environmental and human health issues, and impacting the economy. Too much nitrogen and phosphorus in the water causes algae to grow faster than ecosystems can handle. Significant increases in algae harm water quality, food resources and habitats, and decrease the oxygen that fish and other aquatic life need to survive. Large growths of algae are called algal blooms and they can severely reduce or eliminate oxygen in the water, leading to illnesses in fish and the death of large numbers of fish. Some algal blooms are harmful to humans
because they produce elevated toxins and bacterial growth that can make people sick if they come into contact with polluted water, consume tainted fish or shellfish, or drink contaminated water. Nutrient pollution in ground water - which millions of people in the United States use as their drinking water source - can be harmful, even at low levels. Infants are vulnerable to a nitrogen-based compound called nitrates in drinking water. Excess nitrogen in the atmosphere can produce pollutants such as ammonia and ozone, which can impair our ability to breathe, limit visibility and alter plant growth. When excess nitrogen comes back to earth from the atmosphere, it can harm the health of forests, soils and waterways. Salinity is a measure of the content of salts in soil or water. Salts are highly soluble in surface and groundwater and can be transported with water movement. Large salt deposits are a natural feature of vast areas of the Australian landscape, stored deep in soils or as surface salt deposits and salt lakes. This natural distribution of salt in the landscape is referred to as 'primary salinity'. Silica (SiO₂) is a very common, naturally occurring compound. It is often found in quartz, sandstone, and other rocks. As water filters down through these structures, it will pick up contaminants and minerals, including silica. Silica can be found in most groundwaters, wells, and even in food. One form of silica is silicates, which are considered salts and generally combine with other mineral contaminants. It is found in surface and well water in the range of 1 - 100 mg/l. Colloidal silica can be very difficult to filter as it is a gelatinous substance made up of non-diffusible particles that remain suspended in the water. Silica does not seem to have detrimental health effects; there are studies that have shown that it actually helps to alleviate the symptoms of dementia. Even though silica does not seem to be harmful to humans, it can be especially damaging in industrial water uses. Cooling towers, boiler feeds, semi-conductor, and carwashes all need water that is silica-free. Silica can leave behind deposits on expensive equipment and surfaces, creating a scale build-up that is hard to remove. Scale build-up can then lead to expensive maintenance and replacement of damaged or rust-filled parts and pipes Sulfate is a substance that occurs naturally in drinking water. Health concerns regarding sulfate in drinking water have been raised because of reports that diarrhea may be associated with the ingestion of water containing high levels of sulfate. Of particular concern are groups within the general population that may be at greater risk from the laxative effects of sulfate when they experience an abrupt change from drinking water with low sulfate concentrations to drinking water with high sulfate concentrations. Sulfate in drinking water currently has a secondary maximum contaminant level (SMCL) of 250 milligrams per liter (mg/L), based on aesthetic effects (i.e., taste and odor). This regulation is not a Federally enforceable standard, but is provided as a guideline for States and public water systems. EPA estimates that about 3% of the public drinking water systems in the country may have sulfate levels of 250 mg/L or greater. Hydrogen sulfide is a colorless gas that can exist naturally in groundwater. Sulfur-reducing bacteria present in groundwater use sulfur as an energy source to chemically change sulfates to hydrogen sulfide. The bacteria use sulfur from decaying plants and other organic matter in oxygen-deficient
environments. They can occur in deep or shallow wells, and reside in plumbing systems. Hydrogen sulfide crops up in other ways too. The magnesium rod used in water heaters for corrosion control can chemically reduce sulfates to hydrogen sulfide, and sewage pollution can be a source. Hydrogen sulfide also can enter surface water through springs. Zinc is an essential element in trace amounts for plants and animals. In mammals, it is involved in the healing processes of tissues in the body. Other physiological processes such as hormone metabolism, immune response, and stabilization of ribosome and membranes also require zinc. Zinc toxicosis is not a common problem, but zinc poisoning in humans (e.g., from acid foods or beverages stored in galvanized containers) and animals (e.g., from ingesting or exposure to galvanized metal objects, certain paints and fertilizers, zinc-containing coins, etc.) have been documented. Several factors such as water hardness, salinity, temperature, and the presence of other contaminants influence zinc toxicity in aquatic environments. This modification in zinc toxicity is the result of an effect on zinc availability and on sorption or binding of available zinc to biological tissues. The effect of water hardness on zinc toxicity is by far the most studied factor. Clinical manifestations of zinc deficiency in animals include growth retardation, testicular atrophy, skin changes, and poor appetite. Zinc is ubiquitous in the environment and its deficiency in humans and animals may be considered an unlikely problem. Nevertheless, zinc deficiency and related problems in humans, animals, birds, and plants have been reported in the literature. Turbidity is a measure of water clarity how much the material suspended in water decreases the passage of light through the water. Suspended materials include soil particles (clay, silt, and sand), algae, plankton, microbes, and other substances. These materials are typically in the size range of 0.004 mm (clay) to 1.0 mm (sand). Turbidity can affect the color of the water. Higher turbidity increases water temperatures because suspended particles absorb more heat. This, in turn, reduces the concentration of dissolved oxygen (DO) because warm water holds less DO than cold. Higher turbidity also reduces the amount of light penetrating the water, which reduces photosynthesis and the production of DO. Suspended materials can clog fish gills, reducing resistance to disease in fish, lowering growth rates, and affecting egg and larval development. As the particles settle, they can blanket the stream bottom, especially in slower waters, and smother fish eggs and benthic macroinvertebrates. Sources of turbidity include soil erosion, waste discharge, urban runoff, eroding stream banks, large numbers of bottom feeders (such as carp) which stir up bottom sediments, excessive algal growth.
METHODS LabQuest2 In order to test ammonium, nitrate, chloride, DO, pH, and temperature, we will be using the LabQuest2 by Vernier Analytical. Our lab owns two of these interfaces, each with the capability to attach to up to 3 probes. In this lab, each of the previously listed parameters will be determined using individual probes. PLEASE DO NOT DETTACH PROBES FROM THE LABQUEST. You will notice that some probes require an adapter in order to connect to the interface. Ammonium, nitrate, chloride, DO, and pH probes should remain in the storage bottle until use. Once at the stream site, you will carefully remove your probe from the storage bottle (if applicable) and hold the probe in the streamwater so that the notch/line is submerged. One group member will power on the LabQuest. Generally, you will see the home screen which has two drop down boxes titled ‘file’ and ‘sensors.’ Most of the probes automatically channel into the LabQuest meaning that if the nitrate probe is plugged in to channel 1, a red box will appear with “CH1: Dissolved Oxygen” within. In the red box you will also see a value. This is the value you will eventually record. Each probe plugged into the LabQuest should have its own red box displayed. Some probes (likely those that use adapters) will need to be chosen by pressing “Sensor” “Channel” and then choosing the probe type. Once the correct probes are displayed in red on your screen, you are ready to record data! Be sure that each probe is in the stream water for a minimum of 3 minutes prior to recording data. However, these are quite sensitive, so the probe tip should not touch any solid items such as rocks or sand, nor should the entire probe be submerged. Record your parameters on your data sheet. When finished, be sure that probe tips are placed back into storage bottles to prevent them being damaged or dried out. Note: each probe has already been calibrated for accuracy. Handheld Photometer Lead (Pb) in stream water: 1. Collect 50mL water in the conical tube. Add 3 drops PB-acid reagent. Mix and allow to set for 5 minutes.
2. Turn on meter. Using the menu button, select PB2.
3. Fill the Cell with your test sample four times to rinse thoroughly. Then fill the cell to capacity. Tilt the meter forward to allow excess sample to flow out in order to make room for Pb-2 reagent.
4. Add 5 drops Pb-2 reagent
5. Dip Pb-3 strip into the cell and press READ. Move the strip in a back and forth motion. Once the monitor displays “1,” remove and discard the strip. After 60 seconds, the display will be zeroed to 0ug/L.
6. Dip Pb-4 strip into the cell and immediately press READ. Move the strip in a back and forth motion. Once the monitor displays “1” on the screen, remove and discard the strip. After 60 seconds the screen will display the lead value in your sample. Record this value in your records. Mercury (Hg) in stream water:
meter in step 2 (instead of PB2). Photometric Water Quality Kit Cyanide: 1. Fill Tube 0804 to line A with stream water
2. Add 2 drops of Cyanide Reagent 1. Cap and mix. Add two drops of Cyanide reagent 2. Cap and mix. If a precipitate forms, filter the solution into the second tube 0804 until the tube is filled to the line marked B. A pink color indicates the presence of cyanide.
3. Rinse the first test tube carefully and then fill it to the line marked “B” with DI water.
4. Add 2 drops Cyanide reagent 2 to the dionized water and mix.
5. Add Cayanide Reagent 3 to the DI water tube one drop at a time until the color of the liquid matches the color of the stream water sample (from step 2). Match the colors by looking down through the tubes as they are held about a half inch above a plain white surface. Count the numbe of drops of Cyanide Reagent 3 that were required to match the colors. Each drop of cyanide reagent 3 needed is equal to 0.05ppm of Cyanide in the stream water. Sulfide: 1. Fill tube 0820 to the 5mL line with stream water.
2. Add 15 drops of Sulfide Reagent A. Cap and mix. Remember that the test sample now has a high acid content.
3. Add 3 drops of Sulfide Reagent B. Cap and miz. Wait one minute.
4. Use the 1.0mL pipet to add 1.0mL of Sulfide Reagent C. Cap and mix.
5. If sulfide is present, a blue color will develop. Insert the test tube into the sulfide comparator. Match sample color to a color standard.
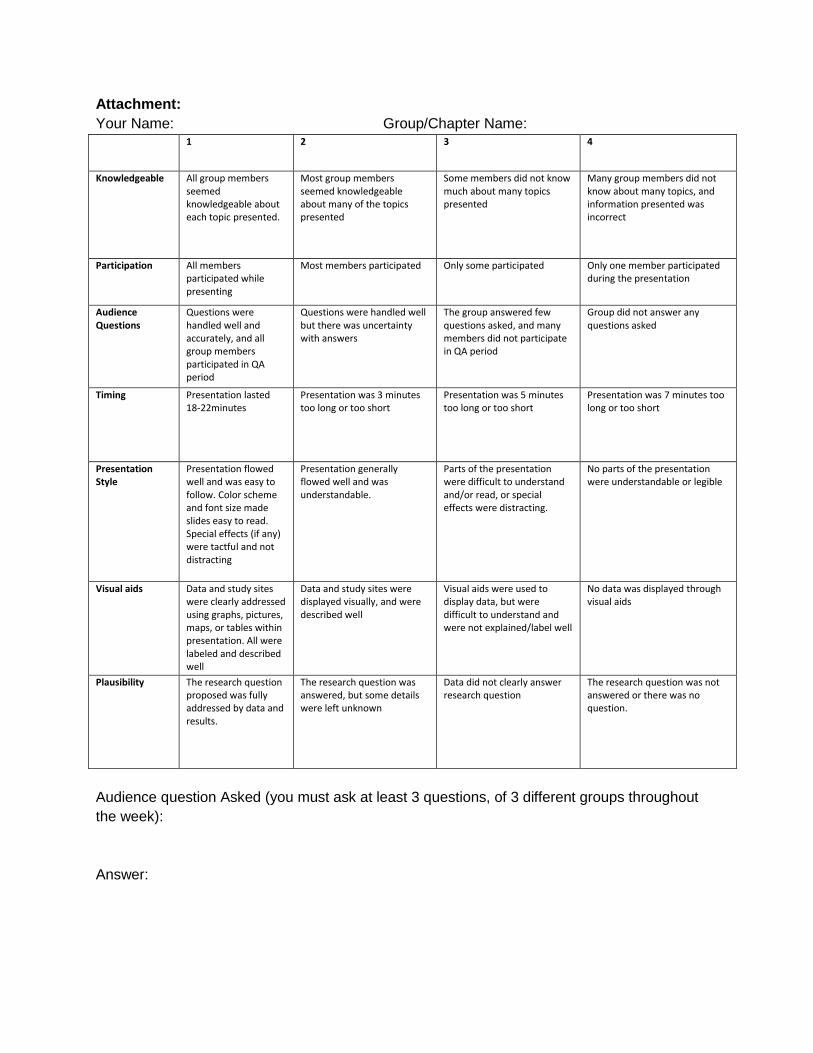
Attachment:
Your Name: Group/Chapter Name: 1 2 3 4
Knowledgeable All group members seemed knowledgeable about each topic presented.
Most group members seemed knowledgeable about many of the topics presented
Some members did not know much about many topics presented
Many group members did not know about many topics, and information presented was incorrect
Participation All members participated while presenting
Most members participated Only some participated Only one member participated during the presentation
Audience Questions
Questions were handled well and accurately, and all group members participated in QA period
Questions were handled well but there was uncertainty with answers
The group answered few questions asked, and many members did not participate in QA period
Group did not answer any questions asked
Timing Presentation lasted 18-22minutes
Presentation was 3 minutes too long or too short
Presentation was 5 minutes too long or too short
Presentation was 7 minutes too long or too short
Presentation Style
Presentation flowed well and was easy to follow. Color scheme and font size made slides easy to read. Special effects (if any) were tactful and not distracting
Presentation generally flowed well and was understandable.
Parts of the presentation were difficult to understand and/or read, or special effects were distracting.
No parts of the presentation were understandable or legible
Visual aids Data and study sites were clearly addressed using graphs, pictures, maps, or tables within presentation. All were labeled and described well
Data and study sites were displayed visually, and were described well
Visual aids were used to display data, but were difficult to understand and were not explained/label well
No data was displayed through visual aids
Plausibility The research question proposed was fully addressed by data and results.
The research question was answered, but some details were left unknown
Data did not clearly answer research question
The research question was not answered or there was no question.
Audience question Asked (you must ask at least 3 questions, of 3 different groups throughout
the week):
Answer:

Your Name: Group Member Name:
Below, state whether you highly agree (1), mostly agree (2), mostly disagree (3), or highly
disagree (4) with each of the following statements:
This group member participated in all aspects of preparing the presentation and activity ______
This group member pulled his/her weight. The workload was split fairly evenly _____
This group member shared responsibility for understanding material presented _____
This group member participated an equal amount during the presentation/activity _____
Additional Notes: