Embed Size (px)
Citation preview
Copper Mountain 200/150/OnPrem2400/ DSL
Device Management
Supports Management Module SM-CPM1000
D e v i c e M a n a g e m e n t Page 2 C o p p e r M o u n t a i n 2 0 0 / 1 5 0 / O n P r e m 2 4 0 0
Copyright NoticeDocument 5007. Copyright © 2002-present Aprisma Management Technologies, Inc. All rights reserved worldwide. Use, duplication, or disclosure by the United States government is subject to the restrictions set forth in DFARS 252.227-7013(c)(1)(ii) and FAR 52.227-19.
Liability DisclaimerAprisma Management Technologies, Inc. (“Aprisma”) reserves the right to make changes in specifications and other information contained in this document without prior notice. In all cases, the reader should contact Aprisma to inquire if any changes have been made.The hardware, firmware, or software described in this manual is subject to change without notice.IN NO EVENT SHALL APRISMA, ITS EMPLOYEES, OFFICERS, DIRECTORS, AGENTS, OR AFFILIATES BE LIABLE FOR ANY INCIDENTAL, INDIRECT, SPECIAL, OR CONSEQUENTIAL DAMAGES WHATSOEVER (INCLUDING BUT NOT LIMITED TO LOST PROFITS) ARISING OUT OF OR RELATED TO THIS MANUAL OR THE INFORMATION CONTAINED IN IT, EVEN IF APRISMA HAS BEEN ADVISED OF, HAS KNOWN, OR SHOULD HAVE KNOWN, THE POSSIBILITY OF SUCH DAMAGES.Trademark, Service Mark, and Logo InformationSPECTRUM, IMT, and the SPECTRUM IMT/VNM logo are registered trademarks of Aprisma Management Technologies, Inc., or its affiliates. APRISMA, APRISMA MANAGEMENT TECHNOLOGIES, the APRISMA MANAGEMENT TECHNOLOGIES logo, MANAGE WHAT MATTERS, DCM, VNM, SpectroGRAPH, SpectroSERVER, Inductive Modeling Technology, Device Communications Manager, SPECTRUM Security Manager, and Virtual Network Machine are unregistered trademarks of Aprisma Management Technologies, Inc., or its affiliates. For a complete list of Aprisma trademarks, service marks, and trade names, go tohttp://www.aprisma.com/manuals/trademark-list.htm.All referenced trademarks, service marks, and trade names identified in this document, whether registered or unregistered, are the intellectual property of their respective owners. No rights are granted by Aprisma Management Technologies, Inc., to use such marks, whether by implication, estoppel, or otherwise. If you have comments or concerns
about trademark or copyright references, please send an e-mail to [email protected]; we will do our best to help.Restricted Rights Notice(Applicable to licenses to the United States government only.)
This software and/or user documentation is/are provided with RESTRICTED AND LIMITED RIGHTS. Use, duplication, or disclosure by the government is subject to restrictions as set forth in FAR 52.227-14 (June 1987) Alternate III (g)(3) (June 1987), FAR 52.227-19 (June 1987), or DFARS 52.227-7013 (c)(1)(ii) (June 1988), and/or in similar or successor clauses in the FAR or DFARS, or in the DOD or NASA FAR Supplement, as applicable. Contractor/manufacturer is Aprisma Management Technologies, Inc. In the event the government seeks to obtain the software pursuant to standard commercial practice, this software agreement, instead of the noted regulatory clauses, shall control the terms of the government's license.
Virus DisclaimerAprisma makes no representations or warranties to the effect that the licensed software is virus-free.Aprisma has tested its software with current virus-checking technologies. However, because no anti-virus system is 100 percent effective, we strongly recommend that you write-protect the licensed software and verify (with an anti-virus system in which you have confidence) that the licensed software, prior to installation, is virus-free.Contact InformationAprisma Management Technologies, Inc.273 Corporate DrivePortsmouth, NH 03801Phone: 603.334.2100U.S. toll-free: 877.468.1448Web site: http://www.aprisma.com
D e v i c e M a n a g e m e n t Page 3 C o p p e r M o u n t a i n 2 0 0 / 1 0 0 / O n P r e m 2 4 0 0
ContentsINTRODUCTION 4
Purpose and Scope ........................................................4Required Reading ...........................................................4Supported Devices..........................................................5The SPECTRUM Model ..................................................5
Additional (Optional) Menus:....................................6
TASKS 7
Application Information (examine) ..................................7Device (configure) ...........................................................7Device Performance (monitor) ........................................7Launchable Applications .................................................7Model Information (examine) ..........................................7Model Redundancy (configure) .......................................7Port Configuration (examine/modify) ..............................7A Port (examine/enable/disable) .....................................7Traps (view/monitor) .......................................................7
DEVICE VIEWS 8
Interface Icons ................................................................9Interface Icon Subviews Menu Options .....................10Interface Status View.................................................11Secondary Address Panel .........................................11
DEVICE TOPOLOGY VIEWS 12
APPLICATION VIEWS 13
Main Application View................................................... 13Supported Applications ................................................. 14
Common Applications ............................................... 14Device-Specific Applications ..................................... 15
Ds3App1407 Application .............................................. 15
PERFORMANCE VIEWS 16
CONFIGURATION VIEWS 17
Device Configuration View............................................ 17
TRAP ALARM COUNTER VIEW 18
Trap Alarm Counter Attributes ...................................... 19
TRAP EVENT LOG VIEW 20
Trap Event Table .......................................................... 21
COPPER VIEW/COPPER ELEMENT MANAGER 25
MODEL INFORMATION VIEW 26
INDEX 27
D e v i c e M a n a g e m e n t Page 4 C o p p e r M o u n t a i n 2 0 0 / 1 5 0 / O n P r e m 2 4 0 0
Introduction
This section introduces the SPECTRUM Device Management documentation for Copper Mountain devices.
This introduction to the Device Management documentation for Copper Mountain devices contains the following information:
• Purpose and Scope• Required Reading• Supported Devices (Page 5)• The SPECTRUM Model (Page 5)
Purpose and ScopeUse this documentation as a guide for managing Copper Mountain devices with the SPECTRUM management module SM-CPM1000. The documentation describes the icons, menus, and views that enable you to remotely monitor, configure, and troubleshoot Copper Mountain devices through software models in your SPECTRUM database.
Only information specific to the supported management module is included under this documentation topic. For general information
about device management using SPECTRUM and for explanations of basic SPECTRUM functionality and navigation techniques, refer to the topics listed under Required Reading.
Required ReadingTo use this documentation effectively, you must be familiar with the information covered by the other SPECTRUM online documentation topics listed below.
• Getting Started with SPECTRUM for Operators
• Getting Started with SPECTRUM for Administrators
• How To Manage Your Network with SPECTRUM
• SPECTRUM Views• SPECTRUM Menus• SPECTRUM Icons • SPECTRUM Software Release Notice
I n t r o d u c t i o n S u p p o r t e d D e v i c e s
D e v i c e M a n a g e m e n t Page 5 C o p p e r M o u n t a i n 2 0 0 / 1 5 0 / O n P r e m 2 4 0 0
Supported Devices The SPECTRUM management module SM-CPM1000 currently allows you to model two different types of Copper Mountain devices as described below.
• Copper Edge 150 This is the Standalone DSL device that contains a maximum of 48 DSL ports.
• Copper Edge 200 This is a fully scaleble 200 DSL device, that can bond up to 8 DSL lines.
• Copper Mountain OnPrem 2400DSL Router The Copper Mountain Networks OnPrem 2400 is a Digital Subscriber Line (DSL) Concentra-tor. The OnPrem2400 supports several ser-vices including routing. Wide Area Network access, SDL line termination, IPv4 packet for-warding, NAT, Traffic Isolation, and browser-based network management. The OnPrem2400 can support up to 24 SDSL 2.3 Mbps full-duplex links.
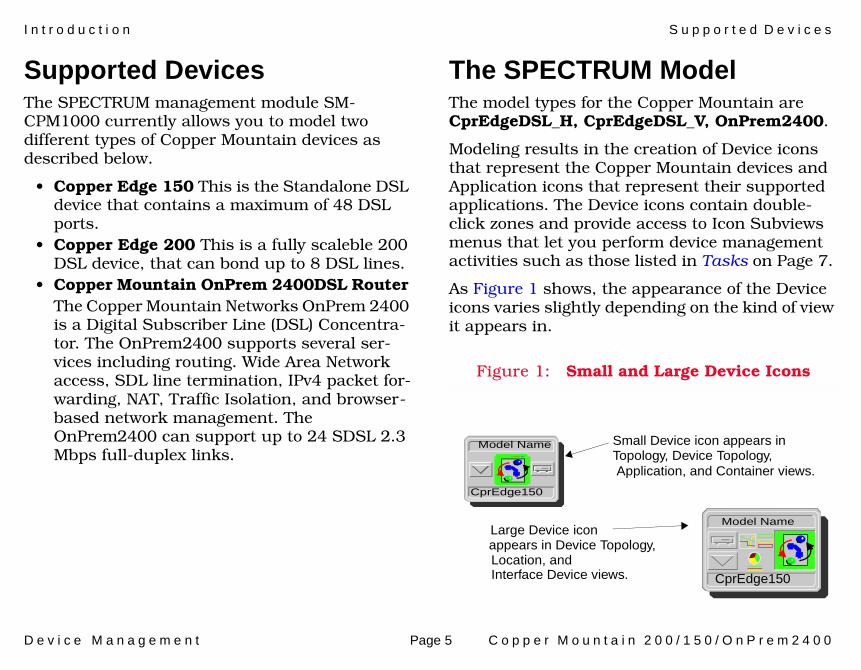
The SPECTRUM ModelThe model types for the Copper Mountain are CprEdgeDSL_H, CprEdgeDSL_V, OnPrem2400.
Modeling results in the creation of Device icons that represent the Copper Mountain devices and Application icons that represent their supported applications. The Device icons contain double-click zones and provide access to Icon Subviews menus that let you perform device management activities such as those listed in Tasks on Page 7.
As Figure 1 shows, the appearance of the Device icons varies slightly depending on the kind of view it appears in.
Figure 1: Small and Large Device Icons
Large Device iconModel Name
Model Name
CprEdge150
Small Device icon appears in
CprEdge150
Topology, Device Topology,
appears in Device Topology,Location, andInterface Device views.
Application, and Container views.
I n t r o d u c t i o n T h e S P E C T R U M M o d e l
D e v i c e M a n a g e m e n t Page 6 C o p p e r M o u n t a i n 2 0 0 / 1 5 0 / O n P r e m 2 4 0 0
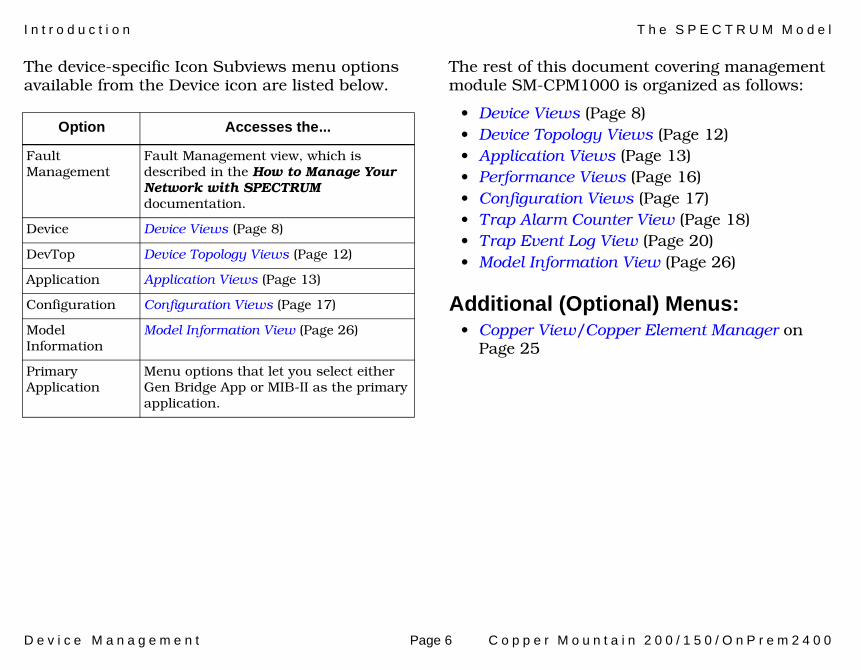
The device-specific Icon Subviews menu options available from the Device icon are listed below.
The rest of this document covering management module SM-CPM1000 is organized as follows:
• Device Views (Page 8)• Device Topology Views (Page 12)• Application Views (Page 13)• Performance Views (Page 16)• Configuration Views (Page 17)• Trap Alarm Counter View (Page 18)• Trap Event Log View (Page 20)• Model Information View (Page 26)
Additional (Optional) Menus:• Copper View/Copper Element Manager on
Page 25
Option Accesses the...
Fault Management
Fault Management view, which is described in the How to Manage Your Network with SPECTRUM documentation.
Device Device Views (Page 8)
DevTop Device Topology Views (Page 12)
Application Application Views (Page 13)
Configuration Configuration Views (Page 17)
Model Information
Model Information View (Page 26)
Primary Application
Menu options that let you select either Gen Bridge App or MIB-II as the primary application.
D e v i c e M a n a g e m e n t Page 7 C o p p e r M o u n t a i n 2 0 0 / 1 5 0 / O n P r e m 2 4 0 0
Tasks
This section lists device management tasks alphabetically and provides links to descriptions of the views and/or tables used to perform the task.
Application Information (examine)• Application Views (Page 13)
Device (configure)• Configuration Views (Page 17)
Device Performance (monitor)• Device Views (Page 8)
Launchable Applications• Copper View/Copper Element Manager
(Page 25)
Model Information (examine)• Model Information View (Page 26)
Model Redundancy (configure)• Device Configuration View (Page 17)
Port Configuration (examine/modify)• Interface Icons (Page 9)
• Device Configuration View (Page 17)
A Port (examine/enable/disable)• Interface Status View (Page 11)
Traps (view/monitor)• Trap Alarm Counter View (Page 18)• Trap Event Log View (Page 20)
D e v i c e M a n a g e m e n t Page 8 C o p p e r M o u n t a i n 2 0 0 / 1 5 0 / O n P r e m 2 4 0 0
Device Views
This section describes the Device views and subviews available for models of Copper Mountain devices in SPECTRUM.
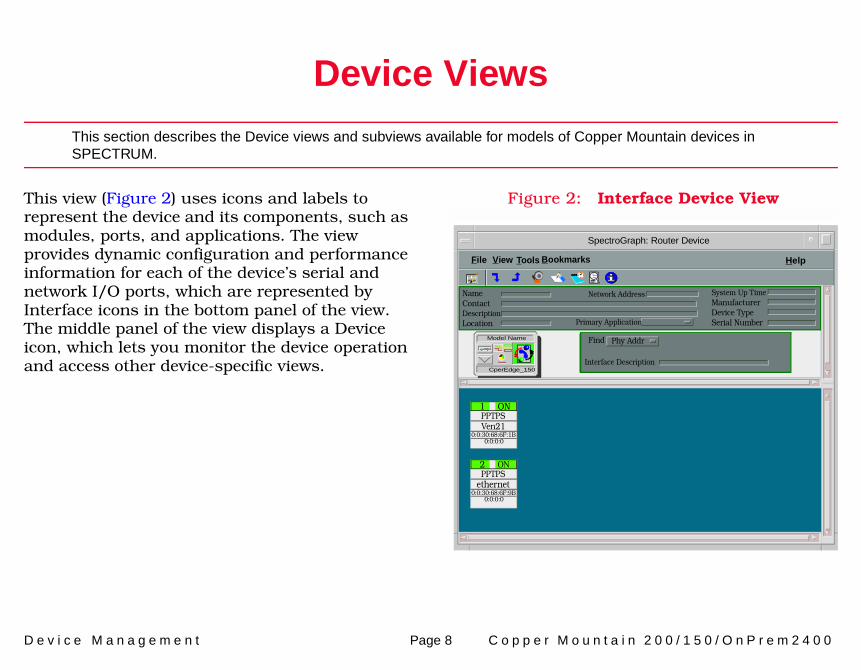
This view (Figure 2) uses icons and labels to represent the device and its components, such as modules, ports, and applications. The view provides dynamic configuration and performance information for each of the device’s serial and network I/O ports, which are represented by Interface icons in the bottom panel of the view. The middle panel of the view displays a Device icon, which lets you monitor the device operation and access other device-specific views.
Figure 2: Interface Device View
SpectroGraph: Router Device
File View
NameContactDescriptionLocation
System Up TimeManufacturerDevice TypeSerial Number
Network Address
Primary Application
Interface Description
Find Phy AddrModel Name
CperEdge_150
PPTPSVen21
1 ON
0:0:30:68:6F:1B0:0:0:0
PPTPSethernet
2 ON
0:0:30:68:6F:9B0:0:0:0
Tools Bookmarks Help
D e v i c e V i e w s I n t e r f a c e I c o n s
D e v i c e M a n a g e m e n t Page 9 C o p p e r M o u n t a i n 2 0 0 / 1 5 0 / O n P r e m 2 4 0 0
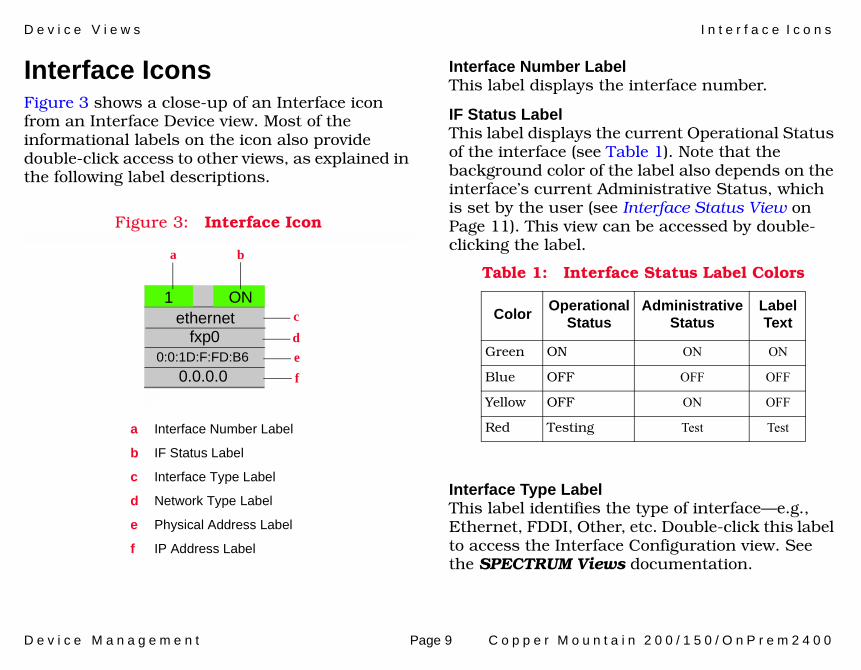
Interface IconsFigure 3 shows a close-up of an Interface icon from an Interface Device view. Most of the informational labels on the icon also provide double-click access to other views, as explained in the following label descriptions.
Figure 3: Interface Icon
Interface Number LabelThis label displays the interface number.
IF Status LabelThis label displays the current Operational Status of the interface (see Table 1). Note that the background color of the label also depends on the interface’s current Administrative Status, which is set by the user (see Interface Status View on Page 11). This view can be accessed by double-clicking the label.
Interface Type LabelThis label identifies the type of interface—e.g., Ethernet, FDDI, Other, etc. Double-click this label to access the Interface Configuration view. See the SPECTRUM Views documentation.
c
f
b
1ethernet
0:0:1D:F:FD:B6
a
a Interface Number Label
b IF Status Label
c Interface Type Label
d Network Type Label
e Physical Address Label
f IP Address Label
fxp0
0.0.0.0
d
e
ON
Table 1: Interface Status Label Colors
Color Operational Status
Administrative Status
Label Text
Green ON ON ON
Blue OFF OFF OFF
Yellow OFF ON OFF
Red Testing Test Test
D e v i c e V i e w s I n t e r f a c e I c o n S u b v i e w s M e n u O p t i o n s
D e v i c e M a n a g e m e n t Page 10 C o p p e r M o u n t a i n 2 0 0 / 1 5 0 / O n P r e m 2 4 0 0
Network Type LabelThis label identifies the type of network the interface is connected to. Double-click the label to open the Model Information view for the interface.
Physical Address LabelThis label displays the physical (MAC) address of the interface. Double-click this label to open the Address Translation Table (AT).
IP Address LabelThis label displays the IP address for the interface. Double-click the label to open the Secondary Address Panel (Page 11), which allows you to change the address and mask for this interface.
Interface Icon Subviews Menu OptionsTable 2 lists the Icon Subviews menu options available for the Interface icon.
Table 2: Interface Icon Subviews Menu
Option Opens the...
Detail Interface Detail view, which displays Packet, Error, and Discard Breakdown pie charts.
IF Status Interface Status View (Page 11)
IF Configuration Interface Configuration view (see SPECTRUM Views).
Address Translation Table
Address Translation Table (AT) (see SPECTRUM Views).
Secondary Address Panel
Secondary Address Panel (Page 11)
Thresholds Interface Threshold view, which allows you to set the on/off alarm thresholds for load, packet rate, error rate, and% discarded.
Model Information Model Information View (Page 26)
D e v i c e V i e w s I n t e r f a c e I c o n S u b v i e w s M e n u O p t i o n s
D e v i c e M a n a g e m e n t Page 11 C o p p e r M o u n t a i n 2 0 0 / 1 5 0 / O n P r e m 2 4 0 0
Interface Status ViewAccess: From the Icon Subviews menu for the Interface icon in the Interface Device view, select IF Status.
This view provides information on the operational status of the interface and allows you to enable or disable the port.
Operational StatusThe current state of the interface (ON, OFF, or Testing).
Administrative StatusThis button allows you to select the desired operational state of the interface (ON, OFF, or Testing).
Secondary Address PanelAccess: From the Icon Subviews menu for the Interface icon in the Interface Device view, select Secondary Address Panel.
This panel provides a table of IP addresses and masks obtained from the Address Translation table within the device’s firmware. You can change the current address displayed in the IP Address field by selecting an entry from the table in this panel and clicking the Update button.
D e v i c e M a n a g e m e n t Page 12 C o p p e r M o u n t a i n 2 0 0 / 1 5 0 / O n P r e m 2 4 0 0
Device Topology Views
This section provides brief descriptions of the Device Topology views available for models of Copper Mountain devices in SPECTRUM.
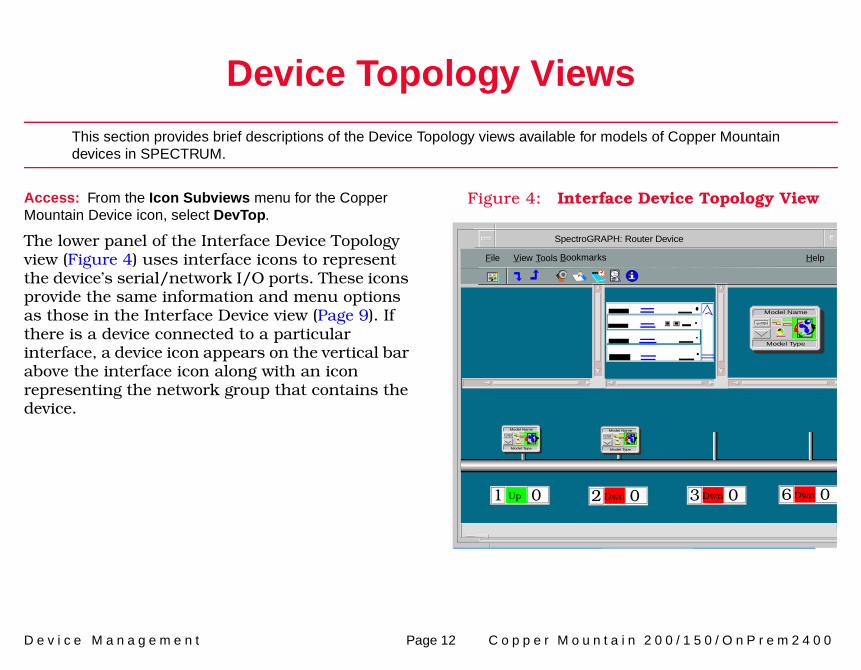
Access: From the Icon Subviews menu for the Copper Mountain Device icon, select DevTop.
The lower panel of the Interface Device Topology view (Figure 4) uses interface icons to represent the device’s serial/network I/O ports. These icons provide the same information and menu options as those in the Interface Device view (Page 9). If there is a device connected to a particular interface, a device icon appears on the vertical bar above the interface icon along with an icon representing the network group that contains the device.
Figure 4: Interface Device Topology View
modem
SpectroGRAPH: Router Device
Model Name
Model Type
File View Help
Model Name
Model Type
modem
etherne
t
undefined
undefined
undefined
modem
1 Up 0 2 Dwn 0 3 Dwn 0 6 Dwn 0
Tools Bookmarks
Model Name
Model Type
D e v i c e M a n a g e m e n t Page 13 C o p p e r M o u n t a i n 2 0 0 / 1 5 0 / O n P r e m 2 4 0 0
Application Views
This section describes the main Application view and the associated application-specific subviews available for models of Copper Mountain devices in SPECTRUM.
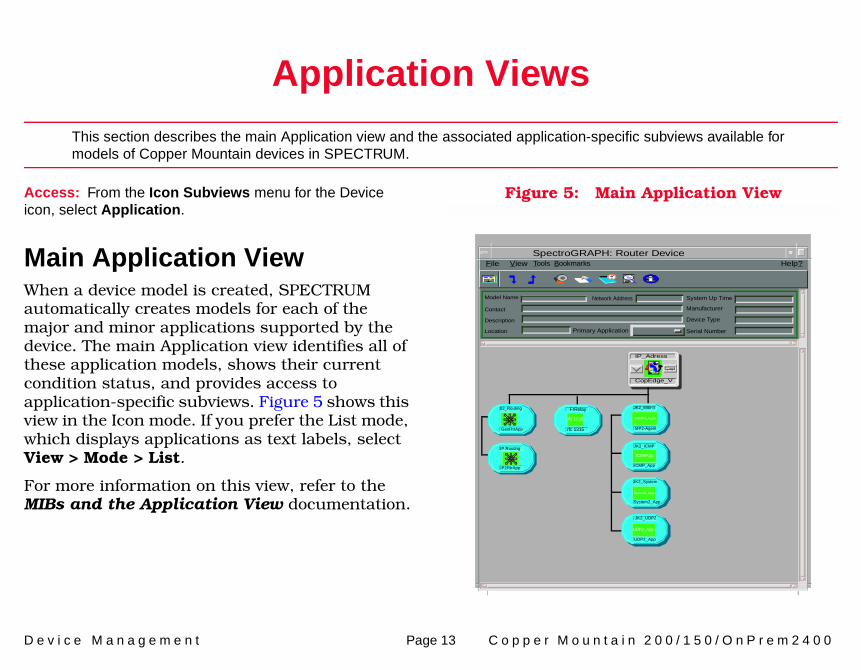
Access: From the Icon Subviews menu for the Device icon, select Application.
Main Application ViewWhen a device model is created, SPECTRUM automatically creates models for each of the major and minor applications supported by the device. The main Application view identifies all of these application models, shows their current condition status, and provides access to application-specific subviews. Figure 5 shows this view in the Icon mode. If you prefer the List mode, which displays applications as text labels, select View > Mode > List.
For more information on this view, refer to the MIBs and the Application View documentation.
Figure 5: Main Application View
SpectroGRAPH: Router Device
Model Name
Contact
Description
Location Primary Application
System Up Time
Manufacturer
Device Type
Serial Number
Network Address
02_Routing
GenRtrApp
File View Help?Tools Bookmarks
IP Routing
IP2RtrApp
JK2_MIB-II
MP2-Agent
JK2_ICMP
ICMP_App
SNMP2_Agent
ICMPApp
System2_App
UDP2_App
JK2_System
JK2_UDP2
System2_App
UDP2_App
IP_Adress
CopEdge_V
rfc 1315
FrRelay
rfc 1315
A p p l i c a t i o n V i e w s S u p p o r t e d A p p l i c a t i o n s
D e v i c e M a n a g e m e n t Page 14 C o p p e r M o u n t a i n 2 0 0 / 1 5 0 / O n P r e m 2 4 0 0
Supported ApplicationsSPECTRUM’s applications can be grouped within two general categories as follows:
• Common Applications, below• Device-Specific Applications (Page 15)
Common Applications For the most part, these applications represent the non proprietary MIBs supported by your device. Listed below (beneath the title of the SPECTRUM document that describes them) are some of the common applications currently supported by SPECTRUM.
• Routing Applications- Generic Routing- Repeater- AppleTalk- DECnet- Open Shortest Path First
• Bridging Applications- Spanning Tree- Static- Transparent- PPP Bridging- Source Routing- Translation
• Transmission Applications- FDDI- Point to Point- DS1- DS3- RS-232- WAN- Frame Relay- Token Ring- Ethernet- Fast Ethernet- rfc1317App- rfc1285App- rfc1315App- 802.11App
- SONET
• MIB II Applications- SNMP- IP
Note:Note:
The documents listed below (in bold font) are available for viewing at:
www.aprisma.com/manuals/
A p p l i c a t i o n V i e w s D s 3 A p p 1 4 0 7 A p p l i c a t i o n
D e v i c e M a n a g e m e n t Page 15 C o p p e r M o u n t a i n 2 0 0 / 1 5 0 / O n P r e m 2 4 0 0
- ICMP- TCP- System2- UDP
• Technology Applications- APPN- ATM Client- DHCP- PNNI- rfc1316App- DLSw
• DOCSIS Applications- DOCSISCblDvApp - DOCSISQOSApp- DOCSISBPI2App - DOCSISBPIApp - DOCSISIFApp
• Digital Subscriber Line Applications- ADSL
Device-Specific ApplicationsSPECTRUM imports the following device-level proprietary MIBs into its database:
• Copper-Mountain-TC-MIB• Copper-Mountain-Networks-DSL-MIB
• Copper-Mountain-Trap-MIB• Copper-Mountain-TC-MIB
These MIBs can be used in conjunction with SPECTRUM’s optional customization products (referred to as the Level I Tool Kits) to create application models and views that display the condition of selected MIB fields.
Ds3App1407 Application This application is described in the Transmission Applications documentation.
Note:Note:
Aprisma Management Technologies can provide training, technical assistance, and custom engineering support services for creating application models and their associated views.
D e v i c e M a n a g e m e n t Page 16 C o p p e r M o u n t a i n 2 0 0 / 1 5 0 / O n P r e m 2 4 0 0
Performance Views
This section introduces the Performance view. For details concerning this view, refer to the SPECTRUM Views documentation.
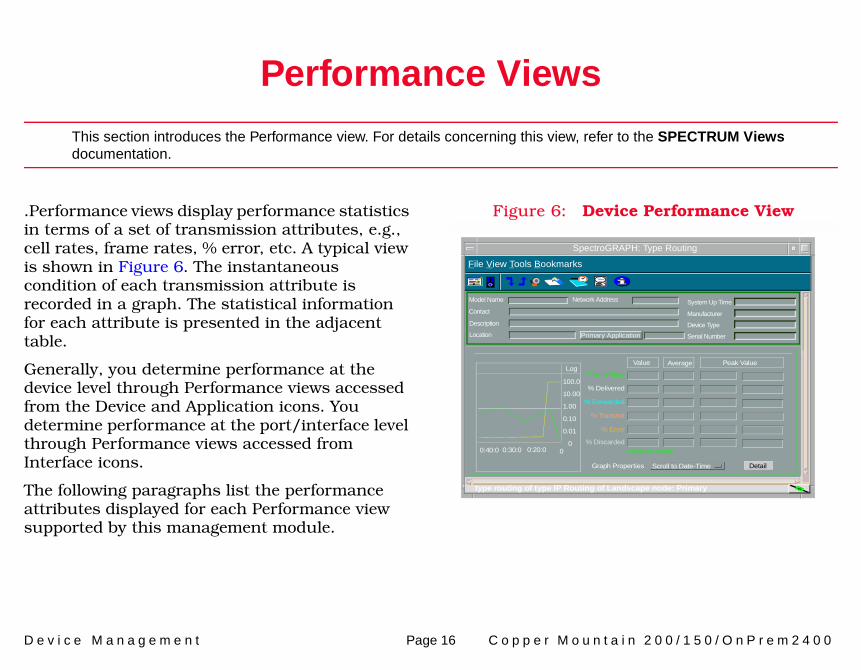
.Performance views display performance statistics in terms of a set of transmission attributes, e.g., cell rates, frame rates, % error, etc. A typical view is shown in Figure 6. The instantaneous condition of each transmission attribute is recorded in a graph. The statistical information for each attribute is presented in the adjacent table.
Generally, you determine performance at the device level through Performance views accessed from the Device and Application icons. You determine performance at the port/interface level through Performance views accessed from Interface icons.
The following paragraphs list the performance attributes displayed for each Performance view supported by this management module.
Figure 6: Device Performance View
SpectroGRAPH: Type Routing
Model Name
Contact
Description
Location
Network Address System Up Time
Manufacturer
Device Type
Serial Number
Log
100.0
10.00
1.00
0.10
0.01
000:40:0 0:30:0 0:20:0
Value Average Peak Value
* Frame Rate
% Delivered
% Forwarded
% Transmit
% Error
DetailGraph Properties Scroll to Date-Time
File View Tools Bookmarks
% Discarded*Frames per second
type routing of type IP Routing of Landscape node: Primary
Primary Application
D e v i c e M a n a g e m e n t Page 17 C o p p e r M o u n t a i n 2 0 0 / 1 5 0 / O n P r e m 2 4 0 0
Configuration Views
This section describes the Configuration views available for models of the Copper Mountain devices in SPECTRUM.
Configuration views allow you to see and modify current settings for the modeled device and its interfaces, ports, and applications. The following Configuration views are available for models of Copper Mountain devices:
• Device Configuration View (Page 17)
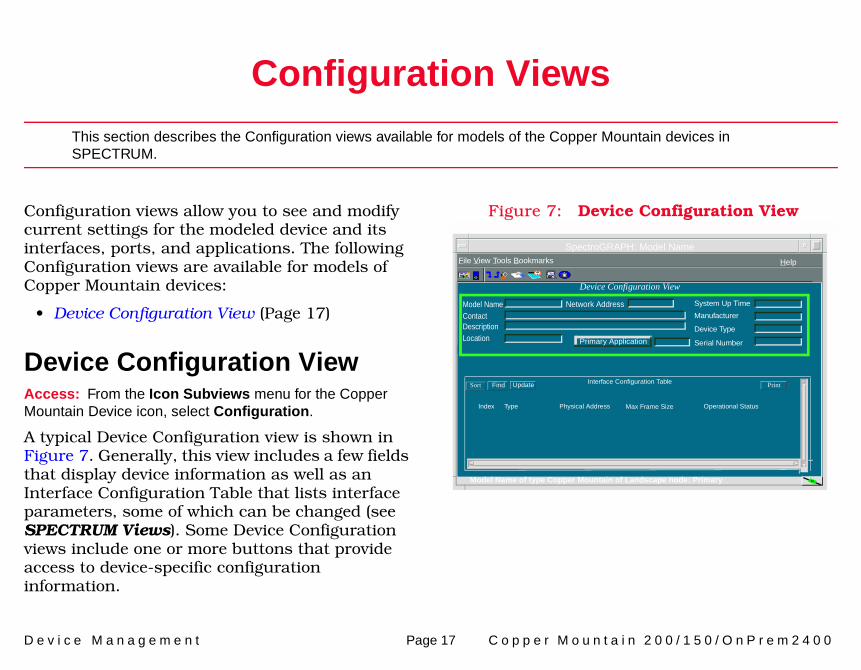
Device Configuration ViewAccess: From the Icon Subviews menu for the Copper Mountain Device icon, select Configuration.
A typical Device Configuration view is shown in Figure 7. Generally, this view includes a few fields that display device information as well as an Interface Configuration Table that lists interface parameters, some of which can be changed (see SPECTRUM Views). Some Device Configuration views include one or more buttons that provide access to device-specific configuration information.
Figure 7: Device Configuration View
SpectroGRAPH: Model Name
Primary Application
System Up Time
Manufacturer
Device Type
Serial Number
Network AddressModel NameContactDescriptionLocation
Device Configuration View
Interface Configuration TableSort Find Update
File View Tools Bookmarks
Index Type Physical Address Max Frame Size Operational Status
Model Name of type Copper Mountain of Landscape node: Primary
Help
D e v i c e M a n a g e m e n t Page 18 C o p p e r M o u n t a i n 2 0 0 / 1 5 0 / O n P r e m 2 4 0 0
Trap Alarm Counter View
This section provides information on the various indicators of alarms and alarm types provided with this view.
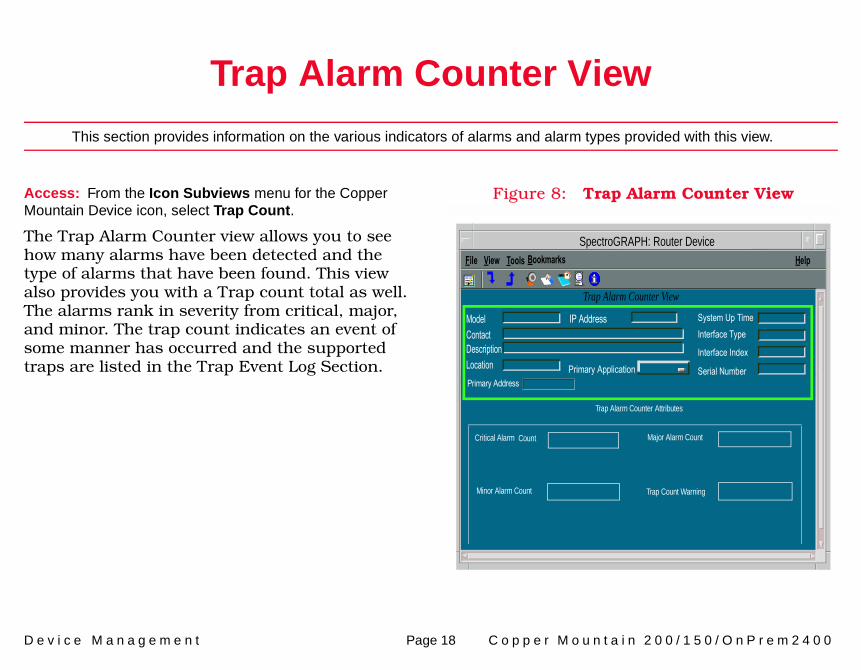
Access: From the Icon Subviews menu for the Copper Mountain Device icon, select Trap Count.
The Trap Alarm Counter view allows you to see how many alarms have been detected and the type of alarms that have been found. This view also provides you with a Trap count total as well. The alarms rank in severity from critical, major, and minor. The trap count indicates an event of some manner has occurred and the supported traps are listed in the Trap Event Log Section.
Figure 8: Trap Alarm Counter View
SpectroGRAPH: Router Device
Primary Application
System Up TimeInterface Type
Interface Index
Serial Number
IP AddressModel ContactDescriptionLocation
File View Help
Primary Address
Trap Alarm Counter View
Tools Bookmarks
Trap Alarm Counter Attributes
Critical Alarm Count
Minor Alarm Count
Major Alarm Count
Trap Count Warning
T r a p A l a r m C o u n t e r V i e w T r a p A l a r m C o u n t e r A t t r i b u t e s
D e v i c e M a n a g e m e n t Page 19 C o p p e r M o u n t a i n 2 0 0 / 1 5 0 / O n P r e m 2 4 0 0
Trap Alarm Counter AttributesThe Trap Alarm Counter Attributes provide the following information:
Critical AlarmDisplays the number of uncleared critical alarms.
MajorDisplays the number of uncleared major alarms.
MinorDisplays the number of uncleared minor alarms.
TrapsDisplays the number of uncleared traps. See the Trap Event Table (Page 21) for further details on supported traps.
D e v i c e M a n a g e m e n t Page 20 C o p p e r M o u n t a i n 2 0 0 / 1 5 0 / O n P r e m 2 4 0 0
Trap Event Log View
This section provides details of the events and traps on the monitored device.
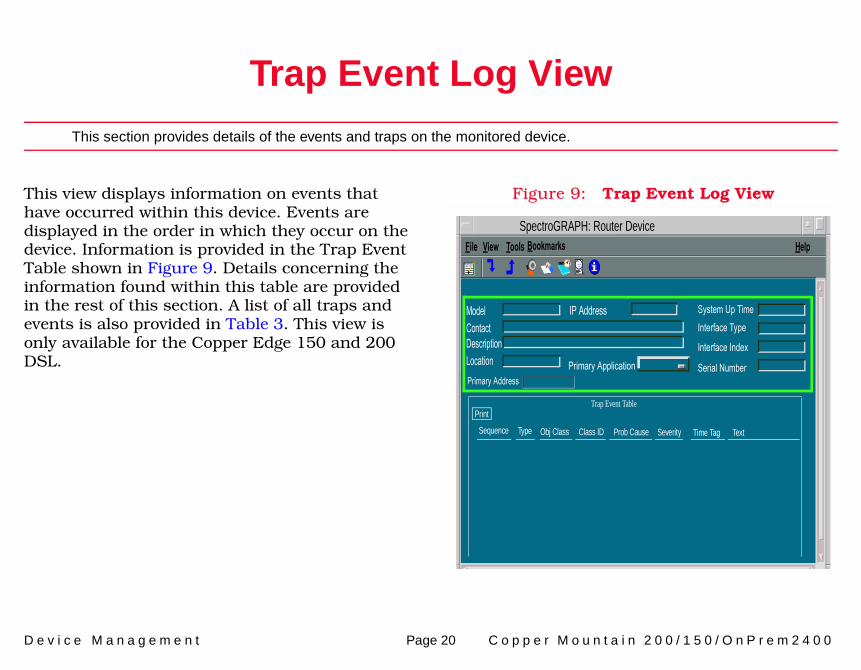
This view displays information on events that have occurred within this device. Events are displayed in the order in which they occur on the device. Information is provided in the Trap Event Table shown in Figure 9. Details concerning the information found within this table are provided in the rest of this section. A list of all traps and events is also provided in Table 3. This view is only available for the Copper Edge 150 and 200 DSL.
Figure 9: Trap Event Log View
SpectroGRAPH: Router Device
Primary Application
System Up TimeInterface Type
Interface Index
Serial Number
IP AddressModel ContactDescriptionLocation
File View Help
Primary Address
Trap Event Table
Tools Bookmarks
Sequence Type Obj Class Class ID Prob Cause Severity Time Tag Text
T r a p E v e n t L o g V i e w T r a p E v e n t T a b l e
D e v i c e M a n a g e m e n t Page 21 C o p p e r M o u n t a i n 2 0 0 / 1 5 0 / O n P r e m 2 4 0 0
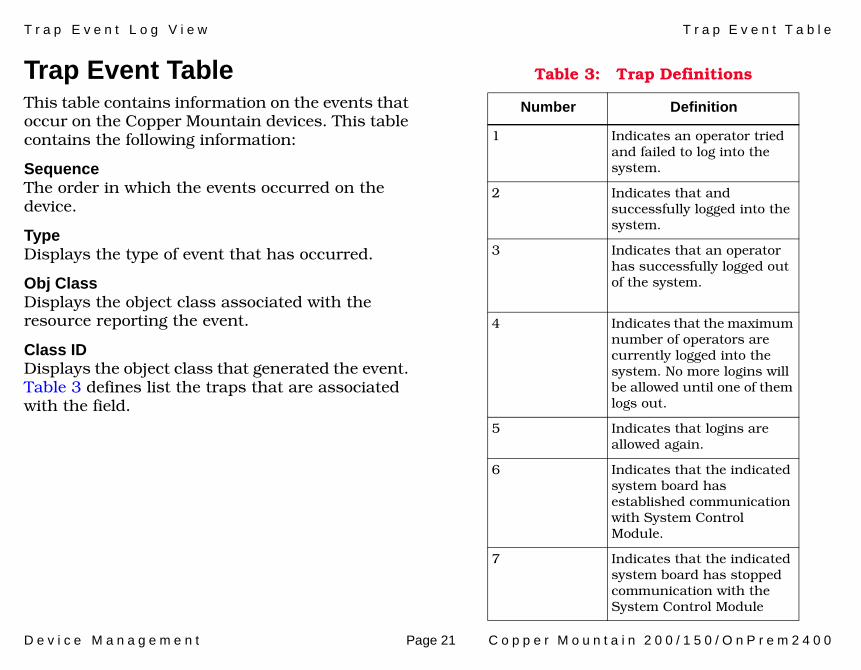
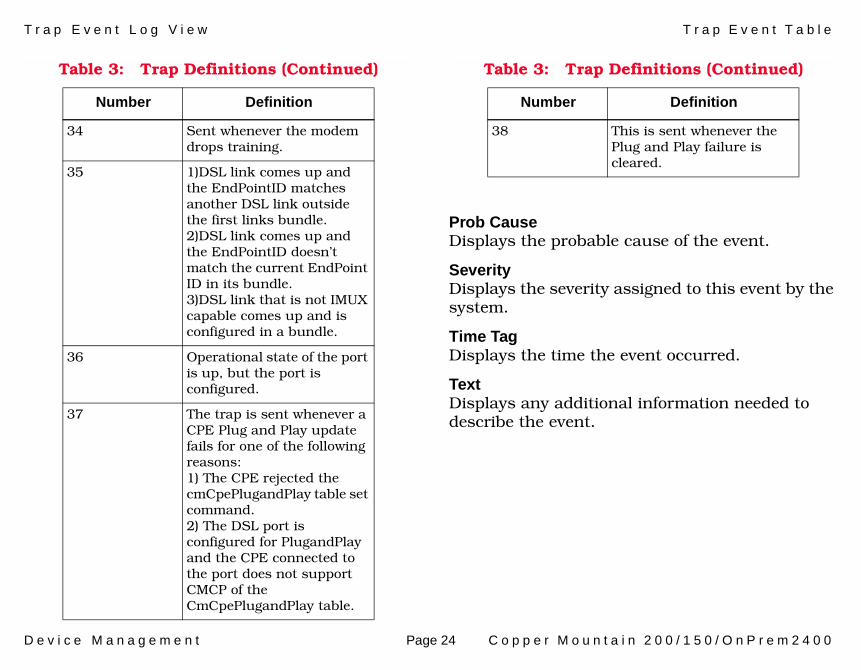
Trap Event TableThis table contains information on the events that occur on the Copper Mountain devices. This table contains the following information:
SequenceThe order in which the events occurred on the device.
TypeDisplays the type of event that has occurred.
Obj ClassDisplays the object class associated with the resource reporting the event.
Class IDDisplays the object class that generated the event. Table 3 defines list the traps that are associated with the field.
Table 3: Trap Definitions
Number Definition
1 Indicates an operator tried and failed to log into the system.
2 Indicates that and successfully logged into the system.
3 Indicates that an operator has successfully logged out of the system.
4 Indicates that the maximum number of operators are currently logged into the system. No more logins will be allowed until one of them logs out.
5 Indicates that logins are allowed again.
6 Indicates that the indicated system board has established communication with System Control Module.
7 Indicates that the indicated system board has stopped communication with the System Control Module
T r a p E v e n t L o g V i e w T r a p E v e n t T a b l e
D e v i c e M a n a g e m e n t Page 22 C o p p e r M o u n t a i n 2 0 0 / 1 5 0 / O n P r e m 2 4 0 0
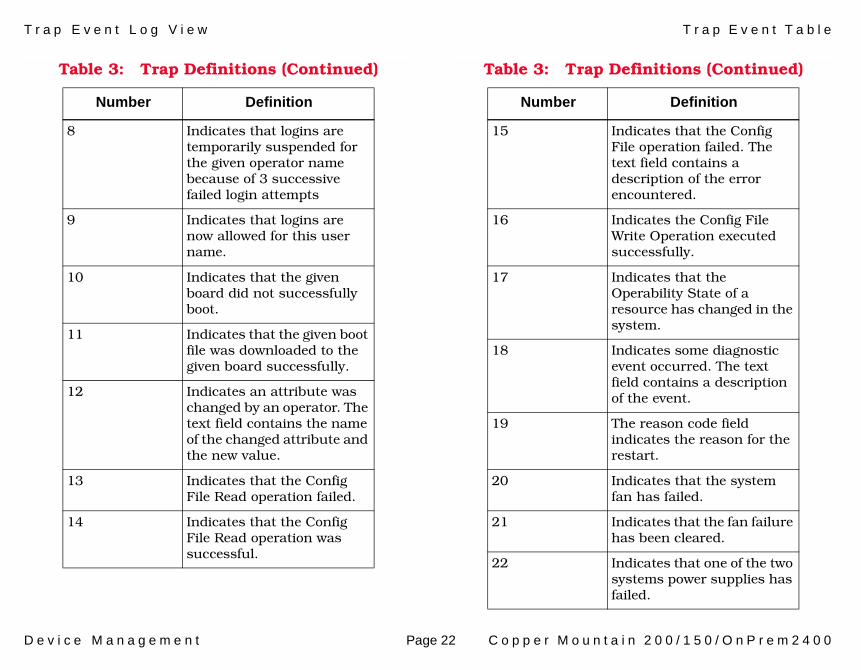
8 Indicates that logins are temporarily suspended for the given operator name because of 3 successive failed login attempts
9 Indicates that logins are now allowed for this user name.
10 Indicates that the given board did not successfully boot.
11 Indicates that the given boot file was downloaded to the given board successfully.
12 Indicates an attribute was changed by an operator. The text field contains the name of the changed attribute and the new value.
13 Indicates that the Config File Read operation failed.
14 Indicates that the Config File Read operation was successful.
Table 3: Trap Definitions (Continued)
Number Definition
15 Indicates that the Config File operation failed. The text field contains a description of the error encountered.
16 Indicates the Config File Write Operation executed successfully.
17 Indicates that the Operability State of a resource has changed in the system.
18 Indicates some diagnostic event occurred. The text field contains a description of the event.
19 The reason code field indicates the reason for the restart.
20 Indicates that the system fan has failed.
21 Indicates that the fan failure has been cleared.
22 Indicates that one of the two systems power supplies has failed.
Table 3: Trap Definitions (Continued)
Number Definition
T r a p E v e n t L o g V i e w T r a p E v e n t T a b l e
D e v i c e M a n a g e m e n t Page 23 C o p p e r M o u n t a i n 2 0 0 / 1 5 0 / O n P r e m 2 4 0 0
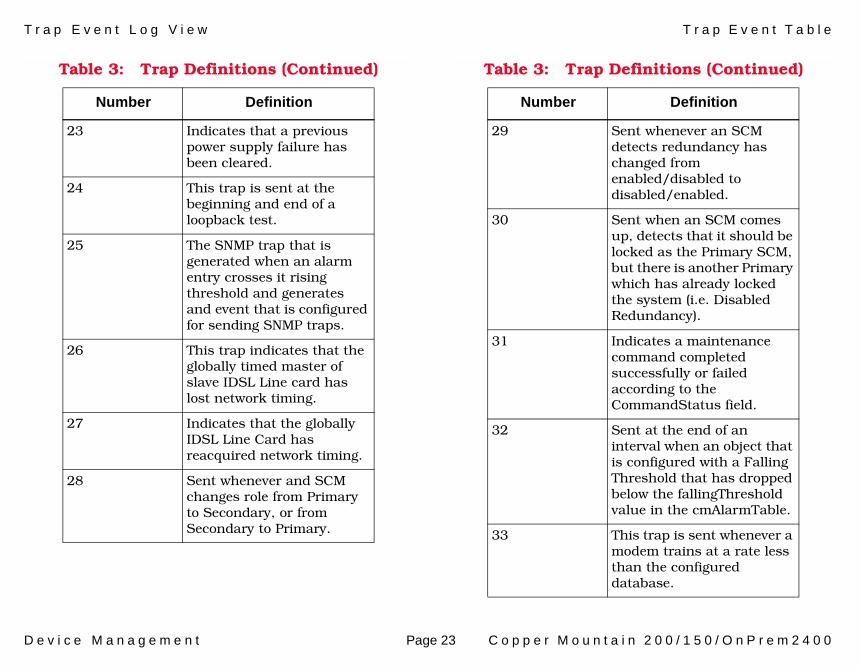
23 Indicates that a previous power supply failure has been cleared.
24 This trap is sent at the beginning and end of a loopback test.
25 The SNMP trap that is generated when an alarm entry crosses it rising threshold and generates and event that is configured for sending SNMP traps.
26 This trap indicates that the globally timed master of slave IDSL Line card has lost network timing.
27 Indicates that the globally IDSL Line Card has reacquired network timing.
28 Sent whenever and SCM changes role from Primary to Secondary, or from Secondary to Primary.
Table 3: Trap Definitions (Continued)
Number Definition
29 Sent whenever an SCM detects redundancy has changed from enabled/disabled to disabled/enabled.
30 Sent when an SCM comes up, detects that it should be locked as the Primary SCM, but there is another Primary which has already locked the system (i.e. Disabled Redundancy).
31 Indicates a maintenance command completed successfully or failed according to the CommandStatus field.
32 Sent at the end of an interval when an object that is configured with a Falling Threshold that has dropped below the fallingThreshold value in the cmAlarmTable.
33 This trap is sent whenever a modem trains at a rate less than the configured database.
Table 3: Trap Definitions (Continued)
Number Definition
T r a p E v e n t L o g V i e w T r a p E v e n t T a b l e
D e v i c e M a n a g e m e n t Page 24 C o p p e r M o u n t a i n 2 0 0 / 1 5 0 / O n P r e m 2 4 0 0
Prob CauseDisplays the probable cause of the event.
SeverityDisplays the severity assigned to this event by the system.
Time TagDisplays the time the event occurred.
TextDisplays any additional information needed to describe the event.
34 Sent whenever the modem drops training.
35 1)DSL link comes up and the EndPointID matches another DSL link outside the first links bundle. 2)DSL link comes up and the EndPointID doesn’t match the current EndPoint ID in its bundle.3)DSL link that is not IMUX capable comes up and is configured in a bundle.
36 Operational state of the port is up, but the port is configured.
37 The trap is sent whenever a CPE Plug and Play update fails for one of the following reasons:1) The CPE rejected the cmCpePlugandPlay table set command.2) The DSL port is configured for PlugandPlay and the CPE connected to the port does not support CMCP of the CmCpePlugandPlay table.
Table 3: Trap Definitions (Continued)
Number Definition
38 This is sent whenever the Plug and Play failure is cleared.
Table 3: Trap Definitions (Continued)
Number Definition
D e v i c e M a n a g e m e n t Page 25 C o p p e r M o u n t a i n 2 0 0 / 1 5 0 / O n P r e m 2 4 0 0
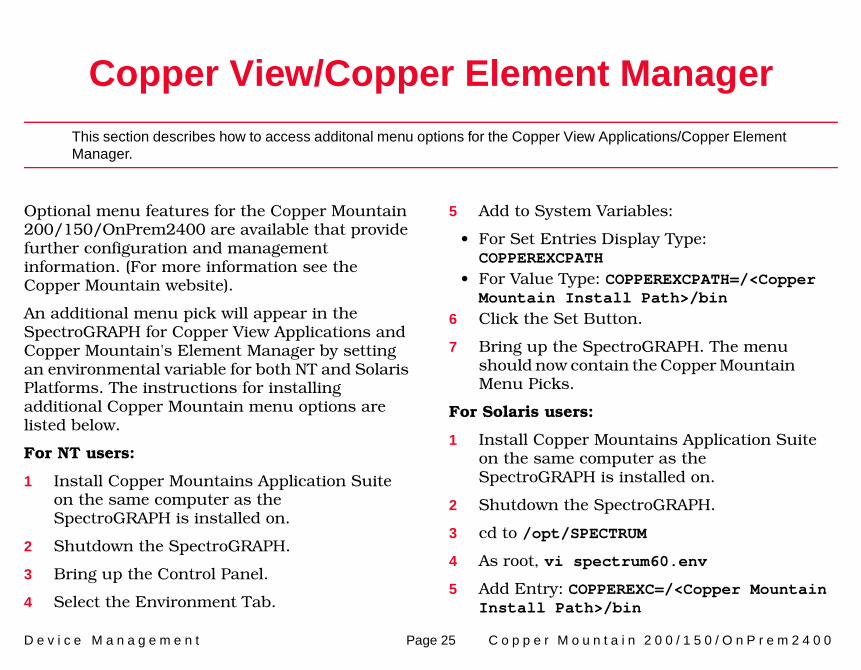
Copper View/Copper Element Manager
This section describes how to access additonal menu options for the Copper View Applications/Copper Element Manager.
Optional menu features for the Copper Mountain 200/150/OnPrem2400 are available that provide further configuration and management information. (For more information see the Copper Mountain website).
An additional menu pick will appear in the SpectroGRAPH for Copper View Applications and Copper Mountain's Element Manager by setting an environmental variable for both NT and Solaris Platforms. The instructions for installing additional Copper Mountain menu options are listed below.
For NT users:
1 Install Copper Mountains Application Suite on the same computer as the SpectroGRAPH is installed on.
2 Shutdown the SpectroGRAPH.
3 Bring up the Control Panel.
4 Select the Environment Tab.
5 Add to System Variables:
• For Set Entries Display Type: COPPEREXCPATH
• For Value Type: COPPEREXCPATH=/<Copper Mountain Install Path>/bin
6 Click the Set Button.
7 Bring up the SpectroGRAPH. The menu should now contain the Copper Mountain Menu Picks.
For Solaris users:
1 Install Copper Mountains Application Suite on the same computer as the SpectroGRAPH is installed on.
2 Shutdown the SpectroGRAPH.
3 cd to /opt/SPECTRUM
4 As root, vi spectrum60.env
5 Add Entry: COPPEREXC=/<Copper Mountain Install Path>/bin
D e v i c e M a n a g e m e n t Page 26 C o p p e r M o u n t a i n 2 0 0 / 1 5 0 / O n P r e m 2 4 0 0
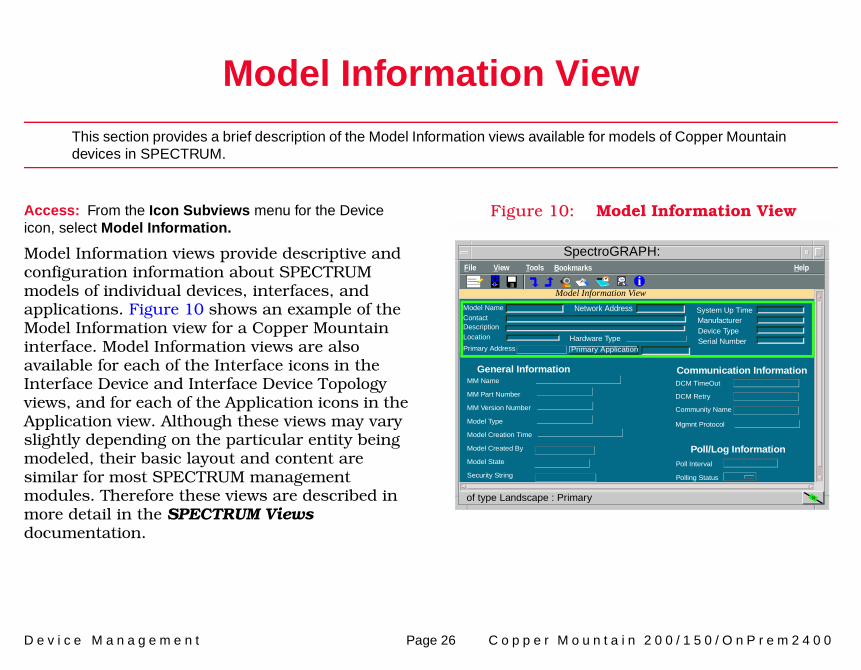
Model Information View
This section provides a brief description of the Model Information views available for models of Copper Mountain devices in SPECTRUM.
Access: From the Icon Subviews menu for the Device icon, select Model Information.
Model Information views provide descriptive and configuration information about SPECTRUM models of individual devices, interfaces, and applications. Figure 10 shows an example of the Model Information view for a Copper Mountain interface. Model Information views are also available for each of the Interface icons in the Interface Device and Interface Device Topology views, and for each of the Application icons in the Application view. Although these views may vary slightly depending on the particular entity being modeled, their basic layout and content are similar for most SPECTRUM management modules. Therefore these views are described in more detail in the SPECTRUM Views documentation.
Figure 10: Model Information View
of type Landscape : Primary
Primary Application
System Up TimeManufacturerDevice TypeSerial Number
Network AddressModel NameContactDescriptionLocation
File View HelpTools
Security String
Model Created By
Model State
General Information
MM Part Number
Model Creation Time
MM Name
MM Version Number
Model Type
Model Information View
Communication Information
Community Name
DCM TimeOut
DCM Retry
Poll/Log InformationPoll Interval
Polling Status
Mgmnt Protocol
Hardware TypePrimary Address
i
SpectroGRAPH: Bookmarks
D e v i c e M a n a g e m e n t Page 27 C o p p e r M o u n t a i n 2 0 0 / 1 0 0 / O n P r e m 2 4 0 0
27
Index
AAddress Translation table 11Administrative Status 11Applications 13
CColors
Interface Status Label 9Configuration views 17
DDevice Configuration View 17Devices supported by this module 5DS/E3 Information 15
IIcon Subviews Menus
for Interface icon 10Icons
Interface 9, 12Interface icon 9
Interface Icon Subviews Menu Options 10
Interface Status View 11Administrative Status 11Operational Status 11
LLabels
InterfaceIF Status Label 9Interface Number Label 9Interface Type Label 9Physical Address Label 10
MModel Information View 26
NNetwork I/O ports 12
OOperational Status 11
RRequired Reading 4
SSecondary Address Panel 11Serial ports 12Supported devices 5
TTrap Event Table 20
VViews
Configuration 17Interface Status 11Performance 16