Embed Size (px)
Citation preview
Copper market outlook:
Transitioning to deficits
Prepared for:
Nonferrous Metals Forum of the Shanghai Derivatives
Market Forum, 25th May 2017
Prepared by:
Erik Heimlich,
Senior Consultant, Copper
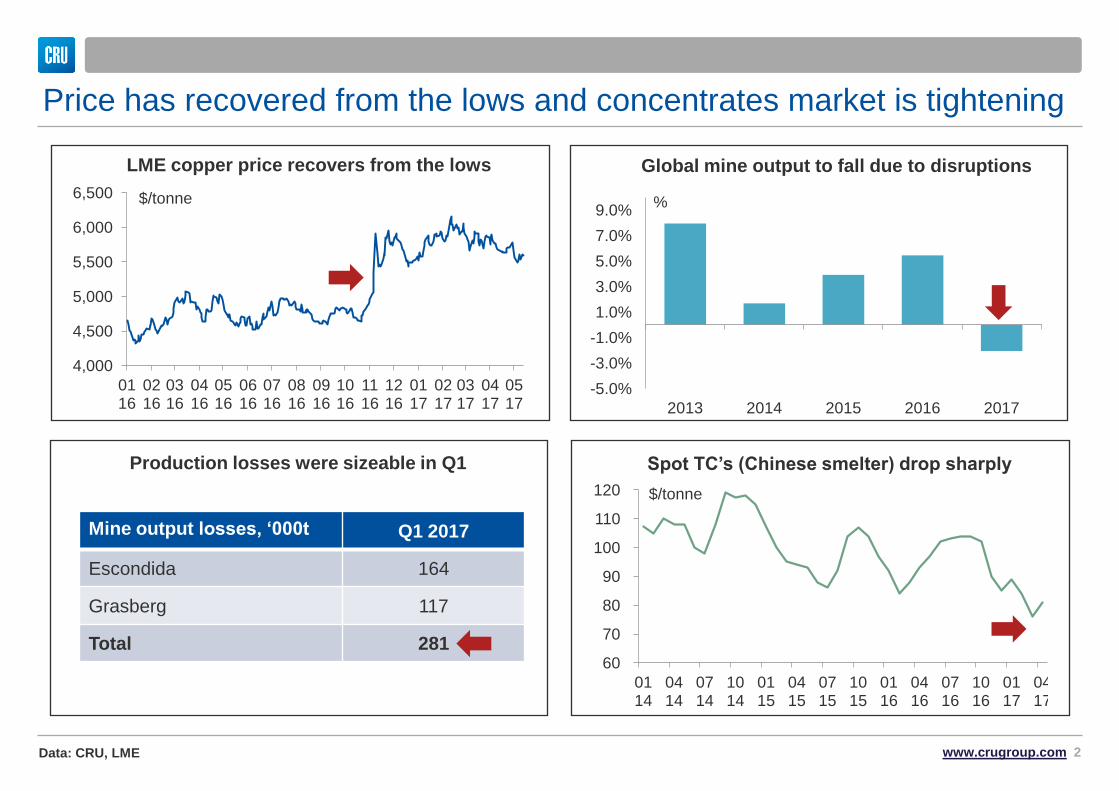
Price has recovered from the lows and concentrates market is tightening
4,000
4,500
5,000
5,500
6,000
6,500
01 16
02 16
03 16
04 16
05 16
06 16
07 16
08 16
09 16
10 16
11 16
12 16
01 17
02 17
03 17
04 17
05 17
LME copper price recovers from the lows
$/tonne
Spot TC’s (Chinese smelter) drop sharply
Global mine output to fall due to disruptions
Production losses were sizeable in Q1
60
70
80
90
100
110
120
01 14
04 14
07 14
10 14
01 15
04 15
07 15
10 15
01 16
04 16
07 16
10 16
01 17
04 17
$/tonne
-5.0%
-3.0%
-1.0%
1.0%
3.0%
5.0%
7.0%
9.0%
2013 2014 2015 2016 2017
%
Mine output losses, ‘000t Q1 2017
Escondida 164
Grasberg 117
Total 281
www.crugroup.com 2 Data: CRU, LME
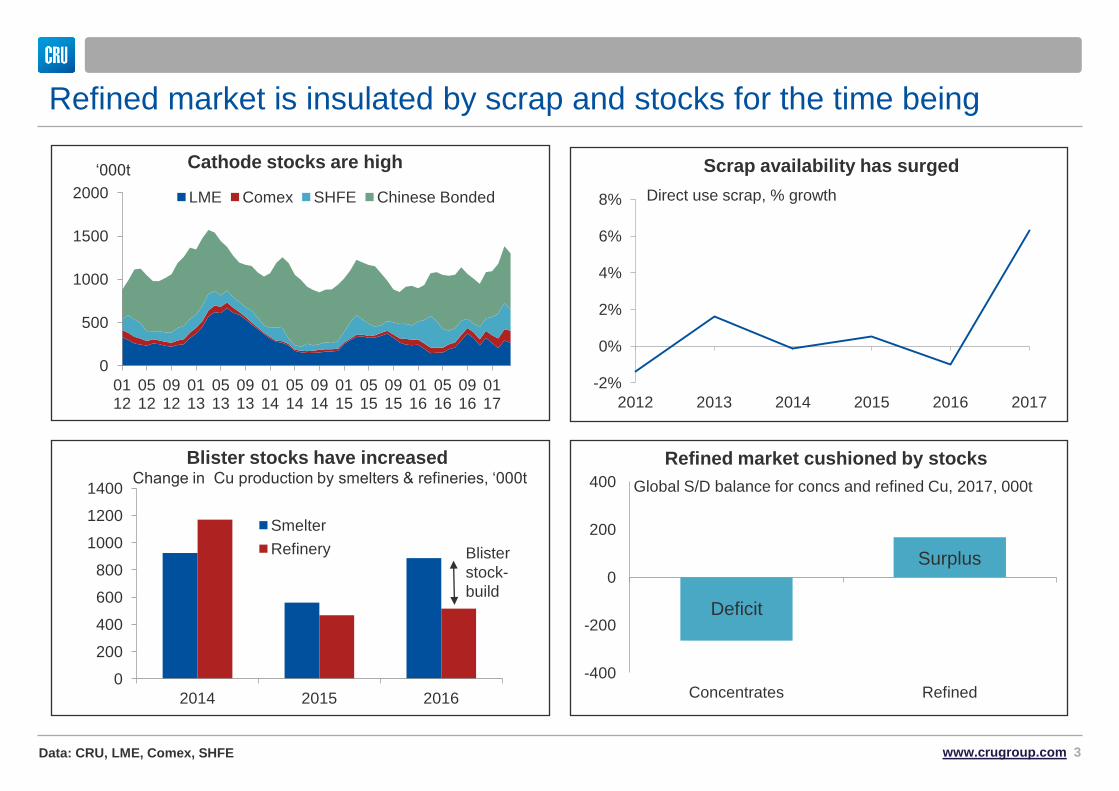
Refined market is insulated by scrap and stocks for the time being
0
500
1000
1500
2000
01 12
05 12
09 12
01 13
05 13
09 13
01 14
05 14
09 14
01 15
05 15
09 15
01 16
05 16
09 16
01 17
LME Comex SHFE Chinese Bonded
Cathode stocks are high ‘000t Scrap availability has surged
Blister stocks have increased Refined market cushioned by stocks
-2%
0%
2%
4%
6%
8%
2012 2013 2014 2015 2016 2017
Direct use scrap, % growth
-400
-200
0
200
400
Concentrates Refined
Global S/D balance for concs and refined Cu, 2017, 000t
0
200
400
600
800
1000
1200
1400
2014 2015 2016
Smelter
Refinery
Change in Cu production by smelters & refineries, ‘000t
Blister
stock-
build Deficit
Surplus
www.crugroup.com 3 Data: CRU, LME, Comex, SHFE
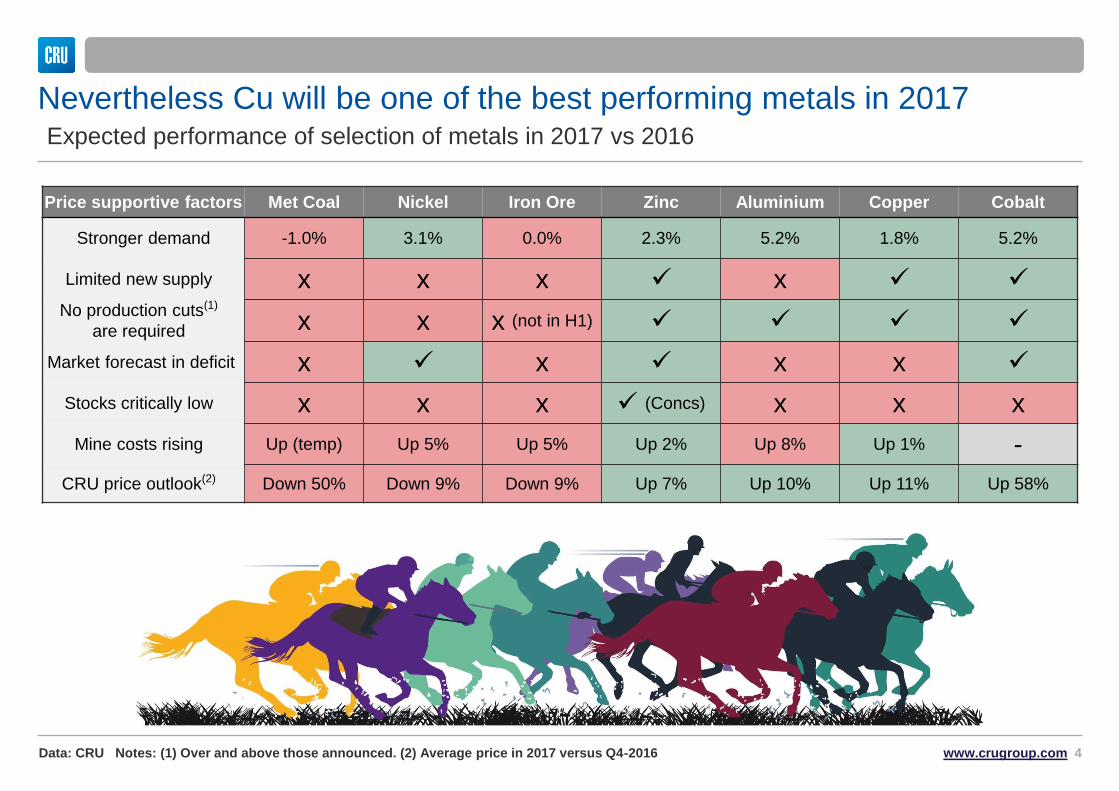
Price supportive factors Met Coal Nickel Iron Ore Zinc Aluminium Copper Cobalt
Stronger demand -1.0% 3.1% 0.0% 2.3% 5.2% 1.8% 5.2%
Limited new supply x x x x No production cuts(1)
are required x x x (not in H1)
Market forecast in deficit x x x x
Stocks critically low x x x (Concs) x x x
Mine costs rising Up (temp) Up 5% Up 5% Up 2% Up 8% Up 1% -
CRU price outlook(2) Down 50% Down 9% Down 9% Up 7% Up 10% Up 11% Up 58%
www.crugroup.com 4 Data: CRU Notes: (1) Over and above those announced. (2) Average price in 2017 versus Q4-2016
Nevertheless Cu will be one of the best performing metals in 2017 Expected performance of selection of metals in 2017 vs 2016

Structural deficits are imminent for the copper market
Existing mine production to decline by 1% p.a. in years to 2025, due
to declining ore grades and reserve exhaustion
The downturn has led to project delays, downsizing and
cancellations of projects and expansions
Scrap availability to grow more strongly in higher price environment
but will not fully compensate for the slow growth in mine supply
There are limits to the speed at which producers can bring new mine
supply on-stream quickly
As long as global demand continues to expand at close to 2.0% p.a.,
structural deficits in this market appear inevitable
Exploration
Discovery
Construction
Feasibility
Production
www.crugroup.com 5 Data: CRU
Data: CRU
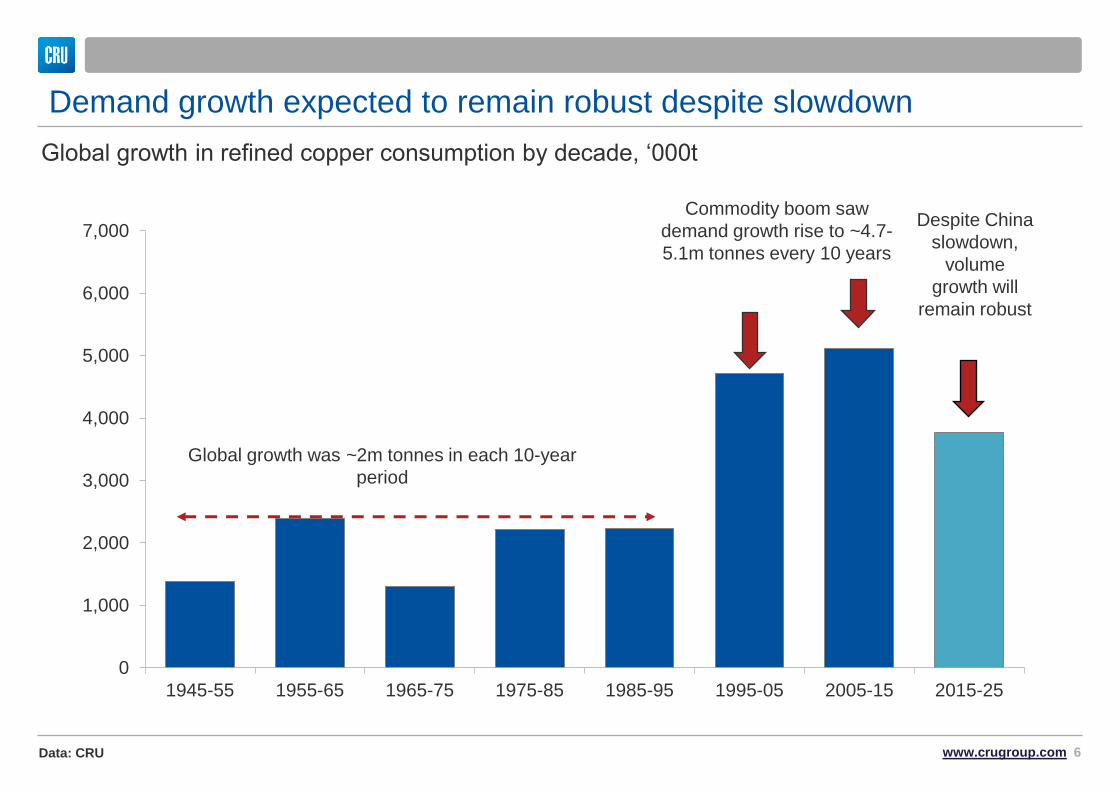
Demand growth expected to remain robust despite slowdown
0
1,000
2,000
3,000
4,000
5,000
6,000
7,000
1945-55 1955-65 1965-75 1975-85 1985-95 1995-05 2005-15 2015-25
Global growth was ~2m tonnes in each 10-year
period
Commodity boom saw
demand growth rise to ~4.7-
5.1m tonnes every 10 years
www.crugroup.com 6
Despite China
slowdown,
volume
growth will
remain robust
Global growth in refined copper consumption by decade, ‘000t
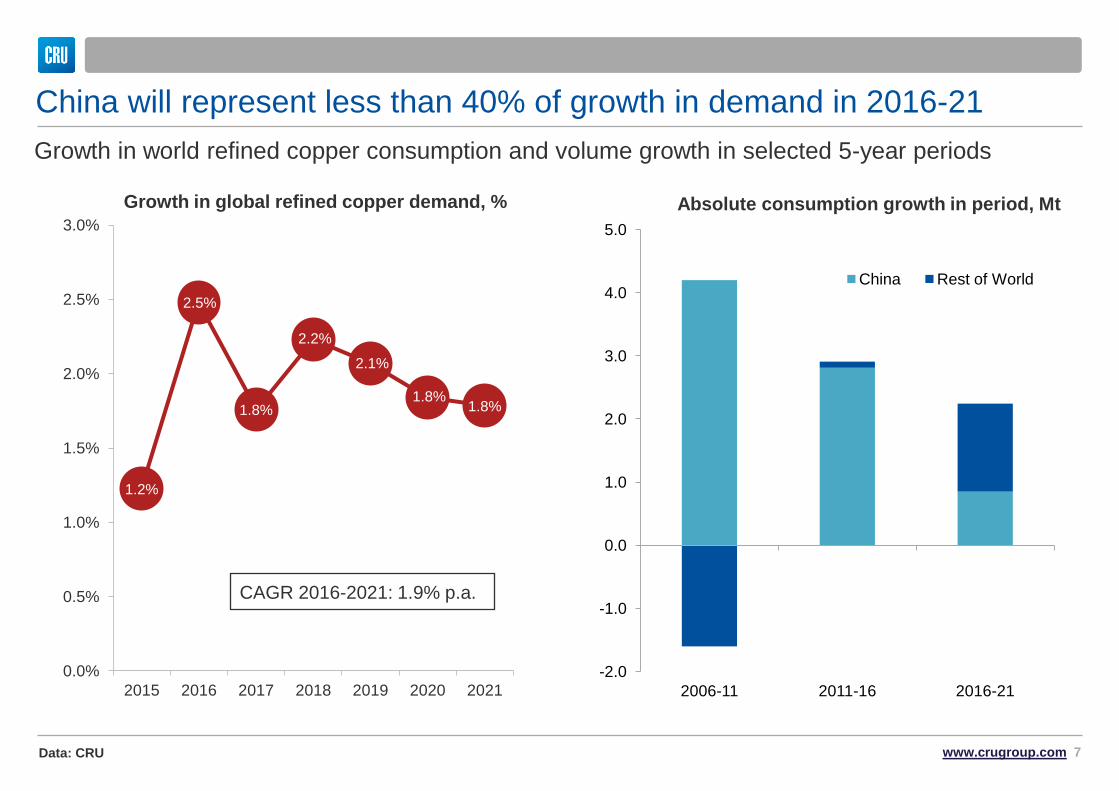
China will represent less than 40% of growth in demand in 2016-21
Growth in global refined copper demand, %
Data: CRU
1.2%
2.5%
1.8%
2.2%
2.1%
1.8% 1.8%
0.0%
0.5%
1.0%
1.5%
2.0%
2.5%
3.0%
2015 2016 2017 2018 2019 2020 2021 -2.0
-1.0
0.0
1.0
2.0
3.0
4.0
5.0
2006-11 2011-16 2016-21
China Rest of World
Absolute consumption growth in period, Mt
Growth in world refined copper consumption and volume growth in selected 5-year periods
Data: CRU
CAGR 2016-2021: 1.9% p.a.
www.crugroup.com 7
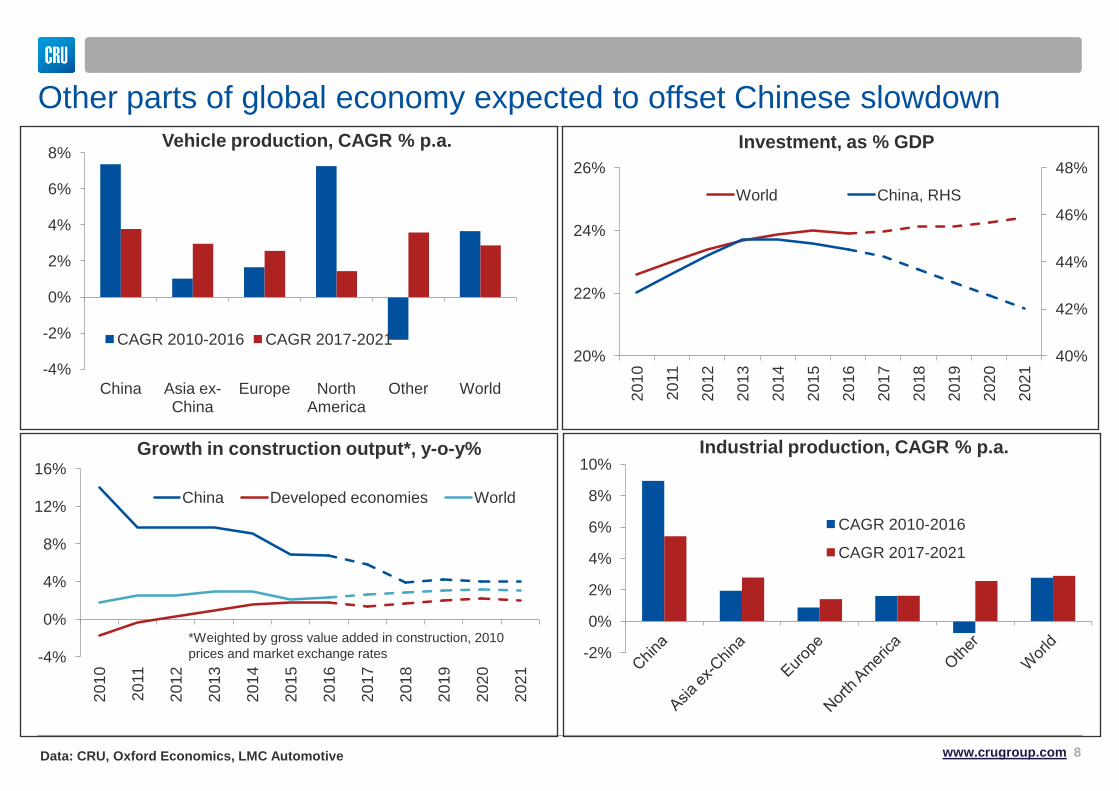
Other parts of global economy expected to offset Chinese slowdown
-4%
0%
4%
8%
12%
16%
20
10
20
11
20
12
20
13
20
14
20
15
20
16
20
17
20
18
20
19
20
20
20
21
China Developed economies World
-4%
-2%
0%
2%
4%
6%
8%
China Asia ex-China
Europe North America
Other World
CAGR 2010-2016 CAGR 2017-2021
-2%
0%
2%
4%
6%
8%
10%
CAGR 2010-2016
CAGR 2017-2021
Vehicle production, CAGR % p.a.
Industrial production, CAGR % p.a. Growth in construction output*, y-o-y%
*Weighted by gross value added in construction, 2010
prices and market exchange rates
40%
42%
44%
46%
48%
20%
22%
24%
26%
20
10
20
11
20
12
20
13
20
14
20
15
20
16
20
17
20
18
20
19
20
20
20
21
World China, RHS
Investment, as % GDP
Data: CRU, Oxford Economics, LMC Automotive www.crugroup.com 8
Data: CRU
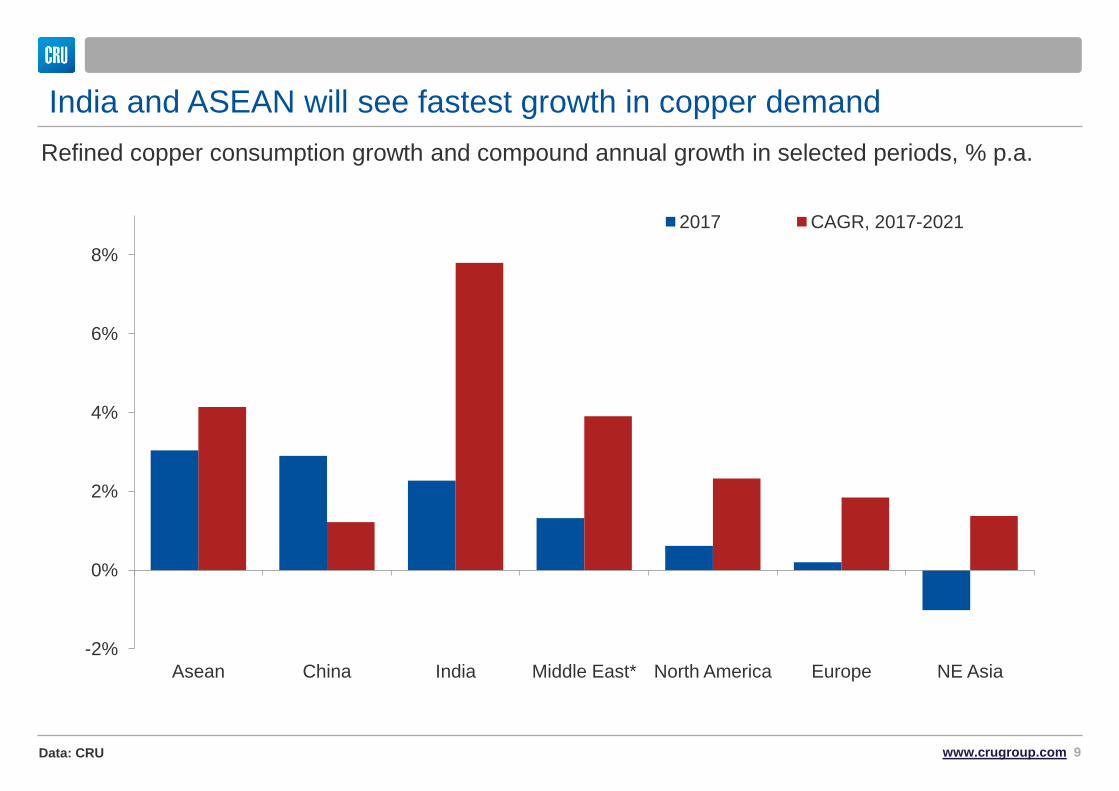
India and ASEAN will see fastest growth in copper demand
www.crugroup.com 9
-2%
0%
2%
4%
6%
8%
Asean China India Middle East* North America Europe NE Asia
2017 CAGR, 2017-2021
Refined copper consumption growth and compound annual growth in selected periods, % p.a.
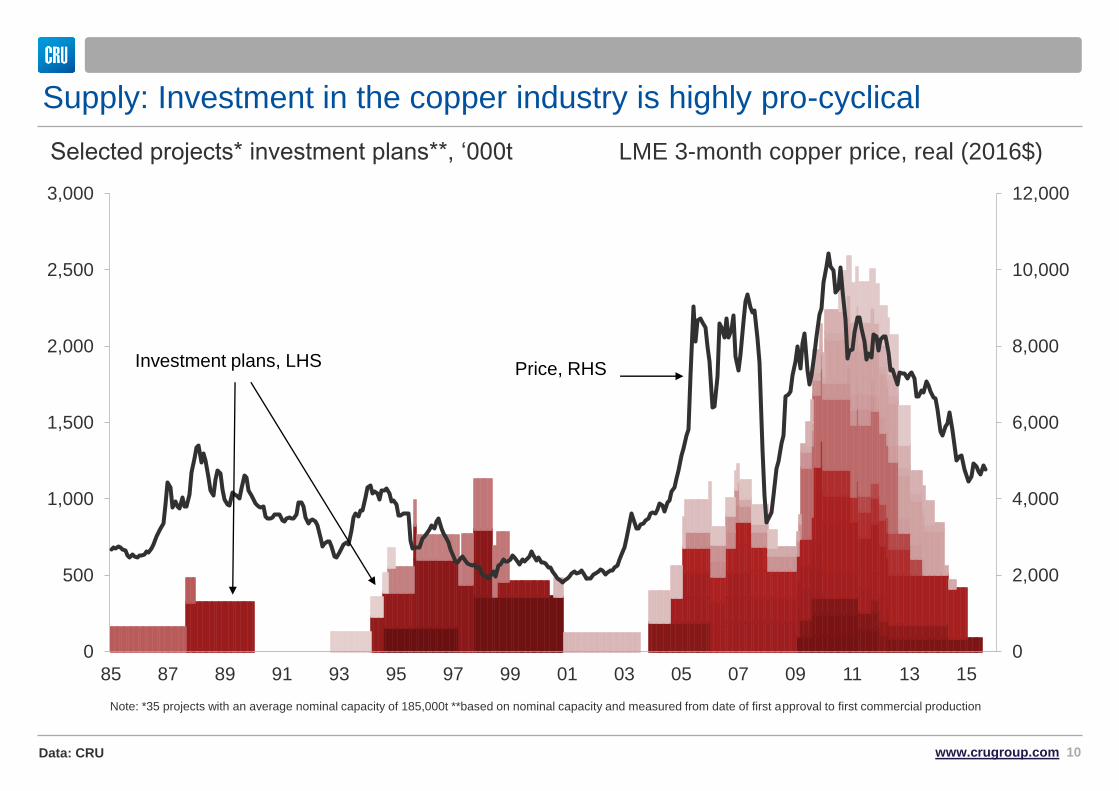
Supply: Investment in the copper industry is highly pro-cyclical
0
2,000
4,000
6,000
8,000
10,000
12,000
0
500
1,000
1,500
2,000
2,500
3,000
85 87 89 91 93 95 97 99 01 03 05 07 09 11 13 15
Price, RHS Investment plans, LHS
Selected projects* investment plans**, ‘000t LME 3-month copper price, real (2016$)
Note: *35 projects with an average nominal capacity of 185,000t **based on nominal capacity and measured from date of first approval to first commercial production
www.crugroup.com 10 Data: CRU
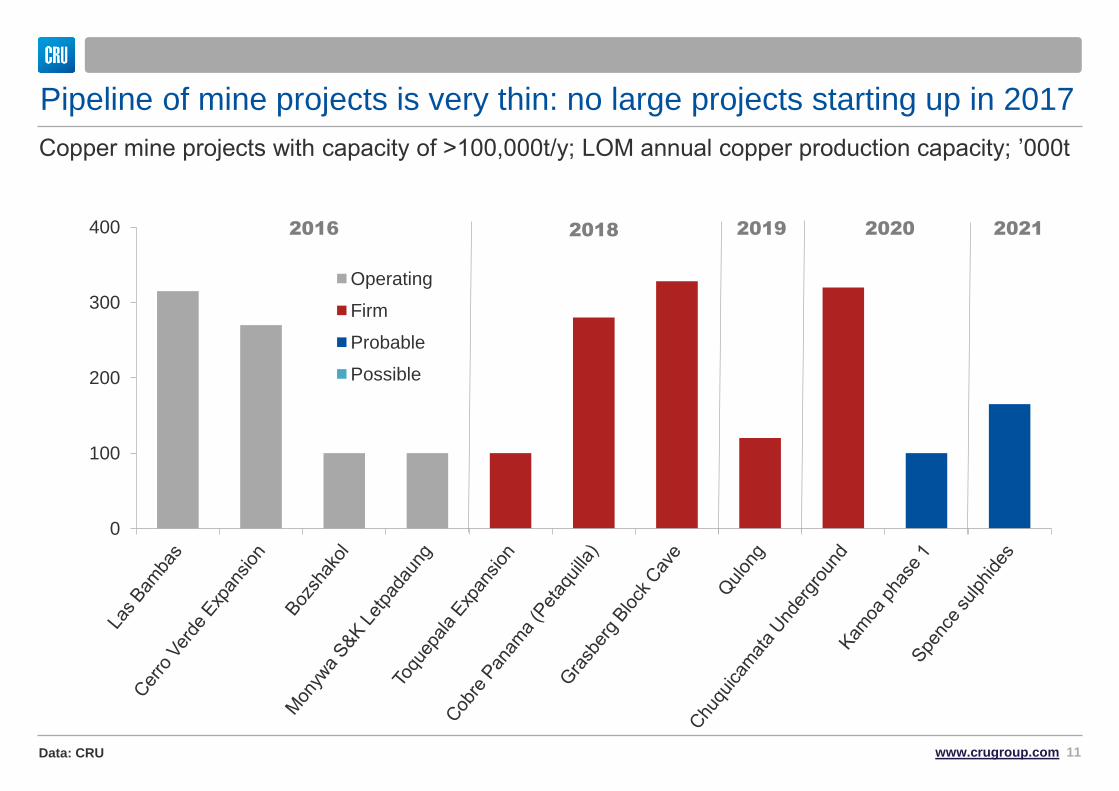
Pipeline of mine projects is very thin: no large projects starting up in 2017
Copper mine projects with capacity of >100,000t/y; LOM annual copper production capacity; ’000t
0
100
200
300
400
Operating
Firm
Probable
Possible
2016 2018 2019 2020 2021
www.crugroup.com 11 Data: CRU
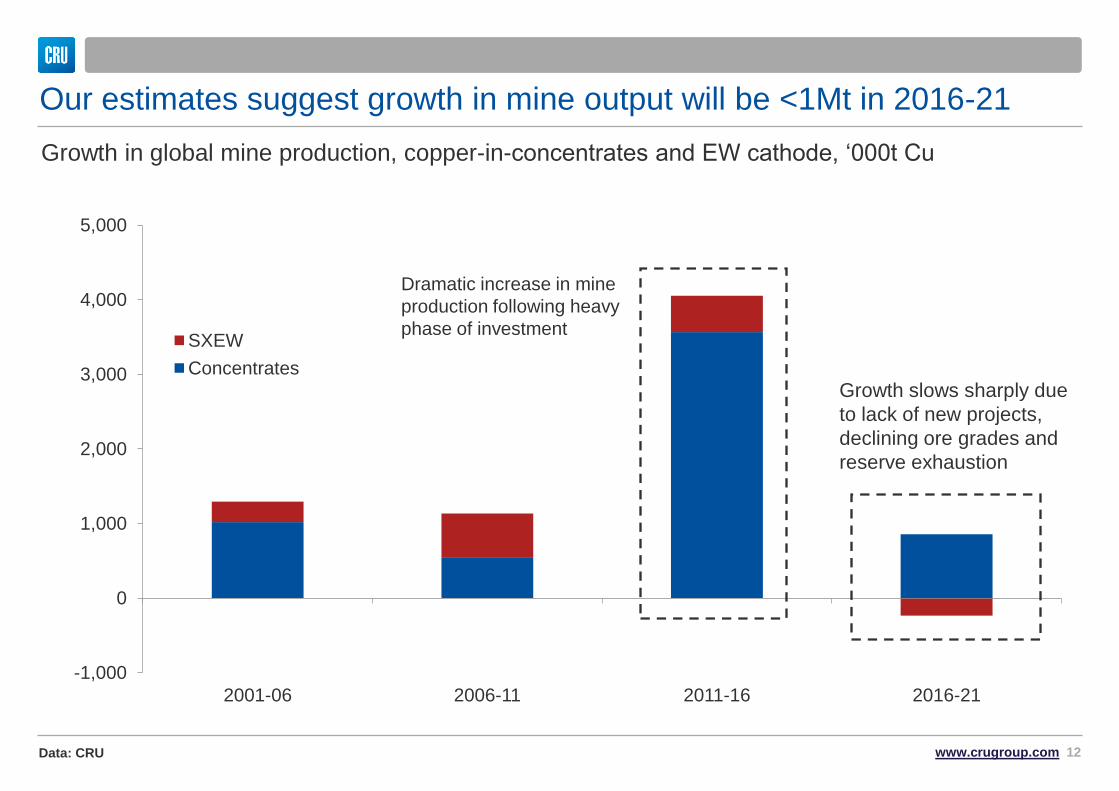
Our estimates suggest growth in mine output will be <1Mt in 2016-21
-1,000
0
1,000
2,000
3,000
4,000
5,000
2001-06 2006-11 2011-16 2016-21
SXEW
Concentrates
Dramatic increase in mine
production following heavy
phase of investment
Growth in global mine production, copper-in-concentrates and EW cathode, ‘000t Cu
Growth slows sharply due
to lack of new projects,
declining ore grades and
reserve exhaustion
www.crugroup.com 12 Data: CRU
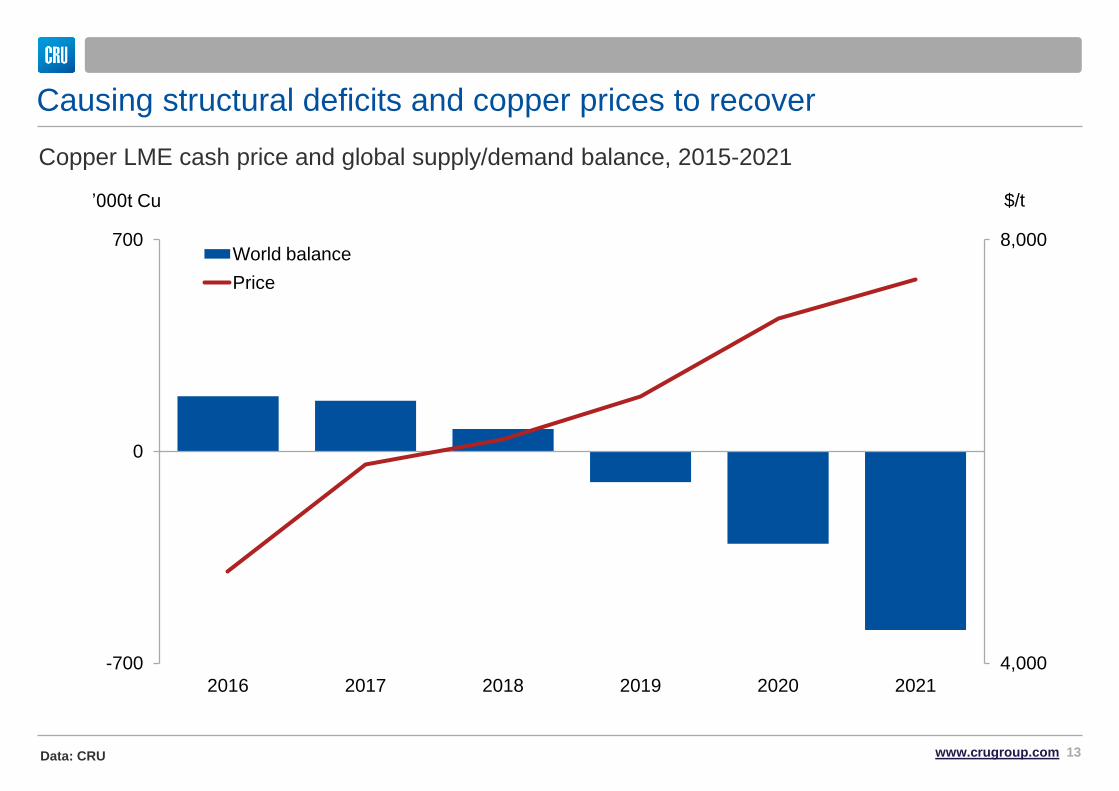
Causing structural deficits and copper prices to recover
Copper LME cash price and global supply/demand balance, 2015-2021
Data: CRU
4,000
8,000
-700
0
700
2016 2017 2018 2019 2020 2021
$/t ’000t Cu
World balance
Price
Data: CRU www.crugroup.com 13
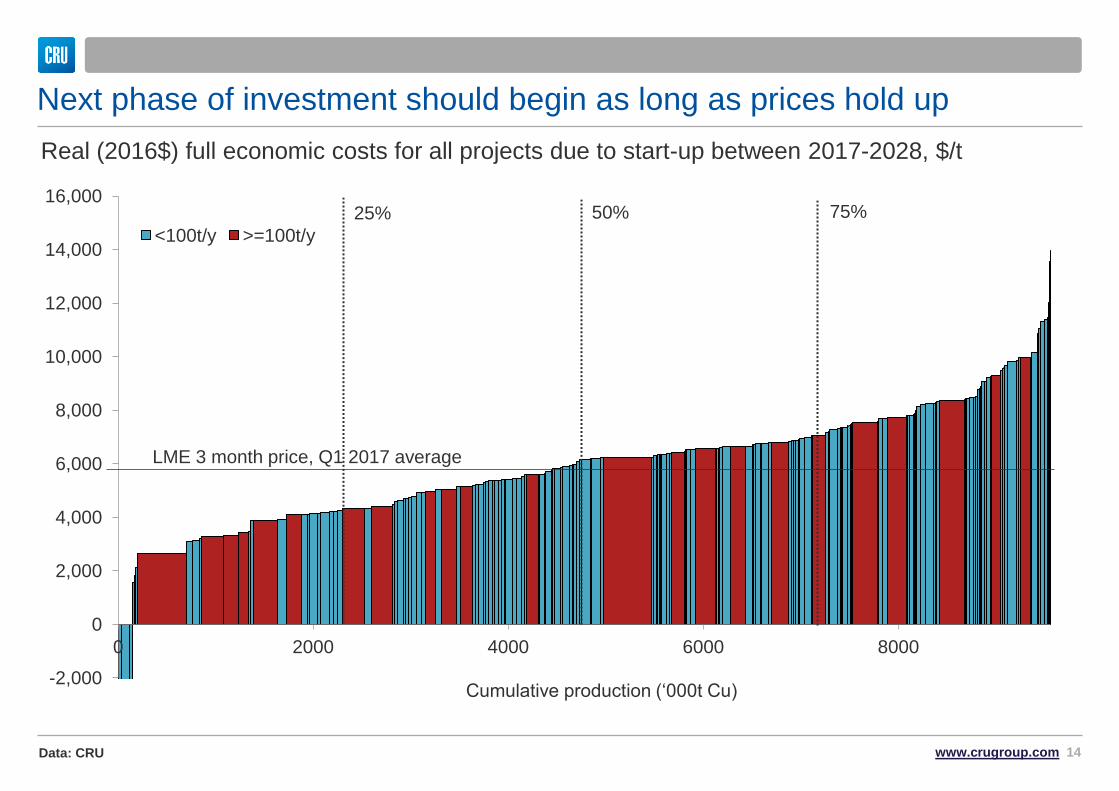
Next phase of investment should begin as long as prices hold up
-2,000
0
2,000
4,000
6,000
8,000
10,000
12,000
14,000
16,000
0 2000 4000 6000 8000
<100t/y >=100t/y
Real (2016$) full economic costs for all projects due to start-up between 2017-2028, $/t
Cumulative production (‘000t Cu)
25% 50% 75%
LME 3 month price, Q1 2017 average
www.crugroup.com 14 Data: CRU
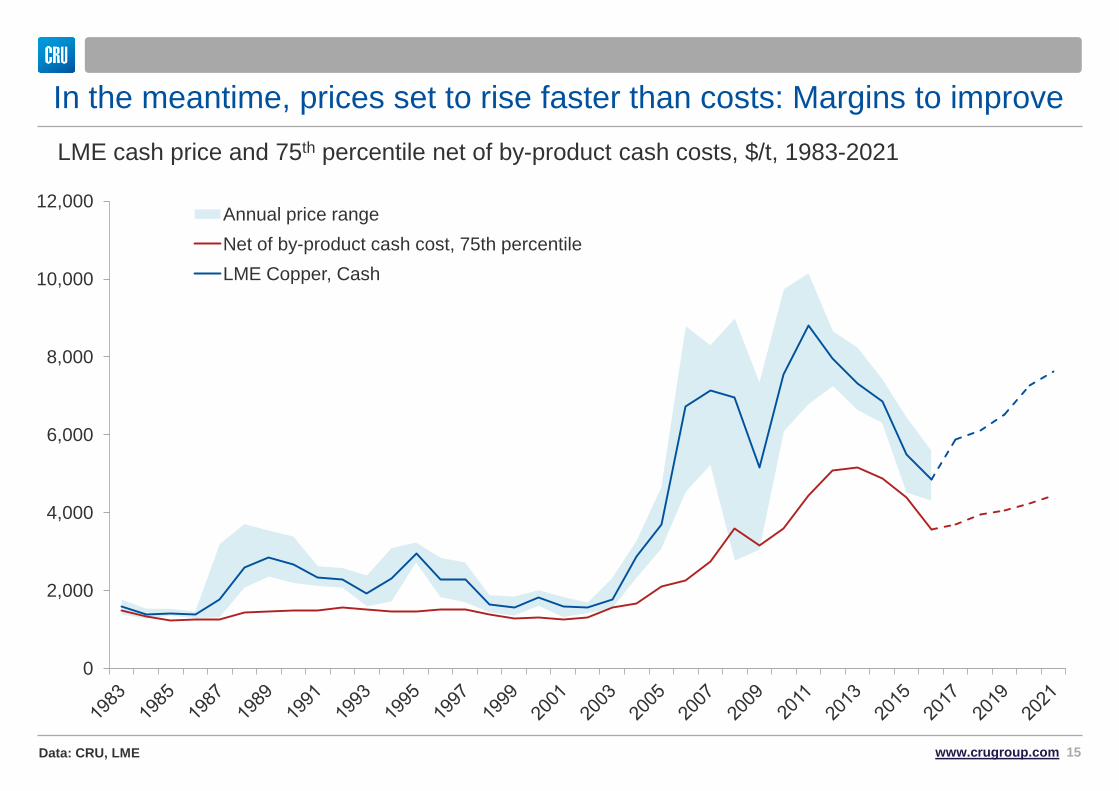
In the meantime, prices set to rise faster than costs: Margins to improve
0
2,000
4,000
6,000
8,000
10,000
12,000 Annual price range
Net of by-product cash cost, 75th percentile
LME Copper, Cash
LME cash price and 75th percentile net of by-product cash costs, $/t, 1983-2021
www.crugroup.com 15 Data: CRU, LME
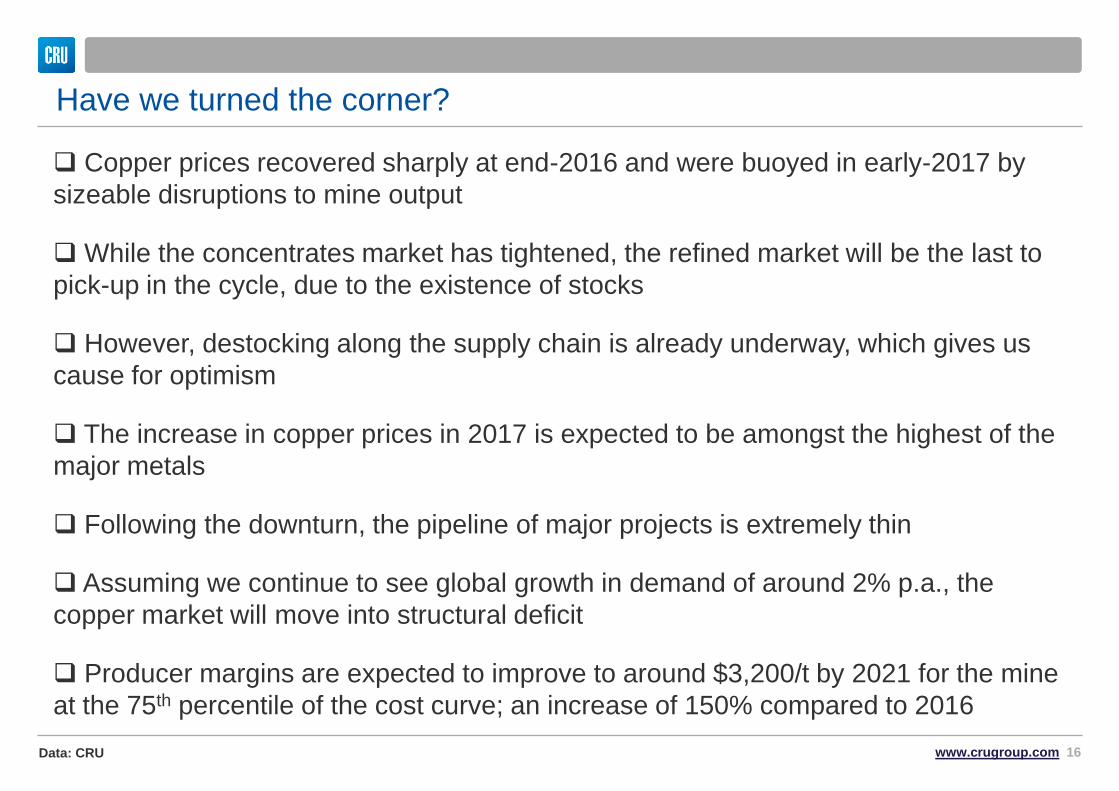
Copper prices recovered sharply at end-2016 and were buoyed in early-2017 by
sizeable disruptions to mine output
While the concentrates market has tightened, the refined market will be the last to
pick-up in the cycle, due to the existence of stocks
However, destocking along the supply chain is already underway, which gives us
cause for optimism
The increase in copper prices in 2017 is expected to be amongst the highest of the
major metals
Following the downturn, the pipeline of major projects is extremely thin
Assuming we continue to see global growth in demand of around 2% p.a., the
copper market will move into structural deficit
Producer margins are expected to improve to around $3,200/t by 2021 for the mine
at the 75th percentile of the cost curve; an increase of 150% compared to 2016
Have we turned the corner?
www.crugroup.com 16 Data: CRU
© 2016 CRU International Limited confidential 17
Where does KGHM place on the cost curve? Net of by-product cash costs, selected producers, $/lb (LHS) / $/T (RHS)