Embed Size (px)
Citation preview

Copertina FINANCIAL REPORT 2015 intera dorso 14.indd 1 21/04/16 18:04

INDEX2 Letter to Shareholders
4 Highlights 2015
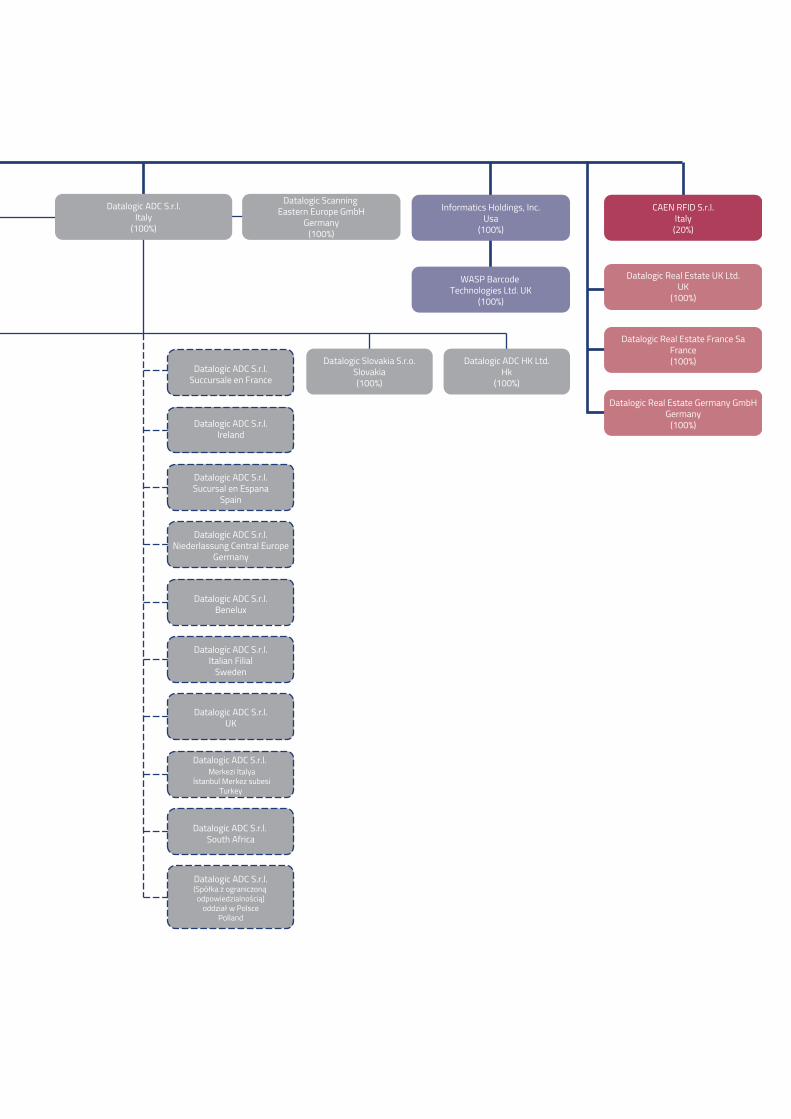
16 Datalogic Group structure
18 Composition of Corporate Bodies
21 Management Report
42 Consolidated financial statements
50 Explanatory notes to the consolidated financial statements
105 Parent Company financial statements
113 Explanatory notes to the Parent Company financial statements
150 Annexes
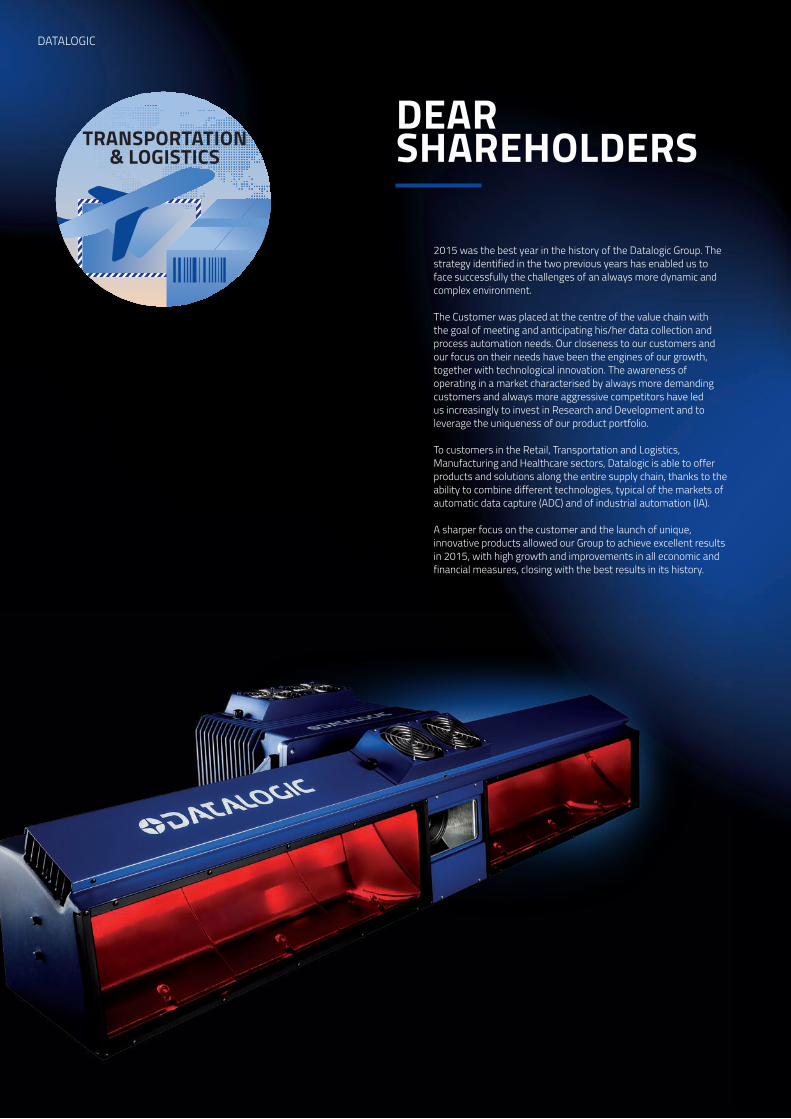
DEAR SHAREHOLDERS
2015 was the best year in the history of the Datalogic Group. The strategy identified in the two previous years has enabled us to face successfully the challenges of an always more dynamic and complex environment.
The Customer was placed at the centre of the value chain with the goal of meeting and anticipating his/her data collection and process automation needs. Our closeness to our customers and our focus on their needs have been the engines of our growth, together with technological innovation. The awareness of operating in a market characterised by always more demanding customers and always more aggressive competitors have led us increasingly to invest in Research and Development and to leverage the uniqueness of our product portfolio.
To customers in the Retail, Transportation and Logistics, Manufacturing and Healthcare sectors, Datalogic is able to offer products and solutions along the entire supply chain, thanks to the ability to combine different technologies, typical of the markets of automatic data capture (ADC) and of industrial automation (IA).
A sharper focus on the customer and the launch of unique, innovative products allowed our Group to achieve excellent results in 2015, with high growth and improvements in all economic and financial measures, closing with the best results in its history.
DATALOGIC
TRANSPORTATION& LOGISTICS

In 2015 revenues grew by 15.2% (+5.9% at constant exchange rates) to 535.1 million Euro, as a result of the highly positive performance of the main reference markets, in particular China, Europe and the United States, and of all product lines. The projects for the optimisation of production costs and the centralisation of purchases led to an improvement in the EBITDA, which grew by 6.2% compared to 2014, to 73.7 million Euro, i.e. 13.8% of revenues (15.3% at constant exchange rates).
Investments in Research and Development were further expanded in the course of the year (+11.9% compared to 2014), enabling Invention Disclosures to increase by 25% and new patent applications filed to increase by 33%, bringing the portfolio to approximately 1,200 patents. To confirm the Company’s leadership in automatic identification technologies, the acquisition of 20% of the capital of CAEN RFID, a Tuscan company at the cutting edge of RFID-Radiofrequency Identification technology in the Ultra High Frequency (UHF) band was of fundamental importance. This year the Group’s innovative ability was once again appreciated at the NRF of New York, the foremost trade show in the Retail world, where the innovative solutions under the Datalogic brand attracted numerous visitors and potential customers.
All this, together with a virtuous financial management on the front of banking conditions, enabled net profit to improve sharply, and in fact it grew by 31.4% to 40.5 million Euro.
On the debt front, Datalogic further improved its net financial position, closing the year at 21 million Euro, in spite of the investments made during the year, which were nearly doubled compared to last year’s figure, directed at creating the new production facility in Hungary, introducing new, cutting edge SMT (Surface Mount Technology) lines in all our plants, and at performing renovation work in some locations abroad, to provide our Group with a unified, modern image throughout the world.
These results would not have been possible without the passion and contribution of all the Group’s employees and contractors. Investing in talent acquisition and personnel growth is one of the objectives I set for myself when I became Chief Executive Officer and I am convinced it continues to be one of the essential pillars for development. The Datalogic Company Culture was defined in order to orient the personnel’s behaviours towards the shared objectives we have given ourselves. Putting the customer first, being innovative and long-term thinking were identified as the 3 essential values of the organisation, the foundations of its success.
Constant focus on the customer, together with a culture that is solidly grounded on the reasons that have brought the Group from its origins to its present success, will enable us to achieve always more ambitious goals in the future.
Therefore, I am extremely proud of the record results of 2015 and I wish to thank all our Employees, our Customers and Business Partners throughout the world, along with our Suppliers, who have made these results possible. I would especially like to thank all the Shareholders who have believed in the Group, whose results were reflected by the particularly positive share performance. I am certain that, with everyone’s active contribution, we will be able to continue to achieve, in the future, the challenging objectives we have set for ourselves to create value for all stakeholders.
Romano VoltaChairman and Chief Executive Officer
TOTAL TRACK AND TRACE SOLUTIONS
HIGHLIGHTS _ 2015
3

In the ADC market, the Group is the global leader in high performance fixed scanners for retail checkouts, an industry leader in EMEA for handheld bar code readers, and the third player in the worldwide market of mobile computers dedicated to warehouse management and data capture at the point-of-sale.
In the Industrial Automation market, the Group is among the world’s foremost providers of products and solutions for traceability in manufacturing, and the sorting of packages and luggage for transportation and logistics sectors. In addition to bar code readers, the Group has dedicated solutions for laser marking, sensors for detection, measurement and security, vision systems for inspection and quality control in industrial applications.
STRATEGIC GUIDELINES FOR GROWTHFuture means growth, development and new investments: focusing on customer’s needs investing in technology and product excellence, winning over new markets, investing in our human capital, in the corporate climate and in selecting and promoting high performance personnel from within, in particular in the Research and Development area.
VISIONA World identified, detected, inspected, marked and verified by Datalogic.
MISSIONTo provide customers in the Retail, Transportation & Logistics, Manufacturing and Healthcare sectors with best quality and efficiency in data collection and process automation thanks to superior technology, products, solutions and an extremely talented team of people.
THE GROUPDatalogic is a success story in the production of bar code readers, mobile computers for data collection, sensors, vision systems and laser marking systems that satisfy the constantly evolving needs of today’s world. Datalogic is active in over 30 nations, markets products in 120 countries, has relationships with the world’s leading operators and over 1,000 partners in the Retail, Transportation & Logistics, Manufacturing and Healthcare sectors.
Datalogic provides its customers with the broadest range of products and solutions available dedicated to the Automatic Data Capture (ADC) and Industrial Automation (IA) sectors.
ASSISTEDSALES
DATALOGIC
4

RETAIL
Customer FocusThe customer is at the core of the value chain: anticipating and meeting customers’ needs in terms of improvement of the efficiency and quality of their activities is absolutely necessary for the Group’s growth. This is possible only through constant product innovation, driven by the customers’ needs and through the development, directly or through partnerships, of new technologies, coupled with the constant refinement of core technologies.
International developmentTo grow in emerging markets, consolidating our presence in the core markets. Building a strong presence in emerging markets, in particular in markets with high growth potential, like China, Turkey and Africa, while becoming stronger in mature markets, expanding our market share. Leveraging the unique feature of Datalogic - being the only true Bar Code Company, specialized in serving both reference markets, automatic data capture (ADC) and industrial automation (IA) - to be present in all geographic regions.
Human resourcesTo develop our personnel to distinguish our performance. The motivation, passion and dedication of the people who work for Datalogic is one of the Group’s strengths. To motivate and manage human resources so they will contribute to the attainment of excellence.
These are the 3 pillars supporting future growth, accompanied by the constant search for improvements to operating efficiency. Streamlining Operations, and paying particular attention to components, both in terms of cost and of innovative content, together with the enhancement of control procedures, will translate into a marked improvement in the Group’s overhead and working capital.
HIGHLIGHTS _ 2015

RETAIL
EVENTS
JANUARYDatalogic was once again present at the National Retail Federation NRF 2016 in New York; this is the foremost trade show in the Retail world. Innovative solutions under the Datalogic brand attracted thousands of visitors. Attendance was the highest ever.
FEBRUARYDatalogic launched its new linear imager scanner, the Heron HD3100. Sophisticated design, high technology and options that can be customised by the Retailer to extend their brand experience at the checkout. When technology meets design.
MARCHDatalogic introduced the new Matrix N imager family which uses revolutionary new software called DLCODE. Matrix 300N, Matrix 410N and the new solution XRF410N are some of the leading products in the new line of 1D and 2D industrial code readers.
Datalogic also presented the new laser fibre marker UNIQ, a product featuring compact design, IP54 protection class, and the utmost ease of use with great flexibility for integration with existing systems.
APRILDatalogic presented the Queue Busting App for the Joya device. This innovative solution reduces wait time at the checkout counter, especially when the store is most crowded, improving the customers’ shopping experience and the retailer’s efficiency.
DATALOGIC

MAYDatalogic’s QuickScan Lite QW2100 was selected by Philippine Seven Corporation, the regional associate of 7-Eleven with over 1,300 points of sale in the Philippines, to improve their customers’ shopping experience.
Datalogic launched the Magellan 9300i and 9400i, new high-speed, 100% digital imaging scanners adding to the Magellan counter scanner family which is renown throughout the world.
Royal Mail chose a Datalogic solution to automate over 20 mail centres in the United Kingdom. The contract, worth approximately 30 million Euro, was won because of its modular design, high technology, and operating performance developed specifically for the limited space available at Royal Mail centres.
JUNEDatalogic presented the new SRX3 ultrasound fork-shaped sensor which is able to detect labels with high resolution on a broad range of materials from paper to plastic with surfaces from transparent to metallic.
JULYDatalogic presents the new DS8110 and DX8210 high performance laser readers for transportation and logistics, shipping, and airport applications where utmost reliability and 99.9% reading rate is required.
Datalogic and Symcirrus team up together to supply Skorpio X3 mobile computers to the SuperGroup PLC fashion retailer. This device is used in all SuperDry stores in the UK and in Europe to improve performance at points of sale from inventory control to price checking.
AUGUSTDatalogic launched the new SG4-H security barriers, the first in the world with the body entirely made of stainless steel and a glass window. It has a wash-down design profile, essential for applications where the extreme hygiene imposes frequent washing of machine and systems with highly corrosive detergents. The product is ideal for Pharma machinery.
SEPTEMBERDatalogic launched the IMPACT+ OCR solution that enables the P-Series compact smart camera to inspect printouts of variable data in the food industry, such as lot numbers, expiration date verification and traceability of serial numbers.
Datalogic expanded its international presence, opening a new office in Shenzhen, China. The new location contains commercial and administrative offices and it is also a major reference centre for R&D and Procurement activities. In addition, a spacious show room displays the Company’s most recent technological innovations.
OCTOBERDatalogic launched the Heron HD3430 2D area imager. Design, elegance and high technology make the Heron the ideal product for points of sale of all types, in particular for clothing stores, boutiques and specialised chains.
NOVEMBERDatalogic expanded its international presence, opening a new office in Cape Town, South Africa. The location enables it to be closer to its current and potential customers and reflects the importance of the region for the Datalogic Group.
Datalogic presented the new SLIM line of security barriers. With high technology components enclosed in an ultra-thin profile, these light curtains are unique in their category. No dead zone and cascade connection are some of the unique features that distinguish them.
For the tenth consecutive year, Datalogic was recognised, by VDC Research, as the global market leader in the supply of fixed mount scanners for Retail POS. The report: “Strategic Insights 2015: Barcode Solutions Market” confirmed that more than half of all bi-optic scanners sold worldwide bear the Datalogic brand.
DECEMBERDatalogic signed an agreement for the acquisition of 20% of CAEN RFID Srl, a Tuscan company at the cutting edge of RFID-Radio Frequency Identification technology in the Ultra High Frequency (UHF) band. The commercial agreement provides, inter alia, for the joint development of new products, the use, by Datalogic, of CAEN RFID components in the manufacture of its own products, and the distribution of CAEN RFID products under the Datalogic brand.
Datalogic signed a loan agreement with the European Investment Bank (EIB) totalling 30 million Euro, an amortising with 5 year maturity, directed at sustaining the Group’s investments, research and development activity and technological innovation.
REVOLUTIONIN SELF-SHOPPING
HIGHLIGHTS _ 2015
7

RESULTS
2015 STOCK MARKET DATA
In 2015, the stock price rose by 84.3%, outperforming the stocks in the FTSE MIB by 71.6% and in the FTSE STAR by 44.4%. The stock reached its highest price of 17.59 Euro per share on 30th November 2015, while its lowest price of 8.80 Euro was on 6th January 2015. The average daily volume traded in 2015 was approximately 74,277 shares (substantially in line with the previous year).
Segment
STAR - MTA Bloomberg code
DAL.IM Reuters code
DAL.MI MKT Cap
985.5 million Euros at 31st December 2015Number of shares
58,446,491 (including n. 274,610 treasury shares) 2015 max
17.59 Euro (30th November 2015) 2015 min
8.80 Euro (6th January 2015)
TOTALQUALITYINSPECTION
MANUFACTURING
DATALOGIC
8

SHAREHOLDER STRUCTURE
HIGHLIGHTS _ 2015
DEC 14 FEB 15 APR 15 JUN 15 AUG 15 OCT 15 DEC 15
210
190
170
150
130
110
90
70
67.2% HYDRA S.p.A.
MARKET32.8%
DAL.MI
FTSEMIB.MI
ITSTAR.MI

DATALOGIC
FRAGILE
SALE
S
RETAIL
2015 REVENUES PER BUSINESS DIVISION
68%DATALOGIC ADC
27%DATALOGIC AUTOMATION
5%INFORMATICS
TOTAL535.1
mln Euro
2015 REVENUES PER GEOGRAPHIC AREA
50%EUROPE
30%NORTH AMERICA
13%ASIA/PACIFIC7%
REST OF THE WORLD
TOTAL535.1
mln Euro
2015 REVENUES PER VERTICAL
49%RETAIL
29%MANUFACTURING
13%T&L5%
HEALTHCARE4%
OTHER
TOTAL535.1
mln Euro

FASHION STORE SCANNING
HIGHLIGHTS _ 2015
11
2007 2008 2009 2010 2011 2012 2013 2014 2015
50
40
30
20
10
0
48.2
6.7%
25.
3
8.0%
24.
9
6.7%
26.
3
6.2%
26.
2
6.9%
32.
0
7.9%
35.
6
9.3%
43.
1
9.0%
R & D COSTS (million Euros)*
6.2%
25.
0
2015 EMPLOYEES PER GEOGRAPHIC AREA
27%ASIA/PACIFIC
27% ITALY
TOTAL2,567
23%NORTH AMERICA
21%EUROPE
2%REST OF THE
WORLD
* % on revenues
2015 EMPLOYEES PER FUNCTIONAL AREA
47% OPERATIONS
17%R&D
3%OTHER
15%MKT & SALES
9%G&A
9%CUSTOMER SERVICE& TECH SUPPORT
TOTAL2,567

CONSOLIDATED PROFIT AND LOSS
DATALOGIC
12
(1) EBITANR = Ordinary operating profit before non recurring costs/revenues and amortization of intangible assets from acquisition.
(2) Euro 1 extraordinary dividend (October 2005).
(3) In May 2006, execution of share capital split with a ratio of 4:1.
(4) In May 2008, execution of share capital reduction by means of cancellation of nr. 5,409,981 treasury shares.
(5) 2012 figures have been restated to reflect the application of IAS 19R.
Annual results from 2001 to 2003 are prepared in accordance with Italian Accounting Standards; annual results from 2004 are prepared in accordance with IAS/IFRS.
Million Euros 2001 2002 2003 2004 2005 2006 2007 2008(4) 2009 2010 2011 2012(5) 2013 2014 2015
TOTAL REVENUES 111.7 118.0 131.5 146.3 205.9 381.6 404.0 379.8 312.0 392.7 425.5 462.3 450.7 464.5 535.1
EBITDA 16.1 17.0 21.3 25.2 31.5 38.2 50.1 47.8 19.6 49.8 59.2 63.2 60.0 69.4 73.7
% on revenues 14.4 14.4 16.2 17.2 15.3 10.0 12.4 12.6 6.3 12.7 13.9 13.7 13.3 14.9 13.8
EBITANR (1) 8.6 7.9 11.0 19.6 24.8 26.0 37.8 35.3 6.2 38.1 48.8 53.4 50.1 58.0 61.2
% on revenues 7.7 6.7 8.4 13.4 12.0 6.8 9.4 9.3 2.0 9.7 11.5 11.6 11.1 12.5 11.4
EBT 2.6 6.7 10.3 18.7 22.7 9.0 26.6 25.9 -12.8 28.2 33.2 9.5 35.5 39.2 51.6
% on revenues 2.3 5.7 7.8 12.8 11.0 2.4 6.6 6.8 -4.1 7.2 7.8 2.1 7.9 8.4 9.6
NET PROFIT 0.8 5.4 7.2 11.2 13.0 4.1 18.1 17.8 -12.2 18.0 25.9 10.2 26.9 30.9 40.5
% on revenues 0.7 4.6 5.5 7.7 6.3 1.1 4.5 4.7 -3.9 4.6 6.1 2.2 6.0 6.6 7.6
NUMBER OF EMPLOYEES 698 735 775 875 1,808 1,897 1,906 2,202 1,982 2,019 2,427 2,384 2,364 2,470 2,567
DIVIDEND PER SHARE (Euro) 0.05 0.15 0.18 1.22 0.22 0.06 0.07 0.035 - 0.15 0.15 0.15 0.16 0.18 0.25
DIVIDEND PAID (million Euro) - 0.58 1.70 2.11 15.04 3.5 3.8 4.1 1.9 - 8.1 8.5 8.5 9.4 10.5
(2) (3)

CONSOLIDATED BALANCE SHEET
HIGHLIGHTS _ 2015
(6) 2012 figures have been restated to reflect the application of IAS 19R
(7) In 2005, the acquisitions of Laservall, Informatics and PSC had an impact of 178 million Euro. In January 2006, conclusion of capital increase for a total value of 76.6 million Euro. During 2008 Datasensor S.p.A. was acquired for 45 million Euro. During 2010, Evolution Robotics Retail Inc. was acquired for 20.96 million Euro. During 2011, PPT Vision Inc. was acquired for 4.1 million Euro and “one-shot” costs were born for approx. 12 million Euro, of which 10.2 million Euro related to the WCO project and 1.7 million Euro for acquisitions. During 2012, Accu-Sort Systems Inc. was acquired for 100.3 million Euro.
Annual results from 2001 to 2003 are prepared in accordance with Italian Accounting Standards; annual results from 2004 are prepared in accordance with IAS/IFRS.
Million Euros 2001 2002 2003 2004 2005 2006 2007 2008 2009 2010 2011 2012(6) 2013 2014 2015
FIXED ASSETS 37.3 38.1 34.7 71.5 254.0 227.3 207.0 216.5 203.4 223.5 244.2 313.6 300.4 326.2 363.8
CURRENT ASSETS 62.4 65.6 72.4 75.1 145.9 142.9 152.8 152.4 122.0 131.5 150.9 157.3 150.2 164.0 166.8
CURRENT LIABILITIES -21.1 -29.6 -34.7 -40.4 -74.7 -78.0 -90.3 -92.7 -78.8 -104.2 -121.0 -142.7 -133.6 -150.1 162.7
NET WORKING CAPITAL 41.3 36.0 37.7 34.7 71.3 64.9 62.5 59.7 43.2 27.2 29.8 14.6 16.7 13.9 4.1
INVESTED CAPITAL 73.7 68.9 66.5 80.3 255.6 245.0 236.0 242.8 217.2 216.7 229.7 294.5 282.3 297.0 319.2
NET EQUITY 98.6 102.3 106.0 116.2 129.8 186.6 173.5 135.8 116.7 140.2 170.2 173.4 185.3 241.3 298.3
NET FINANCIAL POSITION(7) 24.9 33.4 39.5 35.9 -125.7 -58.4 -62.5 -106.9 -100.5 -76.5 -59.4 -121.1 -97.0 -55.7 -21.0
CAPEX 10.0 6.8 5.1 18.1 6.8 7.9 12.6 9.4 7.3 7.8 13.6 14.4 17.1 12.7 22.0
% on revenues 9.0 5.8 3.9 12.4 3.3 2.1 3.1 2.5 2.3 2.0 3.2 3.1 3.8 2.7 4.1
NWC (Net Working Capital) 41.3 36.0 37.7 34.7 71.3 64.9 62.5 59.7 43.2 27.2 29.8 14.6 16.7 13.9 4.2
% on revenues 37.0 30.5 28.7 23.7 34.6 17.0 15.5 15.7 13.9 6.9 7.0 3.2 3.7 3.0 0.8
ROE % 1.2 5.4 6.9 10.1 10.6 2.6 10.0 11.5 -9.6 14.0 16.7 5.9 15.0 14.5 15.0
DEBT/EQUITY % -25.3 -32.6 -37.3 -30.9 96.8 31.3 36.0 78.7 86.1 54.6 34.9 69.8 52.4 23.1 7.0

HEALTHCARE
REVENUES (million Euros)
TOTAL REVENUES (million Euros)
2001 2015
600
500
400
300
200
100
0
535.1
2007 2008 2009 2010 2011 2012 2013 2014 2015
600
500
400
300
200
100
0
535.1
404.
4
379.
8
312.
0 392.
7
425.
5
462.
3
450.
7
464.
5
111.
7
CAGR 2001-2015 = 11.8%

UNIQUEHYGIENICAL
PROTECTION
NET PROFIT (million Euros)
NET WORKING CAPITAL (million Euros)
EBITDA (million Euros)
NET FINANCIAL POSITION (million Euros)
HIGHLIGHTS _ 2015
15
2007 2008 2009 2010 2011 2012 2013 2014 2015
50
40
30
20
10
0
-10
-20
40.5
18.1
17.8
-12.
2
18.0 25
.9
10.2
*
26.9 30
.9
* Net profit was affected by an impairment for 27 million Euro.
% on revenues
2007 2008 2009 2010 2011 2012 2013 2014 2015
2007 2008 2009 2010 2011 2012 2013 2014 2015
2007 2008 2009 2010 2011 2012 2013 2014 2015
80
70
60
50
40
30
20
10
0
80
70
60
50
40
30
20
10
0
0
-20
-40
-60
-80
-100
-120
-140
4.1
73.7
-21.0
15.7
% 59
.7
13.9
% 43
.2
6.9%
27
.2
7.0%
29
.8
3.2%
14
.6
3.7%
16
.7
3.0%
13
,9
0.8%
50.1
-62.
5
-106
.9
-100
.5 -76.
5 -59.
4
-121
.1 -97.
0
-55.
7
47.8
19.6
49.8 59
.2 63.2
60.0 69
.4
15.5
% 62
.5

DATALOGIC S.p.A.Italy
Legal EntityBranch
Datalogic Real Estate UK Ltd.UK
(100%)
Datalogic Real Estate France SaFrance(100%)
Datalogic Real Estate Germany GmbHGermany
(100%)
Datalogic IP Tech S.r.l.Italy
Datalogic ADC S.r.l.Italy
(100%)
Datalogic ADC Inc.Usa
(100%)
Datalogic ADC do Brasil Ltd.Brasil(100%)
Datalogic ADC Pty Ltd.Australia
(100%)
Datalogic ADC de Mexico S.r.l.Mexico(100%)
Datalogic Slovakia S.r.o.Slovakia(100%)
Datalogic ADC Singapore Pte Ltd. Singapore
(100%)
Datalogic ADC HK Ltd.Hk
(100%)
Informatics Holdings, Inc.Usa
(100%)
CAEN RFID S.r.l.Italy(20%)
WASP Barcode Technologies Ltd. UK
(100%)
Datalogic Automation S.r.l.Italy
(100%)
Datalogic HungaryHungary(100%)
Datalogic Automation Asia LtdHk
(100%)
Datalogic (Shenzhen) Trading Business
China(100%)
Datalogic Automation Pty Ltd.Australia
(100%)
Datalogic Automation UKUK
Datalogic Automation BeneluxNetherlands
Datalogic Automation S.r.l.Niederlassung Central Europe
Germany
Datalogic Automation S.r.l.Succursale en France
Datalogic Automation IberiaSucursal en Espagne
Datalogic Automation Inc.Usa
(100%)
Laservall Asia Co. Ltd.Hk
(50%)
Laservall China Co. Ltd.China(100%)
Datasensor GmbhGermany
(30%)
Datalogic Automation ABSweden
(20%)
Specialvideo S.r.l.Italy(40%)
Datalogic ADC S.r.l.Succursale en France
Datalogic ADC S.r.l.Ireland
Datalogic ADC S.r.l.Sucursal en Espana
Spain
Datalogic ADC S.r.l.Niederlassung Central Europe
Germany
Datalogic ADC S.r.l.Benelux
Datalogic ADC S.r.l.Italian Filial
Sweden
Datalogic ADC S.r.l.UK
Datalogic ADC S.r.l. Merkezi İtalya
İstanbul Merkez subesiTurkey
Datalogic ADC S.r.l. South Africa
Datalogic ADC S.r.l.(Spółka z ograniczoną
odpowiedzialnością) oddział w Polsce
Polland
(11.6%) (42.3%)
(46.1%)
(99.999%)
(99.999%)
(0.001%)
(0.001%)
Datalogic Scanning Eastern Europe GmbH
Germany(100%)
Datalogic Holdings, IncUsa
(100%)
Datalogic Vietnam LlcVietnam(100%)

Composition of Corporate Bodies
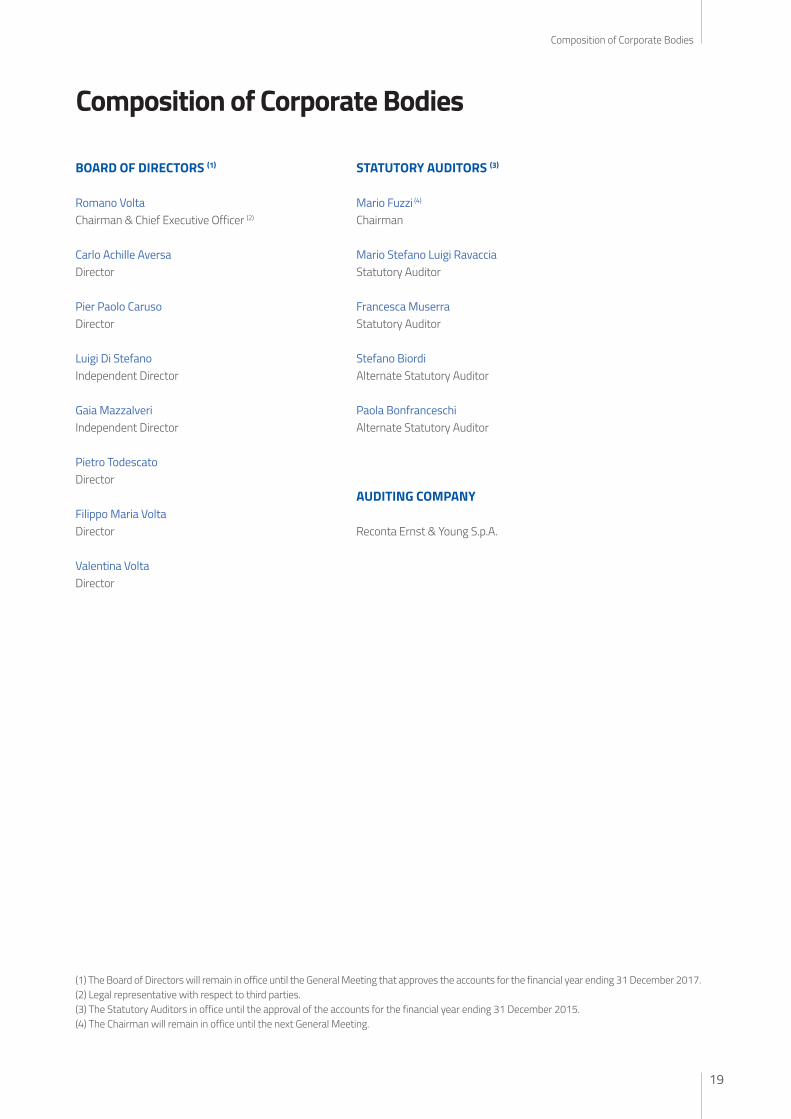
Composition of Corporate Bodies
BOARD OF DIRECTORS (1)
Romano VoltaChairman & Chief Executive Officer (2)
Carlo Achille AversaDirector
Pier Paolo CarusoDirector
Luigi Di StefanoIndependent Director
Gaia MazzalveriIndependent Director
Pietro TodescatoDirector
Filippo Maria VoltaDirector
Valentina VoltaDirector
STATUTORY AUDITORS (3)
Mario Fuzzi (4)
Chairman
Mario Stefano Luigi RavacciaStatutory Auditor
Francesca Muserra Statutory Auditor
Stefano BiordiAlternate Statutory Auditor
Paola Bonfranceschi Alternate Statutory Auditor
AUDITING COMPANY
Reconta Ernst & Young S.p.A.
(1) The Board of Directors will remain in office until the General Meeting that approves the accounts for the financial year ending 31 December 2017.(2) Legal representative with respect to third parties.(3) The Statutory Auditors in office until the approval of the accounts for the financial year ending 31 December 2015.(4) The Chairman will remain in office until the next General Meeting.
19
Composition of Corporate Bodies


Management Report

Report on OperationsTo our Shareholders,
the report for the year ended 31 December 2015, which we submit to you for review, has been prepared in compliance with the instructions in the Borsa Italiana Regulations.
Specifically, consolidated financial statements apply the approach set forth by international accounting standards (IASs/IFRSs) adopted by the European Union.
COMMENTS ON OPERATING AND FINANCIAL RESULTSThe following table summarises the Datalogic Group’s key operating and financial results as at 31 December 2015 in comparison with the same period a year earlier (figures in Euro thousands):
(€/000) 31.12.2015 31.12.2014 Change Change %
Total revenues 535,068 464,546 70,522 15.2%
EBITDA (*) 73,748 69,443 4,305 6.2%
% of total revenues 13.8% 14.9%
Group net profit/loss 40,547 30,857 9,690 31.4%
% of total revenues 7.6% 6.6%
Net Financial Position (NFP) (**) (20,961) (55,718) 34,757 -62.4%
(*) EBITDA is a performance indicator not defined under IFRS. However, the management uses it to monitor and assess the Company’s operating performance, as it is not influenced by volatility due to the various valuation criteria used to determine taxable income, by the total amount and nature of the capital involved or by the related depreciation and amortisation policies. Datalogic defines it as Profit/Loss for the period before depreciation and amortisation of tangible and intangible assets, non-recurring costs, financial income and expenses and income taxes.
(**) For the criteria defining the Net Financial Position please see page 35.
As at 31 December 2015, the Datalogic Group had revenues of €535,068 thousand (€464,546 thousand in the previous year), of which €508,338 thousand derived from product sales and €26,730 thousand from services.
Revenues increased by 15.2% compared to the previous year; at constant Euro/Dollar exchange rates they would have increased by 5.9%. This improvement, stemming from a continuous product innovation, aimed at meeting customers’ needs, involved both ADC and IA divisions and the main reference markets, especially Europe, China and United States, where the distribution network was significantly strengthened.
The booking (already acquired orders) achieved €563.3 million, up by 17.6% compared to the same period of 2014. In 2015, the impact on turnover generated by new products (launched in the last 24 months) was equal to 26.7%.
Group EBITDA was €73,748 thousand, corresponding to 13.8% of total revenues, an increase of 6.2% compared with the same period of the previous year (€69.443 thousand as at 31 December 2014, +8.6% at constant exchange rates).The decrease in margin is primarily due to the exchange rate effect, net of which the margin would have been 15.3%, thanks to the confirmation of high margins of the ADC Division, as well as the results of operating cost-saving measures.
Group net profit, which as at 31 December 2015 was €40,547 thousand, is 31.4% higher than the profit obtained in the previous year, equal to €30,857 thousand.
Management report
22

Events in 2015During 2015, the Company continued the development focused on the following strategic priorities:• Focus on customers and technological innovation;• Increase of market shares in markets with the largest growth potential;• Development of human resources.
FOCUS ON CUSTOMERS AND TECHNOLOGICAL INNOVATIONThe target is to place the customer at the centre of the entire value chain, by fulfilling and staying ahead of the customer’s needs in terms of increased efficiency and quality of the Company’s own activities. Being close to customers and paying attention to their needs is the driver of growth; moreover, technological innovation boots future development. Greater resources have been allocated to innovation (€48,244 thousand invested in Research, up by 11.9% compared to the previous year and equal to 9.0% of revenues). The impact on turnover generated by new products (launched in the last 24 months) amounted to 26.7%. To confirm the validity and strategic importance of ongoing R&D projects, in December the Parent Company signed a loan agreement with the European Investment Bank (EIB) for a total amount of €30 million, with a 5-year amortisation period.
INCREASE OF MARKET SHARES IN MARKETS WITH THE LARGEST GROWTH POTENTIALThe expansion phase in both fast growing and mature markets continued in 2015 through the implementation of the organisational structure dedicated to end customers, in addition to special channels, and a focus on the range of applications aimed to retail, transport and logistics sectors, as well as the manufacturing industry and health care.Moreover, the new commercial office in Cape Town was opened on 2 December 2015. The new office in South Africa reflects the growing strategic importance that the region holds for Datalogic, where the Company has rooted its presence since 2013.
DEVELOPMENT OF HUMAN RESOURCESThe motivation, passion and dedication of Datalogic’s employees are one of the Group’s undeniable strong points.
In 2015, the investment in the sHaRe management platform, available to Group personnel, continued with the launching of new applications (HC Reporting, 360° evaluation and the completion of the performance management system), as well as the begin-ning of the development of new modules (E-Recruitment, E-Compensation).The definition and construction project of the Datalogic Company Culture started at end 2015. This led to the definition of 10 key values, which are fundamental to the behaviour expected for each single individual within the Group.
FURTHER EVENTS OCCURRED OVER THE YEARA medium-term refinancing operation was completed with a pool of Banks on 24 February, for a total amount of €140 million, an arm’s length interest rate and a five-year duration with covenants substantially in line with the Group best practice for similar operations. This transaction allows for the further improvement of the financial structure by extending the duration of medi-um-term debt from almost two years to around four years, and reducing the average cost of debt.
On 28 April, the Shareholders’ Meeting appointed the Company’s new Board of Directors for the 2015-2017 period.
On 13 May, Michele Marchesan was appointed Senior Vice President and Chief Human Resources Officer.
On 29 May, an agreement was signed with Royal Mail for the implementation of a new sorting out automated system in around 20 postal centres in the United Kingdom. The total value of the order is around €29 million.
On 7 August, following the resignation of Bill Parnell, Pietro Todescato was appointed new CEO of Datalogic ADC.
On 10 December, an agreement was signed for the acquisition of 20% share capital in CAEN RFID S.r.l., a leading company in RFID-Radiofrequency Identification in the Ultra High Frequency (UHF) band, and with headquarter in Tuscany. Moreover, a trade agreement was signed which envisaged, amongst other, the joint development of new products, the use by Datalogic of CAEN RFID components to manufacture new products and the distribution of CAEN RFID products under Datalogic brand.
23
Management report

On 18 December, a loan agreement was signed with the European Investment Bank (EIB), for a total amount of €30 million, with a 5-year amortisation period, aimed at supporting investments, R&D activities and the Group’s technological innovation.
On 29 December, the Alternate Auditor Mario Fuzzi took over the office of Mr. Enrico Cervellera, after his resignation as Chairman of the Board of Statutory Auditors. Mr. Mario Fuzzi will remain in office until the next Shareholders’ Meeting of the Company.
On 31 December, the Chief Information Officer (“CIO”), Mr. Giovanni Sgalambro, ended his collaboration with the Datalogic Group. The Company has already begun its search for a new CIO.
Analysis of reclassified Income Statement dataThe following table shows the main Income Statement items for the Datalogic Group compared with the same period in the pre-vious year:
(€/000) 31.12.2015 31.12.2014Riclassified
Change Var. %
Total revenues 535,068 100.0% 464,546 100.0% 70,522 15.2%
Cost of sales (286,450) -53.5% (236,101) -50.8% (50,349) 21.3%
Gross Profit 248,618 46.5% 228,445 49.2% 20,173 8.8%
Other revenues 3,504 0.7% 2,239 0.5% 1,265 56.5%
Research and development expenses (48,244) -9.0% (43,108) -9.3% (5,136) 11.9%
Distribution expenses (101,095) -18.9% (88,205) -19.0% (12,890) 14.6%
General and administrative expenses (39,521) -7.4% (39,146) -8.4% (375) 1.0%
Other operating costs (2,041) -0.4% (2,206) -0.5% 165 -7.5%
Total operating costs and other costs (190,901) -35.7% (172,665) -37.2% (18,236) 10.6%
Ordinary operating result before non-recurring costs and revenues and administrative costs arising from acquisitions (EBITANR) 61,221 11.4% 58,019 12.5% 3,202 5.5%
Non-recurring costs and revenues (2,564) -0.5% (5,618) -1.2% 3,054 -54.4%
Depreciation and amortisation due to acquisitions (*) (5,712) -1.1% (5,493) -1.2% (219) 4.0%
Operating Result (EBIT) 52,945 9.9% 46,908 10.1% 6,037 12.9%
Net financial income (expenses) (4,622) -0.9% (8,111) -1.7% 3,489 -43.0%
Profits/(Losses) from associates 174 0.0% 25 0.0% 149 596.0%
Foreign exchange differences 3,087 0.6% 357 0.1% 2,730 764.7%
Pre-tax profit/(loss) 51,584 9.6% 39,179 8.4% 12,405 31.7%
Taxes (11,037) -2.1% (8,322) -1.8% (2,715) 32.6%
Group Net Profit/(Loss) 40,547 7.6% 30,857 6.6% 9,690 31.4%
Depreciation and write-downs of Tangible assets (7,812) -1.5% (7,199) -1.5% (613) 8.5%
Amortisation and write-downs of Intangible assets (4,715) -0.9% (4,225) -0.9% (490) 11.6%
EBITDA 73,748 13.8% 69,443 14.9% 4,305 6.2%
(*) This item includes costs for amortisation arising from acquisitions. To provide a better representation of the Group’s ordinary profitability, we chose – in all tables in this section concerning information on operating performance – to show an operating result before the impact of non-re-curring costs/revenues and of depreciation and amortisation due to acquisitions, which we have called EBITANR (Earnings before interests, tax, acquisitions and not recurring), hereinafter referred to as “Ordinary operating result”. To permit comparability with the financial statements, we have in any case included a further intermediate profit margin (“Operating result”) that includes non-recurring costs/revenues and depreci-ation and amortisation due to acquisitions and which matches figures reported in year-end financial statements.
It is noted that figures as at 31 December 2014 were reclassified under various items to render them consistent with figures re-lated to 2015. For the details, reference is made to the Annex to the Financial Statements.
Management report
24

The Gross Profit, equal to €248,618 thousand, increased by 8.8% against €228,445 thousand reported in the previous year (4.1% at constant exchange rates), while its impact on revenues decreased from 49.2% in 2014 to 46.5% in 2015. This trend is mainly due to the combined effect of Euro/Dollar performance and the reduction in margin recorded by the System BU. Net of these effects, the Group gross profit would have been equal to 49.9%.
Operating Costs, equal to €190,901 thousand, increased by 10.6% (at constant exchange rates the increase would have been 2.8%), compared to €172,665 thousand of 2014. Their impact on turnover, however, improved from 37.2% to 35.7%. R&D costs, the true lever for a sustainable growth, increased from €43,108 thousand to €48,244 thousand (+11.9% compared to 2014). Their impact on revenues remained substantially unchanged (9% compared to 9.3% reported in 2014). Distribution costs stood at €101.1 million, up by 14.6% compared to 2014, mainly due to the strengthening of sales in North America, while General and Administra-tive expenses increased by 1% only, reporting €39.5 million thanks to a higher control of the same.
As at 31 December 2015, item non-recurring costs and (revenues), primarily due to internal reorganisation activities, showed a balance of €2,564 thousand.
The breakdown of this item is as follows:
Items (€/000) Amount Type of cost
1) "Cost of goods sold" 241 early retirement incentives
Total 241
2) "R&D expenses" 92 early retirement incentives
Total 92
3) "Distribution expenses" 688 early retirement incentives
3) "Distribution expenses" 310 commissions
Total 998
4) "General and administrative expenses" 825 early retirement incentives
4) "General and administrative expenses" 408 consulting
Total 1,233
Total non-recurring costs 2,564
As at 31 December 2015, depreciation and amortisation due to acquisitions (totalling €5,712 thousand) broke down as follows:
(€/000) 31.12.2015 31.12.2014 Change
Acquisition of the PSC group (on 30 November 2006) 2,513 2,099 414
Acquisition of Laservall S.p.A. (on 27 August 2004) 0 221 (221)
Acquisition of Informatics Inc. (on 28 February 2005) 120 602 (482)
Acquisition of Evolution Robotics Retail Inc. (on 1 July 2010) 631 527 104
Acquisition of Accu-Sort Systems Inc. (on 20 January 2012) 2,448 2,044 404
Total 5,712 5,493 219
The “Ordinary Operating Result” (EBITANR) was €61,221 thousand (11.4% of revenues) and up by 5.5% over the amount registered for the same period of the previous year (€58,019 thousand).
The Operating Result (EBIT) increased by 12.9%, from €46,908 thousand, recorded in the previous year, to €52,945 thousand (+25.8% at constant exchange rates).
25
Management report

The following table compares the main operating results achieved in the fourth quarter 2015 with the same period of 2014.
(€/000) QIV 2015 QIV 2014 Change Change %
Total revenues 143,773 100.0% 124,482 100.0% 19,291 15.5%
M.O.L. (EBITDA) 20,670 14.4% 17,436 14.0% 3,234 18.5%
Ordinary Operating Result (EBITANR) (*) 17,409 12.1% 14,400 11.6% 3,009 20.9%
Operating Result (EBIT) 14,856 10.3% 9,756 7.8% 5,100 52.3%
(*) see definition on page 24.
The following table compares the main operating results achieved in the fourth quarter of 2015 with those achieved in the third quarter of 2015.
(€/000) QIV 2015 QIII 2014 Change Change %
Total revenues 143,773 100.0% 133,810 100.0% 9,963 7.4%
M.O.L. (EBITDA) 20,670 14.4% 18,752 14.0% 1,918 10.2%
Ordinary Operating Result (EBITANR) (*) 17,409 12.1% 15,478 11.6% 1,931 12.5%
Operating Result (EBIT) 14,856 10.3% 13,404 10.0% 1,452 10.8%
(*) see definition on page 24.
The fourth quarter 2015 reported a better performance than the last two years, both in terms of growth in revenues and increased profitability. An acceleration was reported in this quarter, compared to the same period of the previous year, with revenues that in-creased to €143,773 thousand, with a 15.5% growth compared to the fourth quarter 2014 (at constant exchange rates they would have stood at €134.8 million, +8.3%) and 7.4% compared to the previous quarter.
EBITDA increased over the quarter to €20,670 thousand, with 10.2% growth compared to the third quarter 2015 and 18.5% com-pared to the fourth quarter 2014.
The booking (already acquired orders) during the quarter was equal to €158.2 million, up by 21.3% compared to the fourth quarter 2014.
Segment disclosureOperating segments are identified based on the internal statements used by senior management to allocate resources and eval-uate results.
The Group operates in the following business segments:
ADC – The ADC Division is the global leader in high performance fixed scanners for retail and the major EMEA supplier of manual bar code readers as well as the leading player in the mobile computer market for warehouse management, automation of sales and field forces and the collection of data at stores. The manual reader product lines, fixed readers, mobile computers, self-scan-ning solutions and cashier technologies are included.
Industrial Automation – The Industrial Automation Division, among the major manufacturers in the world of products and solutions for automatic identification, recognition and marketing in the industrial automation market, covers the increasing demand for tracking, inspection and recognition solutions in the manufacturing and logistics processes, mainly couriers, areas. It comprises product ranges related to: fixed bar code readers using imager and laser technology, the photoelectric sensors and equipment for industrial automation and security, smart remote cameras and software for artificial vision, industrial laser markers.
Informatics – this Company, which is based in the United States, sells and distributes products and solutions for the management of inventories and mobile assets tailored for small and medium sized companies.
Management report
26

Corporate – it includes the operations of the holding company, the real estate operations of the Group and Datalogic IP Tech, which manages the Group’s industrial property and research activities.
Intersegment sales transactions are executed at arm’s length conditions, based on the Group transfer pricing policies.
The financial information relating to operating segments as at 31 December 2015 and 31 December 2014 are as follows:
(€/000) ADC Industrial Automation
Informatics Corporate Adjustments Total Group
2015 2014 2015 2014 2015 2014 2015 2014 2015 2014 2015 2014
External sales 361,635 308,197 146,050 130,254 27,383 26,124 0 0 0 (29) 535,068 464,546
Intersegment sales 2,331 1,510 34 47 0 0 36,451 24,918 (38,816) (26,475) 0 0
Total sales 363,966 309,707 146,084 130,301 27,383 26,124 36,451 24,918 (38,816) (26,504) 535,068 464,546
Ordinary Operating Result (Divisional EBITANR)
73,630 67,428 6,108 5,424 (223) 1,098 5,179 (5,745) (23,473) (10,186) 61,221 58,019
% of revenues 20.23% 21.77% 4.18% 4.16% (0.81)% 4.20% 14.21% (23.06)% 60.47% 38.43% 11.44% 12.49%
Operating Result (Divisional EBIT) 49,589 56,074 (678) (974) (343) (1,472) 4,693 (6,535) (316) (185) 52,945 46,908
% of revenues 13.62% 18.11% (0.46)% (0.75)% (1.25)% (5.63)% 12.87% (26.23)% 0.81% 0.70% 9.90% 10.10%
Financial Income (expenses) (6,947) (7,796) (1,640) (1,602) (289) (118) 27,744 24,895 (20,229) (23,108) (1,361) (7,729)
Fiscal income (expenses) (7,724) (9,793) 803 575 256 479 (4,406) 378 34 39 (11,037) (8,322)
Amortisation, depreciation and write-downs
(10,714) (9,343) (4,903) (4,549) (329) (778) (2,304) (2,281) 11 34 (18,239) (16,917)
Divisional EBITDA 81,199 74,144 8,564 7,709 (14) 1,274 7,483 (3,464) (23,484) (10,220) 73,748 69,443
% of revenues 22.31% 23.94% 5.86% 5.92% (0.05)% 4.88% 20.53% (13.90)% 60.50% 38.56% 13.78% 14.95%
R&D expenses (39,027) (30,176) (17,942) (14,670) (1,180) (764) (13,596) (13,395) 23,501 15,897 (48,244) (43,108)
% of revenues (10.72)% (9.74)% (12.28)% (11.26)% (4.31)% (2.92)% (37.30)% (53.76)% (60.54)% (59.98)% (9.02)% (9.28)%
Costs in 2014 were reclassified under various items to render them consistent with figures related to 2015. For the details, refer-ence is made to the Annex to the Financial Statements.
For the purposes of a better representation of divisional operating results, we chose to highlight the Divisional EBITDA as monitor-ing KPI of economic performance related to each single operating sector, in line with the data that are periodically reviewed by the top management for a decision-making on resources to be allocated to the sector and the evaluation of its results.
Reconciliation between EBITDA, EBITANR and Profit/(Loss) before tax is as follows:
(€/000) 31.12.2015 31.12.2014
EBITDA 73,748 69,443
Depreciation and write-downs of Tangible assets (7,812) (7,199)
Amortisation and write-downs of Intangible assets (4,715) (4,225)
EBITANR 61,221 58,019
Non-recurring costs and revenues (2,564) (5,618)
Depreciation and amortisation due to acquisitions (*) (5,712) (5,493)
EBIT (Operating Result) 52,945 46,908
Financial Income 37,617 26,831
Financial expenses (39,152) (34,585)
Profits from associates 174 25
Pre-tax profit/(loss) 51,584 39,179
(*) see definition on page 24.
27
Management report

DATALOGIC ADCIn addition to Datalogic ADC S.r.l. and the related European branches, the Datalogic ADC Division comprises Datalogic Slovakia Sro, Datalogic Vietnam Llc and the commercial branches located in the United States, as well as in Australia and Asia.
The Automatic Data Capture (ADC) Division, specialised in the manufacture of fixed bar code readers for the retail market, manual readers and mobile computers for warehouse management, recorded a turnover of €96.2 million in the fourth quarter 2015, a 15.7% (+8.5% at constant exchange rates) increase compared to the fourth quarter 2014. The positive performance is due to the award of important tenders for the supply of bench scanners and hand-held readers in the Retail segment, mainly in North Amer-ica. As at 31 December 2015, the ADC Division recorded a turnover of €363,966 thousand, up by 17.5% compared to December 2014. This improvement is significant also at constant exchange rates (+8.2%). Europe recorded sales amounting to €196,065 thousand, equal to 53.9% of total revenues, while North America recorded revenues of €94,376 thousand, equal to 25.9% of total revenues.
The Gross Profit, equal to €172,226 thousand, is 47.3% of revenues, an improvement compared to 50.8% over 2014.
Operating Costs, which include R&D, distribution and general and administrative expenses, amounted to €100,914 thousand, up by €10,010 thousand compared to the previous year, mainly due to the increase in Distribution expenses, equal to €54,356 thou-sand, up by 12.8% and mainly due to the strengthening of the distribution structure.
Divisional EBITDA was €81,199 thousand, corresponding to 22.3% of total revenues, a decrease compared to 23.9% over the pre-vious year.
Net Profit as at 31 December 2015 was €34,918 thousand (9.6% of revenues).
DATALOGIC INDUSTRIAL AUTOMATIONThe Industrial Automation Division, specialised in the production of automatic identification systems, security, detection and marking for the Industrial Automation market, in the fourth quarter 2015 reported a turnover of €42.7 million, an increase of 21.3% compared to the fourth quarter of 2014 (+14.9% at constant exchange rates). The Division also benefits from the execution by the Business Unit Systems of the first tranche of the Royal Mail order, for the amount of around €4.2 million. Excluding the Business Unit Systems, revenues of the Division increased by 11.7% to €35.0 million (+6.6% at constant exchange rates), thanks to a dou-ble-digit increase in T&L in North America and Factory Automation in APAC.
As at 31 December 2015, the Automation Division reported revenues amounting to €146,084 thousand, up by 12.1% compared to revenues of €130,301 thousand recorded during the previous year (+4.7% at constant exchange rates). Revenues recorded in Europe totalled €65,234 thousand, equal to 44.7% of the total amount; revenues in North America amounted to €32,004 thou-sand, equal to 21.9% of total revenues. Excluding the Business Unit Systems, revenues of the Division increased by 12.6%, to 129 million (+6.2% at constant exchange rates). This growth was driven by the launching of new products in the segment of automatic identification and sensors, dedicated to the Factory Automation and T&L segment.
Gross Profit, equal to €65,446 thousand, is in line compared to the previous year.
Operating Costs, which include R&D, distribution and general and administrative expenses, amounted to €63,875 thousand, up by €8,252 thousand compared to the prior year.
Divisional EBITDA of Industrial Automation was €8,564 thousand, corresponding to 5.9% of total revenues.
Lastly, Informatics reported a turnover of €27.4 million compared with €26.1 million in 2014.
Management report
28

The statement of financial position information relating to operating sectors as at 31 December 2015 compared with the informa-tion as at 31 December 2014 is as follows:
(€/000) ADC Industrial Automation
Informatics Corporate Adjustments Total Group
31.12.15 31.12.14 31.12.15 31.12.14 31.12.15 31.12.14 31.12.15 31.12.14 31.12.15 31.12.14 31.12.15 31.12.14
Total Assets 644,360 587,938 302,179 226,237 24,604 21,423 782,593 677,215 (1,064,560) (912,534) 689,176 600,279
Non-current assets 159,226 148,927 99,247 85,149 15,270 12,967 33,635 30,756 573 797 307,951 278,596
Tangible assets 19,226 17,787 18,671 10,734 2,711 2,568 27,806 26,098 (30) (30) 68,384 57,157
Intangible assets 140,000 131,140 80,576 74,415 12,559 10,399 5,829 4,658 603 827 239,567 221,439
Equity investments in associates
76,241 69,287 6,387 6,213 155,190 155,190 (235,836) (228,882) 1,982 1,808
Total Liabilities 423,679 398,989 245,880 173,420 7,245 5,504 541,641 463,614 (827,529) (682,539) 390,916 358,988
Sector information by region as at 31 December 2015 and 31 December 2014 is broken down as follows:
(€/000) 31.12.2015 31.12.2014 Change
Revenues per geographic area
Revenues in Italy 45,798 44,489 2.9%
Revenues in Europe 222,735 199,484 11.7%
Revenues in North America 161,063 132,644 21.4%
Revenues in Asia & Pacific 71,490 57,327 24.7%
Revenues in Rest of the World 33,982 30,602 11.0%
Total revenues 535,068 464,546 15.2%
(€/000) 31.12.2015 31.12.2014 Adjustments 31.12.2015
Adjustments 31.12.2014
Consolidated 31.12.2015
Consolidated 31.12.2014
Change
Non-current assets
Italy 381,456 394,815 381,456 394,815 -3.4%
Europe 35,062 26,152 35,062 26,152 34.1%
North America 392,696 354,370 392,696 354,370 10.8%
Rest of the World 16,198 13,446 16,198 13,446 20.5%
Eliminations and adjustments (429,333) (441,899) (429,333) (441,899) -2.8%
Total 825,412 788,783 (429,333) (441,899) 396,079 346,884 14.2%
Performance by business segment and R&D activitiesDATALOGIC ADCResearch and Development expenses for the year amounted to €39,027 thousand, with respect to ADC Division. The R&D ac-tivities carried out during 2015 by the ADC Division are described hereunder, by reason of the fact that they are deemed more significant to describe the performance of Research activities. The ADC Division has three R&D centres situated in Italy, America and Vietnam.
Hand-held readers (HHRs) In 2015 Datalogic ADC confirmed its leadership position as to manual bar code readers; 2015 sales at global level amounted to €171,000 thousand (21%), an increase compared to the previous year.The year 2015 was an excellent year, both for the category of multiple use readers, where sales increased by 18.4%, and industrial readers. The latter segment played a significant role in the total growth, reporting 57% increase compared to the previous year. The roll-out of around 23 thousand units at one of the US largest industry retailers is worth noting.
29
Management report

Excellent results have been achieved also thanks to the growth in the product range of 2D imaging readers, which reported +44.4% compared to 2014. Conversely, sales in imager 1D products decreased and the laser reader market remained unchanged.
The main products introduced in 2015 are as follows:• QuickScan 2131: the outstanding optical characteristics and the extra-wide scan line allow for an easier acquisition of longer
and larger bar codes by the new scanner imager. These bar codes are commonly used, also at close range, in various application segments, such as bills of households utilities, transport documents and some parcels. The scanner beam, clear and well visible, renders the reader easy and intuitive to use. As for the other readers of the QuickScan series, the new Datalogic imager stands out for its elegant and modern design.
• QM2131: equipped with Datalogic STAR 2.0 Cordless System, for radio communications in narrow 433 MHz band, the device QM2131 linear imager guarantees safe communications free of interferences with Wi-Fi infrastructures, with low sensitivity to obstacles.
• QBT 2131: equipped with wireless Bluetooth®, this device can transmit data from the host through the base station, as well as through any Bluetooth compatible device available on the market. The QBT2131 linear imager is also able to connect any tablet with iOS or Android™ operating system, through the Bluetooth HID profile.
• QD 2100 Quickscan: the QuickScan I QD2100 linear imager reader is an entry level product that is perfect for use in retail and office environments, as well as activities related to couriers and postal services. The QD2100 is small, lightweight and its ergonomic design is comfortable to use. It offers snappy reading performance and is capable of reading a wide reading range of symbols, including the majority of 1D codes, as well as GS1 DataBar™ linear codes. The QD2100 reader was designed with durability in mind. One of the most vulnerable features of any scanner is damage to the scan window. When such accidents happen, the scanner may have to be replaced. The QD2100 was specifically designed so that a replacement window pack can be ordered to replace damaged or scratched windows without having to return the scanner for repairs. This helps to reduce the total cost of ownership during the life of the scanner and helps to ensure that it is always available for use.
• HD3400 Heron: the new scanner Datalogic Heron™ HD3430 2D is an area imager with an elegant design, equipped with a bar code reading technology of the latest generation and it is the ideal solution for the acquisition of data in the modern sales points. This new scanner can be customised with corporate identity brands, as the top cover can be marked with a logo and bear the desired colours. It is also possible to have dedicated visual and audio feedbacks.
Checkout scanners Datalogic is the world leader in developing solutions for the automatic acquisition of data (ADC) related to sales in the retail sector by offering revolutionary solutions, innovations in the high-performance checkouts, automatic scanning, advanced imaging read-ers, personal shopping and visual recognition. In 2015, Datalogic continued to be the world’s number one for data collection using in-counter or on-counter readers in the retail segment. The Magellan brand is world renowned for its top quality and extreme reli-ability. Turnover is growing by 18.9%, compared to the previous year. The sales of the new Magellan 9800I increased remarkably. In 2015, the installation of the Jade X7 Automated Scanning device continued at some of the most important retailers in the world. Datalogic presented the next generation of Magellan 9300I e 9400I scanner imaging devices in order to provide customers with a range of high performance scanners at a competitive price.
Major products introduced in 2015:• 9300I Magellan: the new series of high performance bar code readers. With a multi-plane digital imager technology, the 9300I
scanners easily read both 1D and 2D bar codes, thus allowing the operator to rapidly and continuously work with no need for correctly orienting the product. With a traditional layout, wide windows for the vertical and horizontal reading can be easily placed inside the counter or in self-checkout stations with touchscreen. This is easily interfaced with any type of payment ter-minal or printer. The Customer Service Scanner (CSS) allows retailer to easily implement mobile commerce programs. Shoppers can easily self-scan the bar codes of promotional coupons from both mobile devices and paper-based coupons.
• 9400I Magellan: this device is similar to the 9300I version, but is also equipped with a full digital scanner for 2D bar codes on a multi-plane. The acquisition of images, Datalogic Clear™ Glass, is available also in the multi-plane imaging scanner/scale version, complete with three processors capable of improving the performance of the scanner and supporting the Digimarc™ technology.
Mobile computing store automationIn 2015, the Mobile Computing Business Unit reported its best year, with a turnover higher than €100,000 thousand, up by 10% compared to the previous year, thus confirming and reinforcing its third position at world level. The strong growth in North America and the continuing increase in the EMEA region, more than offset a certain weakness in the emerging markets.
Management report
30

A number of innovative projects were started in 2015 and will result in new important products in 2016 and 2017.
The main products introduced in 2015 are as follows:• Joya X2 General Purpose: the Joya™ X2 General Purpose (GP) with 2D imaging technology, is the standard mobile computer
version of the Joya device, usually used in Self-Shopping. This was mainly studied as simple and intuitive solution to manage the shop-floor and inventory activities in a retail environment, rather than for the access control in the Entertainment applications or applications in the Transport segment. The Joya X2 GP is equipped with a new keyboard layout, with special setups to use the device for the mobile computing data collection (offered with Software Development Kit (SDK) Datalogic CE6, for the devel-opment of C/C++ and .NET applications).
• QUEUE Busting Application: with the Queue Busting app, the operator reads the bar codes of the products directly in the trolleys or baskets by using the Joya™ device, connected to a mobile printer, while the customer waits in a queue. The service is therefore optimised, especially in busiest shopping hours. Satisfaction of shoppers is therefore increased as they benefit from a quick and immediate checkout. At the end of the reading, the printer prints a label with a 2D code which includes all information on the items that had been previously scanned. Upon checkout, the operator carries out the first scan of the 2D bar code and then prints the sales receipt reporting the total amount of the shopping.
• DL-Axist: the first full rugged Datalogic Android full touch PDA was presented on the occasion of the NRF 2016 meeting. Fea-turing a 5”HD screen, with the best Wi-Fi connection available on the market and advanced 2D images for data collection. With the Datalogic SoftSpotTM a new and more efficient way to make the best use of touchscreen potentialities is now available.
• Joya Touch: previewed on the occasion of the NRF 2016 meeting, the latest self-shopping device, the Joya Touch, features a number of innovations: wireless recharge and fast battery recharge, easily convertible from pod to reader and equipped with Datalogic SoftSpotTM technology.
DATALOGIC INDUSTRIAL AUTOMATIONResearch and Development expenses for the year amounted to €14,670 thousand, with respect to Industrial Automation Division. The R&D activities carried out during 2015 by the Datalogic Industrial Automation Division are described hereunder, by reason of the fact that they are deemed more significant to describe the performance of Research activities.
Identification2015 was a very positive year for the ID range products and excellent results were achieved in all markets. During the year, a new range of DS8110 and DX8210 industrial laser scanners was launched, a long-standing tradition of excellence of the 8000 series, with additional functions which confer higher value to customers and operators in the transport and logistics sectors. The Imager 2D Matrix range has grown dramatically thanks to the successful application of new SW functions, including, but not limited to the innovative DL.CODE graphical interface and the new decoder algorithms for Direct Part Marking, but also thanks to the launching on the market of new models including Matrix 210N, an ultracompact imager with electronic autofocus, a pioneering solution in the industrial production within the Electronics, Automotive, Pharmaceutical and Food & Beverage segments.The ID Business Unit, amid the most active in the production of Intellectual Properties, performed a number of researches of the utmost innovative content, both technological and process-related, within the projects financed by the Emilia Romagna region.
LasermarkingIn the Lasermarking Business Unit, products for industrial marked excellent results on all markets, especially the European market. During the year, this BU completed the development of a new, highly innovative, laser product called UniQTM.This marker is based on the proprietary Fiber Laser technology and it is characterised by distinctive elements, including extremely reduced size and immunity as regards industrial environments, as well as the “ALL-IN-ONE” approach, i.e. the total absence of external devices such as check devices or power systems. Their launch on the market is expected in April 2015.In 2015, the Lasermarking BU developed a new marking system, based on the MOPFA technology owned by the Group. This new product completes the already existing portfolio, while allowing the penetration in niche markets and applications that are not covered by the current solutions.This product will be launched in the first quarter of 2016.
Sensors & SafetyWith regard to security devices, the development of a new range of SLIM barriers was completed in 2015. This solution was born to be perfectly compatible with any machine, thanks to its reduced size and high mechanical flexibility. This is the simplest and most flexible solution designed to protect automatic or semi-automatic machines, where saving space is a key feature and where the
31
Management report

close dangerous areas and the frequent interventions of operators require a photoelectric barrier that must be perfectly integrated in the machine framework.Moreover, Datalogic has developed the innovative SG4-H safety barrier, first and only on the market with stainless steel container and IP69K protection for applications in the aseptic environment of the pharmaceutical industry.In the sensor and photoelectric device segment, a new version of contrast readers was developed within the consolidated family of TL46, characterised by a very low uncertainty of response time, which is the key feature for applications in the sector of printing machines. A new miniature-sized family S45 was also introduced. This is the most complete range of reduced-size formats today available in the Automation market. This offers a wide range of optical functions, types of luminous emissions and models with advanced detection functions, particularly suited to all applications for food, as well as bottling and pharmaceutical industries.
VisionThe Vision Business Unit introduced the line of MX-U Vision processors and the related next generation of high speed U Cameras, which is capable of supporting the USB3 technology, necessary to meet requirements of high speed applications. It also improved performance of SW IMPACT, which is now up to 5 times higher than in past times. The family of P-series smart cameras has now been widened with the new colour devices. In 2015, important new management features of fieldbuses were introduced, for the communication with PLC, on the entire product range. In the software development area, the first OCR-dedicated product was introduced; it is easy and intuitive to use and based on the family of P-series smart cameras.
The already undergoing development was completed in 2015. This led to the definition of a solution for the optical character rec-ognition (OCR): IMPACT+ OCR.The IMPACT+OCR device was launched on 29 September. This is the most rapid and innovative solution for inspections of variable data printing in the food industry. The complete solution envisages a pre-configurated combination of camera and dedicated software which facilitates the devel-opment of solutions aimed at monitoring variable data printing. The solution includes the P-Series compact smart camera and a graphics user interface which allows for the quick configuration of any type of OCR (Optical Character Recognition) app. IMPACT+ OCR offers an easy and rapid inspection of variable data printing, with no need for special programming abilities of vision machine systems. The very intuitive software will guide the user in the configuration of the system, step-by-step. The key charac-teristics include multiple OCR readings, the ability to store various inspection proceedings in memory and a customizable operator interface. Especially suited for OCR applications in the food industry, IMPACT+ OCR ensures effective results in the reading of batch numbers, checks on expiry dates and traceability of serial numbers. Combined with thermal transfer printers, IMPACT+ OCR ensures a high printing quality and increases safety and traceability of packaging processes of food and drinks.
SystemsOn 29 May 2015, Datalogic signed an agreement with Royal Mail for the implementation of a new sorting out automated system in around 20 postal centres in the United Kingdom.Royal mail is the most important postal company in the United Kingdom, able to deliver envelopes, letters and parcels to more than 29 million addresses. The new automatic sorting out systems will increase speed and efficiency of the process, while ensuring traceability of the parcels within the entire corporate network. Through the Systems BU (with headquarter in Telford, Pennsylvania), Datalogic will supply turn-key solutions for the total value of around €29 million, including: • planning, software, controls, management programme, management of sub-contractors, installation, servicing, training and
support;• automatic unloading of parcels;• conveyor and introduction lines for the conveying of parcels;• dimensions, weight and volume of parcels (DWS);• system management and integration software.
In 2015, the Division benefited from the execution of the first tranche in the Royal Mail order, for an amount of around €4.2 million.
Management report
32

Social, political and trade union climateThe year 2015 was characterised by the continuing implementation of the important business renewal and strengthening strate-gy, as well as Group growth, strongly endorsed by the Group CEO through the identification of three key actions:• focus on Customers and technological innovation;• increase of market shares in markets with the largest growth potential;• development of human resources.
Within the investment in environment and management of human resources, in 2015 the Group continued its investment in the sHaRe management platform, available to Group personnel, with the evaluation of performance and assignment of goals.
The definition and construction project of the Datalogic Company Culture started at end 2015. This led to the definition of 10 key values, which are fundamental to the behaviour expected for each single individual within the Group.Customer orientation, as well as Innovation and Long-life expectancy were identified as the three key pillars of the organisation.
In 2015 as well, still striving to improve services to internal customers, the Company continued to hire new persons in the Human Resource Function, both in the Corporate and Regional Areas structures.
Datalogic also consistently implemented staff training initiatives. The Company took advantage of most of the resources available for the financed training, with a focus on: skill development in R&D, methodologies and knowledge of instruments used and project management. Moreover, a remarkable portion of training hours was dedicated to the fulfilment of regulatory obligations as regards security and health on workplace, as set forth in the Leg. Decree 81/08 and the 2011 Agreement between the central Government and Italian Regions. This year as well, attention was paid to the need for English courses.
As regards Industrial Relations, in 2015 negotiations started with Trade Unions for the renewal of the second level Agreement, and the agreement on the Production Bonus for 2015 and 2016 was renewed, for the Italian employees, based on the same growth and profitability targets established in the Group Budget.
Over 2015, organisational changes continued in some Corporate functions. Operations and Customer Administration, once dupli-cated and operating in each single Division, were classified as Corporate functions, in addition to Quality and Procurement, already included in the Corporate function in 2014. These changes will also allow to introduce, for these two corporate functions, uniform and global systems and processes for the management of activities worldwide.
The inception of an evolution process in the general structure of the Company was also announced, aimed at the achievement of an organisation structured with respect to Datalogic’s main reference markets, called Industries (Retail, Transportation & Logistics, Factory Automation and Health Care).
The aforesaid contributed to reinforce the corporate spirit and the feeling of belonging.
33
Management report

Analysis of financial and capital dataThe following table shows the main financial and equity items for the Datalogic Group as at 31 December 2015, compared with 31 December 2014.
(€/000) 31.12.2015 31.12.2014
Net intangible assets 56,547 57,027
Goodwill 183,020 164,412
Net tangible assets 68,384 57,157
Unconsolidated equity investments 6,607 5,289
Other non-current assets 49,288 42,348
Non-current capital 363,846 326,233
Net trade receivables from customers 68,765 70,184
Amounts due to suppliers (101,711) (92,167)
Inventories 69,477 62,416
Net Working Capital, trading 36,531 40,433
Other current assets 28,643 31,408
Other current liabilities and provisions for short term risks (61,025) (57,937)
Net Working Capital 4,149 13,904
Other M/L term liabilities (26,773) (24,766)
Employee severance indemnity (6,814) (7,201)
Provisions for risks (15,187) (11,161)
Net invested capital 319,221 297,009
Total Shareholders’ Equity (298,260) (241,291)
Net Financial Position (20,961) (55,718)
Net Working Capital, trading as at 31 December 2015 amounted to €36,531 thousand, down compared €40,433 thousand as at 31 December 2014.
Net Working Capital as at 31 December 2015 amounted to €4,149 thousand (€13,904 thousand as at 31 December 2014). The decrease of €9,755 thousand compared to 31 December 2014, is mainly attributable to the increase in trade payables, which increased from €92,167 thousand at end 2014 to €101,711 thousand as at 31 December of this year, and to the increase in the item other payables, amounting to €3,088 thousand.
Management report
34

As at 31 December 2015, the net financial position is broken down as follows:
(€/000) 31.12.2015 31.12.2014
A. Cash and bank deposits 126,166 85,993
B. Other cash and cash equivalents 46 160
b1. Restricted cash deposit 46 160
C. Securities held for trading 361 361
c1. Short-term 0 0
c2. Long-term 361 361
D. Cash and equivalents (A) + (B) + (C) 126,573 86,514
E. Current financial receivables 0 3,234
F. Other current financial receivables 0 0
f1. Hedging transactions 0 0
G. Bank overdrafts 45 141
H. Current portion of non-current debt 32,973 74,699
I. Other current financial payables 6,355 1,135
i1. Hedging transactions 6 0
i2. Payables for leasing 260 247
i3. Current financial payables 6,089 888
J. Current financial debt (G) + (H) + (I) 39,373 75,975
K. Current financial debt, net (J) - (D) - (E) - (F) (87,200) (13,773)
L. Non-current bank borrowing 139,639 88,950
M. Other non-current financial assets 31,872 20,290
N. Other non-current liabilities 394 831
n1. Hedging transactions 115 262
n2. Payables for leasing 279 569
O. Non-current financial debt (L) - (M) + (N) 108,161 69,491
P. Net Financial Debt (K) + (O) 20,961 55,718
Net Financial Debt as at 31 December 2015 was negative by €20,961 thousand, an improvement of €34,757 thousand compared to 31 December 2014, (€55,718 thousand).
Note that the following transactions were carried out in the period:• payment of dividends of €10,471 thousand,• cash outflows for leaving incentives amounting to €2,542 thousand.
Investments were also made, net of disposals, amounting to €22,010 thousand.
35
Management report

The reconciliation between the Parent Company’s Shareholders’ Equity and net profit and the corresponding consolidated amounts is as follows:
(€/000) 31 December 2015 31 December 2014
Total Equity Period results Total Equity Period results
Parent Company Shareholders’ Equity and profit 250,417 27,474 223,915 23,647
Difference between consolidated companies' Net Equity and their carrying value in the Parent Company's financial statements; effect of equity-based valuation
108,261 76,703 79,786 60,159
Reversal of dividends (63,097) (51,890)
Amortisation of intangible assets "business combination" (5,827) (5,827)
Effect of acquisition under common control (31,733) (31,733)
Elimination of capital gain on sale of business branch (18,665) (18,665)
Effect of eliminating intercompany transactions (11,826) (244) (14,115) (1,499)
Reversal of write-downs and capital gains on Equity investments 6,121 6,121
Sale of know-how (7) (7)
Goodwill impairment (1,395) (1,395)
Other (1,133) (324) (801) 155
Deferred taxes 4,047 35 4,012 285
Group Shareholders' Equity 298,260 40,547 241,291 30,857
Ordinary shares and treasury sharesThe item “Treasury shares”, amounting to €4,488 thousand, includes capital gains/(losses) resulting from the sale of treasury shares, net of purchases and related charges (€6,941 thousand). In 2015, the Group purchased 82,517 treasury shares for a total amount of €829 thousand, accounted for excluding purchase costs (€2 thousand). For these purchases, in accordance with Article 2357 of the Italian Civil Code, the Treasury share reserve, in the amount of €2,453 thousand, was made unavailable by using the Share premium reserve.
Financial Income/(Expenses)(€/000) 31.12.2015 31.12.2014 Change
Financial Income/(Expenses) (2,262) (5,823) 3,561
Foreign exchange differences 3,087 357 2,730
Bank expenses (3,304) (2,643) (661)
Other 944 355 589
Total Net Financial Income/(Expenses) (1,535) (7,754) 6,219
Financial Income was negative by €1,535 thousand, compared to a negative result of €7,754 thousand related to the same period of the previous year, mainly to:• better results in the financial management attributable to the significant decrease in “Interest expenses on bank current ac-
counts/loans” due to the entering of a new loan agreement with a pool of banks for the amount of €140 million and the redemption, at the same time, of previous loans amounting to €126 million. This transaction allowed for an increase in the average life of the financial debt and the reduction in the related charges.
• a more favourable performance of exchange rate differences, which had a positive increase of €2,730 thousand.
The “Bank expenses” item mainly includes:• the portion pertaining to the upfront fees period, paid upon opening of long-term loans, in the amount of €1,428 thousand, of which
€1,250 thousand are connected with the early redemption of some long-term loans (€996 thousand as at 31 December 2014);• factoring costs, amounting to €839 thousand (€925 thousand in 2014), related to commissions without recourse.
Management report
36
The “Other” item includes dividends received by the Mandarin fund and the company Idec Corporation and Specialvideo, totalling €572 thousand.
Profits generated by companies carried at Equity were recognised in the amount of €174 thousand (compared with losses of €25 thousand as at 31 December 2014).
Exposure to various types of riskThe Datalogic Group is exposed to various types of corporate risk in carrying out its business. Financial risks (market risk, credit risk and liquidity risk) will be discussed more detail later on. The key corporate risks affecting the financial and economic situation of the Group are as follows:
a) Staff skills: the Group’s business is closely related to the technical skills of its employees, especially in the areas of research and development. To limit this risk, the Group carries out actions with a view to increasing its ability to attract and maintain highly qualified personnel, including implementation of advanced human resources management tools (such as managerial training programmes) and a positive work environment.
b) Protection of technology: the Group reference market is characterised by the design and production of high-tech products, with the resulting risk that the technologies adopted might be copied and used by other operators in the sector. With regard to this risk, the Group has made considerable investments in the area of intellectual property over several years, and today holds more than 1,200 patents (including patents granted and patents for which an application was filed).
c) Difficult procurement: the Group is exposed to contained procurement risk thanks to a strategy whereby every component is sourced from several suppliers. In the few cases when components are sourced from a single supplier, the Group maintains adequate inventories of the critical components, in order to minimize the risks related to this situation.
d) Competition: the Datalogic Group operates in a market that is extremely dynamic and potentially attractive for new operators with financial means greater than those of the Company. To mitigate the risk associated with these events, the Company maintains a high level of investment in Research & Development (around 9.0% of revenues as at 31 December 2015) and a large portfolio of patents which represents a significant barrier to the entry of new competitors. The Datalogic Group also has a strong commercial structure (direct presence in the key countries where the Group operates) and a solid network of commercial partners which makes it possible to ensure a high level of customer service and thus achieve a high degree of loyalty.
Financial risk management objectives and policiesIn carrying out its business, the Datalogic Group is exposed to various financial risks: market risk, credit risk and liquidity risk.
Market risk is connected with the Group’s level of exposure to financial instruments that generate interest (interest rate risk) and due to transactions that generate cash flows in other currencies that fluctuate in value against the Euro (exchange rate risk).
The Group monitors each of the financial risks mentioned, duly intervening in order to minimise them, sometimes with hedging derivatives. The Parent Company manages most of the market and liquidity risks, whereas credit risks are managed by the Group’s operating units. For more information on financials risks and financial instruments, please refer to the relevant section in the Notes to the Accounts, which includes disclosure in accordance with IFRS 7.
37
Management report

Information on Company ownership/ Corporate governance reportPursuant to and by the effects of article 123-bis, paragraph 3, of Legislative Decree 58 of 24 February 1998 (as subsequently amended), the Board of Directors of Datalogic S.p.A. has approved a report on corporate governance and Company ownership for the year ended 31 December 2015, separate from the management report, containing information pursuant to paragraphs 1 and 2 of article 123-bis above.
This report is available to the public on the Company’s Internet site www.datalogic.com
Pursuant and by the effects of Art. 37, par. 2 of the Consob Regulation 16191/2007, it is worth noting that, in the meeting held on 7 May 2015, the Board of Directors deemed that the presumption as per Art. 2497-sexies of the Italian Civil Code does not apply as the subsidiary Datalogic is not subject to the direction and coordination of the Parent Company Hydra S.p.A.. This taking account of the fact that, in addition to the merely financial nature of Hydra, the following indexes (case law and academic processing), in the presence of which the exercise of that activity is possible, are not reported, namely:• interlocking directorates between Parent Company and subsidiary;• a major role of the Parent Company in the setting up of intercompany guarantee plans;• a major role of the Parent Company in the setting up of strategic plans related to the entire Group;• a major role of the Parent Company in the setting up of budgets related to the entire Group;• a major role of the Parent Company in the setting up of risk organisation charts for Group companies;• a major role of the Parent Company in the preparation of codes of conducts and policies which can be applied to the Group;• an exchange of seconded personnel between Parent Company and subsidiary;• the existence of a central decision-making structure as regards selection, training, hiring, organisation of workforce;• the existence of contract relations between Parent Company and subsidiary, the conclusion and maintenance of which are
conditional to the existence and maintenance of the decision-making capacity of the subsidiary;• the existence of guidelines or directives “imposed” by the Parent Company on the planning of market strategies, as well as
extraordinary financial transactions (acquisitions, disposals, etc.) carried out by the subsidiary;• a central treasury service, or other centralised “financial assistance” functions held by the Parent Company;• the subsidiary’s faculty to carry out autonomous negotiations as regards relations with customers, suppliers, banks or other
entities;• the absence of autonomy and independence of the subsidiary’s Board of Directors as regards decision-making.
Other informationDatalogic S.p.A. indirectly controls some companies established and governed by non-European Union countries and that have a relevant importance as per Article 36 of the Consob Regulation 16191/2007 on the market regulation (“Market Regulation”).
Also pursuant to the aforesaid regulation, the Company has implemented in-house procedures to monitor the compliance with provisions set out by the Consob Regulations. In particular, the appropriate corporate management carry out a timing and period-ical identification of relevant “extra-EU” countries and, with the collaboration of the companies involved, the collection of data and information is ensured, as well as the assessment of issues envisaged in the aforesaid Article 36.
It should be however stated that Datalogic is fully complying with provisions set out in Article 36 of the above-mentioned Consob Regulation 16191/2007, and that conditions envisaged therein are present.
The Company complied with the opt-out system set forth in Articles 70, paragraph 8, and 71, paragraph 1-bis, of the Issuer Reg-ulation (implementation regulation of the Italian Consolidated Law on Finance (TUF), concerning the rules for issuers, adopted by Consob with Resolution 11971 of 14 May 1999, as amended later), by making use of the right to depart from the obligation to publish information documents required on the occasion of significant mergers, demergers, capital increase by non-cash contri-butions, acquisitions and sales.
Management report
38

Related partiesWith Resolution no. 17221 of 12 March 2010, also pursuant and by the effects of article 2391-bis of the Italian Civil Code, Consob adopted the Regulation with provisions on transactions with related parties, then amended with Resolution no. 17389 dated 23 June 2010 (“Consob Rules”).
In accordance with the Consob Rules, in order to ensure transparency, as well as substantive and procedural rectitude in transac-tions carried out by Datalogic with “related parties” pursuant to the aforesaid Consob Rules, on 4 November 2010, the Company approved a specific and structured procedure for transactions with related parties (last amendment on 24 July 2015), which can be found on the internet site www.datalogic.com.
Pursuant to Article 5, par. 8, of the Consob Regulation, it should be noted that, over the period 31 January 2015 to 31 December 2015, the Company’s Board of Directors did not approve any relevant transaction, as set out by Article 3, par. 1, lett. b) of the Consob Regulation, or any transaction with minority related parties that had a significant impact on the Group’s Equity position or profit/(loss).
Tax consolidationThe Parent Company Datalogic S.p.A. and other Italian subsidiaries fall within the scope of the “domestic tax consolidation” of Hy-dra S.p.A.. This permits the transfer of total net income or the tax loss of individual participant companies to the Parent Company, which calculates a single taxable income for the Group or a single tax loss carried forward, as the algebraic sum of the income and/or losses, and therefore files a single tax liability or credit with the Tax Authorities.
Law no. 190/2014, par. 37-45, as amended by Art. 5 of the Law Decree no. 3/2015 introduced in the Italian legislation the so-called «optional Patent box regime», which envisaged a facilitated taxation on income resulting from the use of some types of intangible assets by holders of corporate income who carry out some R&D activities.
Following this proceeding, the Parent Company Datalogic S.p.A. and the subsidiary Datalogic IP Tech S.r.l. adhered to this optional regime, the effects of which, in terms of facilitated taxation, while awaiting the definition of the implementing provisions thereof, have not been prudentially recognised in the financial statements ended 31 December 2015.
Outlook for current year and subsequent eventsA growth in revenues, higher than general market growth, is expected in 2016, above all in the markets of Europe and North Amer-ica, where the Group is expecting a consolidation of the competitive position and a double digit growth, respectively.
Our Customers’ satisfaction is the centre of the value chain of the Datalogic Group. Striving to meet the Customers’ needs and the cutting-edge technology of the products are the key drivers for the achievement of the Group growth targets which, in 2016, will witness a more canalised response to market needs, with special focus on the range of applications aimed at the retail, transport and logistics sectors.
The Group will continue to invest resolutely in Research and Development, and will benefit from the increase in margins, expected to be obtained mainly from projects aimed at streamlining production and operating costs, following the reorganisation and cen-tralisation projects of activities and internal organisational functions. Within this framework, we deem that both Datalogic Divisions are in a favourable position to seize the market opportunities thanks to the huge investments made in Research and Development and in the sales network, as well as go to market strategies aligned to the sectors of reference.
On 4 March, following the resignation of Mr. Sergio Borgheresi (Group CFO and Investor Relator at the date of approval of the annu-al financial statements as at 31 December 2015), the Company has already started the search for a new Group CFO and appointed Mr. Stefano Biordi as ad interim Group CFO of Datalogic.
39
Management report

The Board of Directors, upon favourable opinion of the Board of Statutory Auditors, has also assigned to Mr. Biordi the office (and related responsibilities) of manager in charge of the preparation of the Company’s accounting documents. The office of Investor Relator was instead assigned to Mrs. Vincenza Colucci.
Stock market performanceDatalogic S.p.A. has been listed on the Borsa Italiana since 2001 - STAR segment of the MTA, Italy’s screen-based stock market, which comprises medium-sized companies with market capitalisations of between €40 million and €1 billion, committed to meet-ing standards of excellence. During 2015, the share reported a positive performance of 84.7%, and outperformed the shares belonging to the FTSE MIB by 72.7%. The security reached a maximum value of €17.59 per share on 30 November 2015 and a minimum value of €8.80 on 6 January 2015. The average daily volumes exchanged in 2015 were approximately 74,277 shares (substantially unchanged over the prior year).
SegmentBloomberg CodeReuters CodeMKT CapNumber of shares2015 max2015 min
STAR - STAR - MTADAL.IMDAL.MI€958.5 million as at 31 December 201558,446,491 (of which 274,610 treasury shares)€17.59 (30 November 2015)€8.80 (6 January 2015)
STOCK EXCHANGE 2015
Prices Volumes (thousand)
ITSTAR.MIFTSEMIB.MIDAL.MI
DEC 14 FEB 15 APR 15 JUN 15 AUG 15 OCT 15 DEC 15
19.0
17.0
15.0
13.0
11.0
9.0
7.0
650
520
390
260
130
17.59
DEC 14 FEB 15 APR 15 JUN 15 AUG 15 OCT 15 DEC 15
210
190
170
150
130
110
90
70
Management report
40

RELATIONS WITH INSTITUTIONAL INVESTORS AND SHAREHOLDERSDatalogic actively strives to maintain an ongoing dialogue with Shareholders and institutional investors, periodically arranging meetings with representatives of the Italian and international financial community, including annual roadshows organised by Borsa Italiana for companies belonging to the STAR segment.
During 2015, the Company met over 160 institutional investors, up by 24% over the prior year, in “one to one, lunch meeting” and the following corporate events: • London Roadshow Beremberg,12 February • Intermonte Investment Conference, 13 March • Star Conference - Milan, 24-25 March • Kepler Investment Conference - Milan, 11 June • Equita Reverse Roadshow Germany – Bologna, 22 June• Star Conference London, 2 October • Venice Mediobanca, 27 November• Conference Call on the financial results
Secondary locationsThe Parent Company has no secondary locations.
Allocation of the year’s earningsTo our Shareholders,
we believe that the management report, which accompanies the statutory year-end accounts of the Company and the Datalogic Group’s consolidated year-end financial statements, provides exhaustive illustration of the performance and results achieved in 2015.
Since the financial statements of Datalogic S.p.A. show a net operating profit for the year of €27,473,742 the Board of Directors proposes to:
• allocate €161,490 to the legal reserve in order to adjust it to one fifth of the share capital, pursuant to Art. 2430 of the Italian Civil Code;
• allocate €3,438,277 of earnings to the reserve for unrealised gains on exchange, pursuant to Art. 2426 8-bis of the Italian Civil Code;
• distribute an ordinary unit dividend to Shareholders, gross of legal withholdings, of 25 cents per share with coupon detachment on 9 May 2016 (record date 10 May 2016) and payment from 11 May 2016, for a maximum amount of €14,611,623;
• carry forward the remainder of the year’s earnings.
The Chairman of the Board of Directors (Mr. Romano Volta)
41
Management report

Consolidatedfinancial statement

Consolidated Statement of Financial PositionASSETS (€/000) Notes 31.12.2015 31.12.2014
A) Non current assets (1+2+3+4+5+6+7) 396,079 346,884
1) Tangible assets 68,384 57,157
Land 1 5,763 5,365
Buildings 1 32,299 24,698
Other assets 1 28,029 22,673
Assets in progress and payments on account 1 2,293 4,421
2) Intangible assets 239,567 221,439
Goodwill 2 183,020 164,412
Development costs 2 5,349 6,809
Other 2 47,829 49,031
Assets in progress and payments on account 2 3,369 1,187
3) Equity investments in associates 3 1,982 1,808
4) Financial assets 35,718 24,132
Equity investments 5 4,625 3,481
Securities 5 361 361
Other 5 30,732 20,290
5) Loans 5 1,140
6) Trade and other receivables 7 1,929 1,721
7) Deferred tax assets 13 47,359 40,627
B) Current assets (8+9+10+11+12+13+14) 293,097 253,395
8) Inventories 69,477 62,416
Raw and ancillary materials and consumables 8 18,056 12,367
Work in progress and semi-finished products 8 24,409 21,896
Finished products and goods 8 27,012 28,153
9) Trade and other receivables 7 82,345 84,783
Trade receivables 7 68,765 70,184
trade receivables from third parties 7 67,309 68,894
trade receivables from associates 7 1,447 1,281
trade receivables from related parties 7 9 9
Other receivables - accrued income and prepaid expenses 7 13,580 14,599
of which with related parties 75 75
10) Tax receivables 9 15,063 16,809
of which to the Parent Company 7,383 8,719
11) Financial assets 5 0 3,234
Securities 0 0
Other 0 3,234
12) Loans 0 0
13) Financial assets - Derivative instruments 6 0 0
14) Cash and cash equivalents 10 126,212 86,153
Total assets (A+B) 689,176 600,279
43
Consolidated financial statement

LIABILITIES (€/000) Notes 31.12.2015 31.12.2014
A) Total Shareholders' Equity (1+2+3+4+5) 11 298,260 241,291
1) Share capital 11 146,659 147,490
2) Reserves 11 35,618 7,894
3) Profits/(Losses) of previous years 11 75,436 55,050
4) Group profit (loss) for the period/year 11 40,547 30,857
5) Minority interests 11 0 0
B) Non current liabilities (6+7+8+9+10+11+12) 188,807 132,909
6) Financial payables 12 139,918 89,519
7) Financial liabilities - Derivative instruments 6 115 262
8) Tax payables 9 52 37
9) Deferred tax liabilities 13 23,172 21,648
10) Post-employment benefits 14 6,814 7,201
11) Provisions for risks and charges 15 15,187 11,161
12) Other liabilities 16 3,549 3,081
C) Current liabilities (13+14+15+16+17) 202,109 226,079
13) Trade and other payables 16 143,818 130,879
Trade payables 16 101,711 92,167
trade payables to third parties 16 101,468 91,611
trade payables to Parent Company 16 207
trade payables to associates 16 84 76
trade receivables to related parties 16 159 273
Other payables – accrued liabilities and deferred income 16 42,107 38,712
14) Tax payables 9 10,577 10,785
of which to the Parent Company 4,781 23
15) Provisions for risks and charges 15 8,341 8,440
16) Financial liabilities - Derivative instruments 6 6 0
17) Financial payables 12 39,367 75,975
Total liabilities (A+B+C) 689,176 600,279
Consolidated Statement of Financial Position
Consolidated financial statement
44

(€/000) Notes 31.12.2015 31.12.2014
1) Total revenues 17 535,068 464,645
Revenues from sale of products 508,338 441,567
Revenues from services 26,730 23,078
of which non-recurring 99
of which with related parties 5,660 6,053
2) Cost of goods sold 18 286,691 237,170
of which non-recurring 18 241 1,069
of which with related parties 342 316
Gross Profit (1-2) 248,377 227,475
3) Other operating revenues 19 3,504 2,239
of which with related parties 8 7
4) R&D expenses 18 48,441 43,196
of which non-recurring 18 92
of which amortisation, depreciation and write-downs pertaining to acquisitions 105 88
of which with related parties 18 4 9
5) Distribution expenses 18 102,093 89,324
of which non-recurring 18 998 1,119
of which with related parties 133 46
6) General and administrative expenses 18 46,361 46,501
of which non-recurring 18 1,233 1,950
of which amortisation, depreciation and write-downs pertaining to acquisitions 18 5,607 5,405
of which with related parties 926 1,093
7) Other operating expenses 18 2,041 3,785
of which non-recurring 1,579
of which with related parties 18 4
Total operating costs 198,936 182,806
Operating result 52,945 46,908
8) Financial Income 20 37,617 26,831
of which with related parties 16 27
9) Financial expenses 20 39,152 34,585
Net financial income (expenses) (8-9) (1,535) (7,754)
10) Profits from associates 3 174 25
Profit/(Loss) before taxes from the operating assets 51,584 39,179
Income tax 21 11,037 8,322
Profit/(Loss) for the period 40,547 30,857
Basic earnings/(loss) per share (€) 22 0,6969 0,5306
Diluted earnings/(loss) per share (€) 22 0,6969 0,5306
Consolidated Statement of Income
45
Consolidated financial statement

(€/000) Notes 31.12.2015 31.12.2014
Net profit/(loss) for the period 40,547 30,857
Other components of the Statement of Comprehensive Income:
Other components of the Statement of Comprehensive Income which will be restated under profit/(loss) for the year:
Profit/(loss) on Cash Flow Hedges 11 98 90
of which tax effect (43) (34)
Profit/(Loss) due to translation of the accounts of foreign companies 11 19,466 15,431
Profit/(Loss) on exchange rate adjustments for financial assets available for sale 11 291 218
of which tax effect 77 (83)
Reserve for exchange rate adjustment 11 7,862 8,309
of which tax effect (1,941) (3,151)
Total other components of the Statement of Comprehensive Income which will be restated under profit/(loss) for the year 27,717 24,048
Other components of the Statement of Comprehensive Income which will be restated under profit/(loss) for the year:
Actuarial (loss)/gain on defined-benefit plans
of which tax effect 7
Total other components of the Statement of Comprehensive Income which will be restated under profit/(loss) for the year 7 0
Total profit/(loss) of Comprehensive Income Statement 27,724 24,048
Total net profit/(loss) for the period 68,271 54,905
Attributable to:
Parent Company Shareholders 68,271 54,905
Minority interests 0 0
Consolidated Statement of Comprehensive Income
Consolidated financial statement
46

Consolidated Statement of Cash Flow (€/000) Notes 31.12.2015 31.12.2014
Pre-tax profit 51,584 39,179
Depreciation and amortisation of tangible and intangible assets and write-downs 1, 2 18,239 16,917
Change in employee benefits reserve 14 (387) 152
Provision to the write-down reserve 18 34 505
Net financial expenses/(income) including exchange rate differences 20 1,535 7,754
Adjustments to value of financial assets 3 (174) (25)
Cash flow from operations before changes in Working Capital 70,831 64,482
Change in trade receivables (net of provision) 7 1,385 (736)
Change in final inventories 8 (7,061) (8,613)
Change in current assets 7 1,019 923
Change in other medium/long-term assets 7 (208) 23
Change in trade payables 16 9,544 7,455
Change in other current liabilities 16 3,395 2,684
Other medium/long-term liabilities 16 468 433
Change in provisions for risks and charges 15 3,927 5,156
Commercial foreign exchange gains/(losses) 20 (3,479) (2,680)
Foreign exchange effect of Working Capital (782) (583)
Cash flow from operations after changes in Working Capital 79,039 68,544
Change in tax (14,692) (8,104)
Foreign exchange effect of tax 1,954 1,986
Interest paid and bank expenses 20 (4,622) (8,111)
Cash flow generated from operations (A) 61,679 54,315
(Increase)/Decrease in intangible assets excluding exchange rate effect 2 (4,431) (1,474)
(Increase)/Decrease in tangible assets excluding exchange rate effect 1 (17,579) (11,206)
Change in unconsolidated Equity investments 5 (1,144) 188
Changes generated by investment activity (B) (23,154) (12,492)
Change in LT/ST financial receivables 5 (8,234) (20,348)
Change in short-term and medium-/long-term financial debt 12, 6 13,746 (63,537)
Financial foreign exchange gains/(losses) 20 6,566 3,037
Purchase/sale of treasury shares 11 (831) 10,490
Change in reserves and exchange rate effect of financial assets/liabilities, Equity and tangible and intangible assets 968 (4,710)
Dividend payment 11 (10,471) (9,351)
Cash flow generated (absorbed) by financial assets (C) 1,744 (84,419)
Net increase/(decrease) in available cash (A+B+C) 10 40,269 (42,596)
Net cash and cash equivalents at beginning of year (Note 10) 10 85,852 128,448
Net cash and cash equivalents at year end (Note 10) 10 126,121 85,852
47
Consolidated financial statement

Changes in Consolidated Shareholders’ EquityDescription (€/000) Share capital and
capital reserves Reserves of Statement of Comprehensive Income Retained earnings
Total share capital and
capital reserves
Cash-flow hedge
reserve
Translation reserve
Reserve for exchange rate
adjustment
Actuarial gains/(losses)
reserve
Held-for-sale financial
assets reserve
Total Reserves of Statement of Comprehensive
Income
Earnings carried forward
Capitalcontribution
reserve
Legal reserve IAS reserve Total Profit forthe year
Total Group Shareholders’
Equity
01.01.2014 137,000 (280) (12,729) (2,767) (378) 0 (16,154) 23,466 958 4,388 8,683 37,495 26,906 185,247
Allocation of earnings 0 0 26,559 347 26,906 (26,906) 0
Dividends 0 0 (9,351) (9,351) (9,351)
Translation reserve 0 0 0 0
Change in IAS reserve 0 0 0 0
Sale/purchase of treasury shares 10,490 0 0 10,490
Other changes 0 0 0 0
Profit/(Loss) as at 31.12.2014 0 0 0 30,857 30,857
Total other components of the Statement of Comprehensive Income
90 15,431 8,309 218 24,048 24,048
31.12.2014 147,490 (190) 2,702 5,542 (378) 218 7,894 40,674 958 4,735 8,683 55,050 30,857 241,291
Description (€/000) Share capital and capital reserves Reserves of Statement of Comprehensive Income Retained earnings
Total share capital and capital
reserves
Cash-flow hedge
reserve
Translation reserve
Reserve for exchange rate
adjustment
Actuarial gains/(losses)
reserve
Held-for-sale financial
assets reserve
Total Reserves of Statement of Comprehensive
Income
Earnings carried forward
Capitalcontribution
reserve
Legal reserve IAS reserve Total Profit forthe year
Total Group Shareholders’
Equity
01.01.2015 147,490 (190) 2,702 5,542 (378) 218 7,894 40,674 958 4,735 8,683 55,050 30,857 241,291
Allocation of earnings 0 0 29,675 1,182 30,857 (30,857) 0
Dividends 0 0 (10,471) (10,471) (10,471)
Translation reserve 0 0 0 0
Change in IAS reserve 0 0 0 0
Sale/purchase of treasury shares (831) 0 0 (831)
Other changes 0 0 0
Profit/(Loss) as at 31.12.2015 0 0 0 40,547 40,547
Total other components of the Statement of Comprehensive Income
98 19,466 7,862 7 291 27,724 0 0 27,724
31.12.2015 146,659 (92) 22,168 13,404 (371) 509 35,618 59,878 958 5,917 8,683 75,436 40,547 298,260
Consolidated financial statement
48

Description (€/000) Share capital and capital reserves Reserves of Statement of Comprehensive Income Retained earnings
Total share capital and
capital reserves
Cash-flow hedge
reserve
Translation reserve
Reserve for exchange rate
adjustment
Actuarial gains/(losses)
reserve
Held-for-sale financial
assets reserve
Total Reserves of Statement of Comprehensive
Income
Earnings carried forward
Capitalcontribution
reserve
Legal reserve IAS reserve Total Profit forthe year
Total Group Shareholders’
Equity
01.01.2014 137,000 (280) (12,729) (2,767) (378) 0 (16,154) 23,466 958 4,388 8,683 37,495 26,906 185,247
Allocation of earnings 0 0 26,559 347 26,906 (26,906) 0
Dividends 0 0 (9,351) (9,351) (9,351)
Translation reserve 0 0 0 0
Change in IAS reserve 0 0 0 0
Sale/purchase of treasury shares 10,490 0 0 10,490
Other changes 0 0 0 0
Profit/(Loss) as at 31.12.2014 0 0 0 30,857 30,857
Total other components of the Statement of Comprehensive Income
90 15,431 8,309 218 24,048 24,048
31.12.2014 147,490 (190) 2,702 5,542 (378) 218 7,894 40,674 958 4,735 8,683 55,050 30,857 241,291
Description (€/000) Share capital and capital reserves Reserves of Statement of Comprehensive Income Retained earnings
Total share capital and capital
reserves
Cash-flow hedge
reserve
Translation reserve
Reserve for exchange rate
adjustment
Actuarial gains/(losses)
reserve
Held-for-sale financial
assets reserve
Total Reserves of Statement of Comprehensive
Income
Earnings carried forward
Capitalcontribution
reserve
Legal reserve IAS reserve Total Profit forthe year
Total Group Shareholders’
Equity
01.01.2015 147,490 (190) 2,702 5,542 (378) 218 7,894 40,674 958 4,735 8,683 55,050 30,857 241,291
Allocation of earnings 0 0 29,675 1,182 30,857 (30,857) 0
Dividends 0 0 (10,471) (10,471) (10,471)
Translation reserve 0 0 0 0
Change in IAS reserve 0 0 0 0
Sale/purchase of treasury shares (831) 0 0 (831)
Other changes 0 0 0
Profit/(Loss) as at 31.12.2015 0 0 0 40,547 40,547
Total other components of the Statement of Comprehensive Income
98 19,466 7,862 7 291 27,724 0 0 27,724
31.12.2015 146,659 (92) 22,168 13,404 (371) 509 35,618 59,878 958 5,917 8,683 75,436 40,547 298,260
49
Consolidated financial statement

Explanatory notesto the consolidatedfinancial statements

IntroductionThe Datalogic Group produces and sells handheld readers, fixed scanners for the industrial market, mobile computers, fixed scan-ners for the retail market and sensors. The Group is also active in self scanning solutions and products for industrial marking.
Datalogic S.p.A. (hereinafter, “Datalogic”, the “Parent Company” or the “Company”) is a joint-stock company listed on the STAR segment of Borsa Italiana, with its registered office in Italy. The address of the registered office is Via Candini, 2 - Lippo di Calderara (Bologna).
The Company is a subsidiary of Hydra S.p.A., which is also based in Bologna and is controlled by the Volta family.
These consolidated financial statements as at 31 December 2015 include the figures of the Parent Company and its subsidiaries (defined hereinafter as the “Group”) and its minority interests in associates.
The publication of the Financial Statements ended 31 December 2015 of the Datalogic Group was authorised by resolution of the Board of Directors dated 4 March 2016.
Presentation and content of the Consolidated Financial StatementsIn accordance with European Regulation 1606/2002, since 2005 the consolidated financial statements have been prepared in compliance with the international accounting standards (IAS/IFRS) issued by the IASB (International Accounting Standards Board), and endorsed by the European Union, pursuant to European Regulation 1725/2003 and subsequent amendments, with all the interpretations of the International Financial Reporting Interpretations Committee (“IFRIC”), formerly the Standing Interpretations Committee (“SIC”), endorsed by the European Commission at the date of approval of the draft financial statements by the Board of Directors of the Parent Company and contained in the relative EU Regulations published at this date, and in compliance with the provisions of Consob Regulation 11971 of 14 May 1999 and subsequent amendments.
The consolidated financial statements for the year ended 31 December 2015 consist of Statement of Financial Position, Income Statement, Statement of Comprehensive Income, Statement of Changes in Shareholders’ Equity, Cash Flow Statement and Ex-planatory Notes.We specify that, in the Statement of Financial Position, assets and liabilities are classified according to the “current/non-current” criterion, with specific separation of assets and liabilities held for sale.Current assets, which include cash and cash equivalents, are those set to be realised, sold or used during the Company’s normal operational cycle or in the 12 months following the reporting date; current liabilities are those whose extinction is envisaged during the Company’s normal operating cycle or in the 12 months after the reporting date.The Income Statement reflects analysis of costs grouped by function, as this classification was deemed more meaningful for com-prehension of the Group’s business result.The Statement of Comprehensive Income presents the components that determine gain/(loss) for the period and the costs and revenues reported directly under Shareholders’ Equity for transactions other than those set up with Shareholders.
The Cash Flow Statement is presented using the indirect method.
The Statement of Changes in Shareholders’ Equity analytically details the changes occurring in the financial year and in the previous financial year.In preparing the consolidated financial statements, the historic cost principle has been adopted for all assets and liabilities except for some tangible assets in the “Land and buildings” category which were revalued on transition to IFRS, as described later in this document, and some financial assets available for sale (AFS) for which the fair value principle is applied.
Preparation of IFRS-compliant financial statements requires the use of some estimates. Reference should be made to the section describing the main estimates made in this set of consolidated financial statements. The accounting standards were uniformly applied at all Group companies and for all periods presented.
These financial statements are drawn up in thousands of Euro, which is the Group’s “functional” and “presentation” currency as envisaged by IAS 21, unless otherwise indicated.
51
Explanatory notes to the consolidated financial statements

Consolidation standards and policies subsidiariesThe control is obtained when the Group, as defined in IFRS 10, is exposed, or has rights, to variable returns from its involvement with the investee and, at the same time, has the ability to affect those returns through its power over the investee.Specifically, the Group controls an investee if, and only if the Group has:power over the investee, i.e. the investor has existing rights that give it the ability to direct the investee’s relevant activities; exposure, or rights, to variable returns from its involvement with the investee;the ability to use its power over the investee to affect the amount of the investor’s returns.
In general, it is assumed that the majority of votes entails a control. To support this assumption, and when the Group holds less than the majority of votes (or similar rights), the Group considers all relevant facts and circumstances in order to define whether it controls the investees, including: • agreements with holders of other voting rights; • rights resulting from agreements; • voting rights and potential voting rights of the Group.
The Group reconsiders whether it has the control on an investee if the facts and circumstances show that changes occurred in one or more of the three elements used for the definition of control. An investee is consolidated when the Group obtains its control and the consolidation ends when the Group loses control. Assets, liabilities, revenues and costs of the investee, which is acquired or sold during the year, are included in the consolidated financial statements at the date in which the Group obtains the control until the date in which the Group no longer exercises control on the entity.
In order to ensure consistency with the Group accounting policies, when necessary the financial statements of the investees are adequately adjusted. All assets and liabilities, Shareholders’ Equity, revenues, costs and intercompany cash flows related to transactions between Group entities are entirely derecognised under consolidation.Changes in Equity investments in an investee that do not entail the loss of control are recognised in Shareholders’ Equity.If the Group loses control in an investee, all related assets (including goodwill), liabilities, minority interests and other com-ponents in the Shareholders’ Equity must be derecognised, while any possible profit or loss will be recognised in the Income Statement. The Equity interest possibly maintained must be recognised at fair value.Reciprocal payables and receivables and cost and revenue transactions between consolidated companies and the effects of all significant transactions between them have been eliminated.More specifically, profits not yet realised with third parties, stemming from infragroup transactions and those included, as at reporting date, in the measurement of inventories have been eliminated where they exist.Company combinations are accounted for by using the acquisition method. The cost of an acquisition is measured as the sum of the consideration transferred, measured at fair value on the acquisition date and the amount of minority interests in the acquired company. For all business combinations, the Group assesses whether to measure the minority interests in the ac-quired company at fair value or as a proportion of the minority shareholdings in the net identifiable assets of the acquired com-pany. The acquisition costs are written off in the year and recognised under administrative expenses.When the Group acquires a business, it classifies or designates the financial assets acquired or the financial liabilities as-sumed according to the terms of the contract, the economic terms and conditions in the other pertinent conditions as at the acquisition date. This includes the verification of whether an incorporated derivative must be separated from the primary contract. If the business combination is carried out in more than one step, the Equity investment previously held is recalculated at fair value at the acquisition date and any resulting profit or loss is recognised in the Income Statement. Any contingent consideration, to be recognised, is measured by the purchaser at fair value on the acquisition date. The change in fair value of the potential amount stated as asset or liability, as financial instrument under the scope of IAS 39 Financial in-struments: Recognition and Measurement, must be recognised in the Income Statement. Goodwill is initially measured at the cost, which is the surplus of the consideration paid and the amount recognised for the mi-nority interests as compared to the net identifiable assets acquired and the liabilities undertaken by the Group. If the fair value of the acquired net assets exceeds the aggregate amount paid, the Group assesses whether all assets acquired and liabilities undertaken have been correctly identified and then reviews the procedures used to determine the amounts to be recognised at the acquisition date. If the new measurement highlights a fair value of net assets acquired, which is higher than the amount paid, the difference (profit) is recognised in the Income Statement.
Explanatory notes to the consolidated financial statements
52

After initial recognition, goodwill is measured at cost, less any cumulative impairment losses. In impairment testing, goodwill acquired in a business combination is allocated, since the acquisition date, to each Group CGU, which is expected will benefit from synergies of the business combination, regardless of the fact that other assets or liabilities related to the acquired entity are allocated to those CGUs.
ASSOCIATESAssociates are companies in which the Group has significant influence but does not exercise control over operations. Significant influence is presumed to exist when the Group holds 20 to 50 percent of voting rights.Our consolidated financial statements for the year as at 31 December 2015 include our share of the profits and losses of asso-ciates, recognised in Equity, from the date when significant influence over operations began until cessation of the same.Under the Equity Method, the Equity investment in an associate is initially recognised at cost and the carrying value is increased or decreased to recognise the portion of the profits or losses of the investee that are realised after the acquisition. The goodwill concerning the associate is included in the carrying value of the investment and is not subject to amortisation, nor to an indi-vidual impairment test.The Group’s share of associates’ post-acquisition profits or losses is recognised in the Income Statement, whereas its post-ac-quisition share of changes in reserves is recognised in reserves. Cumulative post-acquisition changes are included in the invest-ment’s carrying value.
Unrealised profits relating to transactions between the Group and its associates are eliminated in proportion to the Group’s interests in such associates. Unrealised losses are also eliminated unless the loss is considered to represent impairment of the assets transferred. Accounting standards adopted by associates have been modified when necessary to ensure consistency with the policies adopted by the Group.Upon losing significant influence over an associate, the Group measures and recognises the residual Equity investments at fair value . Any difference between the carrying value of the equity investments on the date that significant influence is lost, as well as the fair value of the residual Equity investments and the consideration received must be recognised in the Income Statement.
Accounting policies and standards appliedThe accounting criteria used to prepare the Datalogic Group’s consolidated financial statements for the year ended 31 December 2015 are described below. The accounting standards described have been consistently applied by all Group entities.
PROPERTY, PLANT AND EQUIPMENT (IAS 16)Owned tangible assets are initially recognised at the cost of contribution, purchase, or in-house construction. The cost comprises all directly attributable costs necessary to make the asset available for use (including, when significant and in the presence of ef-fective obligations, the present value of the estimated costs for decommissioning and removal of the asset and for reinstatement of the location), net of trade discounts and allowances.
Some tangible assets in the “Land and buildings” categories, in line with IAS 16 provisions, were measured at fair value (market value) as at 1 January 2004 (IFRS transition date) and this value was used as the deemed cost. Fair value was calculated based on evaluation expertises performed by independent external consultants. The fair value was determined according to appraisals made by independent external consultants. The cost of buildings is depreciated net of the residual value estimated as the realisation value obtainable via disposal at the end of the building’s useful life.
Costs incurred after purchase are recognised in the asset’s carrying value, or are recognised as a separate asset, only if it is thought likely that the future economic benefits associated with the asset will be enjoyed and the asset’s cost can be reliably measured. Maintenance and repair costs or replacement costs that do not have the above characteristics are recognised in the Income State-ment in the year in which they are borne.
Tangible assets are depreciated on a straight-line basis each year - starting from the time when the asset is available for use, or when it is potentially able to provide the economic benefits associated with it - according to economic/technical rates determined according to assets’ residual possibility of use and taking into account the month when they became available for use in the first year of utilisation.
53
Explanatory notes to the consolidated financial statements

Land is considered to be an asset with an indefinite life and therefore not subject to depreciation.
The depreciation rates applied by the Group are as follows:
Asset category Annual depreciation rates
Property:
Buildings 2% - 3.3%
Land 0%
Plant and equipment:
Automatic operating machines 20% - 14.29%
Furnaces and appurtenances 14%
Generic/specific production plant 20% - 10%
Other assets:
Plant pertaining to buildings 8.33% - 10% - 6.67%
Lightweight constructions 6.67% - 4%
Production equipment & electronic instruments 20% - 10%
Moulds 20%
Electronic office machinery 33% - 20% - 10%
Office furniture and fittings 10% - 6.67% - 5%
Cars 25%
Freight vehicles 14%
Trade show & exhibition equipment 11% - 20%
Improvements to third-party assets Contract duration
If, regardless of the depreciation already posted, enduring impairment of value emerges, the asset is written down; if the reasons for devaluation disappear in later years, the original value is reinstated. The residual value and useful life of assets are renewed at least at each year-end in order to assess any significant changes in value.
Gains and losses on disposals are calculated by comparing the selling price with net carrying value. The amount thus determined is recognised in the Income Statement.
ASSETS HELD UNDER FINANCE LEASE CONTRACTS (IAS 17)The fixed assets under financial leases are those fixed assets for which the Group has assumed all the risks and benefits connect-ed with the ownership of the asset. Such assets are measured at the lower of fair value and present value of lease instalments at the time of contract signature, net of cumulative depreciation and write-downs. Financial lease instalments are recorded as described in IAS 17; specifically, each instalment is divided into principal and interest. The sum of the portions of principal payable at the reporting date is recorded as a financial liability; the portions of interest are recorded in the Income Statement each year until full repayment of the liability.
INTANGIBLE ASSETS (IAS 38)Intangible assets are recognised under assets in the Statement of Financial Position when it is likely that use of the asset will generate future economic benefits and when the asset’s costs can be reliably calculated. They are initially recognised at the value of contribution or at acquisition or production cost, inclusive of any ancillary costs.Gains and losses on disposals are calculated by comparing the selling price with net carrying value. The amount thus determined is recognised in the Income Statement.
GoodwillGoodwill is initially valued at the cost which is the difference between the consideration paid and the amount recognised for the minority interests as compared to the net identifiable assets acquired and the liabilities assumed by the Group. If the consideration is less than the fair value of the net assets of the acquired subsidiary, the difference is recognised in the Income Statement. It is an intangible asset with an indefinite life.
Explanatory notes to the consolidated financial statements
54

After initial recognition, goodwill is measured at cost less any cumulative impairment losses.
Goodwill is allocated to the cash generating units (CGUs) and is tested for impairment annually, or more frequently if events or changes in circumstances suggest possible loss of value, pursuant to IAS 36 – “Impairment of Assets”. If the goodwill has been allocated to a cash generating unit (CGU) and the entity disposes of part of this unit, the goodwill associ-ated with the sold unit must be included in the carrying value of the asset when the profit or loss on disposal is determined. The goodwill associated with the disposed asset must be determined on the basis of the values relating to the disposed asset and the part of the CGU that was maintained.
Research and Development expensesAs required by IAS 38, research costs are entered in the Income Statement at the time when the costs are incurred.Development costs for projects concerning significantly innovative products or processes are capitalised only if it is possible to demonstrate:• the technical possibility of completing the intangible asset in such a way as to make it available for use or sale;• the intention of completing the intangible assets for use or sale;• the ability to use or sell the intangible asset;• the ability to reliably measure the cost attributable to the intangible asset during its development;• the availability of adequate technical, financial or other resources to complete the intangible asset’s development and for its
use or sale;• how the intangible asset will generate probable future economic benefits.
In the absence of any one of the above requirements, the costs in question are fully recognised in the Income Statement at the time when they are borne.Development costs have a finite useful life and are capitalised and amortised on a straight-line basis from the start of the product’s commercial production for a period equal to the useful life of the products to which they relate, estimated to be five years.
Other intangible assetsOther intangible assets consist of:• software acquired under licence, valued at purchase cost; • specific intangible assets purchased as part of acquisitions that have been identified and recognised at fair value at acquisition
date according to the purchase method of accounting mentioned above;• a licence agreement arranged during the course of the fourth quarter 2010 and then renewed upon expiration.
These assets are considered to be intangible assets of finite duration and are amortised over their presumable useful life (see the next table).
AmortisationIntangible assets of finite duration are systematically amortised according to their projected future usefulness, so that the net value at the reporting date corresponds to their residual usefulness or to the amount recoverable according to corporate busi-ness plans. Amortisation starts when the asset is available for use.
55
Explanatory notes to the consolidated financial statements

The useful life for each category is detailed below:
Description Useful Life - years
Goodwill Indefinite useful life
Development costs 5
Other intangible assets:
- Software licences (other than SAP licences) 3/5
- Patents (formerly PSC) 20
- Customers (formerly PSC) 10
- Trademarks 3/10
- “Service agreement” (formerly PSC) 4
- Know-how (Laservall) 7
- Commercial structure (Laservall) 10
- Commercial structure (Informatics) 10
- Patents (Evolution Robotics Retail Inc.) 10
- “Trade Secret” (Evolution Robotics Retail Inc.) 10
- Patents (former Accu Sort inc) 10
- “Trade Secret” (former Accu Sort inc) 10
- SAP licences 10
- User licences Contract duration
Intangible assets with an indefinite useful life are not amortised but tested to identify any impairment of value annually, or more frequently when there is evidence that the asset may have suffered impairment.
IMPAIRMENT (IAS 36)Tangible and intangible assets are tested for impairment in the presence of specific indicators of loss of value, and at least annually for intangible assets with an indefinite life and goodwill.The aim of this impairment test is to ensure that tangible and intangible assets are not carried at a value exceeding their recover-able value, consisting of the higher between their fair value and selling costs and their value in use.Value in use is calculated based on the future cash flows that are expected to originate from the asset or CGU (Cash Generating Unit) to which the asset belongs. Cash flows are discounted to present value using a discount rate reflecting the market’s current estimate of the time value of money and of the risks specific to the asset or CGU to which presumable realisation value refers.Given their autonomous ability to generate cash flows, the Group’s CGUs are defined as being the individual consolidated compa-nies.
If the recoverable value of the asset or CGU, to which it belongs, is less than the net carrying value, the asset in question is written down to reflect its impairment, with recognition of the latter in the Income Statement for the period.
Impairment losses relating to CGUs are allocated firstly to goodwill and, for the remaining amount, to the other assets on a pro-portional basis.
If the reasons causing it cease to exist, impairment is reversed within the limits of the amount of what would have been the book value, net of amortisation of the historical cost, if no impairment had been recognised.Any reinstatements of value are recognised in the Income Statement. In the case of goodwill, impairment value is never reversed.
Explanatory notes to the consolidated financial statements
56
FINANCIAL ASSETS (IAS 39)In accordance with IAS 39, the Group classifies its financial assets in the following categories:
Financial assets at fair value with contra entry in the Income Statement: these are financial assets acquired primarily with the intention of making a profit from short-term price fluctuations and designated as such from the outset; they are recognised at fair value and any changes during the period are recognised in the Income Statement. Within the Group this category includes securi-ties classified among current assets.
Loans and receivables: they are financial assets other than derivatives with a fixed or calculable payment flow and which are not listed in an active market. They are recognised according to the amortised cost criterion using the effective interest rate method. They are classified as “current assets”, apart from those due after 12 months, which are classified as non-current assets. Within the Group this category includes trade receivables, other receivables and cash.
Available for sale financial assets: these are financial assets other than derivatives, which are not classified in other categories; they are valued at fair value and related changes are entered in an Equity reserve. They are classified under non-current assets, unless they are intended to be sold within 12 months. Within the Group this category includes investments in other companies and securities.The fair value of listed securities is based on current market prices. If a financial asset’s market is not active, the Group establishes fair value by using recent transactions taking place close to balance sheet date or by referring to other instruments of substantially the same kind or using discounted cash-flow (DCF) models. In some circumstances, the Group does not have sufficient information to calculate the fair value of these financial assets. In this case, they are maintained at cost. A financial asset (or, where applicable, the portion of a financial asset or part of a group of similar financial assets) is removed from the financial statements when:• the rights to receive the cash flows from the asset have been extinguished;• the Group has transferred the right to receive cash flows from the asset or has assumed the contractual obligation to pay them
to a third party in their entirety and without delay and: (a) has transferred essentially all the risks and benefits of ownership of the financial asset or (b) has not transferred or essentially held all the risks and benefits of the asset, but has transferred control of the asset.
Financial hedging instruments: the Group holds derivative financial instruments to hedge exposure to foreign exchange or in-terest rate risk. In accordance with the rules of the Risk Policy approved by the Board of Directors, the Group does not have any speculative financial instruments. Consistently with the approach established by IAS 39, hedging instruments are accounted for using the hedge-accounting approach if all the following conditions are met:• at the inception of a hedge, there is formal documentation of the hedging relationship, of the entity’s risk management
objectives, and of the strategy for undertaking the hedge;• the hedge is expected to be highly effective in offsetting changes in fair value (fair value hedge) or in cash flows (Cash Flow
Hedge) attributable to the risk hedged;• for Cash Flow Hedges, an expected transaction that is hedged must be highly probable and feature exposure to changes in cash
flows that could ultimately affect profit or loss;• the hedge’s effectiveness can be reliably assessed, i.e. the fair value or cash values of the item hedged and the hedging
instrument’s fair value can be reliably measured;• the hedge has been assessed on the basis of a recurrent criterion and is considered highly effective throughout the derivative’s
life.
The basis of measurement of hedging instruments is their fair value on the designated date.The fair value of currency derivatives is calculated in relation to their intrinsic value and their time value.
At each annual reporting date, hedging instruments are tested for effectiveness to see whether the hedge qualifies as an effec-tive hedge and is therefore eligible for hedge accounting.
57
Explanatory notes to the consolidated financial statements

The fair value of hedging instruments is set out in Note 6, while movements in the Cash Flow Hedge reserve are shown in Note 11.
When financial instruments qualify for hedge accounting, the following accounting treatment is applied:
Fair value hedge – If a financial derivative is designated as a hedge for exposure to the changes in fair value of an asset or lia-bility attributable to a particular risk that may affect the Income Statement, profit, or loss, deriving from subsequent valuations of the hedge’s fair value , is recognised in the Income Statement. The profit or loss on the hedged item, attributable to the risk covered, changes the carrying value of that item and is recognised in the Income Statement.
Cash flow hedge – If a financial derivative is designated as a hedge for exposure to the variability of future cash flows of an asset or liability, or of an expected, highly probable transaction that may affect profit and loss, the changes in the hedge’s fair value are recognised in Equity for the effective portion of the hedge (intrinsic value), while the part relating to time value and any ineffective portion (over-hedging) is recognised in the Income Statement.If a hedge or hedging relationship has ended but the hedged transaction has not yet taken place, cumulative profits and losses recognised thus far in Equity are recognised in the Income Statement when the related transaction takes place. If the hedged transaction is no longer considered probable, the still unrealised profits and losses suspended in Equity are immediately rec-ognised in the Income Statement. If hedge accounting cannot be applied, gains and losses arising from fair-value measurement of the financial derivative are immediately recognised in the Income Statement.
INVENTORIES (IAS 2)Inventories are measured at the lower of cost and net realisable value. Cost is calculated using the weighted average cost method. Finished product, semi-finished product and raw material costs include the cost of raw materials, direct labour, and other produc-tion costs that are directly and indirectly allocable (in this case on the basis of normal production capacity). Net realisable value is the estimated selling price in the normal course of business, less any selling costs.
TRADE RECEIVABLES (IAS 32, 39)Trade receivables are amounts due from customers following the sale of products and services. Receivables are initially recognised at fair value and subsequently at amortised cost – using the effective interest rate method – net of related impairment losses. Short term payables are not discounted, since the effect of discounting the cash flows is not significant.
The estimated impairment of receivables is recognised when it becomes evident that the past-due receivable cannot be recovered, due to financial difficulties of the customer that might lead to its bankruptcy or financial restructuring.
CASH AND CASH EQUIVALENTS (IAS 32 AND 39)Cash and cash equivalents comprise cash on hand, bank and post office deposits, and short-term financial investments (maturity of three months or less after purchase date) that are highly liquid, readily convertible into cash and are subject to insignificant risk of changes in value.Current-account overdrafts and advances on invoices subject to collection are deducted from cash only for the purposes of the Cash Flow Statement.
Explanatory notes to the consolidated financial statements
58
SHAREHOLDERS’ EQUITYShare capital consists of the ordinary shares outstanding, which are posted at par value.Costs relating to the issue of new shares or options are classified in Equity (net of associated tax benefit relating to them) as a deduction from the proceeds of the issuance of such instruments.In the case of buyback of treasury shares, the price paid, inclusive of any directly attributable accessory costs, is deducted from the Group’s Shareholders’ Equity until such shares are cancelled, re-issued, or sold, as required by IAS 32. When treasury shares are resold or re-issued, the proceeds, net of any directly attributable accessory costs and related tax effect, are posted as Group Shareholders’ Equity.Consequently, no profit or loss is entered in the Consolidated Income Statement at the time of purchase, sale or cancellation of treasury shares.
INTEREST-BEARING FINANCIAL LIABILITIES (IAS 32 AND 39)Interest-bearing financial liabilities are initially recorded at fair value , net of ancillary costs. After initial recognition, interesting-bearing financial liabilities are measured at amortised cost using the effective interest rate method.
A financial obligation is written off when the obligation underlying the liability has been extinguished or annulled or fulfilled.If an existing financial liability is replaced by another one from the same lender, under conditions that are essentially different, or if the terms and conditions of an existing liability are essentially amended, this change or amendment will be treated as a reversal of the original liability or the recognition of a new liability, with recognition in income of any differences involving the carrying values.
LIABILITIES FOR EMPLOYEE BENEFITS (IAS 19)Post-employment benefits are calculated based on programmes that, depending on their characteristics, are either “defined-con-tribution programmes” or “defined-benefit programmes”.
Employee benefits substantially consist of accrued provision for severance indemnities of the Group’s Italian companies and of retirement provisions.
Italian Law no. 296 of 27 December 2006 (“2007 National Budget Law”) and subsequent decrees and regulations enacted during 2007 introduced – as part of overall reform of the Italian pension system – significant changes regarding the ultimate use of the portions of severance-indemnity provision accruing.
Until 31 December 2006, severance indemnity provision came within the scope of post-employment defined-benefit plans and was measured in accordance with IAS 19, by independent actuaries, using the projected unit credit method.Actuarial gains and losses as at 1 January 2004 – the date of transition to IFRSs – were recognised in specific Equity reserved. Actuarial gains and losses after that date are recognised in the Income Statement on an accrual accounting basis, i.e. not using the “corridor” method envisaged by IAS 19. Following the reform of supplemental pensions, employees can allocate the new severance indemnity provision accruing to sup-plemental pension systems, or opt to keep it in the company (in the case of companies with less than 50 employees) or to transfer them to the INPS – the state pension and welfare agency (in the case of companies with more than 50 employees).
Based on these rules, and also basing itself on the generally accepted interpretation, the Group decided that:• for the portion of severance indemnities accruing up to 31 December 2006, the provision in question constituted a defined-ben-
efit plan, to be valued according to the actuarial rules, but no longer including the component relating to future salary increases. The difference resulting from the new calculation in relation to the previous one was treated as curtailment as defined by IAS 19.109 and consequently entered in the Income Statement for the year ended 31 December 2007;
• subsequent portions of severance indemnities accruing, both in the case of opting for supplemental pension planning and in the case of allocation to the central treasury fund c/o the INPS, come within the scope of defined-contribution plans, thus excluding – in calculating the cost for the year – components relating to actuarial estimates.
59
Explanatory notes to the consolidated financial statements

PROVISIONS FOR RISKS AND CHARGES (IAS 37)Provisions for risks and charges are set aside to cover liabilities whose amount or due date are uncertain and that must be rec-ognised on the statement of financial position when the following conditions are satisfied at the same time:• the entity has a present obligation (legal or constructive), i.e. under way as at the reporting date, arising from a past event;• it is probable that economic resources will have to be used to fulfil the obligation;• the amount needed to fulfil the obligation can be reliably estimated.• risks, for which materialisation of a liability is only contingent, are disclosed in the notes to accounts, in the section commenting
on provisions, without provision being made.
In the case of events that are only remote, i.e. events that have very little likelihood of occurrence, no provision made and no additional or supplementary disclosure is provided.
Provisions are recognised at the value representing the best estimate of the amount the entity would pay to settle the obli-gation, or to transfer it to third parties, at the reporting date. If the time value of money is material, provisions are calculated by discounting expected future cash flows at a pre-tax discount rate reflecting the market’s current evaluation of the cost of money over time.When discounting to present value is performed, the increase in the provision due to the passage of time is recognised as fi-nance expense.
The Group established restructuring provisions if there exists an implicit restructuring obligation and a formal plan for the restructuring that created in interested third parties the reasonable expectation that the company will carry out the re-structuring or because it has begun its realisation or because it has already communicated its main aspects to interested third parties.
INCOME TAXES (IAS 12)Income taxes include current and deferred taxes. Income taxes are generally recognised in the Income Statement, except when they relate to items entered directly in Equity, in which case the tax effect is recognised directly in Equity.Current income taxes are the taxes that are expected to be paid, calculated by applying to taxable income the tax rate in force at the reporting date and adjustments to taxes related to prior periods.
Deferred taxes are calculated using the liability method applied to temporary differences between the amount of assets and liabilities in the consolidated financial statements and the corresponding amounts recognised for tax purposes, except as follows:• deferred tax liabilities derive from the initial recognition of goodwill or an asset or liability in a transaction that is not a business
combination and, when the transaction itself occurs, does not affect the balance sheet profits or the profits or losses calculated for tax purposes;
• the reversal of taxable temporary differences associated with Equity investments in subsidiaries, associates or joint ventures, may be controlled and will probably not occur in the foreseeable future.
Deferred tax assets are recognised for all deductible temporary differences and tax credits and losses and can be brought forward, to the extent that the existence of adequate future taxable profits will exist against which the usage of the deductible temporary differences and the tax credits and losses brought forward can be used, except in cases where:the deferred tax assets connected to the deductible temporary differences arise from initial recognition of an asset or liability in a transaction that is not a business combination and, at the time of the transaction itself, does not affect the balance sheet result or the profit or loss for tax purposes;there are taxable temporary differences associated with Equity investments in subsidiaries, associates and joint ventures and deferred tax assets are recognised only to the extent that the deductible temporary differences will be reversed in the foreseeable future and that there are adequate taxable profits against which the temporary differences can be used.
Deferred taxes are calculated at the tax rate expected to be in force at the time when the asset is sold or the liability is redeemed.
Deferred tax assets are recognised only if it is probable that sufficient taxable income will be generated in subsequent years to realise them.
Explanatory notes to the consolidated financial statements
60

The Parent Company Datalogic S.p.A. and numerous Italian subsidiaries fall within the scope of the “domestic tax consolidation” of Hydra S.p.A.. This permits the transfer of total net income or the tax loss of individual participant companies to the Parent Compa-ny, which calculates a single taxable income for the Group or a single tax loss carried forward, as the algebraic sum of the income and/or losses, and therefore files a single tax liability or credit with the Tax Authorities.
TRADE AND OTHER PAYABLES (IAS 32 AND 39)Trade and other payables are measured at cost, which represents their discharge value.Short-term payables are not discounted, since the effect of discounting the cash flows is not significant.
REVENUE RECOGNITION (IAS 18)Revenues include the fair value of the amount collected or collectable from the sale of goods or rendering of services within the scope of the Company’s characteristic business activity. Revenues are disclosed net of VAT, returns, discounts and reductions and after eliminating Group intercompany sales.
Sale of goodsRevenues from the sale of goods are recognised only when all the following conditions are met:• most of the risks and rewards of ownership of the goods have been transferred to the buyer;• effective control over the goods sold and continuing managerial involvement to the degree usually associated with ownership
have ceased;• the amount of revenues can be reliably measured;• it is probable that the economic benefits associated with the transaction will flow to the entity;• the costs incurred or to be incurred in respect of the transaction can be reliably measured.
Rendering of servicesRevenues arising from a transaction for the rendering of services is recognised only when the results of the transaction can be reliably estimated, based on the stage of completion of the transaction at the reporting date. The results of a transaction can be reliably measured when all the following conditions are met:• the amount of revenues can be reliably measured;• it is probable that the economic benefits of the transaction will flow to the entity;• the stage of completion at the reporting date can be reliably measured; • the costs incurred, or to be incurred, to complete the transaction can be reliably measured.
Revenues relating to dividends, interest and royalties are respectively recognised as follows:• dividends, when the right is established to receive dividend payment (with a receivable recognised in the statement of financial
position when distribution is resolved);• interest, with application of the effective interest rate method (IAS 39);• royalties, on an accrual basis in accordance with the underlying contractual agreement.
GOVERNMENT GRANTS (IAS 20)Government grants are recognised - regardless of the existence of a formal grant resolution - when there is reasonable certainty that the company will comply with any conditions attached to the grant and therefore that the grant will be received.
Government grants receivable as compensation for costs already incurred or to provide immediate financial support to the recipi-ent company with no future related costs, are recognised as income in the period in which they become receivable.
RENTAL AND OPERATING LEASE COSTS (IAS 17)Lease contracts in which the lessor substantially preserves all the risks and rewards of ownership are classified as operating leases and related fees are charged to the Income Statement on a straight-line basis according to the contract’s duration.
DIVIDENDS DISTRIBUTED (IAS 1 AND 10)Dividends are recognised when shareholders have the right to receive payment. This normally corresponds to the date of the an-nual General Shareholder Meeting that approves dividend distribution.The dividends distributable to Group Shareholders are recognised as an Equity movement in the year when they are approved by the Shareholders’ Meeting.
61
Explanatory notes to the consolidated financial statements

EARNINGS PER SHARE - EPS (IAS 33)
BasicBasic EPS is calculated by dividing the Group’s profit by the weighted average number of ordinary shares outstanding during the year, excluding treasury shares.
DilutedDiluted EPS is calculated by dividing the Group’s profit by the weighted average number of ordinary shares outstanding during the year, excluding treasury shares. For the purposes of calculation of diluted EPS, the weighted average number of outstanding shares is determined assuming translation of all potential shares with a dilutive effect, and the Group’s net profit is adjusted for the post-tax effects of translation.
TREATMENT OF FOREIGN CURRENCY ITEMS (IAS 21)
Functional presentation currencyThe items shown in the financial statements of each Group entity are shown in the currency of the economic environment in which the entity operates, i.e. in its functional currency. The consolidated financial statements are presented in Euro, the Euro being the Parent Company’s functional presentation currency.
Transactions and balancesForeign currency transactions are initially converted to Euro at the exchange rate existing on the transaction date.At the reporting date, foreign-currency monetary assets and liabilities are converted at the exchange rate in force on that date. The exchange differences are recognised in the Income Statement.Foreign-currency non-monetary items measured at cost are converted using the exchange rate in force on the transaction date.Non-monetary items recognised at fair value are converted using the exchange rate in force when carrying value is calculated.Foreign exchange gains and losses arising from the collection of foreign currency receivables or payment of foreign currency pay-ables are recognised in the Income Statement.
Translation of foreign currency financial statementsThe assets and liabilities of Group companies with functional currencies other than the Euro are calculated as follows:• assets and liabilities are converted using the exchange rate in force on balance sheet date;• costs and revenues are converted using the period’s average exchange date.
The exchange differences deriving from the conversion were recognised in the Statement of Comprehensive Income. In the event of disposal of a foreign Equity investment, cumulative foreign exchange differences recognised in the Equity reserve are recycled to the Income Statement.Goodwill and fair value adjustment of assets and liabilities acquired as part of a foreign business combination are considered as assets and liabilities converted into euro at the exchange rate in force on balance sheet date.
Explanatory notes to the consolidated financial statements
62

The exchange rates recorded by the Italian Foreign Exchange Bureau and used for translation into Euro of the foreign compa-nies’ financial statements are as follows:
Currency (ISO Code) Quantity of currency/1 Euro
2015Final exchange rate
2015Average exchange rate
2014Final exchange rate
2014Average exchange rate
US Dollar (USD) 1.0887 1.1095 1.2141 1.3285
British Pound Sterling (GBP) 0.7340 0.7258 0.7789 0.8061
Swedish Krona (SEK) 9.1895 9.3535 9.3930 9.0985
Singapore Dollar (SGD) 1.5417 1.5255 1.6058 1.6823
Japanese Yen (JPY) 131.0700 134.3140 145.2300 140.3061
Australian Dollar (AUD) 1.4897 1.4777 1.4829 1.4719
Hong Kong Dollar (HKD) 8.4376 8.6014 9.4170 10.3025
Chinese Renminbi (CNY) 7.0608 6.9733 7.5358 8.1857
Real (BRL) 4.3117 3.7004 3.2207 3.1211
Mexican Pesos (MXN) 18.9145 17.6157 17.8679 17.6550
Hungarian Forint (HUF) 315.9800 309.9956 315.5400 308.7061
SEGMENT REPORTING (IFRS 8)Operating segments are identified based on the internal statements used by senior management in order to allocate resources and evaluate results (internal reporting for performance analysis).
ADOPTION OF THE PRINCIPLE OF CONTINUITY OF VALUES FOR THE ACCOUNTING OF BUSINESS COMBINATIONS UNDER COMMON CONTROL (IAS 8)Business combinations under common control are excluded from the application field of IFRS 3. In the absence of a refer-ence to a specific IFRS standard or interpretation that specifically applies to a transaction, it is worth recalling that IAS 1.13 requires, in general terms, that the financial statements give a reliable and relevant disclosure of the effects of transac-tions, other events and conditions in compliance with definitions and reporting criteria provided for by the IFRS Framework for assets, liabilities, income and expenses and that IAS 1.15 sets out that companies, in compliance with the hierarchy set out by IAS 8, shall select the accounting criteria suited to achieve the general target of a reliable and relevant disclosure. Given the specificity of these transactions and the fact that IFRS Standards do not consider them specifically, the Compa-ny’s management deemed that the most suited accounting principle should refer to the general policies set forth by IAS 8.As clearly shown in IAS 8.11, the IAS/IFRS criteria may be defined as a “closed” system. Therefore, the solution to the issue of transactions under common control shall be found at first instance within the IFRS standards. A derogation related, for example, to a system of national standards or segment accounting treatments might therefore be inappropriate. In particular, IAS 8.10 standard sets out that, in the absence of an IFRS standard or interpretation that specifically applies to a transaction, other event or condition, management must use its judgement in developing and applying an accounting policy that results in information that is:(a) relevant as to the economic decisions by users;(b) reliable, so that the financial statements:
(I) give a true vision of the entity’s financial position, financial performance and cash flows;(II) reflect the economic substance of transactions, other events and conditions, and not merely the legal form;(III) are neutral, i.e. without prejudices;(IV) are prudent;(V) relate to all relevant issues.
In making that judgement, management must refer to, and consider the applicability of, the following sources in descending order:(a) the requirements and guidance in standards and interpretations dealing with similar or related issues;(b) the definitions, recognition criteria and measurement concepts for assets, liabilities, income and expenses in the Framework.
In expressing the aforementioned judgement, management may also consider the most recent pronouncements of other stan-dard-setting bodies that use a similar conceptual framework to develop accounting standards, other accounting literature and
63
Explanatory notes to the consolidated financial statements

accepted sector practices, to the extent that these do not conflict with the above-mentioned sources. In finding an accounting policy within the conceptual framework and meeting the criteria set out by IAS 8.10, the key element is represented by the fact that the accounting policy selected to disclose transactions “under common control” must reflect their economic substance, in-dependently from their juridical form. The presence or absence of “economic substance”, therefore, seems to be the key element for the selection of an accounting policy. As shown also in the Assirevi OPI 1 document on the “Accounting treatment of ‘business combinations of entities under com-mon control’”, the economic substance must be a generation of added value for the entirety of the parties involved (such as higher income, cost-saving, realisation of synergies) which results in significant changes in cash flows, before and after the transaction of transferred assets. The application of the value continuity principle results in the disclosure, in the statement of financial position, of amounts equal to those that would have been disclosed if the companies under business combination had always been combined together. Net assets of the acquired entity and the acquiring entity have therefore been measured at the carrying values which were disclosed in the related accounts before the transaction in question.
LONG-TERM CONSTRUCTION CONTRACTS (IAS 11)A construction contract, as defined by IAS 11 (“Long-term construction contracts”), is a contract specifically negotiated for the construction of an asset or a group of strictly linked or interrelated assets as regards their design, technology and function or their final use. The costs of a construction contract are recognised in the year in which they are borne. Revenues are recognised in proportion to the stage of completion of this contract at balance-sheet date, when the result can be estimated reliably. When the outcome of a contract cannot be estimated reliably, revenues should be recognised only to the extent that contract costs incurred are expected to be recoverable. When total contract costs are likely to exceed the total contract revenues, the total expected loss should be recognised immediately as an expense.The contract revenues are recognised in proportion to the stage of completion of contract activity, based on the cost-to-cost method, which provides for the proportion between contract costs incurred for the works performed till the reference date and the total expected contract costs.
Disclosure of contract works in the Statement of Financial Position is as follows:• the amount due from customers for contract works should be shown as an asset, under item trade receivables and other short-
term assets, when incurred costs, added with margins recognised (less losses), exceed the advance payments received;• the amount due to customers for contract work should be shown as a liability, under item trade payables and other short-term
liabilities when advance payments received exceed costs incurred added with margins recognised (less losses);
Amendments, new standards and interpretationsACCOUNTING STANDARDS, AMENDMENTS AND INTERPRETATIONS APPLIED AS OF 1 JANUARY 2015 The accounting standards adopted for preparation of the consolidated financial statements conform to those used for the preparation of the consolidated financial statements for the period ended 31 December 2014, except for the adoption on 1 January 2015 of the new standards, amendments and interpretations.
The Group adopted some accounting standards and amendments that are applied for annual periods beginning on or after 1 January 2015. The nature and effect of these changes are described hereunder, pursuant to requirements set forth in IAS 8. However, the above had no impact on the Group’s consolidated financial statements. The nature and impact of any new princi-ple/amendment are specified hereunder:
• IFRS 2 – Share-based PaymentsThis improvement is applied prospectively and clarifies various issues connected with the definition of conditions, re-lated to the achievement of results or services rendered, which are considered as vesting conditions. Clarifications are consistent with the modalities with which the Group has identified, in the previous periods, the conditions related to the achievement of results or services rendered and that are considered as vesting conditions. Moreover, the Group granted no share-based bonuses; therefore, these improvements had no effect on the Group’s financial statements or accounting criteria.
Within the annual project of improvement 2010-2012, IASB issued the following amendments to the accounting standards already effective since 1 July 2014 and that had no significant impact on the Group.
Explanatory notes to the consolidated financial statements
64

• IFRS 8 – Operating SegmentsThe amendment is applicable retrospectively and clarifies the following:an entity is required to disclose measurements made by the management in applying the aggregation criteria envisaged in paragraph 12 of IFRS 8, including a brief description of the operating segments which were aggregated, as well as the economic characteristics (e.g. sales or gross profit) used to determine whether the segments are “similar”. The reconciliation between segment-related assets and total assets must be disclosed only if the reconciliation is submitted to the operating chief decision maker, as required for segment-related liabilities.
• IAS 16 – Property, Plant and Equipment and IAS 38 Intangible Assets
The amendment is applied retrospectively and clarifies that, in IAS 16 and IAS 38, an asset can be revalued based on observ-able data both adjusting the gross carrying value of the asset to the market value, and determining the market value of the carrying value and adjusting the gross carrying value on a pro rata basis so that the resulting carrying value is equal to the market value. Moreover, accumulated amortisation represents the difference between gross value and carrying value of an asset. This amendment had no impact on the revaluation adjustments accounted for by the Group in the current financial year.
• IAS 24 – Related Party DisclosuresThe amendment is applied retrospectively and clarifies that a management entity (an entity which supplies services related to managers with strategic responsibilities) is a related party, subject to disclosure on related parties. Moreover, an entity which uses a management entity should disclose the cost borne for the management services. Within the annual plan of IFRS improvements - 2011-2013, IASB issued some amendments to some accounting standards, which were already effective on 1 July 2014 and that had no significant impact on the Group.
• IFRS 13 – Measurement at fair value The amendment is applicable prospectively and clarifies that the portfolio exception envisaged by IFRS 13 can be applied not only to financial assets and liabilities, but also to other contracts within the scope of IAS 39. The Group does not apply the portfolio exception as envisaged by IFRS 13.
The Group has not provided for an early adoption of any standard, interpretation or improvement that has been issued but is not yet effective.
Standards issued which are not yet in forceFollowing are the standards which, on the date that the Group consolidated financial statements were prepared, had already been issued but were not yet in force.
• IFRS 9 – Financial InstrumentsIn July 2014, IASB issued the final version of IFRS 9 Financial Instruments, which reflects all the project steps related to financial instruments and supersedes IAS 39 “Financial Instruments: Recognition and Measurement”, as well as all previ-ous versions of IFRS 9. The standard introduces new requirements for the classification, measurement, impairment and hedge accounting. IFRS 9 is effective to annual periods beginning on or after 1 January 2018. Early application is permit-ted. The standard shall be applied retrospectively, although the supply of comparative information is not mandatory. The early application of previous versions of IFRS 9 (2009, 2010 and 2013) is permitted if the first-time adoption is before 1 February 2015.
• IFRS 15 – Revenue from Contracts with Customers The IFRS standard was issued in May 2014 and provides a five-step new model to be applied to all contracts with customers. According to IFRS 15, revenue should be recognised for an amount corresponding to the right in payment the entity believes to have against the sale of goods or services to customers. This standard envisages a more structured approach in recog-nising and measuring revenue. The new principle is applicable to all entities and will replace all current requirements included in IFRS on recognition of rev-enues. The standard is effective for annual periods beginning on or after 1 January 2017, with fully retrospective or modified application. Early application is permitted. The Group is currently evaluating the impact of IFRS 15 and is taking account of
65
Explanatory notes to the consolidated financial statements

clarifications issued by IASB in the exposure draft issued in July 2015. The Group will evaluate any further development, while expecting to apply the new standard at the mandatory effective date.
• Amendments to IFRS 11 – Joint Arrangements: Accounting for Acquisitions of Interests The amendments to IFRS 11 envisage that a joint operator, who reports the acquisition of an interest in a joint control agreement in which the activity of the joint operation constitutes a business, should apply the principles as defined in IFRS 3 on the basis of the business combinations guidance. The amendments clarify that, in the event a joint control is main-tained, the interest previously held in a joint-control agreement shall not be re-measured upon the acquisition of another interest in the same joint control agreement. Moreover, for clarification purposes, the following was excluded from the scope of the IFRS 11. Amendments are not applicable when the parties in a joint control, including the entity that prepares the financial statements, are subject to the mutual control of the same ultimate controlling entity. Amendments are applicable to both the acquisition of the initial interest in a joint-control agreement, and the acquisition of any further interest in the same joint control agreement. Amendments must be applied prospectively to annual peri-ods beginning on or after 1 January 2016. Early application is permitted. No impact resulting from the application of these amendments is expected on the Group.
• Amendments to IAS 16 and IAS 38: Clarification of Acceptable Methods of Depreciation and Amortisation These amendments clarify the principle, included in IAS 16 and IAS 38, that revenues reflect a model of economic benefits generated by the management of a business (in which the asset is embodied), rather than the consumption of the economic benefits when an asset is used. As a result, a method based on revenues cannot be used for depreciation of real estate properties, plant and machinery and could be used only in very restricted circumstances when amortising intangible assets. Amendments must be applied prospectively to annual periods beginning on or after 1 January 2016. Early application is permitted. No impact on the Group is expected while applying these amendments, given that the Group does not use reve-nue-based methods for the amortisation/depreciation of non-current assets.
• Amendments to IAS 27: Equity Method in Separate Financial Statements The amendments will reinstate the Equity Method as an accounting option for Equity investments in subsidiaries, joint ventures and associates in an entity’s separate financial statements. Entities that are already applying the IFRS standards and elect to modify the accounting principles by adopting the Equity Method to their separate financial statements should apply the amendment retrospectively. In the event of fist-time adoption of IFRSs, the entity that elects to adopt the Equity Methods in the separate financial statements should apply this standard at the transition date to IFRS. Amendments are effective for annual periods beginning on or after 1 January 2016. Early application is permitted. No impact on the Group’s financial statements is expected for the application of these amendments.
• Amendments to IAS 10 and IAS 28: Sale or Contribution of Assets between an Investor and its Associate or Joint VentureAmendments are related to the conflict between IFRS 10 and IAS 28, with reference to the loss in control of an investee, which is sold or transferred to an associated company or a joint venture. Amendments clarify that profit or loss resulting from the sale or transfer of assets representing a business, as defined by IFRS 3, between an investor and its associated company or joint venture, must be entirely recognised. Any profit or loss, resulting from the sale or transfer of assets, which do not represent a business, is however recognised only within the limits of the portion held by third-party investors in the associated company or joint venture. These amendments must be applied prospectively and will be in force for annual peri-ods beginning on or after 1 January 2016. Early application is permitted. These amendments are not expected to have any impact on the Group.
2012-2014 ANNUAL IMPROVEMENT CYCLE
These amendments are effective for annual periods beginning on 1 January 2016 or later. They include the following:
• IFRS 5 – Non-current Assets Held for Sale and Discontinued OperationsAssets (or disposal group) are generally disposed of through the sale, or the distribution to Shareholders. This amendment clarifies that the change from either disposal methods should not be considered as a new plan to sell, but rather the continu-ation of the original one. Therefore, there is no discontinuation in the application of requirements of IFRS 5. This amendment shall be applied prospectively.
Explanatory notes to the consolidated financial statements
66

• IFRS 7 – Financial Instruments: Disclosures(i) Servicing contractsThe amendment clarifies that a servicing contract envisaging a remuneration can entail a continuing involvement of a finan-cial asset. The entity shall define the type of remuneration and of agreement based on the guidance contained in the IFRS 7 on the continuing involvement, in order to evaluate whether a clarification is required. The definition of what type of servicing contract represents a continuing involvement must be made retrospectively. In any case, the information required shall not be disclosed for annual periods before the first-time application date of this amendment.
(ii) Applicability of amendments to IFRS 7 to condensed interim financial statements.The amendment clarifies that disclosure requirements on remuneration are not applied to condensed interim financial state-ments, unless this disclosure constitutes a significant updating of information given in the most recent annual financial statements. This amendment shall be applied retrospectively.
• IAS 19 – Employee BenefitsThe amendment clarifies that the deep market of high quality corporate bonds should be determined on a currency basis (currency in which the bond is issued), rather than on a country basis (in which the benefits are to be paid). When there is no deep market for high quality corporate bond in that currency, government bonds should be used to establish the discount rate. This amendment shall be applied prospectively.
• IAS 34 – Interim Financial ReportingThe amendment clarifies that disclosures required in the interim financial statements should be included either in the interim financial statements or by cross-reference between the interim financial statements and the section of the interim financial report where disclosure is included (e.g. the Management Report or the risk oversight report on risks). Information supplied in the interim financial report must be available to the reader in the same terms and timing as the in-terim financial statements. This amendment shall be applied retrospectively.No impact on the Group is expected as regards these amendments.
• Amendments to IAS 1 – Disclosure InitiativeAmendments to IAS 1 Disclosure of Accounting Policies intends to clarify, rather than significantly modify, some already existing requirements to IAS 1. The amendments clarify:
– the requirement of materiality in IAS 1; – the fact that specific lines in the statements of profit/(loss) for the year or other components in the Statement of Compre-
hensive Income or in the Statement of Financial Position may be unbundled; – that entities can disclose the Notes to the financial statements in a flexible way; – that the portion of other components in the Statement of Comprehensive Income, related to associated companies and
joint ventures and accounted for by using the Equity method, must be disclosed in aggregate in one single line, and classified under items that will not be subsequently reclassified in the Income Statements.
Moreover, amendments clarify the requirements that are applied when sub-totals are disclosed in the statements of profit/(loss) for the year or other components are disclosed in the Statement of Comprehensive Income or Statement of Financial Position. Amendments are effective for annual periods beginning on or after 1 January 2016. Early application is permitted. No impact on the Group is expected as regards these amendments.
• Amendments to IFRS 10, IFRS 12 and IAS 28 – Investment Entities: Applying the Consolidation ExceptionThese amendments concern issues which arose in the application of the exception related to the investment entities as per IFRS 10. Amendments to IFRS 10 clarify that the exemption to the presentation of the consolidation financial statements is applied to the Parent Company, which is the subsidiary of an investment entity, when the investment entity measures all its subsidiaries at fair value.Moreover, amendments to IFRS 10 clarify that a subsidiary of an investment entity must be consolidated only if it is not an investment entity in itself and supplies support services to the investment entity. All the other subsidiaries of an investment entity are measured at fair value. Amendments to IAS 28 permit that, in application of the Equity Method, the investor maintains the measurement at fair value applied by associated companies or joint ventures of an investment entity also in the measurement of its Equity investments in subsidiaries. These amendments must be applied retrospectively and will be
67
Explanatory notes to the consolidated financial statements

in force for annual periods beginning on or after 1 January 2016. Early application is permitted. No impact on the Group is expected as regards these amendments.
Use of estimatesPreparation of IFRS-compliant consolidated financial statements and of the relevant notes requires directors to apply account-ing principles and methodologies that, in some cases, are based on valuations and estimates, which in turn are based on historic experience and assumptions considered reasonable and realistic based on circumstances at any given time. The application of such estimates and assumptions affects the amounts reported in financial statements, i.e. the statement of financial position, Income Statement, and Cash Flow Statement, as well as the information disclosed. The ultimate actual amounts of accounting items, for which these estimates and assumptions have been used, might be different from those reported in the financial statements due to the uncertainty characterising the assumptions and conditions on which estimates are based.
Below we list the accounting items that, more than others, require greater subjectivity on the part of directors in developing estimates and for which any change in conditions underlying assumptions made could have a significant impact on the Group’s consolidated financial statements.• non-current assets;• development costs;• inventories write-down;• deferred tax assets;• provisions for doubtful accounts;• employee benefits;• provisions for risks and charges.
Estimates and assumptions are reviewed regularly and the effects of every change are immediately reflected in the Income Statement. The measurement criteria of the estimate items are described in the related Notes, to which reference is made.
Explanatory notes to the consolidated financial statements
68
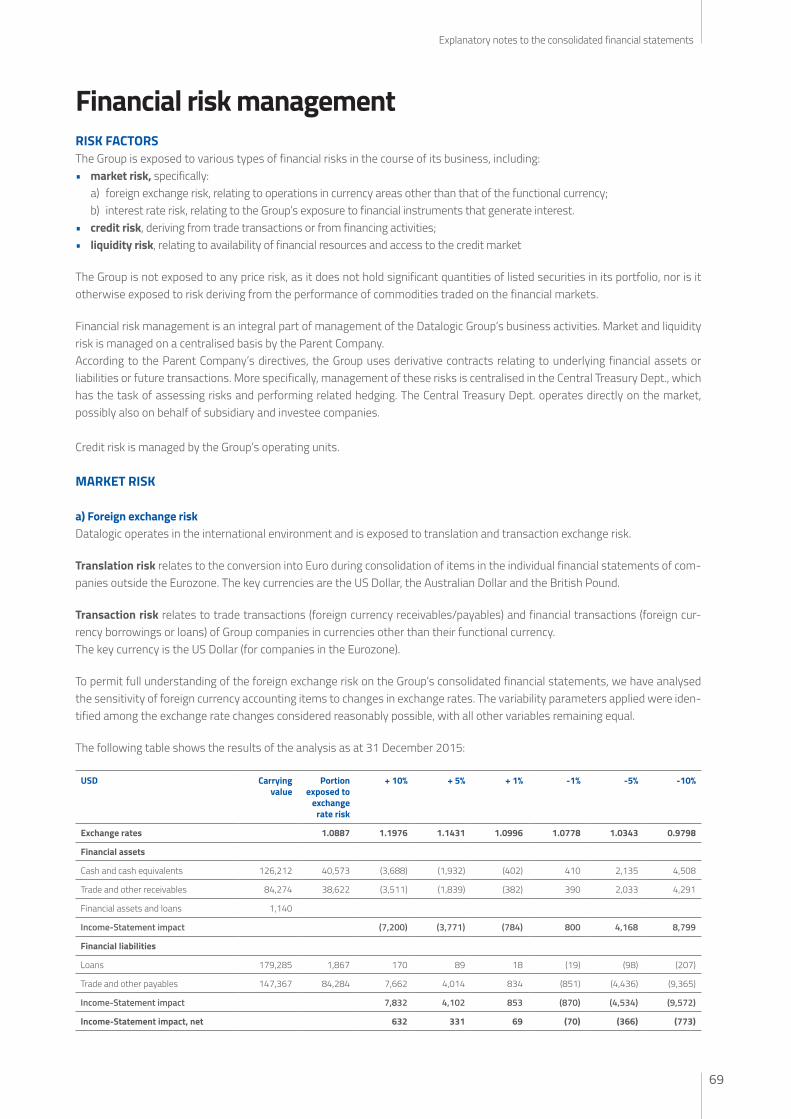
Financial risk managementRISK FACTORSThe Group is exposed to various types of financial risks in the course of its business, including:• market risk, specifically:
a) foreign exchange risk, relating to operations in currency areas other than that of the functional currency;b) interest rate risk, relating to the Group’s exposure to financial instruments that generate interest.
• credit risk, deriving from trade transactions or from financing activities;• liquidity risk, relating to availability of financial resources and access to the credit market
The Group is not exposed to any price risk, as it does not hold significant quantities of listed securities in its portfolio, nor is it otherwise exposed to risk deriving from the performance of commodities traded on the financial markets.
Financial risk management is an integral part of management of the Datalogic Group’s business activities. Market and liquidity risk is managed on a centralised basis by the Parent Company.According to the Parent Company’s directives, the Group uses derivative contracts relating to underlying financial assets or liabilities or future transactions. More specifically, management of these risks is centralised in the Central Treasury Dept., which has the task of assessing risks and performing related hedging. The Central Treasury Dept. operates directly on the market, possibly also on behalf of subsidiary and investee companies.
Credit risk is managed by the Group’s operating units.
MARKET RISK
a) Foreign exchange risk Datalogic operates in the international environment and is exposed to translation and transaction exchange risk.
Translation risk relates to the conversion into Euro during consolidation of items in the individual financial statements of com-panies outside the Eurozone. The key currencies are the US Dollar, the Australian Dollar and the British Pound.
Transaction risk relates to trade transactions (foreign currency receivables/payables) and financial transactions (foreign cur-rency borrowings or loans) of Group companies in currencies other than their functional currency.The key currency is the US Dollar (for companies in the Eurozone).
To permit full understanding of the foreign exchange risk on the Group’s consolidated financial statements, we have analysed the sensitivity of foreign currency accounting items to changes in exchange rates. The variability parameters applied were iden-tified among the exchange rate changes considered reasonably possible, with all other variables remaining equal.
The following table shows the results of the analysis as at 31 December 2015:
USD Carrying value
Portion exposed to
exchange rate risk
+ 10% + 5% + 1% -1% -5% -10%
Exchange rates 1.0887 1.1976 1.1431 1.0996 1.0778 1.0343 0.9798
Financial assets
Cash and cash equivalents 126,212 40,573 (3,688) (1,932) (402) 410 2,135 4,508
Trade and other receivables 84,274 38,622 (3,511) (1,839) (382) 390 2,033 4,291
Financial assets and loans 1,140
Income-Statement impact (7,200) (3,771) (784) 800 4,168 8,799
Financial liabilities
Loans 179,285 1,867 170 89 18 (19) (98) (207)
Trade and other payables 147,367 84,284 7,662 4,014 834 (851) (4,436) (9,365)
Income-Statement impact 7,832 4,102 853 (870) (4,534) (9,572)
Income-Statement impact, net 632 331 69 (70) (366) (773)
69
Explanatory notes to the consolidated financial statements

b) Interest rate riskThe Datalogic Group is exposed to interest rate risk associated both with the availability of cash and with outstanding loans. The aim of interest rate risk management is to limit and stabilise payable flows caused by interest paid mainly on medium-term debt in order to achieve a tight match between the underlying and the hedging instrument.With regard to medium/long-term loans, as at 31 December 2015, Datalogic had interest rate swaps in place with financial counterparties of premier standing, for a notional total of around €6 million. These derivatives permit the hedging of about 4% of total bank borrowings against the risk of a rise in interest rates, synthetically transforming variable-rate loans into fixed-rate loans.
In order to fully understand the potential effects of fluctuations in interest rates to which the Group is exposed, we analysed the accounting items most at risk, assuming a change of 10 basis points in the Euribor and of 10 basis points in the USD Libor. The analysis was based on reasonable assumptions. Below we show the results as at 31 December 2015:
Items exposed to interest rate risk with impact on the Income Statement before taxes:
Euribor (€/000) Carrying value Of which exposed to exchange rate risk
10bp -10bp
Financial assets Profit/(Loss) Profit/(Loss)
Cash and cash equivalents 126,212 76,294 76 (76)
Financial assets and loans 1,140
Income-Statement impact 76 (76)
Financial liabilities Profit/(Loss) Profit/(Loss)
Loans 39,872 10,692 (11) 11
0% Floor loans 139,413 139,413 (139)
Income-Statement impact (150) 11
Total increases/(decreases) (74) (65)
USD Libor Carrying value Of which exposed to exchange rate risk
10bp -10bp
Financial assets Profit/(Loss) Profit/(Loss)
Cash and cash equivalents 126,212 40,573 41 (41)
Financial assets and loans 1,140 0
Income-Statement impact 41 (41)
Financial liabilities Profit/(Loss) Profit/(Loss)
Loans 39,872 1,867 (2) 2
Income-Statement impact (2) 2
Total increases/(decreases) 39 (39)
Items exposed to interest rate risk with impact on the Equity before taxes:
Euribor Carrying value of which exposed to exchange rate risk
10bp -10bp
Financial liabilities Profit/(Loss) Profit/(Loss)
Derivative instruments 7,875 7,875 8 (8)
Explanatory notes to the consolidated financial statements
70

Credit riskThe Group is exposed to credit risk associated with trade transactions. The two operating divisions have therefore planned risk protection measures in order to keep the amounts outstanding to a minimum, i.e. a specific check on receivables due, man-agement of client credit-line limits and gathering of financial information on companies with higher exposure. A large part of Datalogic’s business is conveyed on a network of known clients/distributors, with whom, statistically, no problems connected with credit recoverability have been encountered. In any case, there are no significant concentrations of the risk and it is there-fore not considered relevant to provide detailed, quantitative information. Clients requesting deferred conditions of payment are subjected to screening procedures concerning their creditworthiness grade (degree of solvency) and an analysis of the specific deal. If they are significant, trade receivables are subjected to individual impairment testing.
The Group protects itself against credit risk also through the subscription of a factoring contract without recourse. As at 31 December 2015, the trade receivables assigned to factoring amounted to €26,180 thousand (compared to €20,827 thousand at end 2014). The maximum exposure to credit risk on the balance sheet date is the carrying amount of each class of financial asset presented in Note 4.
Liquidity riskThe Datalogic Group’s liquidity risk is minimised by specific central management by the Parent Company. Bank indebtedness and the management of liquidity are handled centrally via a series of instruments aimed at optimizing the management of fi-nancial resources, by primarily using automatic mechanisms as the cash pooling. The Parent Company manages and negotiates medium/long-term financing and credit lines to meet the Group’s requirements. Specifically, Datalogic S.p.A., as Parent Com-pany, has cash credit lines available for future requirements and to the benefit of the Group. Centralised negotiation of credit lines and loans on the one hand and centralised management of the Group’s cash resources on the other have made it possible to reduce the costs of short-term indebtedness and obtain higher interest income. We also report that, as at 31 December 2015, the Group’s Liquidity Reserve – which includes committed but undrawn credit lines of €186 million – is considered largely sufficient to meet commitments existing as at balance-sheet date.
The following table details the financial liabilities and derivative financial liabilities settled on a net basis by the Group, grouping them according to residual contractual maturity as at balance sheet date. The amounts shown are contractual cash flows not discounted to present value.
The following table shows financial liabilities by maturity:
(€/000) 31 December 2015
0 - 1 year 1 - 5 years > 5 years
Loans 32,973 139,287 352
Other 80
Bank overdrafts 45
Payables for leasing 260 279
Payables to factoring companies 6,009
Financial derivatives (IRS) 6 115
Trade and other payables 143,818 3,549
Total 183,191 143,230 352
71
Explanatory notes to the consolidated financial statements

Capital risk managementThe Group manages capital with the intention of protecting its own continuity and optimising shareholder value, maintaining an optimum capital structure while reducing its cost.In line with sector practice, the Group monitors capital based on the gearing ratio. This indicator is calculated as a ratio between net indebtedness (see Note 10) and total capital.
(€/000) 31.12.2015 31.12.2014
Net indebtedness (A) 20,961 55,718
Shareholders’ Equity (B) 298,260 241,291
Total capital [(A)+(B)]=C 319,221 297,009
“Gearing ratio” (A)/(C) 6.57% 18.76%
Segment informationOperating segments are identified based on the internal statements used by senior management to allocate resources and evaluate results.
The Group operates in the following business segments:
ADC – The ADC division is the global leader in high performance fixed scanners for retail and the major EMEA supplier of manual bar code readers as well as the leading player in the mobile computer market for warehouse management, automation of sales and field forces and the collection of data at stores. It includes the manual reader product lines (HHR), fixed readers, mobile computers (MC), self-scan solutions and cashier technologies.
Industrial Automation – The Industrial Automation division, among the major manufacturers in the world of products and solu-tions for automatic identification, recognition and marketing in the industrial automation market, covers the increasing demand for tracking, inspection and recognition solutions in the manufacturing and logistics processes, mainly couriers, areas. It includes product lines related to: fixed bar code readers using imager and laser technology, the photoelectric sensors and equipment for industrial automation and security, smart remote cameras and software for artificial vision, industrial laser markers.
Informatics – This company, which is headquartered in the United States, sells and distributes products and solutions for the management of inventories and mobile assets tailored for small and medium sized companies.
Corporate – It includes the operations of the holding company, the real estate operations of the Group and Datalogic IP Tech, which manages the Group’s industrial property and research activities.
Intersegment sales transactions are executed at arm’s length conditions, based on the Group transfer pricing policies.
Explanatory notes to the consolidated financial statements
72

The financial information relating to operating segments as at 31 December 2015 and 31 December 2014 are as follows:
(€/000) ADC Industrial Automation
Informatics Corporate Adjustments Total Group
2015 2014 2015 2014 2015 2014 2015 2014 2015 2014 2015 2014
External sales 361,635 308,197 146,050 130,254 27,383 26,124 0 0 0 (29) 535,068 464,546
Intersegment sales 2,331 1,510 34 47 0 0 36,451 24,918 (38,816) (26,475) 0 0
Total sales 363,966 309,707 146,084 130,301 27,383 26,124 36,451 24,918 (38,816) (26,504) 535,068 464,546
Ordinary operating result (Divisional EBITANR)
73,630 67,428 6,108 5,424 (223) 1,098 5,179 (5,745) (23,473) (10,186) 61,221 58,019
% of revenues 20.23% 21.77% 4.18% 4.16% (0.81)% 4.20% 14.21% (23.06)% 60.47% 38.43% 11.44% 12.49%
Operating result (Divisional EBIT) 49,589 56,074 (678) (974) (343) (1,472) 4,693 (6,535) (316) (185) 52,945 46,908
% of revenues 13.62% 18.11% (0.46)% (0.75)% (1.25)% (5.63)% 12.87% (26.23)% 0.81% 0.70% 9.90% 10.10%
Financial Income (expenses) (6,947) (7,796) (1,640) (1,602) (289) (118) 27,744 24,895 (20,229) (23,108) (1,361) (7,729)
Fiscal income (expenses) (7,724) (9,793) 803 575 256 479 (4,406) 378 34 39 (11,037) (8,322)
Amortisation, depreciation and write-downs
(10,714) (9,343) (4,903) (4,549) (329) (778) (2,304) (2,281) 11 34 (18,239) (16,917)
Divisional EBITDA 81,199 74,144 8,564 7,709 (14) 1,274 7,483 (3,464) (23,484) (10,220) 73,748 69,443
% of revenues 22.31% 23.94% 5.86% 5.92% (0.05)% 4.88% 20.53% (13.90)% 60.50% 38.56% 13.78% 14.95%
R&D expenses (39,027) (30,176) (17,942) (14,670) (1,180) (764) (13,596) (13,395) 23,501 15,897 (48,244) (43,108)
% of revenues (10.72)% (9.74)% (12.28)% (11.26)% (4.31)% (2.92)% (37.30)% (53.76)% (60.54)% (59.98)% (9.02)% (9.28)%
Costs for 2014 were reclassified under various items to tender them consistent with figures related to 2015. For the details, see the annex to the financial statements.
For the purposes of a better disclosure of operating results for each single division, the Management deemed it appropriate to highlight the Divisional EBITDA as monitoring KPI of the financial performance of the various operating segments in line with data that are periodically reviewed by the top management, for a decision making on resources to be allocated to the segments and the evaluation of the results obtained by the same.
Reconciliation between EBITDA, EBITANR and Profit/(Loss) before tax is as follows:
(€/000) 31.12.2015 31.12.2014Restated
EBITDA (*) 73,748 69,443
Depreciation and write-downs of Tangible assets (7,812) (7,199)
Amortisation and write-downs of Intangible assets (4,715) (4,225)
EBITANR (*) 61,221 58,019
Non-recurring costs and revenues (2,564) (5,618)
Depreciation & amortisation due to acquisitions (5,712) (5,493)
EBIT (Operating Result) 52,945 46,908
Financial Income 37,617 26,831
Financial expenses (39,152) (34,585)
Profits from associates 174 25
Pre-tax profit/(loss) 51,584 39,179
* as regards the definition of the above-mentioned economic indicators, reference is made to the definition included in the Management report.
73
Explanatory notes to the consolidated financial statements

The statement of financial position information relating to operating sectors as at 31 December 2015 compared with the infor-mation as at 31 December 2014 is as follows:
(€/000) ADC Industrial Automation
Informatics Corporate Adjustments Total Group
31.12.15 31.12.14 31.12.15 31.12.14 31.12.15 31.12.14 31.12.15 31.12.14 31.12.15 31.12.14 31.12.15 31.12.14
Total Assets 644,360 587,938 302,179 226,237 24,604 21,423 782,593 677,215 (1,064,560) (912,534) 689,176 600,279
Non-current assets 159,226 148,927 99,247 85,149 15,270 12,967 33,635 30,756 573 797 307,951 278,596
Tangible 19,226 17,787 18,671 10,734 2,711 2,568 27,806 26,098 (30) (30) 68,384 57,157
Intangible 140,000 131,140 80,576 74,415 12,559 10,399 5,829 4,658 603 827 239,567 221,439
Equity investments in associates
76,241 69,287 6,387 6,213 - - 155,190 155,190 (235,836) (228,882) 1,982 1,808
Total Liabilities 423,679 398,989 245,880 173,420 7,245 5,504 541,641 463,614 (827,529) (682,539) 390,916 358,988
Sector information by region as at 31 December 2015 and 31 December 2014 breaks down as follows:
(€/000) 31.12.2015 31.12.2014 Change
Revenues per geographic area
Revenues in Italy 45,798 44,489 2.9%
Revenues in Europe 222,735 199,484 11.7%
Revenues in North America 161,063 132,644 21.4%
Revenues in Asia & Pacific 71,490 57,327 24.7%
Revenues in Rest of the World 33,982 30,602 11.0%
Total revenues 535,068 464,546 15.2%
(€/000) 31.12.2015 31.12.2014 Adjustments 31.12.2015
Adjustments 31.12.2014
Consolidated 31.12.2015
Consolidated 31.12.2014
Change
Non-current assets
Italy 381,456 394,815 381,456 394,815 (3.4)%
Europe 35,062 26,152 35,062 26,152 34.1%
North America 392,696 354,370 392,696 354,370 10.8%
Rest of the World 16,198 13,446 16,198 13,446 20.5%
Eliminations and adjustments (429,333) (441,899) (429,333) (441,899) (2.8)%
Total 825,412 788,783 (429,333) (441,899) 396,079 346,884 14.2%
Explanatory notes to the consolidated financial statements
74

Group structureThe consolidated financial statements include the statements of the Parent Company and of the companies in which the former directly or indirectly holds the majority of voting rights.
The companies consolidated on a line-by-line basis for the period ended 31 December 2015 are as follows:
Company Registered office Share capital Total Shareholders’
Equity (€/000)
Profit/Loss for the period
(€/000)
% Ownership
Datalogic S.p.A. Bologna - Italy Euro 30,392,175 250,417 27,474
Datalogic Real Estate France Sa Paris - France Euro 2,227,500 3,517 (14) 100%
Datalogic Real Estate Germany Gmbh Erkenbrechtsweiler - Germany Euro 1,025,000 1,515 (117) 100%
Datalogic Real Estate UK Ltd Redbourn - England GBP 3,500,000 5,064 (64) 100%
Datalogic IP Tech S.r.l. Bologna - Italy Euro 65,677 (945) 750 100%
Informatics Inc. Plano Texas - USA $USA 9,996,000 17,359 (376) 100%
Datalogic Automation S.r.l. Monte San Pietro (BO) - Italy Euro 10,000,000 15,088 9,491 100%
Datalogic Automation Inc. Telford, USA $USA 6,009,352 34,556 (11,527) 100%
Datalogic Automation PTY Ltd Mount Waverley (Melbourne) - Australia $AUD 3,188,118 (154) 76 100%
Datalogic Automation Asia Limited Hong-Kong - China HKD 7,000,000 (449) (4) 100%
Datalogic (Shenzhen) Trading Business China Shenzhen - China CNY 2,136,696 1,023 227 100%
Datalogic Hungary kft Fonyod - Hungary HUF 3,000,000 879 119 100%
Datalogic ADC S.r.l. Bologna - Italy Euro 10,000 175,877 41,164 100%
Datalogic Mobile Asia Hong-Kong - China HKD 100,000 113 18 100%
Datalogic Slovakia Sro Trnava - Slovakia Euro 66,388 10,124 10,051 100%
Datalogic Holdings Inc. Eugene OR - USA $USA 100 91,597 (1,703) 100%
Datalogic ADC Inc. Eugene OR - USA $USA 11 95,673 3,997 100%
Datalogic ADC do Brasil Sao Paulo - Brazil R$ 159,525 (1,261) (1,714) 100%
Datalogic ADC Mexico Colonia Cuauhtemoc - Mexico $USA - 28 30 100%
Datalogic Scanning Eastern Europe Gmbh Darmstadt - Germany Euro 25,000 4,320 844 100%
Datalogic ADC PTY Sidney - Australia $AUD 2 1,175 140 100%
Datalogic Vietnam Llc Vietnam USD 3,000,000 28,583 24,493 100%
Datalogic ADC Singapore Singapore SGD 100,000 756 274 100%
The following companies were consolidated at Equity as at 31 December 2015:
Company Registered office Share capital Total Shareholders’
Equity (€/000)
Profit/Loss for the period (€/000)
% Ownership
Laservall Asia Co. Ltd Hong Kong - China HKD 460,000 3,812 348 50%
The following companies were consolidated at cost as at 31 December 2015:
Company Registered office Share capital Total Shareholders’
Equity (€/000)
Profit/Loss for the period (€/000)
% Ownership
Datasensor Gmbh Otterfing - Germany Euro 150,000 0 (3) 30%
Datalogic Automation AB (*) Malmö - Sweden KRS 100,000 486 155 20%
Specialvideo S.r.l. (**) Imola - Italy Euro 10,000 268 146 40%
CAEN RFID S.r.l. (**) Viareggio - Italy Euro 119,000 550 55 20%
(*) Annual financial statements as at 30 June 2015.(**) Financial statements as at 31 December 2014.
75
Explanatory notes to the consolidated financial statements

Change in scope of consolidation With deed signed on 13 January 2015, the company Datalogic ADC Ltd was merged into the Parent Company Datalogic ADC S.r.l. This transaction caused no changes in the scope of consolidation.
It is worth noting that two new branches of ADC S.r.l. were recorded:on 19 August 2015 in South Africa;on 18 December 2015 in Poland. Information on Statement of Financial PositionNote 1. Tangible assetsDetails of movements as at 31 December 2015 and 31 December 2014 are as follows:
(€/000) 31.12.2015 31.12.2014 Change
Land 5,763 5,365 398
Buildings 32,299 24,698 7,601
Other assets 28,029 22,673 5,356
Assets in progress and payments on account 2,293 4,421 (2,128)
Total 68,384 57,157 11,227
Explanatory notes to the consolidated financial statements
76

Details of movements as at 31 December 2014 and 31 December 2015 are as follows:
(€/000) Land Buildings Other assets Assets in progress and payments on
account
Total
Historical cost 5,223 28,329 104,676 1,755 139,983
Accumulated depreciation 0 (3,801) (84,854) 0 (88,655)
Net opening value as at 01.01.2014 5,223 24,528 19,822 1,755 51,328
Increases 31.12.2014
Investments 125 7,976 3,249 11,350
Total 0 125 7,976 3,249 11,350
Decreases 31.12.2014
Disposals, historical cost (5,737) 0 (5,737)
Disposals, accum. depreciation 5,579 5,579
Depreciation (529) (6,670) (7,199)
Total 0 (529) (6,828) 0 (7,357)
Reclass. & other changes 31.12.2014
Incoming transfers at historical cost (215) 878 (654) 9
(Outgoing transfers, accum. depreciation) 107 (102) 5
Diff. exchange in historical cost 142 820 3,395 71 4,428
Diff. exchange in accum. depreciation (138) (2,468) (2,606)
Total 142 574 1,703 (583) 1,836
Historical cost 5,365 29,059 111,188 4,421 150,033
Accumulated depreciation 0 (4,361) (88,515) 0 (92,876)
Net closing value as at 31.12.2014 5,365 24,698 22,673 4,421 57,157
(€/000) Land Buildings Other assets Assets in progress and payments on
account
Total
Historical cost 5,365 29,059 111,188 4,421 150,033
Accumulated depreciation 0 (4,361) (88,515) 0 (92,876)
Net opening value as at 01.01.2015 5,365 24,698 22,673 4,421 57,157
Increases as at 31.12.2015
Investments 259 4,653 11,384 2,461 18,757
Total 259 4,653 11,384 2,461 18,757
Decreases as at 31.12.2015
Disposals, historical cost (1,616) (433) (2,049)
Write-down (29) (29)
Disposals, accum. depreciation 1,531 1,531
Depreciation (562) (7,221) (7,783)
Total 0 (562) (7,335) (433) (8,330)
Reclass. & other changes 31.12.2015
Incoming transfers at historical cost 2,978 304 (4,336) (1,054)
(Outgoing transfers, accum. depreciation) 13 381 394
Exch. Change in historical cost 139 661 2,963 180 3,943
Exch. Change in accum. depreciation (142) (2,341) (2,483)
Total 139 3,510 1,307 (4,156) 800
Historical cost 5,763 37,351 124,223 2,293 169,630
Accumulated depreciation 0 (5,052) (96,194) 0 (101,246)
Net closing value as at 31.12.2015 5,763 32,299 28,029 2,293 68,384
The increase in item “Buildings” (€4,653 thousand) is primarily related to the new plant in Hungary, amounting to €3,104 thou-sand (€5,951 thousand of total investment) and for restructuring works on buildings owned by the Group (€1,469 thousand).
77
Explanatory notes to the consolidated financial statements

The “Other assets” item as at 31 December 2015 mainly includes the following categories: Plant and machinery (€8,489 thou-sand), Trade and industrial equipment (€9,306 thousand), Office furniture and machines (€6,513 thousand), General plants (€2,053 thousand), Motor vehicles (€165 thousand), and Maintenance on third-party assets (€1,247 thousand).
This item increased by €11,384 thousand mainly due to:• investments for the building of new production lines (€3,605 thousand),• investments related to purchases of Office furniture and machines (€2,376 thousand),• purchase of moulds (€1,300 thousand),• ameliorations on third-party assets (€775 thousand).
Disposals are mainly related to the decommissioning of already obsolete, and entirely depreciated, assets.
The balance of “Assets in progress and payments on account”, equal to €2,293 thousand, consists of €740 thousand for ame-liorations to buildings owned by the Group and, for the remaining portion, to down payments for equipment, instruments and moulds for normal production activities.
NOTE 2. INTANGIBLE ASSETS
Details of movements as at 31 December 2015 and 31 December 2014 are as follows:
(€/000) 31.12.2015 31.12.2014 Change
Goodwill 183,020 164,412 18,608
Development costs 5,349 6,809 (1,460)
Others 47,829 49,031 (1,202)
Assets in progress and payments on account 3,369 1,187 2,182
Total 239,567 221,439 18,128
Details of movements as at 31 December 2015 and 31 December 2014 are as follows:
(€/000) Goodwill Development costs
Others Assets in progress and payments on
account
Total
Historical cost 145,092 13,782 116,666 2,226 277,766
Accumulated amortisation 0 (7,443) (66,173) 0 (73,616)
Net opening value as at 01.01.2014 145,092 6,339 50,493 2,226 204,150
Increases 31.12.2014
Investments 33 719 730 1,482
Total 0 33 719 730 1,482
Decreases 31.12.2014
Disposals, historical cost (230) (425) 0 (655)
Disposals, accum. amortisation 230 425 655
Amortisation (1,865) (7,853) (9,718)
Total 0 (1,865) (7,853) 0 (9,718)
Reclass. & other changes 31.12.2014
Incoming transfers 1,722 39 (1,769) (8)
(Outgoing transfers) 0
Diff. exchange in historical cost 19,320 710 10,709 30,739
Diff. exchange in accum. amortisation (130) (5,076) (5,206)
Total 19,320 2,302 5,672 (1,769) 25,525
Historical cost 164,412 16,017 127,708 1,187 309,324
Accumulated amortisation 0 (9,208) (78,677) 0 (87,885)
Net closing value as at 31.12.2014 164,412 6,809 49,031 1,187 221,439
Explanatory notes to the consolidated financial statements
78

(€/000) Goodwill Development costs
Others Assets in progress and payments on
account
Total
Historical cost 164,412 16,017 127,708 1,187 309,324
Accumulated amortisation 0 (9,208) (78,677) 0 (87,885)
Net opening value as at 01.01.2015 164,412 6,809 49,031 1,187 221,439
Increases 31.12.15
Investments 1,517 2,493 4,010
Total 0 0 1,517 2,493 4,010
Decreases 31.12.15
Disposals, historical cost 0 (21) (45) (66)
Disposals, accum. amortisation 4 4
Amortisation (1,956) (8,471) (10,427)
Write-downs 0
Total 0 (1,956) (8,488) (45) (10,489)
Reclass. & other changes 31.12.15
Incoming transfers 786 786
(Outgoing transfers) (24) (279) (303)
Diff. in Change in historical cost 18,608 675 10,226 13 29,522
Diff. in Change in accum. amortisation (179) (5,219) (5,398)
Total 18,608 496 5,769 (266) 24,607
Historical cost 183,020 16,692 140,192 3,369 343,273
Accumulated amortisation 0 (11,343) (92,363) 0 (103,706)
Net closing value at 31.12.15 183,020 5,349 47,829 3,369 239,567
“Goodwill”, totalling €183,020 thousand, consisted of the following items:
(€/000) 31.12.2015 31.12.2014 Change
CGU ADC 105,829 95,445 10,384
CGU IA 63,366 56,284 7,082
CGU Informatics 13,825 12,683 1,142
Total 183,020 164,412 18,608
Changes in item “Goodwill”, compared to 31 December 2015, is mainly attributable to translation differences, as most of the goodwill is expressed in US Dollars.
Goodwill has been allocated to the CGUs (Cash Generating Units) corresponding to the individual companies and/or sub-groups to which they pertain.
As highlighted in the paragraph included in the section on accounting standards and policies used in the financial statements for the year ended 31 December 2015, to which reference should be made, in compliance with IFRS 3, goodwill has not been am-ortised since 1 January 2004 and is tested for impairment each year unless loss indicators suggest the need for more frequent impairment testing. The estimated recoverable value of each CGU, associated with each goodwill item measured, consists of its corresponding value in use.Value in use is calculated by discounting the future cash flows generated by the CGU – during production and at the time of its retirement – to present value using a certain discount rate, based on the Discounted Cash Flow method.
There were no write-downs as at 31 December 2015.
The cash flows of the individual CGUs have been taken from their respective 2016 Budgets and forward-looking plans prepared by Management. These plans represent the best estimate of foreseeable operating performance, based on business strategies and growth indicators in the sector to which the Group belongs and in its reference markets.The assumptions used for the purposes of impairment, and the consequent results, have been approved by the Datalogic S.p.A. Audit and Risk Management Committee, Remuneration and Appointments Committee and the Board of Directors of each Com-pany, for the related Goodwill.
79
Explanatory notes to the consolidated financial statements

Based on use of an Unlevered approach, we have used, through the discounted cash flow method, Unlevered Free Cash Flows from Operations (FCFO) as detailed below:
= EBIT- Taxes on EBIT= NOPLAT (Net operating profit after taxes) + Depreciation and amortisation- Capital expenditures+/- Change in provisions+/- Change in Working Capital+/- Change in other assets – liabilities = Unlevered free cash flows from operations (FCFO)
To expected flows for the period 2016-2020, which are explicitly forecast, the flow relating to Perpetuity – representing Ter-minal value – is added.
This is calculated using a long-term growth rate (G) of 2%, which represents the long-term expectations for the industrial sector to which we belong.
The discount rate, consisting of the weighted average cost of invested capital (WACC), is estimated before tax and based on the financial structure of the sector to which the Datalogic Group belongs. The WACC used – ranging from 8.76% to 10.14% depending on the goodwill measured – reflects the return opportunity for all capital contributions, for whichever reason they are made. In the table below we provide the goodwill reallocated according to the new structure of the operating sectors and the break-down of the growth assumptions made in the forecast plans and the discount rates used:
(€/000) CGU ADC CGU IA Informatics
Goodwill at acquisition date 105,829 63,366 13,825
Weighted average cost of capital (WACC) 10.07% 10.14% 8.76%
Long-term growth rate (G) 2% 2% 2%
CGU ADCGoodwill attributed to CGU ADC results from acquisitions of the PSC Group occurred in 2005, of the subsidiary EVO Inc. occurred in 2010 and of IDWARE S.r.l., occurred in 1998. The recoverable value of the ADC CGU was determined based on the calculation of the value in use, in which projected cash flows, resulting from the plan approved by the Board of Directors, have been used.The discount rate before taxes applied to projected cash flows is 10.07% (2014: 10.52%) and cash flows over five years have been inferred based on 2.0% growth rate (in line with 2014), which is prudentially lower than the growth rate expected in reference markets. During testing for impairment, goodwill of CGU ADC confirmed its carrying value.
CGU IAGoodwill attributed to CGU ADC results from acquisitions of the Laservall Group, occurred in 2004, of INFRA S.r.l., occurred in 2004, of PPT Vision Inc., occurred in 2011 and of Accu-Sort System Inc., occurred in 2012. The recoverable value of the ADC CGU was determined based on the calculation of the value in use, in which projected cash flows, resulting from the plan approved by the Board of Directors, have been used. The discount rate before taxes applied to projected cash flows is 10.14% (2014: 10.38%) and cash flows over five years have been inferred based on 2.0% growth rate (in line with 2014), which is prudentially lower than the growth rate expected in reference markets. During testing for impairment, goodwill of CGU IA confirmed its carrying value.
CGU INFORMATICSGoodwill attributed to CGU Informatics results from acquisitions made by Informatics Inc. in 2005. The recoverable value of the CGU Informatics was determined based on the calculation of the value in use, in which projected cash flows, resulting from
Explanatory notes to the consolidated financial statements
80

the plan approved by the Board of Directors, have been used. The discount rate before taxes applied to projected cash flows is 8.76% (in line with 2014) and cash flows over five years have been inferred based on 2.0% growth rate (in line with 2014), which is prudentially lower than the growth rate expected in reference markets. During testing for impairment, goodwill of CGU Informatics confirmed its carrying value.
Sensitivity to changes in assumptionsThe calculation of value in use for selected CGUs is related to the following assumptions: • gross profit;• discount rates;• growth rate used to calculate cash flows after the forecast period.
Gross Profit – Gross Profit is based on the average of amounts obtained in years before the beginning of the budget period. These values are increased in the budget period, in relation to improvements to efficiency. A decrease in demand might lead to a reduction in gross profit, and related decrease in value.
Discount rates – Discount rates reflect the market estimate of risks specific to each CGU, taking account of the time value of money and the risks specific to underlying assets, which are not already included in the cash flow estimates. The calculation of the discount rate is based on the Group specific circumstance and its operating sectors, and it results from its weighted average cost of the capital (WACC).
Estimates of growth rates – The rates are based on sector studies published. The management acknowledges that the rapidity in technological development and the possible entry of new actors in the market may have a significant impact on the growth rate.
As regards the measurement of the value in use of the aforementioned CGUs, the management deems that a change in the pre-vious key assumptions so that a carrying value of the units would be lower than their recoverable value would not reasonably occur, also by reason of the fact that the differentials between the recoverable values of CGUs and the corresponding carrying values are highly positive as at 31 December 2015, especially for ADC and Informatics CGUs. There is no external indicator to justify a loss in value of consolidated assets, either belonging to the CGUs used for testing impairment or represented by the residual portion of assets, that is the facilities belonging to Datalogic S.p.A., whose carrying value is lower than the fair value resulting from current market prices.
“Development costs”, which amount to €5,349 thousand, consist of specific development projects capitalised when they meet IAS 38 requirements and in compliance with Group policies, which call for the capitalisation only of projects relating to develop-ment of products featuring significant innovation.
The “Others” item, which amounts to €47,829 thousand, consists primarily of intangible assets acquired through business combinations carried out by the Group, which are specifically identified and valued in the context of purchase accounting.Details are shown in the following table:
(€/000) 31.12.2015 31.12.2014 Useful life
Acquisition of the PSC group (on 30 November 2006) 18,582 18,959
Patents 18,582 18,329 20
Trademark 0 320 10
Client portfolio 0 310 10
Acquisition of Informatics Inc. (on 28 February 2005) 0 110
Commercial structure 0 110 10
Acquisition of Evolution Robotics Retail Inc. (on 01 July 2010) 2,895 3,173
Patents 482 529 10
Trade secrets 2,413 2,644 10
Acquisition of Accu-Sort Inc. (on 20 January 2012) 15,734 16,288
Patents 9,305 9,656 10
Trade secrets 6,429 6,632 10
Licence agreement 5,800 6,492 5-15
Others 4,818 4,009
Total other intangible assets 47,829 49,031
The “Others” item mainly consists of software licences.
81
Explanatory notes to the consolidated financial statements

NOTE 3. EQUITY INVESTMENTS IN ASSOCIATES
Equity investments owned by the Group as at 31 December 2015 were as follows:
(€/000) 31.12.2014 Increases Decreases Foreign exch. diff.
Share of profit 31.12.2015
Associates
Laservall Asia Co. Ltd 1,732 174 1,906
Datalogic Automation AB 2 2
Specialvideo S.r.l. 29 29
Datasensor GMBH 45 45
Total associates 1,808 0 0 0 174 1,982
Total 1,808 0 0 0 174 1,982
The change in the “Associates” item is due to the Group result realised by the associate Laservall Asia Co..
NOTE 4. FINANCIAL INSTRUMENTS BY CATEGORY
The statement of financial position items coming within the scope of “Financial instruments” as defined by IAS/IFRSs are as follows:
31.12.2014 (€/000) Loans and receivables
Financial assets at fair value charged
to the Income Statement
Available for sale Total
Non-current financial assets 1,721 20,290 3,842 25,853
Financial assets - Equity investments (5) 3,481 3,481
Financial assets - Securities (5) 361 361
Financial assets - Other (5) 20,290 20,290
Other receivables (7) 1,721 1,721
Current financial assets 172,805 0 0 172,805
Trade receivables from third parties (7) 68,894 68,894
Other receivables from third parties (7) 14,524 14,524
Financial assets - Other (5) 3,234 3,234
Cash and cash equivalents (10) 86,153 86,153
Total 174,526 20,290 3,842 198,658
31.12.2015 (€/000) Loans and receivables
Financial assets at fair value charged
to the Income Statement
Available for sale Total
Non-current financial assets 3,069 30,732 4,986 38,787
Financial assets - Equity investments (5) 4,625 4,625
Financial assets - Securities 361 361
Financial assets - Loans 1,140 1,140
Financial assets - Other 30,732 30,732
Other receivables (7) 1,929 1,929
Current financial assets 207,026 0 0 207,026
Trade receivables from third parties (7) 67,309 67,309
Other receivables from third parties (7) 13,505 13,505
Financial assets - Other (5) 0 0
Financial assets - Securities (5) 0 0
Cash and cash equivalents (10) 126,212 126,212
Total 210,095 30,732 4,986 245,813
Explanatory notes to the consolidated financial statements
82

31.12.2014 (€/000) Derivatives Other financial liabilities Total
Non-current financial liabilities 262 92,600 92,862
Financial payables (12) 89,519 89,519
Financial liabilities - Derivative instruments (6) 262 262
Other payables (16) 3,081 3,081
Current financial liabilities 0 206,298 206,298
Trade payables to third parties (16) 91,611 91,611
Other payables (16) 38,712 38,712
Short-term financial payables (12) 75,975 75,975
Total 262 298,898 299,160
31.12.2015 (€/000) Derivatives Other financial liabilities Total
Non-current financial liabilities 115 143,467 143,582
Financial payables (12) 139,918 139,918
Financial liabilities - Derivative instruments (6) 115 115
Other payables (16) 3,549 3,549
Current financial liabilities 6 183,097 183,103
Trade payables to third parties (16) 101,468 101,468
Other payables (16) 42,107 42,107
Financial liabilities - Derivative instruments (6) 6 6
Short-term financial payables (12) 39,367 39,367
Total 121 326,409 326,530
FAIR VALUE – HIERARCHYThe Group measures at fair value all financial instruments such as derivatives and financial assets at each annual reporting date. The Group uses measurement methods that are appropriate for the situation, and for which data available to measure fair value are sufficient, while maximising the use of relevant inputs observable and limiting the use of non-observable inputs. All assets and liabilities measured or recognised at fair value are classified based on a fair value hierarchy, as provided for by IFRS 13, and described hereunder:
Level 1 - listed prices (not adjusted) in active markets for identical assets or liabilities the entity of which is identifiable at the measurement date;
Level 2 - input data other than listed prices included in Level 1 which can be observed, either directly or indirectly for the asset or liability to be measured;
Level 3 - the valuation techniques for which input data cannot be observed for the asset or liability to be measured.
31.12.2015 (€/000) Level 1 Level 2 Level 3 Total
Assets measured at fair value
Financial assets - Equity Investments (5) 3,998 627 4,625
Financial assets - LT securities (5) 361 361
Financial assets - Other LTs (5) 9,919 20,813 30,732
Financial assets - Other (5) 0 0
Financial assets - Loans 0 1,140 1,140
Financial assets - ST Derivative instruments (6) 0
Total Assets measured at fair value 14,278 20,813 1,767 36,858
Liabilities measured at fair value
Financial liabilities - LT derivative instruments (6) 115 115
Financial liabilities - ST derivative instruments (6) 6 6
Total Liabilities measured at fair value 0 121 0 121
83
Explanatory notes to the consolidated financial statements

As regards assets and liabilities that are recognised in the financial statements at fair value on a recurring basis, the Group de-termines whether transfers between hierarchy level occurred while revising the classification (based in lower level inputs, which is significant for the purposes of a thorough fair value measurement) at each annual reporting date.
NOTE 5. AVAILABLE-FOR-SALE FINANCIAL ASSETS AND LOANS
Available-for-sale financial assets include the following items:
(€/000) 31.12.2015 31.12.2014 Change
Other Equity investments 4,625 3,481 1,144
Long-term government bonds 361 361 0
Other long-term financial assets 30,732 20,290 10,442
Total other long-term financial assets 35,718 24,132 11,586
Long-term loans 1,140 0 1,140
Other short-term financial assets 3,234 (3,234)
Total financial assets 36,858 27,366 9,492
The “Other LT financial assets” item consists of an investment of corporate liquidity in two insurance policies subscribed in May and July 2014, and a mutual investment fund subscribed in August 2015.
As at 31 December 2015, Equity investments held by the Group in other companies were as follows:
(€/000) 31.12.2014 Increases Decreases Adjustment to fair value
Adjustment on exchange rates
31.12.2015
Listed Equity investments 3,394 214 390 3,998
Unlisted Equity investments 87 568 (28) 0 0 627
Total Equity investments 3,481 568 (28) 214 390 4,625
The amount of the “Listed Equity investments” item is represented by the 1.2% investment of share capital in the Japanese company Idec Corporation listed on the Tokyo Stock Exchange.
The change in “Unlisted Equity investments” item is due to the acquisition of 20% in CAEN RFID S.r.l., a company based in Tusca-ny, and leader in the RFID-Radiofrequency Identification technology in the Ultra High Frequency (UHF) range.
The purchase of 127 shares and the sale of 199 shares (at par) in the Mandarin Fund, a Private Equity fund that mainly invests in Italian and Chinese small and medium-sized companies, are worth noting.
It should be highlighted that the Parent Company holds a minority interest in the Alien Technology Corporation, which was written down completely as at 31 December 2010.
Explanatory notes to the consolidated financial statements
84

NOTE 6. FINANCIAL DERIVATIVES
(€/000) 31.12.2015 31.12.2014
Assets Liabilities Assets Liabilities
Financial instruments measured at fair value and recognised in the Statement of Comprehensive Income
Interest rate derivatives - LT Cash Flow Hedges 0 115 0 262
Interest rate derivatives - ST Cash Flow Hedges 0 6 0 0
Total 0 121 0 262
INTEREST RATE DERIVATIVESThe Group has entered into interest rate derivative contracts to manage the risk stemming from changes in interest rates on bank borrowings, converting them from variable to fixed-rate via interest rate swaps having the same amortisation plan as the hedged underlying asset. As envisaged by IAS 39, the fair value of these contracts, totalling €121 thousand, is recognised in a specific Equity reserve net of the tax effect, because they hedge future cash flows and meet all IAS 39 requirements for the application of hedge accounting.As at 31 December 2015, the notional principal of interest swaps totalled €7,875 thousand (€14,625 thousand as at 31 De-cember 2014).
CURRENCY DERIVATIVESAs at 31 December 2015, the Group had no active forward contracts for exchange rate risk.
NOTE 7. TRADE AND OTHER RECEIVABLES
TRADE AND OTHER RECEIVABLES
(€/000) 31.12.2015 31.12.2014 Change
Third-party trade receivables 68,492 70,529 (2,037)
Less provision for doubtful receivables 1,183 1,635 (452)
Net third-party trade receivables 67,309 68,894 (1,585)
Receivables from associates 1,456 1,290 166
Laservall Asia 541 487 54
Aczon 9 9 0
Datasensor GMBH 88 141 (53)
Specialvideo S.r.l. 1 24 (23)
Datalogic Automation AB 817 629 188
Total Trade receivables 68,765 70,184 (1,419)
Other receivables - current accrued income and prepaid expenses 13,580 14,599 (1,019)
Other receivables - non-current accrued income and prepaid expenses 1,929 1,721 208
Total other receivables - accrued income and prepaid expenses 15,509 16,320 (811)
Less non-current portion 1,929 1,721 208
Trade and other receivables - current portion 82,345 84,783 (2,438)
TRADE RECEIVABLES“Trade receivables falling due within 12 months” as at 31 December 2015, equal to €68,765 thousand, decreased as at 31 December 2014 by €1,419 thousand but, net of the exchange rate effect, they would have decreased by €4,625 thousand.As at 31 December 2015, trade receivables assigned to the factoring amounted to €26,180 thousand (compared to €20,827 thousand at end 2014). Receivables from associates arise from commercial transactions carried out at arm’s length conditions.
85
Explanatory notes to the consolidated financial statements

As at 31 December 2015 the breakdown of the item by due date is as follows:
(€/000) 31.12.2015 31.12.2014
Not yet due 56,778 52,581
Past due by 30 days 8,130 10,673
Past due by 30 - 60 days 1,826 3,663
Past due by more than 60 days 574 1,977
Total 67,309 68,894
The following table shows the breakdown of trade receivables by currency:
Currency 31.12.2015 31.12.2014
Euro 25,716 29,599
US Dollar (USD) 35,495 35,554
British Pound Sterling (GBP) 2,512 748
Australian Dollar (AUD) 1,024 1,059
Canadian Dollar (CAD) 128 406
Japanese Yen (JPY) 1,024 660
Danish Krone (DKK) 3 3
Swedish Krona (SEK) 455 453
Chinese Renminbi (CNY) 87 13
Vietnam Dong (VND) 224 70
Brazilian Real (BRL) 643 329
Total 67,309 68,894
Customer trade receivables are posted net of doubtful debt provision totalling €1,183 thousand (€1,635 thousand as at 31 December 2014).
Changes in accrued doubtful debt provision during the period were as follows:
(€/000) 2015 2014
As at 1 January 1,635 2,259
Exchange-rate change 5 37
Provision to the write-down reserve 218 804
Unused and reversed amounts (184) (418)
Reclassifications (32)
Receivables reversed as considered uncollectable in the year (459) (1,047)
As at 31 December 1,183 1,635
Other receivables - accrued income and prepaid expensesThe detail of the item “Other receivables - accrued income and prepaid expenses” is as shown below:
(€/000) 31.12.2015 31.12.2014 Change
Other short-term receivables 2,848 1,943 905
Other long-term receivables 1,929 1,721 208
VAT receivables 8,369 9,727 (1,358)
Accrued income and prepaid expenses 2,363 2,929 (566)
Total 15,509 16,320 (811)
Explanatory notes to the consolidated financial statements
86

NOTE 8. INVENTORIES
(€/000) 31.12.2015 31.12.2014 Change
Raw and ancillary materials and consumables 18,056 12,367 5,689
Work in progress and semi-finished products 24,409 21,896 2,513
Finished products and goods 27,012 28,153 (1,141)
Total 69,477 62,416 7,061
The increase in Inventories, net of the exchange rate effect, would result equal to €2,942 thousand.
Inventories are shown net of an obsolescence provision that, as at 31 December 2015, amounted to €7,167 thousand (€8,548 thousand as at 31 December 2014). The movements of this provision as at 31 December of each year is shown hereunder:
(€/000) 31.12.2015 31.12.2014
1 January 8,548 9,118
Exchange-rate change 581 683
Allocations 2,644 1,866
Release for scrap and other utilisations (4,606) (3,119)
31 December 7,167 8,548
NOTE 9. TAX RECEIVABLES AND TAX PAYABLES
As at 31 December 2015, “Tax receivables” amounted to €15,063 thousand, down by €1,746 thousand (€16,809 thousand as at 31 December 2014). The receivables for IRES tax from the Parent Company Hydra are classified under this item. This amount is due to the tax consolidation and totals €7,383 thousand, down by €1,336 thousand (€8,719 thousand as at 31 December 2014).
As at 31 December 2015, “Tax payables” amounted to €10,577 thousand, down by €208 thousand (€10,785 thousand as at 31 December 2014). The payables for IRES tax due to the Parent Company Hydra are classified under this item. This amount is due to the tax consolidation and as at 31 December 2015, totalled €4,781 thousand. As at 31 December 2014 it amounted to €23 thousand.
NOTE 10. CASH AND CASH EQUIVALENTS
Cash and cash equivalents are broken down as follows for the purposes of the Cash Flow Statement:
(€/000) 31.12.2015 31.12.2014 Change
Cash and cash equivalents shown on financial statements 126,212 86,153 40,059
Restricted cash (46) (160) 114
Current account overdrafts (45) (141) 96
Cash and cash equivalents for statement 126,121 85,852 40,269
87
Explanatory notes to the consolidated financial statements

According to the requirements of Consob Communication no. 15519 of 28 July 2006, the Group’s Financial Position is reported in the following table:
(€/000) 31.12.2015 31.12.2014
A. Cash and bank deposits 126,166 85,993
B. Other cash and cash equivalents 46 160
b1. Restricted cash deposit 46 160
C. Securities held for trading 361 361
c1. Short-term 0 0
c2. Long-term 361 361
D. Cash and equivalents (A) + (B) + (C) 126,573 86,514
E. Current financial receivables 0 3,234
F. Other current financial receivables 0 0
f1. Hedging transactions 0 0
G. Bank overdrafts 45 141
H. Current portion of non-current debt 32,973 74,699
I. Other current financial payables 6,355 1,135
i1. Hedging transactions 6 0
i2. Payables for leasing 260 247
i3. Current financial payables 6,089 888
J. Current financial debt (G) + (H) + (I) 39,373 75,975
K. Current financial debt, net (J) - (D) - (E) - (F) (87,200) (13,773)
L. Non-current bank borrowing 139,639 88,950
M. Other non-current financial assets 31,872 20,290
N. Other non-current liabilities 394 831
n1. Hedging transactions 115 262
n2. Payables for leasing 279 569
O. Non-current financial debt (L) - (M) + (N) 108,161 69,491
P. Net Financial Debt (K) + (O) 20,961 55,718
Net Financial Debt as at 31 December 2015 was negative by €20,961 thousand, an improvement of €34,757 thousand com-pared to 31 December 2014, (when it was negative by €55,718 thousand).
Note that the following transactions were carried out in the period:• purchase of treasury shares (no. 82,517), which generated a negative cash flow amounting to €831 thousand,• cash outflows for leaving incentives amounting to €2,542 thousand, • payment of dividends of €10,471 thousand.
Investments were also made, net of disposals, amounting to €22,010 thousand. This amount includes €9,811 thousand related to new investments and restructuring of buildings, as well as the building of new production lines. The related cash outflows for the period amounted to €6,262 thousand.
Explanatory notes to the consolidated financial statements
88

Information on Shareholders’ Equity and Statement of financial position NOTE 11. SHAREHOLDERS’ EQUITY
The detail of Equity accounts is shown below, while changes in Equity are reported in the specific statement:
(€/000) 31.12.2015 31.12.2014
Share capital 30,392 30,392
Extraordinary share-cancellation reserve 2,813 2,813
Treasury shares held in portfolio 4,488 5,319
Treasury share reserve 2,453 1,624
Share premium reserve 106,513 107,342
Share capital and capital reserves 146,659 147,490
Cash-flow hedge reserve (92) (190)
Translation reserve 22,168 2,702
Reserve for exchange rate adjustment 13,404 5,542
Actuarial gains/(losses) reserve (371) (378)
Held-for-sale financial assets reserve 509 218
Other reserves 35,618 7,894
Retained earnings 75,436 55,050
Earnings carried forward 59,878 40,674
Capital contribution reserve 958 958
Legal reserve 5,917 4,735
IAS reserve 8,683 8,683
Profit for the year 40,547 30,857
Total Group Shareholders’ Equity 298,260 241,291
SHARE CAPITALMovements in Share Capital as at 31 December 2014 and 31 December 2015 are reported below:
(€/000) Number of shares
Share Capital Extraordinary share-
cancellation reserve
Share premium
reserve
Treasury shares
Treasury share reserve
Total
01.01.2014 57,053,258 30,392 2,813 100,863 (5,171) 8,103 137,000
Purchase of treasury shares (219,943) (1,842) (1,842) 1,842 (1,842)
Sale of treasury shares 1,421,083 8,321 8,321 (8,321) 8,321
Capital gains/(capital losses) from the sale of treasury shares
4,469 4,469
Costs for the purchase/sale of treasury shares (458) (458)
31.12.2014 58,254,398 30,392 2,813 107,342 5,319 1,624 147,490
(€/000) Number of shares
Share Capital Extraordinary share-
cancellation reserve
Treasury shares held in
portfolio
Treasury share reserve
Share premium
reserve
Total
01.01.2015 58,254,398 30,392 2,813 5,319 1,624 107,342 147,490
Purchase of treasury shares (82,517) (829) 829 (829) (829)
Costs for the purchase/sale of treasury shares (2) (2)
31.12.2015 58,171,881 30,392 2,813 4,488 2,453 106,513 146,659
89
Explanatory notes to the consolidated financial statements

Extraordinary share-cancellation reserveThe Extraordinary Shareholders’ Meeting of Datalogic S.p.A., held on 20 February 2008, approved a reduction of share capital through the cancellation of 5,409,981 treasury shares (equal to 8.472% of the share capital), owned by the Company.When these shares were cancelled, as resolved by the Extraordinary Shareholders’ Meeting, a share-cancellation reserve was set aside for the amount of €2,813 thousand, through the use of the share premium reserve. Therefore, this reserve remained classified under item “Share capital”.
Ordinary sharesAs at 31 December 2015, the total number of ordinary shares was 58,446,491, including 274,610 held as treasury shares, making the number of shares in circulation at that date 58,171,881. The shares have a nominal unit value of €0.52 and are fully paid up.
Treasury sharesThe item “Treasury shares”, amounting to €4,488 thousand, includes capital gains/(losses) resulting from the sale of treasury shares, net of purchases and related charges (€6,941 thousand). In 2015, the Group purchased 82,517 treasury shares for a total amount of €829 thousand, accounted for excluding purchase costs (€2 thousand). For these purchases, in accordance with Article 2357 of the Italian Civil Code, the Treasury share reserve, in the amount of €2,453 thousand, was made unavailable by using the Share premium reserve.
OTHER RESERVES
Cash-flow hedge reserveFollowing adoption of IAS 39, changes in the fair value of derivative contracts designated as effective hedging instruments are recognised in accounts directly with Shareholders’ Equity, in the cash-flow hedge reserve. These contracts have been concluded to hedge exposure to the risk of interest rate fluctuations on variable-rate loans (negative by €121 thousand) and amounts are shown net of the tax effect (€29 thousand).
Translation ReserveIn compliance with IAS 21, translation differences arising from translation of the foreign currency financial statements of con-solidated companies into the Group accounting currency are classified as a separate Equity component.
Reserve for exchange rate adjustmentIn application to IAS 21.15, this reserve comprises profit/losses generated by monetary elements which are an integral part of the net investment of foreign managements. In particular, it relates to the effect of exchange rates measurement at year-end for receivables for loans in US Dollars granted to some Group companies by the Parent Company Datalogic S.p.A. and Datalogic Holdings Inc.. For these loans no regulation and/or a defined reimbursement plan are provided not is it deemed probable that they will be reimbursed in the foreseeable future.
Actuarial gains and losses reservePursuant to IAS 19R, this reserve includes actuarial gains and losses, which are now recognised under other components in the comprehensive Income Statement and permanently excluded from the Income Statement.
RETAINED EARNINGS
IAS reserve This reserve was created upon first-time adoption of international accounting standards as at 1 January 2004 (consolidated financial statements for the year ended 31 December 2003) pursuant to IFRS 1.
Profits/losses of previous yearsThis item includes Equity changes occurring in consolidated companies after acquisition date.
DIVIDENDSOn 28 April 2015, the Ordinary Shareholders’ Meeting of Datalogic S.p.A. decided to distribute an ordinary dividend of €0.18 per share (€0.16 in 2014). The overall dividends began to be paid starting from 13 May 2015 and had been paid in full by 31 December.
Explanatory notes to the consolidated financial statements
90

The reconciliation between the Parent Company’s Shareholders’ Equity and net profit and the corresponding consolidated amounts is as shown below:
(€/000) 31 December 2015 31 December 2014
Total Equity Period results Total Equity Period results
Parent Company Shareholders’ Equity and profit 250,417 27,474 223,915 23,647
Difference between consolidated companies' Shareholders’ Equity and their carrying value in the Parent Company's financial statements; effect of equity-based valuation
108,261 76,703 79,786 60,159
Reversal of dividends (63,097) (51,890)
Amortisation of intangible assets "business combination" (5,827) (5,827)
Effect of acquisition under common control (31,733) (31,733)
Elimination of capital gain on sale of business branch (18,665) (18,665)
Effect of eliminating intercompany transactions (11,826) (244) (14,115) (1,499)
Reversal of write-downs and capital gains on Equity investments 6,121 6,121
Sale of know-how (7) (7)
Goodwill impairment (1,395) (1,395)
Other (1,133) (324) (801) 155
Deferred taxes 4,047 35 4,012 285
Group Shareholders' Equity 298,260 40,547 241,291 30,857
NOTE 12. SHORT/LONG-TERM BORROWINGS AND FINANCIAL LIABILITIES
The breakdown of the item, divided by short/long-term classification, is shown in the following table:
(€/000) 31.12.2015 31.12.2014 Change
Long-term financial payables 139,918 89,519 50,399
Short-term financial payables 39,367 75,975 (36,608)
Total financial payables 179,285 165,494 13,791
The breakdown of this item is as detailed below:
(€/000) 31.12.2015 31.12.2014 Change
Bank loans 172,612 163,649 8,963
Other 80 0 80
Payables to factoring companies 6,009 888 5,121
Payables for leasing 539 816 (277)
Bank overdrafts (ordinary current accounts) 45 141 (96)
Total financial payables 179,285 165,494 13,791
The breakdown of changes in the “Bank loans” item as at 31 December 2015 and 31 December 2014 is shown below:
(€/000) 2015 2014
1 January 163,649 227,674
Foreign exchange differences 930 1,754
Increases 139,277 20,454
Repayments (125,263) (46,235)
Decreases for loan repayments (5,981) (39,998)
31 December 172,612 163,649
On 24 February 2015, Datalogic S.p.A. signed a loan agreement with a pool of banks for the amount of €140 million and re-deemed at the same time, previous loans amounting to €126 million.This transaction allowed for an increase in the average life of the financial debt and the reduction in the related charges.
91
Explanatory notes to the consolidated financial statements

The breakdown of the “Bank loans” item by maturity is as follows:
(€/000) 31.12.2015 31.12.2014
Variable rate 151,332 142,167
Due < 1 year 12,815 54,499
Due > 1 year 138,517 87,668
Fixed rate 21,280 21,482
Due < 1 year 20,158 20,201
Due > 1 year 770 729
Due > 5 year 352 552
Total financial payables 172,612 163,649
The breakdown of the “Bank loans” item by currency is as follows:
Valuta 31.12.2015 31.12.2014
Euro 172,612 150,935
US Dollar (USD) - 12,714
Total 172,612 163,649
The fair value of the loans (current and non-current) coincides substantially with their book value.
CovenantsThe companies have been asked to respect certain financial covenants for the following loans, on a semi-annual or annual basis, as summarised in the table below:
Banca Company Currency Outstanding debt Covenant Frequency Reference statements
Mediobanca 1 Datalogic S.p.A. Euro 12,000,000 Ebitda/OFN PFN/Ebitda semi-annual Datalogic Group
Club Deal 2 Datalogic S.p.A. Euro 140,000,000 Ebitda/OFN PFN/Ebitda semi-annual Datalogic Group
Key: PFN = Net Financial Position; OFN= Net Financial Expenses.
As at 31 December 2015 all covenants were respected.
Financial leases
(€/000) 31 December 2015 31 December 2014
Minimum payments Current value of payments
Minimum payments Current value of payments
Within the year 280 260 303 247
After one year but within 5 years 285 279 581 569
> 5 years
Total minimum payments 565 539 885 816
Less interest expenses (26) (69)
Current value of lease costs 539 539 816 816
Explanatory notes to the consolidated financial statements
92

NOTE 13. DEFERRED TAXES
Deferred tax assets and liabilities stem both from positive items already recognised in the Income Statement and subject to deferred taxation under current tax regulations and temporary differences between consolidated balance-sheet assets and liabilities and their relevant taxable value.
In provisioning deferred tax assets, each single Group company critically assessed the existence of future recoverability as-sumptions of these assets, based on updated strategic plans, complete with related tax plans.
Below we show the main items forming deferred tax assets and deferred tax liabilities and changes in them during the year.
Deferred tax assets(€/000)
Losses and receivables
on taxes paid abroad
Adjustment on exchange
rates
Depreciation and
Amortisation
Asset write-downs
Provisions Operations deriving from
acquisitions
Others IP redemption Consolidation adjustments
Total
01.01.2015 15,191 2,434 306 520 9,804 2,769 302 7,221 2,080 40,627
Opening restatement 151 (151) (126) 501 31 406
01.01.2015 Reclassified 15,342 2,283 180 520 9,804 3,270 333 7,221 2,080 41,033
Provisioned in (released from) Income Statement
6,240 580 (129) (14) 484 (1,194) (241) (2,491) (680) 2,555
Provisioned in (released from) Shareholders’ Equity
234 (43) 368 559
Exchange rate differences 1,875 95 31 754 295 5 61 3,116
Reclassifications 432 2 9 1 3 (92) (259) 96
31.12.2015 23,889 3,194 91 506 11,043 2,374 (38) 4,730 1,570 47,359
Deferred tax liabilities(€/000)
Reserve for prevision
losses
Adjustment on exchange rates
Depreciationand
Amortisation
Provisions Operations deriving from
acquisitions
Others IAS Reserves Consolidation adjustments
Total
01.01.2015 16 4,018 4,510 1,577 9,505 1,522 315 185 21,648
Opening restatement 429 403 (426) 406
01.01.2015 Reclassified 16 4,018 4,939 1,577 9,908 1,096 315 185 22,054
Provisioned in (released from) Income Statement
598 (1,185) (284) (1,369) (54) (341) (2,635)
Provisioned in (released from) Shareholders’ Equity
2,490 (30) 2,460
Exchange rate differences 295 60 1,008 (6) 1,357
Reclassifications 57 (74) (47) (64)
31.12.2015 16 7,106 4,106 1,279 9,547 959 315 (156) 23,172
NOTE 14. POST-EMPLOYMENT BENEFITS
The breakdown of changes in the “Post-employment benefits” item as at 31 December 2015 and 31 December 2014 is shown below:
(€/000) 2015 2014
1 January 7,201 7,049
Amount allocated in the period 1,451 1,710
Uses (1,183) (838)
Other movements (45) 93
Social security receivables for the employee severance indemnity reserve (610) (813)
31 December 6,814 7,201
93
Explanatory notes to the consolidated financial statements

NOTE 15. PROVISIONS FOR RISKS AND CHARGES
The breakdown of the “provisions for risks and charges” item was as follows:
(€/000) 31.12.2015 31.12.2014 Change
Short-term provisions for risks and charges 8,341 8,440 (99)
Long-term provisions for risks and charges 15,187 11,161 4,026
Total 23,528 19,601 3,927
Below we show the detailed breakdown of and changes in this item:
(€/000) 31.12.2014 Increases (Uses) and (Releases)
Transfers Foreign 31.12.2015
Product warranty provision 9,130 719 (774) 700 9,775
Provision for management incentive scheme 4,906 3,535 8,441
"Stock rotation" provision 2,557 116 192 2,865
Other 3,008 484 (936) (266) 157 2,447
Total Provisions for risks and charges 19,601 4,854 (1,710) (266) 1,049 23,528
The “Product warranty provision” covers the estimated cost of repairing products sold as up to 31 December 2015 and cov-ered by periodical warranty; it amounts to €9,775 thousand (of which €6,372 thousand long-term) and is considered sufficient in relation to the specific risk it covers.
The increase in the “Provision for management incentive scheme” is attributable to the estimate on the portion pertaining to the provision for a long-term plan for directors and managers. The “Stock rotation provision”, equal to €2,865 thousand, is related to the ADC Group and Informatics;
The “Other” item mainly comprises:• €1,534 thousand for a possible tax liability related to a company outside the Group;• €314 thousand for agent termination indemnities;• €162 thousand for a pending tax dispute related to some Italian companies;• €266 thousand for legal dispute.
Explanatory notes to the consolidated financial statements
94

NOTE 16. TRADE AND OTHER PAYABLES
This table shows the details of trade and other payables:
(€/000) 31.12.2015 31.12.2014 Change
Trade payables due within 12 months 101,468 91,611 9,857
Third-party trade payables 101,468 91,611 9,857
Payables to associates 84 76 8
Laservall Asia Co. Ltf 82 72 10
Datalogic Automation AB 2 4 (2)
Payables to the Parent Company 0 207 (207)
Hydra S.p.A. 0 207 (207)
Payables to subsidiaries 0 0 0
Payables to related parties 159 273 (114)
Total trade payables 101,711 92,167 9,544
Other payables - current accrued liabilities and deferred income 42,107 38,712 3,395
Other payables - non-current accrued liabilities and deferred income 3,549 3,081 468
Total other payables - accrued liabilities and deferred income 45,656 41,793 3,863
Less non-current portion 3,549 3,081 468
Current portion 143,818 130,879 12,939
The increase in trade payables, equal to €9,544 thousand, is attributable, in the amount of €5,844 thousand, to the exchange rate effect.
OTHER PAYABLES – ACCRUED LIABILITIES AND DEFERRED INCOME
The detailed breakdown of this item is as follows:
(€/000) 31.12.2015 31.12.2014 Change
Other long-term payables 3,549 3,081 468
Other short-term payables: 21,398 20,621 777
Payables to employees 14,790 14,440 350
Payables to pension and social security agencies 4,813 4,400 413
Directors’ remuneration payable 341 430 (89)
Other payables 1,454 1,351 103
VAT liabilities 1,868 1,413 455
Accrued liabilities and deferred income 18,841 16,678 2,163
Total 45,656 41,793 3,863
Payables to employees are the amounts due for wages and salaries and holidays, accrued with respect to staff at balance-sheet date. It is worth noting that this item includes €49 thousand for early retirement incentives related to the reorganisation oc-curred in 2014 (€1,369 thousand as at 31 December 2014) and €872 thousand related to costs for 2015.
95
Explanatory notes to the consolidated financial statements
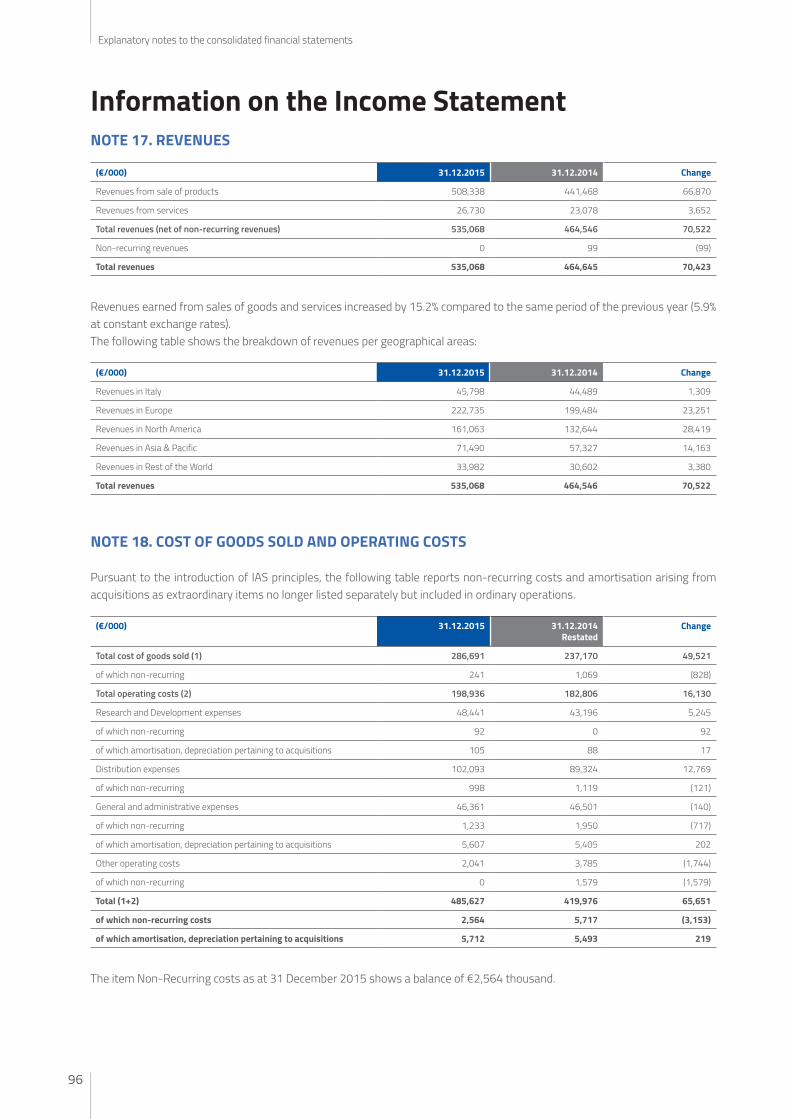
Information on the Income StatementNOTE 17. REVENUES
(€/000) 31.12.2015 31.12.2014 Change
Revenues from sale of products 508,338 441,468 66,870
Revenues from services 26,730 23,078 3,652
Total revenues (net of non-recurring revenues) 535,068 464,546 70,522
Non-recurring revenues 0 99 (99)
Total revenues 535,068 464,645 70,423
Revenues earned from sales of goods and services increased by 15.2% compared to the same period of the previous year (5.9% at constant exchange rates).The following table shows the breakdown of revenues per geographical areas:
(€/000) 31.12.2015 31.12.2014 Change
Revenues in Italy 45,798 44,489 1,309
Revenues in Europe 222,735 199,484 23,251
Revenues in North America 161,063 132,644 28,419
Revenues in Asia & Pacific 71,490 57,327 14,163
Revenues in Rest of the World 33,982 30,602 3,380
Total revenues 535,068 464,546 70,522
NOTE 18. COST OF GOODS SOLD AND OPERATING COSTS
Pursuant to the introduction of IAS principles, the following table reports non-recurring costs and amortisation arising from acquisitions as extraordinary items no longer listed separately but included in ordinary operations.
(€/000) 31.12.2015 31.12.2014Restated
Change
Total cost of goods sold (1) 286,691 237,170 49,521
of which non-recurring 241 1,069 (828)
Total operating costs (2) 198,936 182,806 16,130
Research and Development expenses 48,441 43,196 5,245
of which non-recurring 92 0 92
of which amortisation, depreciation pertaining to acquisitions 105 88 17
Distribution expenses 102,093 89,324 12,769
of which non-recurring 998 1,119 (121)
General and administrative expenses 46,361 46,501 (140)
of which non-recurring 1,233 1,950 (717)
of which amortisation, depreciation pertaining to acquisitions 5,607 5,405 202
Other operating costs 2,041 3,785 (1,744)
of which non-recurring 0 1,579 (1,579)
Total (1+2) 485,627 419,976 65,651
of which non-recurring costs 2,564 5,717 (3,153)
of which amortisation, depreciation pertaining to acquisitions 5,712 5,493 219
The item Non-Recurring costs as at 31 December 2015 shows a balance of €2,564 thousand.
Explanatory notes to the consolidated financial statements
96

The breakdown of this item is as follows:
Item (€/000) Amount Type of cost
1) "Cost of goods sold" 241 early retirement incentives
Total 241
2) "R&D expenses" 92 early retirement incentives
Total 92
3) "Distribution expenses" 688 early retirement incentives
3) "Distribution expenses" 310 commissions
Total 998
4) "General and administrative expenses" 825 early retirement incentives
4) "General and administrative expenses" 408 consulting
Total 1,233
Total non-recurring costs 2,564
These costs mainly resulted from early retirement incentives and consultancy services related to an internal Group reorganisa-tion, as well as to consultancy related to Mergers and Acquisitions.
The amortisation from acquisitions (equal to €5,712 thousand) mainly included under “General and administrative expenses” (€5,607) are comprised of:
(€/000) 31.12.2015 31.12.2014 Change
Acquisition of the PSC group (on 30 November 2006) 2,513 2,099 414
Acquisition of Laservall S.p.A. (on 27 August 2004) 0 221 (221)
Acquisition of Informatics Inc. (on 28 February 2005) 120 602 (482)
Acquisition of Evolution Robotics Retail Inc. (on 1 July 2010) 631 527 104
Acquisition of Accu-Sort Systems Inc. (on 20 January 2012) 2,448 2,044 404
Total 5,712 5,493 219
TOTAL COST OF GOODS SOLD (1)This item increased by 20.88% compared to the same period in 2015. At constant Euro/Dollar exchange rates and net of non-recurring costs, the percentage increase would have been of 7.7%.
TOTAL OPERATING COSTS (2)The operating costs, excluding non-recurring costs and the amortisation inherent in the acquisitions, increased by 10.56% from €172,665 thousand to €190,901 thousand. At constant exchange rates and less extraordinary costs, a remarkably lower in-crease is noted (+2.31%), mainly attributable to distribution and R&D expenses.
In particular:
• “R&D expenses” amounted to €48,441 thousand and increased by €5,136 thousand, net of non-recurring costs, compared to the same period of the previous year (+€1,115 thousand, at constant exchange rates and net of non-recurring costs). This increase is primarily attributable to the increase in payroll & employee benefits, as well as increased expenses for technical advisory services.
• “Distribution expenses” amounted to €102,093 thousand and, net of non-recurring costs, increased by €12,890 thousand with respect to the comparison period. Based on the analysis at constant exchange rates, and net of non-recurring costs, a net increase of €4,997 thousand (+5.67%) is reported, determined by an increase in payroll & employee benefits (+€4,053 thousand) and an increase in costs for travel and accommodation (+€584 thousand) as well as an increase in costs for meet-ings (+€548 thousand) and consultancy services (+€200 thousand).
• “General and administrative expenses” amounted to €46,361 thousand. This item, net of non-recurring costs, increased by €375 thousand, compared to the same period of the previous year, while, at constant exchange rates, and net of non-recur-ring costs reported a decrease of €1,837 thousand compared to the same period of the previous year. At constant exchange rates, and net of non-recurring costs, a decrease is primarily attributable to operating costs (decrease of around €1,900 thousand), especially attributable to consultancy expenses.
97
Explanatory notes to the consolidated financial statements

The detailed breakdown of item “Other operating costs” is as follows:
(€/000) 31.12.2015 31.12.2014 Change
Capital losses on assets 69 39 30
Contingent liabilities 193 78 115
Provisions for doubtful accounts 34 505 (471)
Allocation to the risk reserve 21 1,689 (1,668)
of which non-recurring 0 1,579 (1,579)
Non-income taxes 1,389 1,230 159
Cost charge backs 309 197 112
Other 26 47 (21)
Total 2,041 3,785 (1,744)
BREAKDOWN OF COSTS BY TYPE
The following table provides the details of total costs (cost of goods sold and total operating costs) by type, for the main items:
(€/000) 31.12.2015 31.12.2014 Change
Purchases 208,894 175,422 33,471
Inventory change (4,310) (11,165) 7,039
Payroll & employee benefits 156,394 138,511 17,798
Amortisation, depreciation and write-downs 18,239 16,918 1,321
Goods receipt & shipment 18,018 15,820 2,198
Technical, legal and tax advisory services 9,902 9,434 468
Marketing expenses 9,677 9,290 387
Travel & accommodation 9,299 7,986 1,313
Building expenses 6,599 5,883 717
Repairs 5,514 5,387 127
Material collected from the warehouse 4,893 4,906 (13)
EDP expenses 3,758 3,471 287
Vehicle expenses 3,379 3,595 (216)
Subcontracted work 3,354 2,720 634
Royalties 2,735 2,353 382
Consumables 2,612 2,365 247
Telephone expenses 2,540 2,205 335
Commissions 2,074 1,487 587
Utilities 1,967 1,840 127
Sundry service costs 1,719 1,931 (212)
Meeting expenses 1,717 1,089 628
Directors’ remuneration 1,439 1,783 (344)
Quality certification expenses 1,410 1,461 (51)
Accounts certification expenses 1,114 1,177 (63)
Insurance 1,094 1,001 93
Expenses for plant and machinery and other assets 1,030 763 267
Entertainment expenses 981 1,015 (34)
Training courses for employees 529 428 101
Stationery and printings 362 450 (88)
R&D materials 360 678 (318)
Other 8,334 9,772 (1,442)
Total cost of goods sold and operating costs 485,627 419,976 65,651
Explanatory notes to the consolidated financial statements
98

The increase in item “Travel & accommodation” is primarily related to a higher attendance to exhibitions. At constant exchange rate, the increase is remarkably lower (+€400 thousand).
The increase in item “Meeting expenses” (+€480 thousand, at constant exchange rate), is primarily attributable to important meetings of the sales force.
The item “Marketing expenses”, equal to €9,677 thousand, increased by €387 thousand compared to the same period of 2014, while shows a decrease at constant exchange rates (around -€600 thousand), mainly due to the decrease in Marketing co-participation expenses with trade partners and in advertising expenses, which offsets the increase in costs for exhibitions.
The item “Technical, legal and tax advisory services”, equal to €9,902 thousand (of which €408 thousand are non-recurring), increased with respect to the previous year; nevertheless, this increase is attributable to the exchange rate effect. At constant exchange rates, in fact, this item shows a decrease. At constant exchange rates, technical consulting services linked to R&D projects show an increase.
The item “Commissions”, equal to €2,074 thousand, includes €310 thousand of non-recurring costs, related to a legal dispute still outstanding.
The increase in item “Building expenses” is primarily due to the exchange rate effect; at constant exchange rates, the increase is limited to €259 thousand.
The increase in item “Subcontracted work” is primarily due to the exchange rate effect (+Euro 189 thousand at constant exchange rates).
The “Other” item mainly consists of several costs all of which are lower than €150 thousand.
The detailed breakdown of payroll & employee benefits is as follows:
(€/000) 31.12.2015 31.12.2014 Change
Wages and salaries 121,520 105,409 16,111
Social security charges 21,662 20,205 1,457
Employee severance indemnities 1,544 1,508 36
Retirement and similar benefits 1,350 1,361 (11)
Medium/long-term managerial incentive plan 3,535 2,091 1,444
Other costs 4,927 3,725 1,202
Early retirement incentives 1,856 4,212 (2,356)
Total 156,394 138,511 17,883
The “Wages and salaries” item, equal to €121,520 thousand, includes “Sales commissions and incentives” of €14,917 thousand (€13,762 thousand at constant exchange rates and €12,545 thousand as at 31 December 2014). The increase, at constant ex-change rates, in item “Wages and salaries” (equal to €5,493 thousand) is primarily related to increased in-house R&D activities and the hiring of personnel in the commercial sector.
The “Early retirement incentives” item, equal to €1,856 thousand, includes costs, totalling €1,846 thousand, stated under item “Non-recurring costs and revenues” and result from the re-organisation activities internal to the Group.
NOTE 19. OTHER OPERATING REVENUES
The detailed breakdown of this item is as follows:
(€/000) 31.12.2015 31.12.2014 Change
Miscellaneous income and revenues 1,838 878 960
Rents 69 73 (4)
Capital gains on asset disposals 67 79 (12)
Contingent assets 630 79 551
Grants to Research and Development expenses 823 1,066 (243)
Other 77 64 13
Total 3,504 2,239 1,265
99
Explanatory notes to the consolidated financial statements

The item “Miscellaneous” income and revenues mainly includes revenues for self-manufactured equipment and reimburse-ments from employees for the use of vehicles for the pertaining portion.
The increase in item “Contingent assets” is primarily attributable to some insurance repayments, as well as repayments for the use of payment services with debit cards.
NOTE 20. NET FINANCIAL INCOME (EXPENSES)
(€/000) 31.12.2015 31.12.2014 Change
Financial Income/(expenses) (2,262) (5,823) 3,561
Foreign exchange differences 3,087 357 2,730
Bank expenses (3,304) (2,643) (661)
Other 944 355 589
Total Net Financial Income (expenses) (1,535) (7,754) 6,219
Financial Income was negative by €1,535 thousand, compared to a negative result of €7,754 thousand related to the same period of the previous year, mainly to:• better results in the financial management attributable to the significant decrease in “Interest expenses on bank current
accounts/loans” due to the entering of a new loan agreement with a pool of banks for the amount of €140 million and the redemption, at the same time, of previous loans amounting to €126 million. This transaction allowed for an increase in the average life of the financial debt and the reduction in the related charges;
• a more favourable performance of exchange rate differences, which had a positive increase of €2,730 thousand.
The “Bank expenses” item mainly includes:• the portion pertaining to the upfront fees period, paid upon opening of long-term loans, in the amount of €1,428 thousand,
of which €1,250 thousand are connected with the early redemption of some long-term loans (€996 thousand as at 31 De-cember 2014);
• factoring costs, amounting to €839 thousand (€925 thousand in 2014), related to commissions without recourse.
The “Other” item includes dividends received by the Mandarin fund and the company Idec Corporation and Specialvideo, total-ling €572 thousand.
Profits generated by companies carried at Equity were recognised in the amount of €174 thousand (compared with losses of €25 thousand as at 31 December 2014).
NOTE 21. TAXES
(€/000) 31.12.2015 31.12.2014 Change
Income tax 13,549 7,297 6,252
Substitute tax 2,678 1,074 1,604
Deferred taxes (5,190) (49) (5,141)
Total 11,037 8,322 2,715
The average tax rate comes to 21.4% (21.2% as at 31 December 2014).
Explanatory notes to the consolidated financial statements
100

The reconciliation for 2015 of the nominal tax rate set out in Italian law and the effective rate in the consolidated financial statements is as follows:
(€/000) 2015
Nominal tax rate under Italian law (27.50)%
Regional tax (3.50)%
Non-deductible expenses for IRES (1.00)%
Other effects (0.60)%
Tax on dividend distribution (1.30)%
Recoverable tax losses related to subsidiaries (0.20)%
Cumulative effect of different tax rates applied in foreign countries 11.40%
Effect of the change in rate of IRES tax, It. comp. (0.60)%
Labour cost benefit - IRAP tax 1.90%
Consolidated effective tax rate (21.40)%
NOTE 22. EARNINGS/LOSS PER SHARE
EARNINGS/LOSS PER SHARE
(€/000) 31.12.2015 31.12.2014
Group earnings/(loss) for the period 40,547,000 30,857,000
Average number of shares 58,179,970 58,154,176
Earnings/(Loss) per share 0.6969 0.5306
EPS as at 31 December 2015 was calculated by dividing Group net profit of €40,547 thousand (Group net profit of €30,857 thousand as at 31 December 2014) by the average number of ordinary shares outstanding as at 31 December 2015, equal to 58,179,970 shares (58,154,176 as at 31 December 2014).
Notice of Auditing firm’s feesPursuant to article 149-duodecies of the Issuer Regulation, implementing Legislative Decree 58 of 24 February 1998, the following is the summary schedule of fees pertaining to the year 2015 provided by the independent auditors. The table below shows the fees for the audit activity and other services, mainly including due diligence and integration processes following acquisitions and the Group reorganisation.
(€/000) 2015
Fees for services supplied by the Auditing Firm to the Parent Company and to the subsidiaries
Datalogic S.p.A. - auditing 162
Italian subsidiaries - auditing 240
Foreign subsidiaries - auditing 415
Total auditing 817
Non-auditing services 11
Total 828
101
Explanatory notes to the consolidated financial statements

Transactions with subsidiaries that are not fully consolidated, associates and related partiesFor the definition of “Related parties”, see both IAS 24, approved by EC Regulation 1725/2003, and the Procedure for Transac-tions with Related Parties approved by the Board of Directors on 4 November 2010 (finally amended on 24 July 2015), and that is available on the Company’s internet site www.datalogic.com.
The Parent Company of the Datalogic Group is Hydra S.p.A..
Infragroup transactions are executed as part of the ordinary operations and at arm’s length conditions. Furthermore, there are other relationships with related parties, always carried out as part of the ordinary operations and at arm’s length conditions, chiefly with parties that control the Parent Company, or with individuals that carry out the coordination and management of Datalogic S.p.A.
Related-party transactions refer chiefly to commercial and securities transactions (instrumental and non-instrumental prem-ises for the Group under lease or leased to the Parent Company) as well as to companies joining the scope of tax consolidation. None of these assumes particular economic or strategic importance for the Group since receivables, payables, revenues and costs to the related parties are not a significant proportion of the total amount of the financial statements.
Pursuant to Article 5, par. 8, of the Consob Regulations, it should be noted that, over the period 1 January 2015 to 31 December 2015, the Company’s Board of Directors did not approve any relevant transaction, as set out by Article 3, par. 1, lett. b) of the Consob Regulations, or any transaction with minority related parties that had a significant impact on the Group’s equity position or profit/(loss).
Explanatory notes to the consolidated financial statements
102

Related parties (€/000)
Hydra S.p.A. (Parent
Company)
Hydra Immobiliare
and Aczon
Non-consolidated Automation
Group companies
Studio Associato
Caruso
Natural person Laservall Asia Co. Ltd
Total30.12.15
Parent Company
company controlled by Chairman of
BoD
associates company controlled by a company Body
member
Close relative of a Director
associated company
Equity investments 0 0 76 0 0 1,906 1,982
IA Group 76 1,906 1,982
Trade receivables - accrued income and prepaid expenses 0 84 906 0 0 541 1,531
IA Group 0 84 754 0 0 541 1,379
ADC Group 152 152
Receivables pursuant to tax consolidation 7,383 0 0 0 0 0 7,383
Datalogic IPTech S.r.l. 6,786 6,786
Datalogic S.p.A. 597 597
Liabilities pursuant to tax consolidation 4,781 0 0 0 0 0 4,781
Datalogic ADC 2,525 2,525
Datalogic Automation S.r.l. 2,256 2,256
Trade payables 0 12 2 147 0 82 243
Datalogic S.p.A. 1 94 95
Datalogic IPTech S.r.l. 9 9
ADC S.r.l. 7 23 30
Automation Group 4 2 21 82 109
Financial payables 0 0 0 0 0 0 0
Sales / service expenses 0 659 75 335 5 335 1,409
Datalogic S.p.A. 71 188 259
Datalogic IPTech S.r.l. 19 19
ADC Group 89 12 84 5 190
Automation Group 499 63 44 335 941
Commercial revenues 0 7 3,376 0 0 2,285 5,668
ADC Group 217 217
Automation Group 7 3159 2,285 5,451
Financial Income 0 0 16 0 0 0 16
Datalogic Automation S.r.l. 16 16
Profits from associates 0 0 0 0 0 174 174
Automation Group 174 174
Number of employees 31.12.2015 31.12.2014 Change
Industrial Automation Group 824 799 25
Automatic Data Capture Group 1,503 1,456 47
Corporate Group 137 116 21
Informatics 103 99 4
Total 2,567 2,470 97
The Chairman of the Board of Directors(Mr. Romano Volta)
103
Explanatory notes to the consolidated financial statements


Parent Companyfinancial statements

Parent Company financial statements
106
Statement of Financial PositionASSETS (€/000) Notes 31.12.2015 31.12.2014
A) Non-current assets (1+2+3+4+5+6+7+8) 236,494 236,347
1) Tangible assets 1 21,588 21,584
Land 1 2,466 2,466
Buildings 1 15,766 15,468
Other assets 1 3,356 3,396
Assets in progress and payments on account 1 254
2) Intangible assets 2 2,570 2,414
Goodwill
Development costs 2
Others 2 2,570 2,414
3) Equity investments in affiliates 3 174,599 174,599
4) Financial assets 5 35,717 24,132
Equity investments 5 4,624 3,481
Securities 5 361 361
Commercial foreign exchange differences 5 30,732 20,290
5) Loans to subsidiaries 9 0 11,484
6) Trade and other receivables 7 172 173
7) Deferred tax assets 13 1,848 1,961
B) Current assets (9+10+11+12+13+14+15) 355,752 308,757
8) Inventories 0 0
Raw and ancillary materials and consumables
Work in progress and semi-finished products
Finished products and goods
9) Commissioned work in progress 0 0
10) Trade and other receivables 7 9,285 6,691
Trade receivables 7 8,333 5,923
due within 12 months 7 15 13
after 12 months
receivables from affiliates
receivables from subsidiaries 7 8,318 5,910
receivables from the Parent Company 7
receivables from related parties
Other receivables - accrued income and prepaid expenses 7 952 768
of which other receivables from subsidiaries 7
11) Tax receivables 8 1,803 3,728
of which to the Parent Company 8 597 2,249
12) Financial assets 5 0 0
Securities 5
13) Loans to subsidiaries 9 268,200 244,737
9 268,200 244,737
14) Financial assets - Derivative instruments 6 0 0
15) Cash and cash equivalents 10 76,464 53,601
Total assets (A+B) 592,246 545,104

107
Parent Company financial statements
Statement of Financial PositionLIABILITIES (€/000) Notes 31.12.2015 31.12.2014
A) Total Shareholders' Equity (1+2+3+4+5) 11 250,417 223,915
1) Share capital 11 146,659 147,490
Share capital 11 30,392 30,392
Treasury shares 11 4,488 5,319
Share premium reserve 11 109,326 110,155
Treasury share reserve 11 2,453 1,624
2) Reserves 11 504 108
Employee severance indemnity discounting reserves 11 88 80
Consolidation reserve 11
Translation reserve/(Loss) 11
Cash-flow hedge reserve 11 (92) (190)
Valuation reserve for financial assets held for sale 11 508 218
3) Retained earnings/losses 75,780 52,670
Profits /(Losses) of previous years 11 28,631 16,637
Merger surplus reserve of Datalogic Real Estate 204 204
Capital contribution reserve, not subject to taxation 11 958 958
Commercial foreign exchange differences 11 5,917 4,735
Temporary reserve for exchange rate adjustment 11 16,443 6,509
Capital contribution reserve 11 15,204 15,204
IAS transition reserve 11 8,423 8,423
Interest and bank expenses 27,474 23,647
B) Non-current liabilities (6+7+8+9+10+11) 12 150,968 97,101
5) Financial payables 12 138,789 88,225
of which with related parties
Raw and ancillary materials and consumables
6) Financial liabilities - Derivative instruments (*) 6 114 262
7) Tax payables 0 0
8) Deferred tax liabilities 13 8,469 5,659
9) Post-employment benefits 14 527 593
10) Provisions for risks and charges 15 3,069 2,362
11) Other liabilities 0 0
C) Current liabilities (12+13+14+15+16) 190,861 224,088
12) Trade and other payables 16 8,909 7,596
Trade payables 16 3,239 4,073
due within 12 months 16 2,856 3,645
after 12 months
payables to subsidiaries 16 382 219
payables to the Parent Company 1 207
payables to related parties 16 2
Other payables – accrued liabilities and deferred income 16 5,670 3,523
other payables from subsidiaries 2,440 134
13) Tax payables 17 447 431
14) Provisions for risks and charges 77 114
15) Financial liabilities - Derivative instruments 6 6 0
16) Short-term financial payables 12 181,422 215,947
of which to related parties 148,274 141,209
Total liabilities (A+B+C) 592,246 545,104

Parent Company financial statements
108
Statement of Income(€/000) Notes 31.12.2015 31.12.2014
1) Total revenues 18 21,427 18,390
Revenues from sale of products 18
Revenues from services 18 21,427 18,390
2) Cost of goods sold 19 1,681 46
Gross Profit (1-2) 19,746 18,344
3) Other operating revenues 20 607 740
4) R&D expenses 19 430 1,357
5) Distribution expenses 19 814 396
6) General and administrative expenses 19 16,538 17,437
of which non-recurring costs 486 790
7) Other operating expenses 19 204 299
Total operating costs (4+5+6+7) 17,986 19,489
Commercial foreign exchange differences 2,367 (405)
8) Financial Income 21 43,059 40,982
9) Financial expenses 21 15,038 15,879
Net financial income (expenses) (8-9) 28,021 25,103
Pre-tax Profit/(Loss) 30,388 24,698
Taxes 22 2,914 1,051
Net Profit/(Loss) for the period 27,474 23,647
Statement of Comprehensive Income(€/000) Notes 31.12.2015 31.12.2014
Net Profit/(Loss) for the period 27,474 23,647
Other components of the Statement of Comprehensive Income:
Profit/(loss) on Cash Flow Hedges 11 98 71
of which tax effect (43) (27)
Adjustment on exchange rates 11 9,934 9,757
of which tax effect (2,723) (3,701)
Profit/(Loss) on exchange rate adjustments for financial assets available for sale 11 290 218
of which tax effect 76 (83)
Total other components of the Statement of Comprehensive Income which will be restated under profit/(loss) for the year 10,322 10,046
Actuarial gains/(losses) on defined-benefit plans 11 8 0
of which tax effect 8 0
Total other components of the Statement of Comprehensive Income which will be restated under profit/(loss) for the year 8 0
Commercial foreign exchange differences 10,330 10,046
Comprehensive Net Profit/(Loss) for the period 37,804 33,693

109
Parent Company financial statements
Statement of Cash Flow(€/000) Notes 31.12.2015 31.12.2014
Pre-tax profit 30,388 24,698
Depreciation of tangible assets and amortisation of intangible assets 1, 2 1,672 1,558
Change in employee benefits reserve 14 (66) (190)
Provision to the write-down reserve
Net financial expenses/(income) including exchange rate differences 21 (28,021) (25,103)
Adjustments to value of financial assets
Cash flow from operations before changes in Working Capital 3,973 963
Change in trade receivables (net of provisions) 7 (2,410) (1,693)
Change in final inventories - -
Change in other current assets 7 (184) 59
Other medium-/long-term assets 5 (10,441) (20,291)
Change in trade payables 16 (834) 39
Change in other current liabilities 16 2,147 (1,994)
Other medium/long-term liabilities - -
Change in provisions for risks and charges 15 670 1,967
Commercial foreign exchange differences - -
(7,079) (20,950)
Change in tax 13, 17, 22 1,950 3,284
Foreign exchange effect of tax -
Interest and bank expenses 21 3,393 (1,127)
Cash flow generated from operations (A) (1,736) (18,793)
(Increase)/Decrease in intangible assets 1 (852) (358)
Raw and ancillary materials and consumables 2 (980) (696)
Change in Equity investments 5 (540) 188
Changes generated by investment activity (B) (2,372) (866)
Change in LT/ST financial assets and liabilities 9 (12,582) (24,745)
Change in short-term and medium/long-term financial payables 12, 6 15,897 (33,297)
Financial foreign exchange differences 3,619 2,806
Purchase of treasury shares 11 (831) 10,490
Changes in reserves 11 10,330 10,046
Collection/(Payment) of dividends 21, 11 10,538 14,073
Cash flow generated (absorbed) by financial assets (C) 26,971 (20,627)
Net increase (decrease) in available cash (A+B+C) 22,863 (40,286)
Net cash and cash equivalents at beginning of period 10 53,601 93,887
Net cash and cash equivalents at end of period 10 76,464 53,601

Parent Company financial statements
110
Changes in Shareholders’ EquityDescription (€/000) Share
capital Treasury
shares Total share
capital
Other reservers Profits of previous years Profit for the year
Total Shareholders’
Equity Cash-flow
hedge reserve Valuation
reserve for financial assets
held for sale
Severance indemnity
discounting reserves
Total other reserves
Earnings carried
forward
Merger surplus
Capital contribution
reserve
Legal reserve Reserve for exchange rate
adjustment
IAS reserve Total
01.01.2014 30,392 106,608 137,000 (261) - 80 (181) 34,618 204 958 4,389 (3,248) 8,423 45,344 6,921 189,084 Allocation of earnings - - 6,575 346 6,921 (6,921) -Dividends (9,352) (9,352) (9,352)Increase in share capital - - - -Translation reserve - - - -Change in IAS reserve - - - -Sale/purchase of treasury shares 10,490 10,490 - - - 10,490 Cash flow hedge adjustment - 71 71 - 71 Severance indemnity provision adjustment - - -
Capital contribution reserve - - - - -Cancellation of treasury shares - - - - - -Other movements - 218 218 9,757 9,757 9,975 Profit/(Loss) as at 31.12.14 - - - 23,647 23,647 31.12.2014 30,392 117,098 147,490 (190) 218 80 108 31,841 204 958 4,735 6,509 8,423 52,670 23,647 223,915
Description (€/000) Share capital
Treasury shares
Total share
capital
Other reservers Profits of previous years Profit for the year
Total Shareholders’
Equity Cash-flow
hedge reserve Valuation
reserve for financial assets
held for sale
Severance indemnity
discounting reserves
Total other reserves
Earnings carried
forward
Merger surplus
Capital contribution
reserve
Legal reserve Reserve for exchange rate
adjustment
IAS reserve Total
01.01.2015 30,392 117,098 147,490 (190) 218 80 108 31,841 204 958 4,735 6,509 8,423 52,670 23,647 223,915 Allocation of earnings - - 22,465 1,182 23,647 (23,647) -Dividends (10,471) (10,471) (10,471)Increase in share capital - - - -Translation reserve - - - -Change in IAS reserve - - - -Sale/purchase of treasury shares (831) (831) - - - (831)Cash flow hedge adjustment - 98 98 - 98 Severance indemnity provision adjustment - - -
Capital contribution reserve - - - - -Cancellation of treasury shares - - - - - -Other movements - 290 8 298 9,934 9,934 10,232 Profit/(Loss) as at 31.12.15 - - - 27,474 27,474 31.12.2015 30,392 116,267 146,659 (92) 508 88 504 43,835 204 958 5,917 16,443 8,423 75,780 27,474 250,417

111
Parent Company financial statements
Changes in Shareholders’ EquityDescription (€/000) Share
capital Treasury
shares Total share
capital
Other reservers Profits of previous years Profit for the year
Total Shareholders’
Equity Cash-flow
hedge reserve Valuation
reserve for financial assets
held for sale
Severance indemnity
discounting reserves
Total other reserves
Earnings carried
forward
Merger surplus
Capital contribution
reserve
Legal reserve Reserve for exchange rate
adjustment
IAS reserve Total
01.01.2014 30,392 106,608 137,000 (261) - 80 (181) 34,618 204 958 4,389 (3,248) 8,423 45,344 6,921 189,084 Allocation of earnings - - 6,575 346 6,921 (6,921) -Dividends (9,352) (9,352) (9,352)Increase in share capital - - - -Translation reserve - - - -Change in IAS reserve - - - -Sale/purchase of treasury shares 10,490 10,490 - - - 10,490 Cash flow hedge adjustment - 71 71 - 71 Severance indemnity provision adjustment - - -
Capital contribution reserve - - - - -Cancellation of treasury shares - - - - - -Other movements - 218 218 9,757 9,757 9,975 Profit/(Loss) as at 31.12.14 - - - 23,647 23,647 31.12.2014 30,392 117,098 147,490 (190) 218 80 108 31,841 204 958 4,735 6,509 8,423 52,670 23,647 223,915
Description (€/000) Share capital
Treasury shares
Total share
capital
Other reservers Profits of previous years Profit for the year
Total Shareholders’
Equity Cash-flow
hedge reserve Valuation
reserve for financial assets
held for sale
Severance indemnity
discounting reserves
Total other reserves
Earnings carried
forward
Merger surplus
Capital contribution
reserve
Legal reserve Reserve for exchange rate
adjustment
IAS reserve Total
01.01.2015 30,392 117,098 147,490 (190) 218 80 108 31,841 204 958 4,735 6,509 8,423 52,670 23,647 223,915 Allocation of earnings - - 22,465 1,182 23,647 (23,647) -Dividends (10,471) (10,471) (10,471)Increase in share capital - - - -Translation reserve - - - -Change in IAS reserve - - - -Sale/purchase of treasury shares (831) (831) - - - (831)Cash flow hedge adjustment - 98 98 - 98 Severance indemnity provision adjustment - - -
Capital contribution reserve - - - - -Cancellation of treasury shares - - - - - -Other movements - 290 8 298 9,934 9,934 10,232 Profit/(Loss) as at 31.12.15 - - - 27,474 27,474 31.12.2015 30,392 116,267 146,659 (92) 508 88 504 43,835 204 958 5,917 16,443 8,423 75,780 27,474 250,417


Explanatory notes to the Parent Companyfinancial statements

Explanatory Notes to the financial statements
114
IntroductionDatalogic S.p.A. (hereinafter “Datalogic” or the “Company”) is a joint-stock company listed on the STAR segment of Borsa Italiana, with its registered office at via Candini, 2 Lippo di Calderara di Reno (Bo).
The Company is a subsidiary of Hydra S.p.A., also based in Bologna and controlled by the Volta family.These financial statements were prepared by the Board of Directors on 4 March 2016.
Presentation and content of the financial statementsThe Company’s financial statements have been prepared in compliance with the international accounting standards (IAS/IFRS) issued by the IASB (International Accounting Standards Board) and endorsed by the European Union, pursuant to European Regulation 1725/2003 and subsequent amendments, with all the interpretations of the International Financial Reporting Interpre-tations Committee (“IFRIC”), formerly the Standing Interpretations Committee (“SIC”), endorsed by the European Commission at the date of approval of the draft financial statements by the Board of Directors and contained in the relative EU Regulations published at this date, and in compliance with the provisions of Consob Regulation 11971 of 14 May 1999 and subsequent amendments.
The financial statements for the year ended 31 December 2015 consist of the Statement of Financial Position, Income Statement, Statement of Comprehensive Income, Statement of Changes in Shareholders’ Equity, Cash Flow Statement and Explanatory Notes.We specify that, in the Statement of Financial Position, assets and liabilities are classified according to the “current/non-current” criterion, with specific separation of assets and liabilities held for sale.Current assets, which include cash and cash equivalents, are those set to be realised, sold or used during the Company’s normal operational cycle or in the 12 months following the reporting date; current liabilities are those whose extinction is envisaged during the company’s normal operating cycle or in the 12 months after the reporting date.The Income Statement reflects analysis of costs grouped by function as this classification was deemed more meaningful for com-prehension of the Company’s business result.The Statement of Comprehensive Income presents the components that determine gain/(loss) for the period and the costs and revenues reported directly under Shareholders’ Equity for transactions other than those set up with shareholders.The Cash Flow Statement is presented using the indirect method.The statement of changes in Shareholders’ Equity analytically details the changes occurring in the financial year and in the previous financial year.In preparing the financial statements, the historic cost principle has been adopted for all assets and liabilities except for some tangible assets in the “land and buildings” category, which were revalued on transition to IFRS, as described later in this document, and some financial assets available for sale (AFS) for which the fair value principle is applied. Preparation of IFRS-compliant financial statements requires the use of some estimates. Reference should be made to the section describing the main estimates made in these financial statements.
These financial statements are drawn up in thousands of Euro, which is the Group’s “functional” and “presentation” currency as envisaged by IAS 21, unless otherwise indicated.

115
Explanatory Notes to the financial statements
Accounting policies and standards appliedBelow we indicate the policies adopted for preparation of the Company’s financial statements as at 31 December 2015.
PROPERTY, PLANT AND EQUIPMENT (IAS 16)Owned tangible assets are initially recognised at the cost of contribution, purchase, or in-house construction. The cost comprises all directly attributable costs necessary to make the asset available for use (including, when significant and in the presence of ef-fective obligations, the present value of the estimated costs for decommissioning and removal of the asset and for reinstatement of the location), net of trade discounts and allowances.
Some tangible assets belonging to the Land and Buildings categories, in line with IAS 16 provisions, were measured at fair value (market value) as at 31 January 2004 (IFRS transition date) and this value was used as the deemed cost. As allowed by IFRS 1, fair value has been calculated on the basis of valuation appraisals performed by independent external consultants. The cost of build-ings is depreciated net of the residual value estimated as the realisation value obtainable via disposal at the end of the building’s useful life.
Costs incurred after purchase (maintenance and repair costs and replacement costs) are recognised in the asset’s carrying value, or are recognised as a separate asset, only if it is thought likely that the future economic benefits associated with the asset will be enjoyed and the asset’s cost can be reliably measured. Maintenance and repair costs or replacement costs that do not have the above characteristics are recognised in the Income Statement in the year in which they are borne.
Tangible assets are depreciated on a straight-line basis each year - starting from the time when the asset is available for use, or when it is potentially able to provide the economic benefits associated with it - according to economic/technical rates determined according to assets’ residual possibility of use and taking into account the month when they became available for use in the first year of utilisation.Land is considered to be an asset with an indefinite life and therefore not subject to depreciation.
The depreciation rates applied are as follows:
Asset category Annual depreciation rates
Property
Buildings 2% - 3.3%
Land 0%
Plant and equipment:
Automatic operating machines 20% - 14.29%
Furnaces and appurtenances 14%
Generic/specific production plant 20% - 10%
Other assets:
Plant pertaining to buildings 8.33% - 10% - 6.67%
Lightweight constructions 10% - 6.67% - 4%
Production equipment & electronic instruments 20% - 10%
Moulds 20%
Electronic office machinery 33% - 20% - 10%
Office furniture and fittings 10% - 6.67% - 5%
Cars 25%
Freight vehicles 14%
Trade show & exhibition equipment 11% - 20%
Improvements to third-party assets Contract duration
If, regardless of the depreciation already posted, enduring impairment of value emerges, the asset is written down; if the reasons for devaluation disappear in later years, the original value is reinstated. The residual value and useful life of assets are renewed at least at each year-end in order to assess any significant changes in value.
Explanatory Notes to the financial statements
116
Gains and losses on disposals are calculated by comparing the selling price with net carrying value. The amount thus determined is recognised in the Income Statement.
ASSETS HELD UNDER FINANCE LEASE CONTRACTS (IAS 17)Assets held under finance lease contracts are those non-current assets for which the Company has assumed all the risks and benefits connected with ownership of the asset. Such assets are measured at the lower of fair value and present value of lease instalments at the time of contract signature, net of cumulative depreciation and write-downs. Financial lease instalments are recorded as described in IAS 17; specifically, each instalment is subdivided into principal and interest. The sum of the portions of principal payable at the reporting date is recorded as a financial liability; the portions of interest are recorded in the Income State-ment each year until full repayment of the liability.
INTANGIBLE ASSETS (IAS 38)Intangible assets are recognised under assets in the Statement of Financial Position when it is likely that use of the asset will generate future economic benefits and when the asset’s costs can be reliably calculated. They are initially recognised at the value of contribution or at acquisition or production cost, inclusive of any ancillary costs.Gains and losses on disposals are calculated by comparing the selling price with net carrying value. The amount thus determined is recognised in the Income Statement.
RESEARCH AND DEVELOPMENT EXPENSESAs required by IAS 38, research costs are entered in the Income Statement at the time when the costs are incurred.Development costs for projects concerning significantly innovative products or processes are capitalised only if it is possible to demonstrate:• the technical possibility of completing the intangible asset in such a way as to make it available for use or sale;• the intention of completing the intangible assets for use or sale;• the ability to use or sell the intangible asset;• the ability to reliably measure the cost attributable to the intangible asset during its development;• the availability of adequate technical, financial or other resources to complete the intangible asset’s development and for its
use or sale;• how the intangible asset will generate probable future economic benefits.
In the absence even of just one of the above requirements the costs in question are fully recognised in the Income Statement when they are borne.Development costs have a finite useful life and are capitalised and amortised on a straight-line basis from the start of the product’s commercial production for a period equal to the useful life of the products to which they relate, estimated to be five years.
OTHER INTANGIBLE ASSETSOther intangible assets mainly consist of software used under licence, valued at purchase cost.These assets are considered to be intangible assets of finite duration and are amortised over their presumable useful life (see the next table).
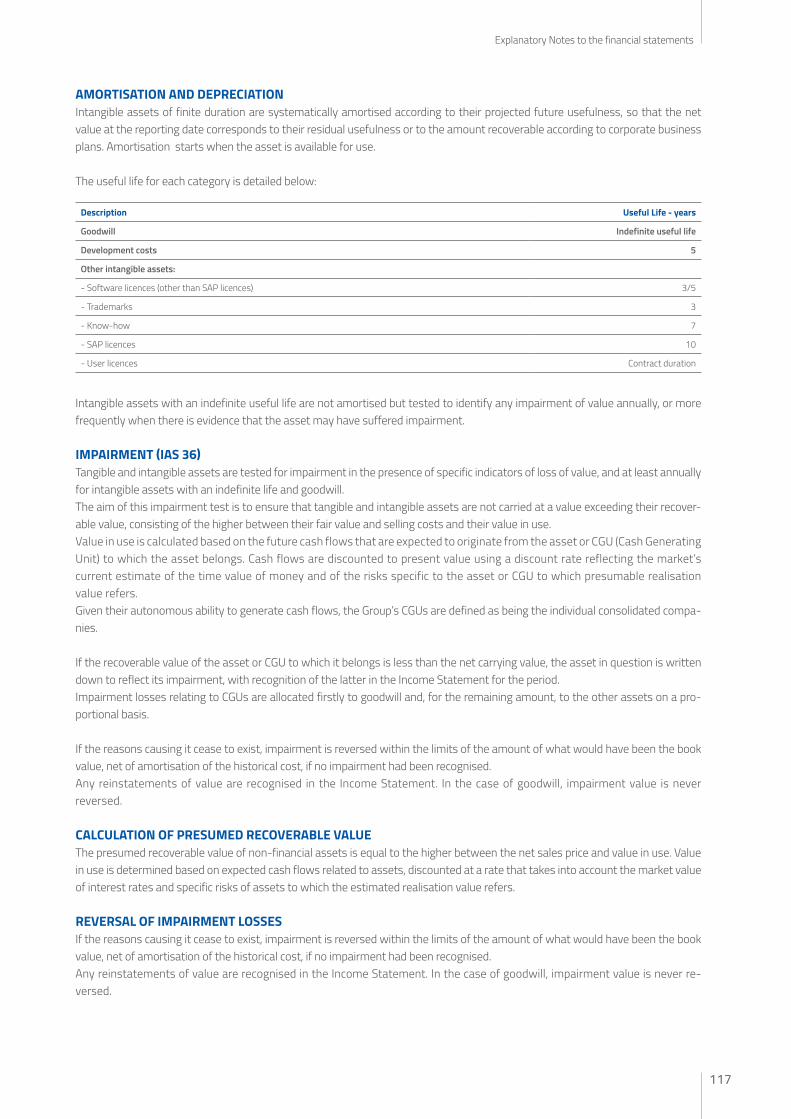
117
Explanatory Notes to the financial statements
AMORTISATION AND DEPRECIATIONIntangible assets of finite duration are systematically amortised according to their projected future usefulness, so that the net value at the reporting date corresponds to their residual usefulness or to the amount recoverable according to corporate business plans. Amortisation starts when the asset is available for use.
The useful life for each category is detailed below:
Description Useful Life - years
Goodwill Indefinite useful life
Development costs 5
Other intangible assets:
- Software licences (other than SAP licences) 3/5
- Trademarks 3
- Know-how 7
- SAP licences 10
- User licences Contract duration
Intangible assets with an indefinite useful life are not amortised but tested to identify any impairment of value annually, or more frequently when there is evidence that the asset may have suffered impairment.
IMPAIRMENT (IAS 36)Tangible and intangible assets are tested for impairment in the presence of specific indicators of loss of value, and at least annually for intangible assets with an indefinite life and goodwill.The aim of this impairment test is to ensure that tangible and intangible assets are not carried at a value exceeding their recover-able value, consisting of the higher between their fair value and selling costs and their value in use.Value in use is calculated based on the future cash flows that are expected to originate from the asset or CGU (Cash Generating Unit) to which the asset belongs. Cash flows are discounted to present value using a discount rate reflecting the market’s current estimate of the time value of money and of the risks specific to the asset or CGU to which presumable realisation value refers.Given their autonomous ability to generate cash flows, the Group’s CGUs are defined as being the individual consolidated compa-nies.
If the recoverable value of the asset or CGU to which it belongs is less than the net carrying value, the asset in question is written down to reflect its impairment, with recognition of the latter in the Income Statement for the period.Impairment losses relating to CGUs are allocated firstly to goodwill and, for the remaining amount, to the other assets on a pro-portional basis.
If the reasons causing it cease to exist, impairment is reversed within the limits of the amount of what would have been the book value, net of amortisation of the historical cost, if no impairment had been recognised.Any reinstatements of value are recognised in the Income Statement. In the case of goodwill, impairment value is never reversed.
CALCULATION OF PRESUMED RECOVERABLE VALUEThe presumed recoverable value of non-financial assets is equal to the higher between the net sales price and value in use. Value in use is determined based on expected cash flows related to assets, discounted at a rate that takes into account the market value of interest rates and specific risks of assets to which the estimated realisation value refers.
REVERSAL OF IMPAIRMENT LOSSESIf the reasons causing it cease to exist, impairment is reversed within the limits of the amount of what would have been the book value, net of amortisation of the historical cost, if no impairment had been recognised.Any reinstatements of value are recognised in the Income Statement. In the case of goodwill, impairment value is never re-versed.

Explanatory Notes to the financial statements
118
EQUITY INVESTMENTS IN AFFILIATESEquity investments in subsidiaries, included in the consolidated financial statements, are disclosed based on IAS 27, by using the cost method, net of impairments.
EQUITY INVESTMENTS IN ASSOCIATESEquity investments are classified under non-current assets and are valued at Equity, pursuant to IAS 28. The portion of profits or losses resulting from the application of this method is indicated in a specific item of the Income Statement.
OTHER EQUITY INVESTMENTSEquity investments in other companies are classified as available-for-sale financial instruments, according to the definition estab-lished in IAS 39, although the Company has not expressed an intention to sell these investments, and they are valued at fair value on the reporting date.
FINANCIAL ASSETS (IAS 39)In accordance with IAS 39, the Company classifies its financial assets in the following categories:
Financial assets at fair value with contra entry in the Income Statement: these are financial assets acquired primarily with the intention of making a profit from short-term price fluctuations and designated as such from the outset; they are recognised at fair value and any changes during the period are recognised in the Income Statement. Within the Group this category includes securi-ties classified among current assets.
Loans and receivables: they are financial assets other than derivatives with a fixed or calculable payment flow and which are not listed in an active market. They are recognised according to the amortised cost criterion using the effective interest rate method. They are classified as “current assets”, apart from those due after 12 months, which are classified as non-current assets. Within the Group this category includes trade receivables, other receivables and cash.
Available for sale financial assets: these are financial assets other than derivatives, which are not classified in other categories; they are valued at fair value and related changes are entered in an Equity reserve. They are classified under non-current assets, unless they are intended to be sold within 12 months. Within the Group this category includes Equity investments in other com-panies and securities.
The fair value of listed securities is based on current market prices. If a financial asset’s market is not active, the Company es-tablishes fair value by using recent transactions taking place close to the reporting date or by referring to other instruments of substantially the same kind or using discounted cash-flow (DCF) models. In some circumstances, the Company does not have sufficient information to calculate the fair value of these financial assets. In this case, they are maintained at cost. A financial asset (or, where applicable, the portion of a financial asset or part of a group of similar financial assets) is removed from the financial statements when:• the rights to receive the cash flows from the asset have been extinguished;• the Company has transferred the right to receive cash flows from the asset or has assumed the contractual obligation to pay
them to a third party in their entirety and without delay and: (a) has transferred essentially all the risks and benefits of ownership of the financial asset or (b) has not transferred or essentially held all the risks and benefits of the asset, but has transferred control of the asset.
Financial hedging instruments: the Company holds derivative financial instruments to hedge exposure to foreign exchange or interest rate risk. In accordance with the rules of the Risk Policy approved by the Board of Directors, the Company does not have any speculative financial instruments. Consistently with the approach established by IAS 39, hedging instruments are accounted for using the hedge-accounting approach if all the following conditions are met:• at the inception of a hedge, there is formal documentation of the hedging relationship, of the entity’s risk management objec-
tives, and of the strategy for undertaking the hedge;• the hedge is expected to be highly effective in offsetting changes in fair value (fair value hedge) or in cash flows (Cash Flow
Hedge) attributable to the risk hedged;• for Cash Flow Hedges, a forecast transaction that is hedged must be highly probable and feature exposure to changes in cash
flows that could ultimately affect profit or loss;

119
Explanatory Notes to the financial statements
• the hedge’s effectiveness can be reliably assessed, i.e. the fair value or cash values of the item hedged and the hedging instru-ment’s fair value can be reliably measured;
• the hedge has been assessed on the basis of a recurrent criterion and is considered highly effective throughout the derivative’s life.
The basis of measurement of hedging instruments is their fair value on the designated date.
The fair value of currency derivatives is calculated in relation to their intrinsic value and their time value.
At each annual reporting date, hedging instruments are tested for effectiveness to see whether the hedge qualifies as an effective hedge and is therefore eligible for hedge accounting. The fair value of hedging instruments is set out in Note 6, while movements in the Cash Flow Hedge reserve are shown in Note 11.
When financial instruments qualify for hedge accounting, the following accounting treatment is applied:
Fair value hedge – If a financial derivative is designated as a hedge for exposure to the changes in fair value of an asset or liability attributable to a particular risk that may affect the Income Statement, profit, or loss, deriving from subsequent valuations of the hedge’s fair value is recognised in the Income Statement. The profit or loss on the hedged item, attributable to the risk covered, changes the carrying value of that item and is recognised in the Income Statement.
Cash flow hedge – If a financial derivative is designated as a hedge for exposure to the variability of future cash flows of an asset or liability, or of an expected, highly probable transaction that may affect profit and loss, the changes in the hedge’s fair value are recognised in equity for the effective portion of the hedge (intrinsic value) while the part relating to time value and any ineffective portion (over-hedging) is recognised in the Income Statement;If a hedge or hedging relationship has ended but the hedged transaction has not yet taken place, cumulative profits and losses recognised thus far in Equity are recognised in the Income Statement when the related transaction takes place. If the hedged transaction is no longer considered probable, the still unrealised profits and losses suspended in Equity are immediately recognised in the Income Statement.
If hedge accounting cannot be applied, gains and losses arising from fair-value measurement of the financial derivative are imme-diately recognised in the Income Statement.
INVENTORIES (IAS 2)Inventories are measured at the lower of cost and net realisable value. Cost is calculated using the weighted average cost method. Finished products, semi-finished products and raw material costs include the cost of raw materials, direct labour, and other pro-duction costs that are directly and indirectly allocable (in this case on the basis of normal production capacity). Net realisable value is the estimated selling price in the normal course of business, less any selling costs.Following the spin-off of divisions on 2 April 2007, from that date, the Company no longer has inventories.
TRADE AND OTHER RECEIVABLES (IAS 32 AND 39)Receivables, with due dates consistent with normal terms of trade in the sector in which the Company is active, or that earn interest at market rates, are not discounted to present value. They are recognised at cost (identified as face value), net of provisions for doubtful accounts, which are shown as a direct deduction from such receivables in order to align them with their fair value. Receivables whose due date exceeds normal terms of trade (i.e. due dates longer than one year) are initially recognised at fair value and subsequently at amortised cost – using the effective interest rate method – net of related im-pairment losses.The estimated impairment of receivables is recognised when it becomes evident that the past-due receivable cannot be recovered, due to financial difficulties of the customer that might lead to its bankruptcy or financial restructuring.

Explanatory Notes to the financial statements
120
CASH AND CASH EQUIVALENTS (IAS 32 AND 39)Cash and cash equivalents comprise cash on hand, bank and post office balances, and short-term financial investments (maturity of three months or less after purchase date) that are highly liquid, readily convertible into cash and are subject to insignificant risk of changes in value.Current-account overdrafts and advances on invoices subject to collection are deducted from cash only for the purposes of the Cash Flow Statement.
SHAREHOLDERS’ EQUITYShare capital consists of the ordinary shares outstanding, which are posted at par value.Costs relating to the issue of new shares or options are classified in Equity (net of associated tax benefit relating to them) as a deduction from the proceeds of the issuance of such instruments.In the case of buyback of treasury shares, the price paid, inclusive of any directly attributable accessory costs, is deducted from the Group’s Shareholders’ Equity until such shares are cancelled, re-issued, or sold, as required by IAS 32. When treasury shares are resold or re-issued, the proceeds, net of any directly attributable accessory costs and related tax effect, are posted as Company Shareholders’ Equity.Consequently, no profit or loss is entered in the consolidated Income Statement at the time of purchase, sale or cancellation of treasury shares.
INTEREST-BEARING FINANCIAL LIABILITIES (IAS 32 AND 39)Interest-bearing financial liabilities are initially recorded at fair value, net of ancillary costs. After initial recognition, interest-bearing financial liabilities are measured at amortised cost using the effective interest rate method.
A financial obligation is written off when the obligation underlying the liability has been extinguished or annulled or fulfilled.If an existing financial liability is replaced by another one from the same lender, under conditions that are essentially different, or if the terms and conditions of an existing liability are essentially amended, this change or amendment will be treated as a reversal of the original liability or the recognition of a new liability, with recognition in income of any differences involving the carrying values.
LIABILITIES FOR EMPLOYEE BENEFITS (IAS 19)Post-employment benefits are calculated based on programmes that, depending on their characteristics, are either “defined-contribution programmes” or “defined-benefit programmes”.Employee benefits mainly consist of severance indemnities for the Company.Italian Law no. 296 of 27 December 2006 (“2007 National Budget Law”) and subsequent decrees and regulations enacted during 2007 introduced – as part of overall reform of the Italian pension system – significant changes regarding the ultimate use of the portions of severance-indemnity provision accruing.
Until 31 December 2006, severance indemnity provision came within the scope of post-employment defined-benefit plans and was measured in accordance with IAS 19, by independent actuaries, using the projected unit credit method.Actuarial gains and losses as at 1 January 2005 – the date of transition to IFRSs – were recognised in specific equity reserved. Actuarial gains and losses after that date are recognised in the Income Statement on an accrual accounting basis, i.e. not using the “corridor” method envisaged by IAS 19. Following the reform of supplemental pensions, employees can allocate the new severance indemnity provision accruing to supplemental pension systems, or opt to keep it in the Company (in the case of companies with less than 50 employ-ees) or to transfer them to the INPS – the state pension and welfare agency (in the case of companies with more than 50 employees). Based on these rules, and also basing itself on the generally accepted interpretation, the Group decided that:• for the portion of severance indemnities accruing up to 31 December 2006, the provision in question constituted a defined-ben-
efit plan, to be valued according to the actuarial rules, but no longer including the component relating to future salary increases. The difference resulting from the new calculation in relation to the previous one was treated as curtailment as defined by IAS 19.109 and consequently entered in the Income Statement for the year ended 31 December 2007;
• subsequent portions of severance indemnities accruing, both in the case a supplementary pension scheme is chosen and in the case of allocation to the central treasury fund c/o the INPS, come within the scope of defined-contribution plans, thus excluding – in calculating the cost for the year – components relating to actuarial estimates.

121
Explanatory Notes to the financial statements
PROVISIONS FOR RISKS AND CHARGES (IAS 37)Provisions for risks and charges are set aside to cover liabilities whose amount or due date are uncertain and that must be recognised on the statement of financial position when the following conditions are satisfied at the same time:• the entity has a present obligation (legal or constructive), i.e. under way as at the reporting date, arising from a past event;• it is probable that economic resources will have to be used to fulfil the obligation;• the amount needed to fulfil the obligation can be reliably estimated.
Risks, for which materialisation of a liability is only contingent, are disclosed in the notes to accounts, in the section commenting on provisions, without provision being made.
In the case of events that are only remote, i.e. events that have very little likelihood of occurrence, no provision made and no additional or supplementary disclosure is provided.
Provisions are recognised at the value representing the best estimate of the amount the entity would pay to settle the obligation, or to transfer it to third parties, at the reporting date. If the time value of money is material, provisions are calculated by discounting expected future cash flows at a pre-tax discount rate reflecting the market’s current evaluation of the cost of money over time.When discounting to present value is performed, the increase in the provision due to the passage of time is recognised as finance expense.
INCOME TAXES (IAS 12)Income taxes include current and deferred taxes. Income taxes are generally recognised in the Income Statement, except when they relate to items entered directly in Equity, in which case the tax effect is recognised directly in Equity.Current income taxes are the taxes that are expected to be paid, calculated by applying to taxable income the tax rate in force at the reporting date and adjustments to taxes related to prior periods.
Deferred taxes are calculated using the liability method applied to temporary differences between the amount of assets and liabilities in the consolidated financial statements and the corresponding amounts recognised for tax purposes, except as follows:• deferred tax liabilities derive from the initial recognition of goodwill or an asset or liability in a transaction that is not a business
combination and, when the transaction itself occurs, does not affect the balance sheet profits or the profits or losses calculated for tax purposes;
• the reversal of taxable temporary differences associated with Equity investments in subsidiaries, associates or joint ventures, may be controlled and will probably not occur in the foreseeable future.
Deferred tax assets are recognised for all deductible temporary differences and tax credits and losses and can be brought forward, to the extent that the existence of adequate future taxable profits will exist against which the usage of the deductible temporary differences and the tax credits and losses brought forward can be used, except in cases where:• the deferred tax assets connected to the deductible temporary differences arise from initial recognition of an asset or liability
in a transaction that is not a business combination and, at the time of the transaction itself, does not affect the balance sheet result or the profit or loss for tax purposes;
• there are taxable temporary differences associated with Equity investments in subsidiaries, associates and joint ventures and deferred tax assets are recognised only to the extent that the deductible temporary differences will be reversed in the foresee-able future and that there are adequate taxable profits against which the temporary differences can be used.
Deferred taxes are calculated at the tax rate expected to be in force at the time when the asset is sold or the liability is redeemed.
Deferred tax assets are recognised only if it is probable that sufficient taxable income will be generated in subsequent years to realise them.The Parent Company Datalogic S.p.A. and other Italian subsidiaries fall within the scope of the “domestic tax consolidation” of Hy-dra S.p.A.. This permits the transfer of total net income or the tax loss of individual participant companies to the Parent Company, which calculates a single taxable income for the Group or a single tax loss carried forward, as the algebraic sum of the income and/or losses, and therefore files a single tax liability or credit with the Tax Authorities.

Explanatory Notes to the financial statements
122
TRADE AND OTHER PAYABLES (IAS 32 AND 39)Trade and other payables are measured at cost, which represents their discharge value.Short-term payables are not discounted, since the effect of discounting the cash flows is not significant.
REVENUE RECOGNITION (IAS 18)Revenues include the fair value of the amount collected or collectable from the sale of goods or rendering of services within the scope of the Company’s characteristic business activity. Revenues are shown net of VAT, returns, discounts and allowances.
Sale of goodsRevenues from the sale of goods are recognised only when all the following conditions are met:• most of the risks and rewards of ownership of the goods have been transferred to the buyer;• effective control over the goods sold and continuing managerial involvement to the degree usually associated with ownership
have ceased;• the amount of revenues can be reliably measured;• it is probable that the economic benefits associated with the transaction will flow to the entity;• the costs incurred or to be incurred in respect of the transaction can be reliably measured.
Rendering of servicesRevenues arising from a transaction for the rendering of services is recognised only when the results of the transaction can be reliably estimated, based on the stage of completion of the transaction at the reporting date. The results of a transaction can be reliably measured when all the following conditions are met:• the amount of revenues can be reliably measured;• it is probable that the economic benefits of the transaction will flow to the entity;• the stage of completion at the reporting date can be reliably measured; • the costs incurred, or to be incurred, to complete the transaction can be reliably measured.
Revenues relating to dividends, interest and royalties are respectively recognised as follows:• dividends, when the right is established to receive dividend payment (with a receivable recognised in the statement of financial
position when distribution is resolved);• interest, with application of the effective interest rate method (IAS 39);• royalties, on an accruals basis in accordance with the underlying contractual agreement.
GOVERNMENT GRANTS (IAS 20)Government grants are recognised - regardless of the existence of a formal grant resolution - when there is reasonable certainty that the Company will comply with any conditions attached to the grant and therefore that the grant will be received.Government grants receivable as compensation for costs already incurred or to provide immediate financial support to the recipi-ent company with no future related costs, are recognised as income in the period in which they become receivable.
RENTAL AND OPERATING LEASE COSTS (IAS 17)Lease contracts in which the lessor substantially preserves all the risks and rewards of ownership are classified as operating leases and related fees are charged to the Income Statement on a straight-line basis according to the contract’s duration.
DIVIDENDS DISTRIBUTED (IAS 1 AND 10)Dividends are recognised when Shareholders have the right to receive payment. This normally corresponds to the date of the an-nual general Shareholder Meeting that approves dividend distribution.The dividends distributable to Company Shareholders are recognised as an Equity movement in the year when they are approved by the Shareholders’ Meeting.
EARNINGS PER SHARE - EPS (IAS 33)
BasicBasic EPS is calculated by dividing the Company’s profit by the weighted average number of ordinary shares outstanding during the year, excluding treasury shares.

123
Explanatory Notes to the financial statements
DilutedDiluted EPS is calculated by dividing the Company’s profit by the weighted average number of ordinary shares outstanding during the year, excluding treasury shares. For the purposes of calculating diluted EPS, the weighted average number of shares is deter-mined assuming translation of all potential shares with a dilutive effect, and the Company’s net profit is adjusted for the post-tax effects of translation.
TREATMENT OF FOREIGN CURRENCY ITEMS (IAS 21)
Transactions and balancesForeign currency transactions are initially converted to Euro at the exchange rate existing on the transaction date.On the reporting date, foreign-currency monetary assets and liabilities are converted at the exchange rate in force on that date.Foreign-currency non-monetary items measured at historical cost are converted using the exchange rate in force on the transaction date.Non-monetary items recognised at fair value are converted using the exchange rate in force when carrying value is calculated.Foreign exchange gains and losses arising from the collection of foreign currency receivables or payment of foreign currency pay-ables are recognised in the Income Statement.
Amendments, new standards and interpretationsACCOUNTING STANDARDS, AMENDMENTS AND INTERPRETATIONS APPLIED AS AT 1 JANUARY 2015 The accounting standards adopted for preparation of the Company’s financial statements conform to those used for the prepa-ration of the financial statements for the period ended 31 December 2014, except for the adoption on 1 January 2015 of the new standards, amendments and interpretations.
The Company adopted for the first time some standards and amendments which became effective for the first time in 2015. The nature and effect of these changes are described hereunder, pursuant to requirements set forth in IAS 8. However, the above had no impact on the Company’s financial statements. The nature and impact of any new principle/amend-ment are specified hereunder:
• IFRS 2 – Share-based PaymentsThis improvement is applied prospectively and clarifies various issues connected with the definition of conditions, related to the achievement of results or services rendered, which are considered as vesting conditions. Clarifications are consistent with the modalities with which the Company has identified, in the previous periods, the conditions related to the achievement of results or services rendered and that are considered as vesting conditions. Moreover, the Company granted no share-based bonuses; therefore, these improvements had no effect on the Company’s financial statements or accounting criteria.
Within the annual plan of IFRS improvements - 2010-2012, IASB issued the following amendments to accounting standards, which were already effective on 1 July 2014 and that had no significant impact on the Company.
• IFRS 8 – Operating SegmentsThe amendment is applicable retrospectively and clarifies the following:An entity is required to disclose measurements made by the management in applying the aggregation criteria envisaged in paragraph 12 of IFRS 8, including a brief description of the operating segments which were aggregated, as well as the economic characteristics (e.g. sales or gross profit) used to determine whether the segments are “similar”. The reconciliation between segment-related assets and total assets must be disclosed only if the reconciliation is submitted to the operating chief decision maker, as required for segment-related liabilities.
• IAS – 16 Property, Plant and Equipment and IAS 38 Intangible AssetsThe amendment is applied retrospectively and clarifies that, in IAS 16 and IAS 38, an asset can be revalued based on observable data both adjusting the gross carrying value of the asset to the market value, and determining the market value of the carrying value and adjusting the gross carrying value on a pro rata basis so that the resulting carrying value is equal to the market value. Moreover, accumulated amortisation/depreciation and impairment losses represent the difference between gross value and carrying value of an asset. This amendment had no impact on the revaluation adjustments accounted for by the Company in this financial year.

Explanatory Notes to the financial statements
124
• IAS 24 – Related Party DisclosuresThe amendment is applied retrospectively and clarifies that a management entity (an entity which supplies services related to managers with strategic responsibilities) is a related party, subject to disclosure on related parties. Moreover, an entity which uses a management entity should disclose the cost borne for the management services. Within the annual plan of IFRS improvements - 2011-2013, IASB issued some amendments to some accounting standards, which were already effective on 1 July 2014 and that had no significant impact on the Company.
• IFRS 13 – Measurement at fair valueThe amendment is applicable prospectively and clarifies that the portfolio exception envisaged by IFRS 13 can be applied not only to financial assets and liabilities, but also to other contracts within the scope of IAS 39. The Group does not apply the port-folio exception envisaged by IFRS 13.
The Company has not provided for an early adoption of any standard, interpretation or improvement that has been issued but is not yet effective.
Standards issued which are not yet in forceFollowing are the standards which, on the date that the Company’s financial statements were prepared, had already been issued but were not yet in force.
• IFRS 9 – Financial InstrumentsIn July 2014, IASB issued the final version of IFRS 9 Financial Instruments, which reflects all the project steps related to financial instruments and supersedes IAS 39 “Financial Instruments: Recognition and Measurement”, as well as all previous versions of IFRS 9. The standard introduces new requirements for the classification, measurement, impairment and hedge accounting. IFRS 9 is effective to annual periods beginning on or after 1 January 2018. Early application is permitted. The standard shall be applied retrospectively, although the supply of comparative information is not mandatory. Early application is permitted of the previous versions of IFRS 9 (2009, 2010 and 2013) if the initial application is prior to 1 February 2015. No significant impact is expected on classification and measurement of the Company’s financial liabilities.
• IFRS 15 – Revenue from Contracts with Customers The IFRS standard was issued in May 2014 and provides a five-step new model to be applied to all contracts with customers. According to IFRS 15, revenue should be recognised for an amount corresponding to the right in payment the entity believes to have against the sale of goods or services to customers. This standard envisages a more structured approach in recognising and measuring revenue. The new principle is applicable to all entities and will replace all current requirements included in IFRS on recognition of rev-enues. The standard is effective for annual periods beginning on or after 1 January 2017, with fully retrospective or modified application. Early application is permitted. The Company is currently evaluating the impact of IFRS 15 and the clarifications issued by IASB in the exposure draft of July 2015, and will evaluate any further development, while envisaging to apply the new standard as from the mandatory effective date.
• Amendments to IFRS 11 – Joint Arrangements: Accounting for Acquisitions of Interests The amendments to IFRS 11 envisage that a joint operator, who reports the acquisition of an interest in a joint control agree-ment in which the activity of the joint operation constitutes a business, should apply the principles as defined in IFRS 3 on the basis of the business combinations guidance. The amendments clarify that, in the event a joint control is maintained, the interest previously held in a joint-control agreement shall not be re-measured upon the acquisition of another interest in the same joint control agreement. Moreover, for clarification purposes, the following was excluded from the object of the IFRS 11. Amendments are not applicable when the parties in a joint control, including the entity that prepares the financial statements, are subject to the mutual control of the same ultimate controlling entity. Amendments are applicable to both the acquisition of the initial interest in a joint-control agreement, and the acquisition of any further interest in the same joint control agreement. The amendments must be applied prospectively to annual periods begin-ning on or after 1 January 2016. Early application is permitted. No impact resulting from the application of these amendments is expected on the Company.
125
Explanatory Notes to the financial statements
• Amendments to IAS 16 and IAS 38 – Clarification of Acceptable Methods of Depreciation and Amortisation These amendments clarify the principle, included in IAS 16 and IAS 38, that revenues reflect a model of economic benefits gen-erated by the management of a business (in which the asset is embodied), rather than the consumption of the economic ben-efits when an asset is used. As a result, a method based on revenues cannot be used for depreciation of real estate properties, plant and machinery and could be used only in very restricted circumstances when amortising intangible assets. The amend-ments must be applied prospectively to annual periods beginning on or after 1 January 2016. Early application is permitted. No impact on the Company is expected while applying these amendments, given that the Company does not use revenue-based methods for the amortisation/depreciation of non-current assets.
• Amendments to IAS 27 – Equity Method in Separate Financial Statements The amendments will reinstate the Equity Method as an accounting option for Equity investments in subsidiaries, joint ven-tures and associates in an entity’s separate financial statements. Entities that are already applying the IFRS standards and elect to modify the accounting principles by adopting the Equity Method to their separate financial statements should apply the amendment retrospectively. In the event of fist-time adoption of IFRSs, the entity that elects to adopt the Equity Method in the separate financial statements should apply this standard at the transition date to IFRS. The amendments are effective for annual periods beginning on or after 1 January 2016. Early application is permitted. No impact on the Company’s financial statements is expected for the application of these amendments.
• Amendments to IAS 10 and IAS 28 – Sale or Contribution of Assets between an Investor and its Associate or Joint VentureAmendments are related to the conflict between IFRS 10 and IAS 28, with reference to the loss in control of an investee, which is sold or transferred to an associated company or a joint venture. Amendments clarify that profit or loss resulting from the sale or transfer of assets representing a business, as defined by IFRS 3, between an investor and its associated company or joint venture, must be entirely recognised. Any profit or loss, resulting from the sale or transfer of assets, which do not represent a business, is however recognised only within the limits of the portion held by third-party investors in the associated company or joint venture. These amendments must be applied prospectively and will be in force for annual periods beginning on or after 1 January 2016. Early application is permitted. These amendments are not expected to have any impact on the Company.
2012-2014 ANNUAL IMPROVEMENT CYCLE These amendments are effective for annual periods beginning on 1 January 2016 or later. They include the following:
• IFRS 5 Non-current Assets Held for Sale and Discontinued OperationsAssets (or disposal group) are generally disposed of through the sale or the distribution to Shareholders. This amendment clarifies that the change from either disposal methods should not be considered as a new plan to sell, but rather the continuation of the original one. Therefore, there is no discontinuation in the application of requirements of IFRS 5. This amendment shall be applied prospectively.
• IFRS 7 Financial Instruments: Disclosures(i) Servicing contractsThe amendment clarifies that a servicing contract envisaging a remuneration can entail a continuing involvement of a financial asset. The entity shall define the type of remuneration and of agreement based on the guidance contained in the IFRS 7 on the continuing involvement, in order to evaluate whether a clarification is required. The definition of what type of servicing contract represents a continuing involvement must be made retrospectively. In any case, the information required shall not be disclosed for annual periods before the first-time application date of this amendment.
(ii) Applicability of amendments to IFRS 7 to condensed interim financial statements.The amendment clarifies that disclosure requirements on remuneration are not applied to condensed interim financial state-ments, unless this disclosure constitutes a significant updating of information given in the most recent annual financial state-ments. This amendment shall be applied retrospectively.
• IAS 19 Employee BenefitsThe amendment clarifies that the deep market of high quality corporate bonds should be determined on a currency basis (cur-rency in which the bond is issued), rather than on a country basis (in which the benefits are to be paid). When there is no deep market for high quality corporate bond in that currency, government bonds should be used to establish the discount rate. This amendment shall be applied prospectively.

Explanatory Notes to the financial statements
126
• Amendments to IAS 1 - Disclosure InitiativeAmendments to IAS 1 Disclosure of Accounting Policies intend to clarify, rather than significantly modify, some already existing requirements to IAS 1. The amendments clarify:
– the requirement of materiality in IAS 1; – the fact that specific lines in the statements of profit/(loss) for the year or other components in the Statement of
Comprehensive Income or in the Statement of Financial Position may be unbundled; – that entities can disclose the Notes to the financial statements in a flexible way; – that the portion of other components in the Statement of Comprehensive Income, related to associated companies and
joint ventures and accounted for by using the Equity Method, must be disclosed in aggregate in one single line, and classified under items that will not be subsequently reclassified in the Income Statements.
Moreover, amendments clarify the requirements that are applied when sub-totals are disclosed in the statements of profit/(loss) for the year or other components are disclosed in the Statement of Comprehensive Income or Statement of Financial Position may be unbundled. Amendments are effective for annual periods beginning on or after 1 January 2016. Early application is permitted. No impact on the Company is expected as regards these amendments.
Use of estimatesPreparation of IFRS-compliant consolidated financial statements and of the relevant notes requires directors to apply accounting principles and methodologies that, in some cases, are based on valuations and estimates, which in turn are based on historic ex-perience and assumptions considered reasonable and realistic based on circumstances at any given time. The application of such estimates and assumptions affects the amounts reported in financial statements, i.e. the Statement of Financial Position, Income Statement, and Cash Flow Statement, as well as the information disclosed. The ultimate actual amounts of accounting items, for which these estimates and assumptions have been used, might be different from those reported in the financial statements due to the uncertainty characterising the assumptions and conditions on which estimates are based.
Below we list the accounting items that, more than others, require greater subjectivity on the part of directors in developing es-timates and for which any change in conditions underlying assumptions made could have a significant impact on the Company’s financial statements:• non current assets;• development costs;• inventory devaluation;• deferred tax assets;• provisions for doubtful accounts;• employee benefits;• provisions for risks and charges.
Estimates and assumptions are reviewed regularly and the effects of every change are immediately reflected in the Income Statement. The measurement criteria of the estimate items are described in the related Notes, to which reference is made.

127
Explanatory Notes to the financial statements
Financial risk managementRISK FACTORSThe Company is exposed to various types of financial risks in the course of its business, including:• credit risk, deriving from trade transactions or from financing activities;• liquidity risk, relating to availability of financial resources and access to the credit market;• market risk, specifically:
a) foreign exchange risk, relating to transactions that generate cash flows in other currencies that fluctuate in value.b) interest rate risk, relating to the Company’s exposure to financial instruments that generate interest.
The Company is not exposed to any price risk, as it does not hold significant quantities of listed securities in its portfolio, nor is it otherwise exposed to the risk deriving from the trend of commodities traded on the financial markets.The Company specifically monitors each of the aforementioned financial risks, taking prompt action in order to minimise such risk. The Company uses derivative contracts relating to underlying financial assets or liabilities or future transactions. The Central Treasury Department operates directly on the market on behalf of subsidiary and investee companies. The management of the market and liquidity risks therefore takes place within the Company and specifically the Central Treasury Department, while credit risks are managed by the Group’s operating units. The sensitivity analysis is subsequently used to indicate the potential impact on the final results deriving from hypothetical fluctuations in the reference parameters. As provided for by IFRS7, the analyses are based on simplified scenarios applied to the final figures and, owing to their nature, they cannot be considered indicative of the actual effects of future changes.
MARKET RISK
Foreign exchange risk Datalogic operates internationally and is exposed to the risk associated with a variety of currencies.Transaction risk mainly relates to trade transactions (foreign currency receivables/payables) and financial transactions (foreign currency borrowings or loans) to/from Group companies in currencies other than their functional currency.The key currency is the US Dollar (USD).To permit full understanding of the foreign exchange risk on the Company’s financial statements, we have analysed the sensitivity of foreign currency accounting items to changes in exchange rates. The variability parameters applied were identified among the exchange rate changes considered reasonably possible, with all other variables remaining equal.
The following tables show the results of this sensitivity analysis:
Items exposed to interest rate risk with impact on the Income Statement before taxes
USD Carrying value
Portion exposed to
exchange rate risk
+ 10% + 5% + 1% -1% -5% -10%
Exchange rates 1,0887 1,1976 1,1431 1,0996 1,0778 1,0343 0,9798
Financial assets
Cash and cash equivalents 76,464 3,872 (352) (184) (38) 39 204 430
Trade and other receivables 9,457 1,298 (118) (62) (13) 13 68 144
Loans 390,777 99,056 (9,005) (4,717) (981) 1,001 5,213 11,006
Loans (netting) (122,577) (54,325) 4,939 2,587 538 (549) (2,859) (6,036)
Total Loans 268,200
(4,536) (2,376) (494) 504 2,626 5,544
Financial liabilities
Loans 412,397 94,489 8,590 4,499 936 (954) (4,973) (10,499)
Loans (netting) (92,186) (39,365) (3,579) (1,875) (390) 398 2,072 4,374
Total Loans 320,211
Trade and other payables 8,909 326 30 16 3 (3) (17) (36)
5,041 2,640 549 (560) (2,918) (6,161)
Pre-tax impact on Income Statement, Net 505 264 55 (56) (292) (617)

Explanatory Notes to the financial statements
128
Items exposed to exchange rate risk with impact on EquityAs at 31 December 2015, the Company held the following items exposed to exchange rate risk, with impact on Equity:
USD Carrying value
Portion exposed to
exchange rate risk
+ 10% + 5% + 1% -1% -5% -10%
Exchange rates 1,0887 1,1976 1,1431 1,0996 1,0778 1,0343 0,9798
Financial assets
Loans 268,200 153,635 (13,967) (7,316) (1,521) 1,552 8,086 17,071
Financial Liabilities (13,967) (7,316) (1,521) 1,552 8,086 17,071
Net impact at Equity
Interest rate riskThe Company is exposed to interest rate risk associated both with the availability of cash and with borrowings. The aim of inter-est rate risk management is to limit and stabilise payable flows caused by interest paid mainly on medium-term debt in order to achieve a tight match between the underlying and the hedging instrument.With regard to medium/long-term loans, as at 31 December 2015, Datalogic had interest rate swaps in place with financial coun-terparties of premier standing for a notional total of €8 million. These derivatives permit the hedging of about 3% of total bank borrowings against the risk of a rise in interest rates of Datalogic S.p.A., synthetically transforming variable-rate loans into fixed-rate loans.
Bank borrowings, mortgages and other short/long-term loans Amount %
Variable rate 145,372 85%
Fixed rate 20,000 12%
Variable rate hedged through derivative instruments 5,959 3%
Leasing 526 0.3%
Other 80 0.0%
Total 171,937 100%
In order to fully understand the potential effects of fluctuations in interest rates to which the Company is exposed, we analysed the accounting items most at risk, assuming a change 20 basis points in the Euribor and of 10 basis points in the USD Libor. The analysis was based on reasonable assumptions. Below we show the results as at 31 December 2015:

129
Explanatory Notes to the financial statements
Items exposed to interest rate risk with impact on the Income Statement before taxes
Euribor (€/000) Carrying value of which exposed to exchange rate risk
20bp -20bp
Financial assets
Cash and cash equivalents 76,464 71,493 143 (143)
Loans 390,777 131,736 263 (263)
Loans (netting) (122,577) (68,252) (137) 137
Total Loans 268,200
269 (269)
Financial liabilities
Loans 272,984 150,034 (300) 300
Floor 0% loans 139,413 139,413 (279)
Loans (netting) (92,186) (52,821) 106 (106)
Total Loans 320,211
(473) 194
Total Increases/(Decreases) (204) (75)
Libor USD Carrying value of which exposed to exchange rate risk
10bp -10bp
Financial assets financial
Cash and cash equivalents 76,464 3,872 4 (4)
Loans 390,777 99,056 99 (99)
Loans (netting) (122,577) (54,325) (54) 54
Total Loans 268,200
49 (49)
Financial liabilities
Loans 272,984 94,489 (94) 94
Loans (netting) (92,186) (39,365) 39 (39)
Total Loans 320,211
(55) 55
Total Increases/(Decreases) (6) 6
Items exposed to interest rate risk with impact on the Equity before taxes
Euribor (€/000) Carrying value of which exposed to exchange rate risk
20bp -20bp
Financial assets financial
Loans 268,200 6,350 13 (13)
Financial liabilities
Derivative instruments 7,875 7,875 16 (16)
Libor USD Carrying value of which exposed to exchange rate risk
10bp -10bp
Financial assets financial
Loans 268,200 153,634 154 (154)
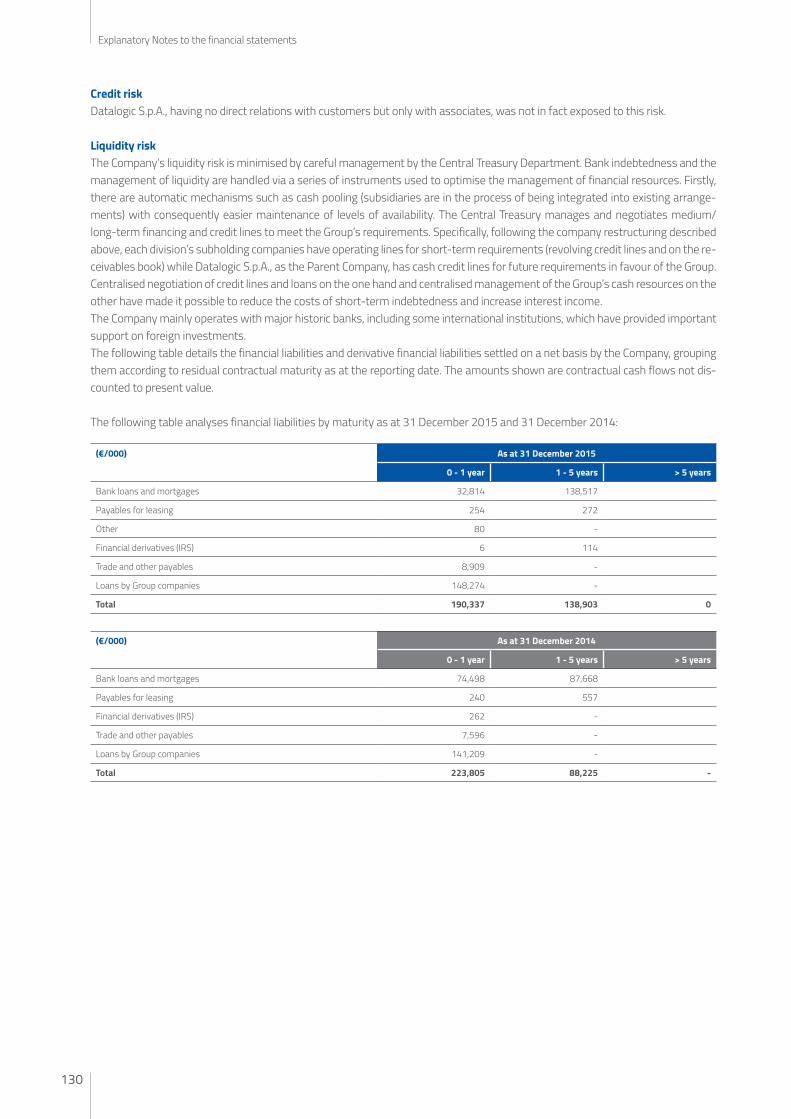
Explanatory Notes to the financial statements
130
Credit riskDatalogic S.p.A., having no direct relations with customers but only with associates, was not in fact exposed to this risk.
Liquidity riskThe Company’s liquidity risk is minimised by careful management by the Central Treasury Department. Bank indebtedness and the management of liquidity are handled via a series of instruments used to optimise the management of financial resources. Firstly, there are automatic mechanisms such as cash pooling (subsidiaries are in the process of being integrated into existing arrange-ments) with consequently easier maintenance of levels of availability. The Central Treasury manages and negotiates medium/long-term financing and credit lines to meet the Group’s requirements. Specifically, following the company restructuring described above, each division’s subholding companies have operating lines for short-term requirements (revolving credit lines and on the re-ceivables book) while Datalogic S.p.A., as the Parent Company, has cash credit lines for future requirements in favour of the Group. Centralised negotiation of credit lines and loans on the one hand and centralised management of the Group’s cash resources on the other have made it possible to reduce the costs of short-term indebtedness and increase interest income.The Company mainly operates with major historic banks, including some international institutions, which have provided important support on foreign investments.The following table details the financial liabilities and derivative financial liabilities settled on a net basis by the Company, grouping them according to residual contractual maturity as at the reporting date. The amounts shown are contractual cash flows not dis-counted to present value.
The following table analyses financial liabilities by maturity as at 31 December 2015 and 31 December 2014:
(€/000) As at 31 December 2015
0 - 1 year 1 - 5 years > 5 years
Bank loans and mortgages 32,814 138,517
Payables for leasing 254 272
Other 80 -
Financial derivatives (IRS) 6 114
Trade and other payables 8,909 -
Loans by Group companies 148,274 -
Total 190,337 138,903 0
(€/000) As at 31 December 2014
0 - 1 year 1 - 5 years > 5 years
Bank loans and mortgages 74,498 87,668
Payables for leasing 240 557
Financial derivatives (IRS) 262 -
Trade and other payables 7,596 -
Loans by Group companies 141,209 -
Total 223,805 88,225 -

131
Explanatory Notes to the financial statements
Information on the Statement of Financial Position - AssetsNOTE 1. TANGIBLE ASSETS
Details of movements as at 31 December 2015 and 31 December 2014 are as follows:
(€/000) 31.12.2015 31.12.2014 Change
Land 2,466 2,466 -
Buildings 15,766 15,468 298
Other assets 3,356 3,396 (40)
Assets in progress and payments on account - 254 (254)
Total 21,588 21,584 4
Changes taking place in the period are as follows:
(€/000) Land Buildings Other assets Assets in progress and payments on
account
Total
Historical cost 2,466 17,175 9,278 254 29,173
Accumulated depreciation - (1,707) (5,882) - (7,589)
Net opening value at 01.01.15 2,466 15,468 3,396 254 21,584
Increases 31.12.15
Investments - 379 602 - 981
Reclassifications - 137 117 - 254
Transfers - - (24) - (24)
Depreciation reversal - - 16 - 16
Total - 516 711 - 1,227
Decreases 31.12.15
Disposals - - (17) - (17)
Reclassifications - - - (254) (254)
Transfers - - 24 - 24
Depreciation - (218) (758) - (976)
Total - (218) (751) (254) (1,223)
Historical cost 2,466 17,691 9,956 - 30,113
Accumulated depreciation - (1,925) (6,600) - (8,525)
Net closing value at 31.12.15 2,466 15,766 3,356 0 21,588
The increase of €379 thousand in item “Buildings” is mainly due to the construction of the second tunnel connecting two parts of the building and the setting-up of a corporate museum.
The increase for the year of €602 thousand in the “Other assets” item primarily breaks down as follows:• €324 thousand for the purchase of electronic office equipment and servers;• €156 thousand for the purchase of new furniture and fittings;• €116 thousand for new electrical, hydraulic and air-conditioning systems for the new buildings;• €6 thousand for the purchase of demos for the corporate museum.

Explanatory Notes to the financial statements
132
NOTE 2. INTANGIBLE ASSETS
Details of movements as at 31 December 2015 and 31 December 2014 are as follows:
(€/000) 31.12.2015 31.12.2014 Change
Goodwill - - -
Development costs - - -
Others 2,570 2,414 156
Total 2,570 2,414 156
Changes taking place in the period are as follows:
(€/000) Goodwill Development costs Others Total
Historical cost - - 8,408 8,408
(Accumulated amortisation) - - (5,994) (5,994)
Opening value as at 01.01.15 0 0 2,414 2,414
Increases 31.12.15
Investments - - 852 852
Reclassifications - - 1 1
Amortisation reversal - - - 0
Total - - 853 853
Decreases 31.12.15
Disposals - - - -
Reclassifications - - (1) (1)
Amortisation - - (696) (696)
Total - - (697) (697)
Historical cost - - 9,260 9,260
Accumulated amortisation - - (6,690) (6,690)
Net closing value at 31.12.15 0 0 2,570 2,570
The increase for the year of €852 thousand in the item “Others” relates to:• €553 thousand for software and primarily:
– €204 thousand for implementations of some modules of the sHare software related to the evaluation of performance and assignment of goals;
– €170 thousand for software aimed at the management of requirements of Datalogic product; – €59 thousand software for the management of Group logistics; – €40 thousand for implementation of Oracle Hyperion software.
• €72 thousand for implementations of SAP managing software;• €225 thousand for assets in progress are related to:
– €147 thousand for implementations of SAP managing software; – €78 thousand for development of other modules of the sHare software.
NOTE 3. EQUITY INVESTMENTS
Equity investments held by the Company as at 31 December 2015 were as follows:
(€/000) Balance as at 31.12.2014
Increases Decreases Change Balance as at 31.12.2015
Subsidiaries 174,599 0 0 0 174,599
Associates 0 0 0
Total associates 174,599 0 0 0 174,599
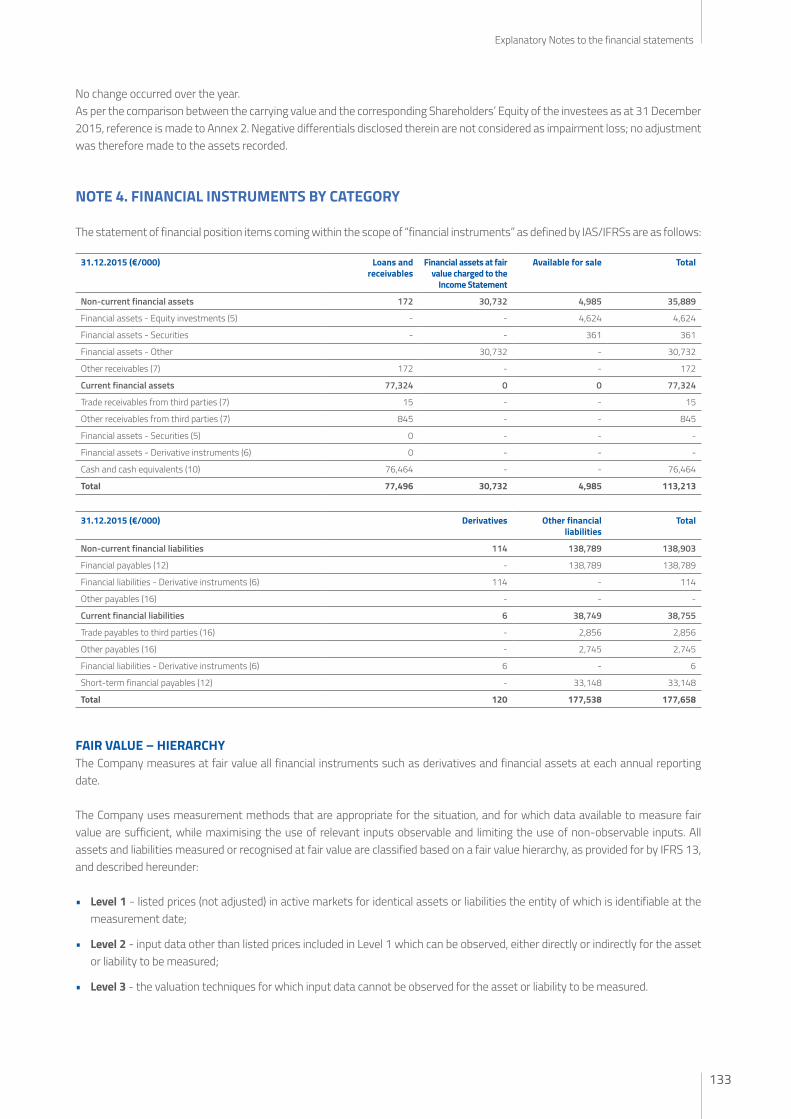
133
Explanatory Notes to the financial statements
No change occurred over the year.As per the comparison between the carrying value and the corresponding Shareholders’ Equity of the investees as at 31 December 2015, reference is made to Annex 2. Negative differentials disclosed therein are not considered as impairment loss; no adjustment was therefore made to the assets recorded.
NOTE 4. FINANCIAL INSTRUMENTS BY CATEGORY
The statement of financial position items coming within the scope of “financial instruments” as defined by IAS/IFRSs are as follows:
31.12.2015 (€/000) Loans and receivables
Financial assets at fair value charged to the
Income Statement
Available for sale Total
Non-current financial assets 172 30,732 4,985 35,889
Financial assets - Equity investments (5) - - 4,624 4,624
Financial assets - Securities - - 361 361
Financial assets - Other 30,732 - 30,732
Other receivables (7) 172 - - 172
Current financial assets 77,324 0 0 77,324
Trade receivables from third parties (7) 15 - - 15
Other receivables from third parties (7) 845 - - 845
Financial assets - Securities (5) 0 - - -
Financial assets - Derivative instruments (6) 0 - - -
Cash and cash equivalents (10) 76,464 - - 76,464
Total 77,496 30,732 4,985 113,213
31.12.2015 (€/000) Derivatives Other financial liabilities
Total
Non-current financial liabilities 114 138,789 138,903
Financial payables (12) - 138,789 138,789
Financial liabilities - Derivative instruments (6) 114 - 114
Other payables (16) - - -
Current financial liabilities 6 38,749 38,755
Trade payables to third parties (16) - 2,856 2,856
Other payables (16) - 2,745 2,745
Financial liabilities - Derivative instruments (6) 6 - 6
Short-term financial payables (12) - 33,148 33,148
Total 120 177,538 177,658
FAIR VALUE – HIERARCHYThe Company measures at fair value all financial instruments such as derivatives and financial assets at each annual reporting date.
The Company uses measurement methods that are appropriate for the situation, and for which data available to measure fair value are sufficient, while maximising the use of relevant inputs observable and limiting the use of non-observable inputs. All assets and liabilities measured or recognised at fair value are classified based on a fair value hierarchy, as provided for by IFRS 13, and described hereunder:
• Level 1 - listed prices (not adjusted) in active markets for identical assets or liabilities the entity of which is identifiable at the measurement date;
• Level 2 - input data other than listed prices included in Level 1 which can be observed, either directly or indirectly for the asset or liability to be measured;
• Level 3 - the valuation techniques for which input data cannot be observed for the asset or liability to be measured.

Explanatory Notes to the financial statements
134
As at 31 December 2015, the Company held the following financial instruments measured at fair value:
(€/000) Level 1 Level 2 Level 3 Total
Assets measured at fair value
Financial assets - Equity investments (5) 3,998 - 626 4,624
Financial assets - LT securities (5) 361 - - 361
Financial assets - Other LTs (5) 9,919 20,813 30,732
Total assets measured at fair value 4,359 0 31,358 35,717
Liabilities measured at fair value
Financial liabilities - LT derivative instruments (6) - 114 - 114
Financial liabilities - ST derivative instruments (6) - 6 - 6
Total liabilities measured at fair value 0 120 0 120
As regards assets and liabilities that are recognised in the financial statements at fair value on a recurring basis, the Company determines whether transfers between hierarchy level occurred while revising the classification (based in lower level inputs, which is significant for the purposes of a thorough fair value measurement) at each annual reporting date.
NOTE 5. FINANCIAL ASSETS
The financial assets include the following items:
(€/000) 31.12.2015 31.12.2014 Change
Securities 361 361 -
Long-term government bonds 361 361 -
Short-term government bonds - - -
Other financial assets 30,732 20,290 10,442
Other long-term financial assets 30,732 20,290 10,442
Other equity investments 4,624 3,481 1,143
Total 35,717 24,132 11,585
The “Other LT financial assets” item consists of an investment of corporate liquidity in two insurance policies subscribed in May and July 2014, and a mutual investment fund subscribed in August 2015.
Following are the summary tables:
TRADING SECURITIES – LISTED
Type of security (€/000)
Nominal value Purchase price Acquisition value Market price as at 31.12.2015
Market value as at 31.12.2015
Balance sheet value as at
31.12.2015
Government bonds 360 0.9926 357 1.00155 361 361
Total securities 360 357 361 361
OTHER EQUITY INVESTMENTSAs at 31 December 2015, Equity investments held in other companies were as follows:
(€/000) 31.12.2014 Increases Decreases Adjustment to fair value
Adjustment on exchange rates
31.12.2015
Unlisted Equity investments 87 567 (28) - - 626
Listed Equity investments 3,394 - - 214 390 3,998
Total Equity investments 3,481 567 (28) 214 390 4,624
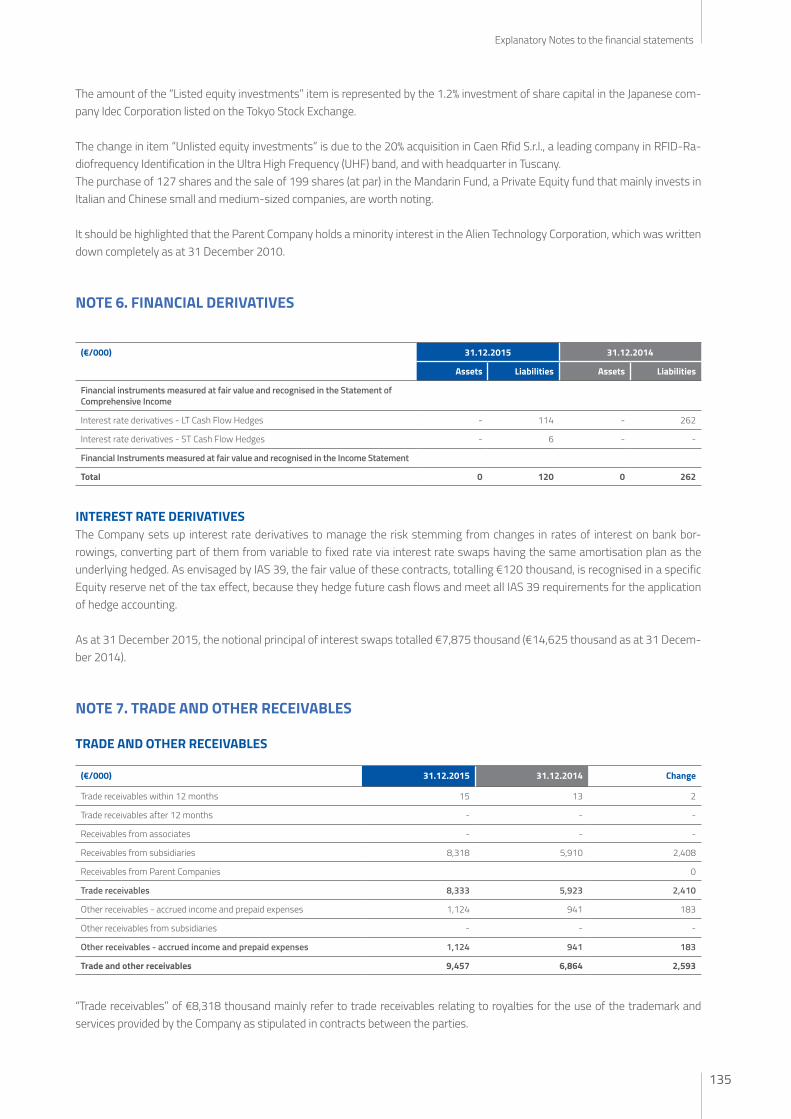
135
Explanatory Notes to the financial statements
The amount of the “Listed equity investments” item is represented by the 1.2% investment of share capital in the Japanese com-pany Idec Corporation listed on the Tokyo Stock Exchange.
The change in item “Unlisted equity investments” is due to the 20% acquisition in Caen Rfid S.r.l., a leading company in RFID-Ra-diofrequency Identification in the Ultra High Frequency (UHF) band, and with headquarter in Tuscany. The purchase of 127 shares and the sale of 199 shares (at par) in the Mandarin Fund, a Private Equity fund that mainly invests in Italian and Chinese small and medium-sized companies, are worth noting.
It should be highlighted that the Parent Company holds a minority interest in the Alien Technology Corporation, which was written down completely as at 31 December 2010.
NOTE 6. FINANCIAL DERIVATIVES
(€/000) 31.12.2015 31.12.2014
Assets Liabilities Assets Liabilities
Financial instruments measured at fair value and recognised in the Statement of Comprehensive Income
Interest rate derivatives - LT Cash Flow Hedges - 114 - 262
Interest rate derivatives - ST Cash Flow Hedges - 6 - -
Financial Instruments measured at fair value and recognised in the Income Statement
Total 0 120 0 262
INTEREST RATE DERIVATIVESThe Company sets up interest rate derivatives to manage the risk stemming from changes in rates of interest on bank bor-rowings, converting part of them from variable to fixed rate via interest rate swaps having the same amortisation plan as the underlying hedged. As envisaged by IAS 39, the fair value of these contracts, totalling €120 thousand, is recognised in a specific Equity reserve net of the tax effect, because they hedge future cash flows and meet all IAS 39 requirements for the application of hedge accounting.
As at 31 December 2015, the notional principal of interest swaps totalled €7,875 thousand (€14,625 thousand as at 31 Decem-ber 2014).
NOTE 7. TRADE AND OTHER RECEIVABLES
TRADE AND OTHER RECEIVABLES
(€/000) 31.12.2015 31.12.2014 Change
Trade receivables within 12 months 15 13 2
Trade receivables after 12 months - - -
Receivables from associates - - -
Receivables from subsidiaries 8,318 5,910 2,408
Receivables from Parent Companies 0
Trade receivables 8,333 5,923 2,410
Other receivables - accrued income and prepaid expenses 1,124 941 183
Other receivables from subsidiaries - - -
Other receivables - accrued income and prepaid expenses 1,124 941 183
Trade and other receivables 9,457 6,864 2,593
“Trade receivables” of €8,318 thousand mainly refer to trade receivables relating to royalties for the use of the trademark and services provided by the Company as stipulated in contracts between the parties.
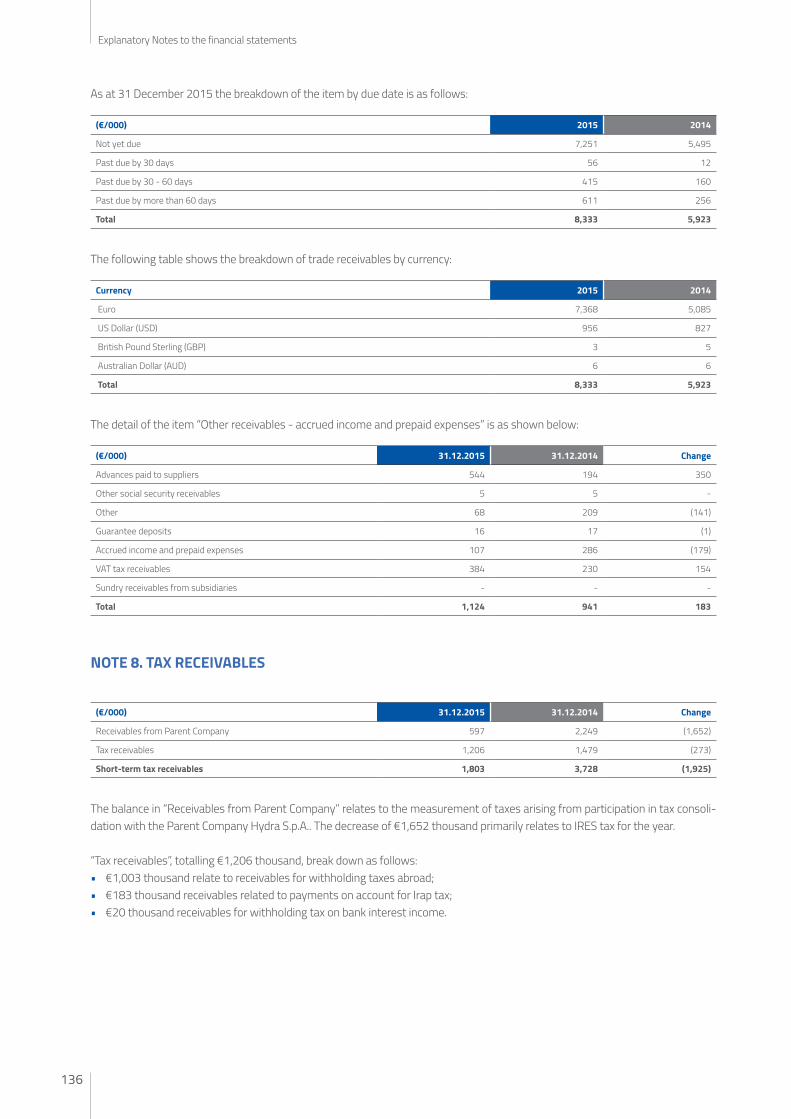
Explanatory Notes to the financial statements
136
As at 31 December 2015 the breakdown of the item by due date is as follows:
(€/000) 2015 2014
Not yet due 7,251 5,495
Past due by 30 days 56 12
Past due by 30 - 60 days 415 160
Past due by more than 60 days 611 256
Total 8,333 5,923
The following table shows the breakdown of trade receivables by currency:
Currency 2015 2014
Euro 7,368 5,085
US Dollar (USD) 956 827
British Pound Sterling (GBP) 3 5
Australian Dollar (AUD) 6 6
Total 8,333 5,923
The detail of the item “Other receivables - accrued income and prepaid expenses” is as shown below:
(€/000) 31.12.2015 31.12.2014 Change
Advances paid to suppliers 544 194 350
Other social security receivables 5 5 -
Other 68 209 (141)
Guarantee deposits 16 17 (1)
Accrued income and prepaid expenses 107 286 (179)
VAT tax receivables 384 230 154
Sundry receivables from subsidiaries - - -
Total 1,124 941 183
NOTE 8. TAX RECEIVABLES
(€/000) 31.12.2015 31.12.2014 Change
Receivables from Parent Company 597 2,249 (1,652)
Tax receivables 1,206 1,479 (273)
Short-term tax receivables 1,803 3,728 (1,925)
The balance in “Receivables from Parent Company” relates to the measurement of taxes arising from participation in tax consoli-dation with the Parent Company Hydra S.p.A.. The decrease of €1,652 thousand primarily relates to IRES tax for the year.
“Tax receivables”, totalling €1,206 thousand, break down as follows:• €1,003 thousand relate to receivables for withholding taxes abroad;• €183 thousand receivables related to payments on account for Irap tax;• €20 thousand receivables for withholding tax on bank interest income.

137
Explanatory Notes to the financial statements
NOTE 9. LOANS TO SUBSIDIARIES
(€/000) 31.12.2015 31.12.2014 Change
Non-current loans to subsidiaries - 11,484 (11,484)
Current loans to subsidiaries 268,200 244,737 23,463
Total 268,200 256,221 11,979
“Loans to subsidiaries” breaks down as follows:
Euro countervalue in USD
Finanziamenti
Datalogic Holdings Inc. 92,782 101,012
Datalogic Automation Inc. 41,334 45,000
Datalogic Automation S.r.l. 18,600 20,250
Datalogic ADC Singapore 918 1,000
Datalogic Hungary Kft 6,350
Datalogic ADC S.r.l. 3,000
Cash pooling
Datalogic Holdings Inc. 26,332
Datalogic Automation S.r.l. 25,775
Datalogic Automation Inc. 18,854
Datalogic IP-Tech S.r.l. 14,766
Datalogic ADC S.r.l. Sweden (branch) 6,127
Datalogic ADC S.r.l. S.p.A.in (branch) 5,396
Datalogic ADC S.r.l. UK (branch) 4,400
Datalogic ADC S.r.l. Germany (branch) 1,879
Datalogic ADC S.r.l. France (branch) 1,551
Datalogic ADC S.r.l. Netherland (branch) 136
Totale 268,200
NOTE 10. CASH AND CASH EQUIVALENTS
Cash and cash equivalents are broken down as follows for the purposes of the Cash Flow Statement:
(€/000) 31.12.2015 31.12.2014 Change
Bank and post office deposits 76,449 53,586 22,863
Cash and valuables on hand 15 15 -
Cash and cash equivalents for statement 76,464 53,601 22,863
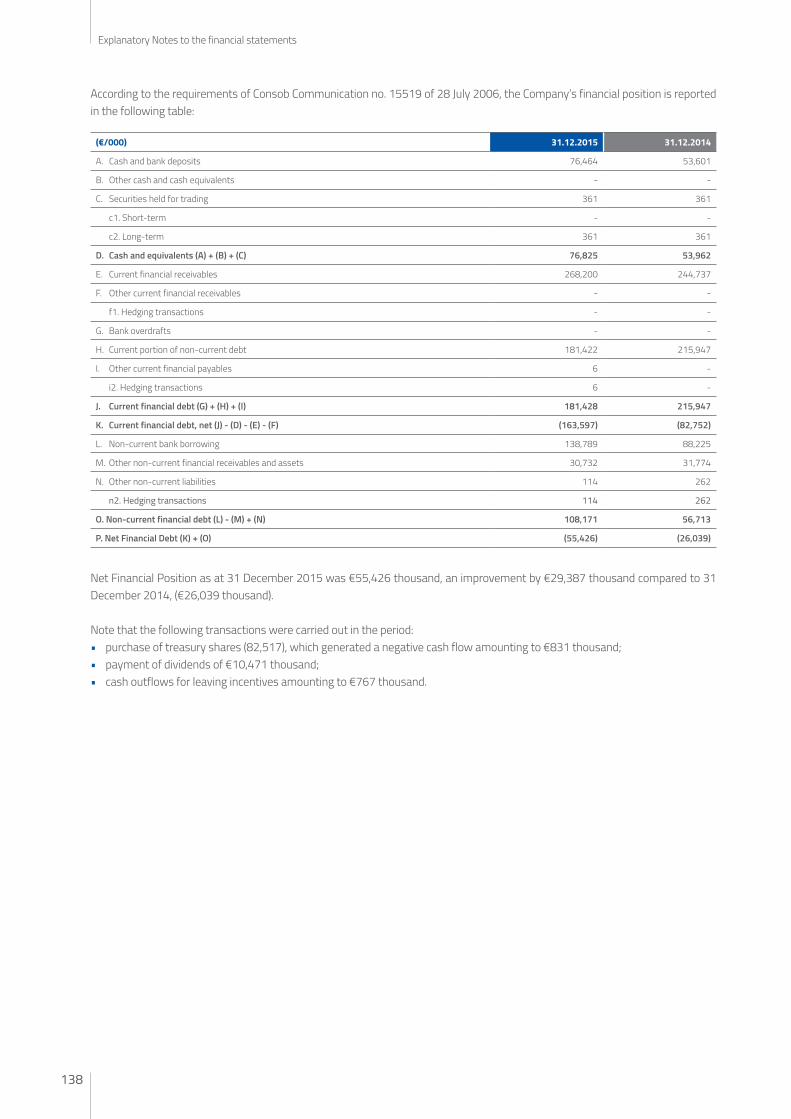
Explanatory Notes to the financial statements
138
According to the requirements of Consob Communication no. 15519 of 28 July 2006, the Company’s financial position is reported in the following table:
(€/000) 31.12.2015 31.12.2014
A. Cash and bank deposits 76,464 53,601
B. Other cash and cash equivalents - -
C. Securities held for trading 361 361
c1. Short-term - -
c2. Long-term 361 361
D. Cash and equivalents (A) + (B) + (C) 76,825 53,962
E. Current financial receivables 268,200 244,737
F. Other current financial receivables - -
f1. Hedging transactions - -
G. Bank overdrafts - -
H. Current portion of non-current debt 181,422 215,947
I. Other current financial payables 6 -
i2. Hedging transactions 6 -
J. Current financial debt (G) + (H) + (I) 181,428 215,947
K. Current financial debt, net (J) - (D) - (E) - (F) (163,597) (82,752)
L. Non-current bank borrowing 138,789 88,225
M. Other non-current financial receivables and assets 30,732 31,774
N. Other non-current liabilities 114 262
n2. Hedging transactions 114 262
O. Non-current financial debt (L) - (M) + (N) 108,171 56,713
P. Net Financial Debt (K) + (O) (55,426) (26,039)
Net Financial Position as at 31 December 2015 was €55,426 thousand, an improvement by €29,387 thousand compared to 31 December 2014, (€26,039 thousand).
Note that the following transactions were carried out in the period:• purchase of treasury shares (82,517), which generated a negative cash flow amounting to €831 thousand;• payment of dividends of €10,471 thousand;• cash outflows for leaving incentives amounting to €767 thousand.

139
Explanatory Notes to the financial statements
Information on Statement of Financial Position - Shareholders’ Equity and LiabilitiesNOTE 11. SHAREHOLDERS’ EQUITY
The detail of Equity accounts is shown below, while changes in Equity are reported in the specific statement.
(€/000) 31.12.2015 31.12.2014
Share capital 30,392 30,392
Share premium reserve 106,513 107,342
Extraordinary share-cancellation reserve 2,813 2,813
Treasury shares held in portfolio 4,488 5,319
Treasury share reserve 2,453 1,624
Share capital 146,659 147,490
Cash-flow hedge reserve (92) (190)
Valuation reserve at current value 508 218
Severance indemnity discounting reserve 88 80
Other reserves 504 108
Retained earnings 75,780 52,670
Earnings carried forward 28,630 16,636
Temporary reserve for exchange rate adjustment 16,443 6,509
Capital contribution reserve 958 958
Reserve for surplus from cancellation, Datalogic RE S.r.l. 204 204
Legal reserve 5,917 4,735
IAS reserve 8,423 8,423
Capital contribution reserve 15,204 15,204
Profit for the year 27,474 23,647
Total Shareholders’ Equity 250,417 223,915
SHARE CAPITALThe share capital as at 31 December 2014 and 31 December 2015 is reported below:
(€/000) Number of shares
Share capital Extraordinary share-
cancellation reserve
Share premium
reserve
Treasury shares
Treasury share reserve
Total
01.01.2015 58,254,398 30,392 2,813 107,342 5,319 1,624 147,490
Purchase of treasury shares (82,517) - - (829) (829) 829 (829)
Sale of treasury shares - - - - -
Costs for the purchase of treasury shares - - - - (2) - (2)
31.12.2015 58,171,881 30,392 2,813 106,513 4,488 2,453 146,659

Explanatory Notes to the financial statements
140
Ordinary sharesAs at 31 December 2015, the total number of ordinary shares was 58,446,491, including 274,610 held as treasury shares, making the number of shares in circulation at that date 58,171,881.
Treasury shares The item “Treasury shares”, amounting to €4,488 thousand, includes capital gains/(losses) resulting from the sale of treasury shares, net of purchases and related charges (€6,941 thousand). In 2015, the Company purchased 82,517 treasury shares for a total amount of €829 thousand, accounted for excluding purchase costs (€2 thousand).
For these purchases, in accordance with Article 2357 of the Italian Civil Code, the Treasury share reserve, in the amount of €2,453 thousand, was made unavailable by using the Share premium reserve.
OTHER RESERVES
Cash-flow hedge reserveFollowing adoption of IAS 39, changes in the fair value of derivative contracts designated as effective hedging instruments are recognised in accounts directly with Shareholders’ Equity, in the cash-flow hedge reserve. These contracts have been concluded to hedge exposure to the risk of interest rate fluctuations on variable-rate loans (negative by €121 thousand) and amounts are shown net of the tax effect (€29 thousand).
Capital contribution reserveThis reserve has been created after the recording under assets of the Equity investments in the Group Company Datalogic IP Tech S.r.l..
Reserve for surplus from cancellation, Datalogic Real Estate S.r.l.This reserve has been created after the cancellation of the Equity investment in the Group Company Datalogic Real Estate S.r.l..
RETAINED EARNINGS
IAS reserveThis reserve was created upon first-time adoption of international accounting standards at 1 January 2006 in accordance with IFRS 1.
DividendsOn 28 April 2015, the Ordinary Shareholders’ Meeting of Datalogic S.p.A. decided to distribute an ordinary dividend of €0.18 per share (€0.16 in 2014). The overall dividends began to be paid starting from 13 May 2015 and had been paid in full by 31 December.

141
Explanatory Notes to the financial statements
Classification of Shareholders’ Equity items
Nature/description Amount Possible use Amount available Summary of uses made in the 3 previous years
For hedging against losses
For other reasons
Share capital 30,392
Capital reserves 131,933
Share premium reserve 106,513 A,B 106,513 - -
Extraordinary share-cancellation reserve 2,813 A,B,C 2,813 - -
Treasury share reserve 2,453 - - - 11,008
Capital contribution reserve 15,204 A,B,C 15,204 - -
Merger surplus 204 A,B,C 204 - -
Revaluation reserves 258 A,B - - -
Treasury share reserve 4,488 - 4,488 - -
Other reserves 504
Cash-flow hedge reserve (92) - - - -
Valuation reserve for financial assets held for sale 508 - - - -
Severance indemnity discounting reserve 88 - - - -
Retained earnings 60,114
Earnings carried forward 25,975 A,B,C 25,975 - 5,480
Reserve for deferred tax assets 2,655 A,B 2,655 - -
Reserve for exchange rate adjustment 16,443 A,B 6,509 - -
Capital contribution reserve 958 B - - -
Legal reserve 5,917 B - - -
IAS/IFRS transition reserve 8,166 A,B,C - - -
Total 164,361
Non-distributable portion 120,165
Distributable residual portion 44,196
Key: A: for capital increase; B: to cover losses; C: for payments to Shareholders.
The Deferred tax reserve is a reserve temporarily non-distributable until the date on which the deferred tax assets posted on the statement of financial position are realised.
The temporary reserve for adjustment on exchange rates was created in application to IAS 21.15. This reserve comprises profit/losses generated by monetary elements, which are an integral part of the net investment of foreign managements. In particular, €16,443 thousand are related to the effect of exchange rates measurement at year-end for receivables for loans in US Dollars sup-plied to the subsidiaries Datalogic Automation Inc., Datalogic Automation S.r.l. and Datalogic Holdings Inc., and in 2015 to Datalogic ADC Singapore. No regulation and/or a defined reimbursement plan is provided for these loans, nor is it deemed probable that they will be reimbursed in the foreseeable future.The Actuarial gains and losses reserve comprises the Income Statement profit and losses pursuant to provisions set out by IAS 19R.

Explanatory Notes to the financial statements
142
NOTE 12. SHORT/LONG-TERM BORROWINGS AND FINANCIAL LIABILITIES
The breakdown of this item is as detailed below:
(€/000) 31.12.2015 31.12.2014 Change
Bank loans 171,331 162,166 9,165
Loans by Group companies/cash pooling - netting 148,274 141,209 7,065
Payables for leasing 526 797 (271)
Other loans 80 - 80
Total financial payables 320,211 304,172 16,039
Financial payables are represented as follows:
(€/000) due within 12 months
after 12 months after 5 years Total
Current accounts/cash pooling 148,274 - - 148,274
Bank loans, mortgages and other financial institutions 33,068 138,789 - 171,857
Other loans 80 - - 80
Total 181,422 138,789 - 320,211
The “Current accounts/cash pooling” item relates to payables to Group companies owing to cash pooling agreements for cen-tralised liquidity management.
BANK LOANSFollowing is the breakdown of changes in “Bank loans” as at 31 December 2015:
2015 2014
01.01.2015 162,166 224,583
Foreign exchange differences 930 1,754
Increases 139,277 39,500
Repayments (125,218) (65,735)
Decreases for loan repayments (5,824) (37,936)
31.12.2015 171,331 162,166
On 24 February 2015, the Company signed a loan agreement with a pool of banks for the amount of €140 million and redeemed at the same time, previous loans amounting to €126 million.This transaction allowed for an increase in the average life of the financial debt and the reduction in the related charges.
Guarantees given by banks in the Company’s favour total €898 thousand. Moreover, the Company issued a credit mandate in the amount of €4,187 related to the issue of trade guarantees in the interest of subsidiaries and a pledge in securities of €360 thou-sand.
Covenants The companies have been asked to respect certain financial covenants for the following loans, on a semi-annual or annual basis, as summarised in the table below:
Bank Company Currency Outstanding debt
Covenant Frequency Reference statements
Mediobanca 1 Datalogic S.p.A. Euro 12,000,000 Ebitda/OFN PFN/Ebitda semi-annual Datalogic Group
Club Deal 2 Datalogic S.p.A. Euro 140,000,000 Ebitda/OFN PFN/Ebitda semi-annual Datalogic Group
Key: PFN = Net Financial Position; OFN = Net financial expenses.
As at 31 December 2015 all covenants were respected.

143
Explanatory Notes to the financial statements
Financial leases In past years, the Company entered a financial lease agreement for the telepresence system this year. The following table shows the amount of future instalments deriving from financial leases and the current value of the instalments:
(€/000) 31 December 2015 31 December 2014
Minimum payments Current value of payments
Minimum payments Current value of payments
Within the year 273 253 272 240
After one year but within 5 years 279 273 581 557
> 5 years - - - -
Total minimum payments 552 526 854 797
Less interest expenses (26) - (57) -
Current value of lease costs 526 526 797 797
NOTE 13. DEFERRED TAXES
Deferred tax assets and liabilities stem both from positive items already recognised in the Income Statement and subject to de-ferred taxation under current tax regulations and temporary differences between balance-sheet assets and liabilities and their relevant taxable value.
Below we show the main items forming deferred tax assets and deferred tax liabilities and changes occurring in them over the year:
Deferred tax liabilities (€/000) Exchange rate adjustment
Depreciation and Amortisation
Provisions Others Total
As at 1 January 2015 4,018 1,645 (63) 59 5,659
Provisioned in (released from) Income Statement 598 (244) (26) (1) 327
Provisioned in (released from) Shareholders’ Equity 2,490 - - (7) 2,483
As at 31 December 2015 7,106 1,401 (89) 51 8,469
Deferred tax assets (€/000) Exchange rate adjustment
Asset write-downs Allocations Others Total
As at 1 January 2015 1,232 0 662 67 1,961
Provisioned in (released from) Income Statement - - 87 (1) 86
Provisioned in (released from) Shareholders’ Equity (157) - - (43) (200)
Other movements - - - 1 1
As at 31 December 2015 1,075 0 749 24 1,848
NOTE 14. POST-EMPLOYMENT BENEFITS
(€/000) 2015 2014
01.01.2015 593 783
Amount allocated in the period 219 184
Amount transferred for transfer of employment relationships 6 (201)
Uses (292) (54)
Social security receivables for the employee severance indemnity reserve 1 (119)
31.12.2015 527 593
The item “Uses” is related to €258 thousand for resignations and €34 thousand for requests of advance payments.

Explanatory Notes to the financial statements
144
NOTE 15. PROVISIONS FOR RISKS AND CHARGES
The breakdown of the “Risks and charges” item is as follows:
(€/000) 31.12.2015 31.12.2014 Change
Long-term provisions for risks and charges 3,069 2,362 707
Short-term provisions for risks and charges 77 114 (37)
Total provisions for risks and charges 3,146 2,476 670
Below we show the detailed breakdown of and changes in this item:
(€/000) 31.12.2014 Increases (Decreases) 31.12.2015
Provision for management incentive scheme 2,362 707 0 3,069
Provision for tax liabilities 114 2 (39) 77
Total provisions for risks and charges 2,476 709 (39) 3,146
The increase in the “Provision for management incentive scheme” is attributable to the estimate on the portion pertaining to the provision for a long-term plan for directors and managers.
NOTE 16. TRADE AND OTHER PAYABLES
This table shows the details of trade and other payables:
(€/000) 31.12.2015 31.12.2014 Change
Trade payables 3,239 4,073 (834)
Trade payables due within 12 months 2,856 3,645 (789)
Payables to the Group 383 428 (45)
Other short-term payables 5,185 3,020 2,165
Accrued liabilities and deferred income 485 503 (18)
OTHER PAYABLES - ACCRUED LIABILITIES AND DEFERRED INCOMEThe detailed breakdown of “Other payables” was as follows:
(€/000) 31.12.2015 31.12.2014 Change
Payables to pension and social security agencies 821 690 131
Payables to employees 1,556 1,859 (303)
Directors’ remuneration payable 284 240 44
Deferred income on investment grants 483 501 (18)
Other payables to the Group 2,440 134 2,306
Other payables 86 99 (13)
Total 5,670 3,523 2,147
Amounts payable to employees represent the amount due for salaries and vacations accrued by employees as at the reporting date.
The increase in item “Other payables to the Group” is mainly related to ongoing intercompany payments at the reporting date.The item “Deferred income on investment grants” totalling €483 thousand relates to the reclassification of public capital grants on assets.These grants were reversed from equity reserves based on the provisions of IAS 20 and reallocated among deferred income, in order to match them with the actual cost incurred, i.e. with depreciation of the assets to which they refer.

145
Explanatory Notes to the financial statements
NOTEE 17. TAX PAYABLES
(€/000) 31.12.2015 31.12.2014 Change
Short-term tax payables 447 431 16
Long-term tax payables - - -
Total tax payables 447 431 16
Income tax payables only include liabilities for definite and calculated tax due and it is composed as follows:• €433 thousand, Irpef withholding taxes related to employees;• €14 thousand, withholding taxes on remuneration to freelancers.
Information on the Income StatementNOTE 18. REVENUES
(€/000) 31.12.2015 31.12.2014 Change
Revenues from services 21,427 18,390 3,037
Total revenues 21,427 18,390 3,037
Revenues from sales and services rose by €3,037 thousand compared to the previous year.
NOTE 19. COST OF GOODS SOLD AND OPERATING COSTS
(€/000) 31.12.2015 31.12.2014 Change
Total cost of goods sold (1) 1,681 46 1,635
of which non-recurring - -
Total operating costs (2) 17,986 19,489 (1,503)
R&D expenses 430 1,357 (927)
of which non-recurring - -
Distribution expenses 814 396 418
of which non-recurring - -
General and administrative expenses 16,538 17,437 (899)
of which non-recurring 486 790 (304)
Other operating costs 204 299 (95)
of which non-recurring - -
Total (1+2) 19,667 19,535 132
of which non-recurring costs 486 790 (304)
Non-recurring costs result from in-house reorganisation of the Company.
Item “Cost of goods sold” reported an increase of €1,635 due to costs related to Group projects, such as the optimisation of pro-duction and organisation costs, as well as centralisation of assets and internal organisation functions.

Explanatory Notes to the financial statements
146
TOTAL OPERATING COSTS (2)“Research and Development” expenses amounted to €430 thousand and are made up as follows:• Payroll & employee benefits €81 thousand• Other costs €322 thousand• Amortisation/Depreciation €27 thousand
In “Other costs” item, the most relevant items are costs due to maintenance and software assistance, in the amount of €314 thousand.
“Distribution” expenses amounted to €814 thousand and are made up as follows:
• Payroll & employee benefits €210 thousand• Advertising costs €429 thousand• Other costs €139 thousand• Amortisation/Depreciation €37 thousand
In “Other costs” item, the most relevant items are costs due to maintenance and software assistance, in the amount of €50 thou-sand.
“General and administration” expenses totalled €16,538 thousand, and consisted of:
• Payroll & employee benefits €8,366 thousand• Other costs €6,586 thousand• Amortisation/Depreciation €1,586 thousand
The most significant items in “Other costs” were:
• Costs for administrative and various advisory services €1,235 thousand• Software and hardware maintenance and assistance €1,627 thousand• Remuneration to directors and representatives €948 thousand• Costs for use of telephones, faxes and modem €928 thousand• Rental and building maintenance expenses €389 thousand• Employee travel expenses €242 thousand• Vehicle leasing expenses €254 thousand• Accounts certification expenses €180 thousand• Stock exchange costs €147 thousand• Remuneration of board of statutory auditors €68 thousand• Entertainment expenses €63 thousand• Advertising and marketing costs €50 thousand• Insurances €47 thousand
The breakdown of “Other operating costs” is as follows:
(€/000) 31.12.2015 31.12.2014 Change
Allocation to the provision for risks - - -
Capital losses on assets - 6 (6)
Contingent liabilities 10 20 (10)
Non-income taxes 194 273 (79)
Other - - -
Total other operating costs 204 299 (95)

147
Explanatory Notes to the financial statements
BREAKDOWN OF COSTS BY TYPEThe following table provides the details of total costs (cost of goods sold + total operating costs) by type, for the main items:
(€/000) 31.12.2015 31.12.2014 Change
Payroll & employee benefits 9,574 10,322 (748)
Amortisation and depreciation 1,653 1,541 112
Directors’ remuneration 948 873 75
Technical, legal and tax advisory services 1,816 1,684 132
Rental and building maintenance 402 340 62
Software maintenance and assistance 1,992 1,783 209
Utilities and telephone subscriptions 939 616 323
Non-income taxes 194 273 (79)
Accounts certification expenses 180 183 (3)
Vehicle leasing and maintenance 351 270 81
Advertising and Marketing 507 617 (110)
Travel & accommodation 327 261 66
Stock exchange costs and membership fees 270 286 (16)
Board of Statutory Auditors’ remuneration 68 70 (2)
Entertainment expenses 69 94 (25)
Patents 44 23 21
Other costs 333 299 34
Total (1+2) 19,667 19,535 132
The detailed breakdown of payroll & employee benefits is as follows:
(€/000) 31.12.2015 31.12.2014 Change
Wages and salaries 6,255 5,214 1,041
Social security charges 1,784 1,501 283
Employee severance indemnities 245 203 42
Retirement and similar benefits 187 155 32
Medium/long-term managerial incentive plan 707 2,064 (1,357)
Reimbursements for seconded personnel (53) (189) 136
Other costs 449 1,374 (925)
Total 9,574 10,322 (748)
NOTE 20. OTHER OPERATING REVENUES
The detailed breakdown of this item is as follows:
(€/000) 31.12.2015 31.12.2014 Change
Reimbursement of miscellaneous costs 13 77 (64)
Incidental income and cost cancellation 0 60 (60)
Rents 521 521 0
Capital gains on asset disposals 0 9 (9)
Other 73 73 0
Total other revenues 607 740 (133)
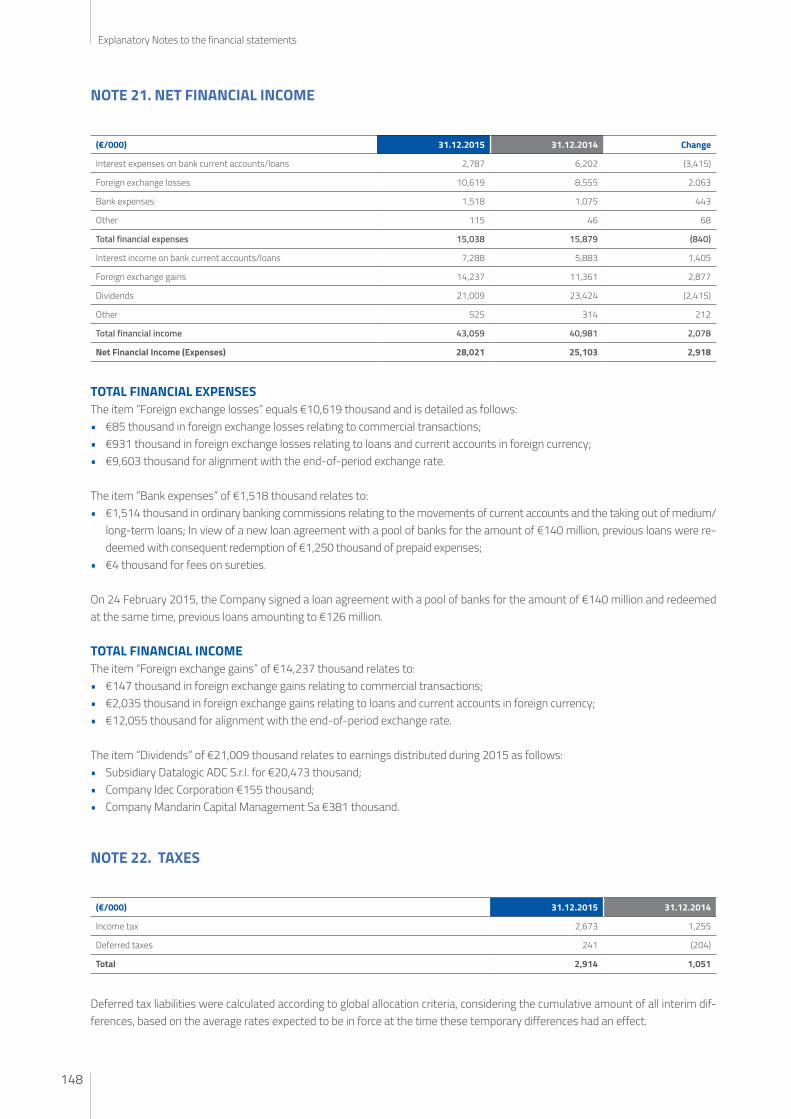
Explanatory Notes to the financial statements
148
NOTE 21. NET FINANCIAL INCOME
(€/000) 31.12.2015 31.12.2014 Change
Interest expenses on bank current accounts/loans 2,787 6,202 (3,415)
Foreign exchange losses 10,619 8,555 2,063
Bank expenses 1,518 1,075 443
Other 115 46 68
Total financial expenses 15,038 15,879 (840)
Interest income on bank current accounts/loans 7,288 5,883 1,405
Foreign exchange gains 14,237 11,361 2,877
Dividends 21,009 23,424 (2,415)
Other 525 314 212
Total financial income 43,059 40,981 2,078
Net Financial Income (Expenses) 28,021 25,103 2,918
TOTAL FINANCIAL EXPENSESThe item “Foreign exchange losses” equals €10,619 thousand and is detailed as follows:• €85 thousand in foreign exchange losses relating to commercial transactions;• €931 thousand in foreign exchange losses relating to loans and current accounts in foreign currency;• €9,603 thousand for alignment with the end-of-period exchange rate.
The item “Bank expenses” of €1,518 thousand relates to: • €1,514 thousand in ordinary banking commissions relating to the movements of current accounts and the taking out of medium/
long-term loans; In view of a new loan agreement with a pool of banks for the amount of €140 million, previous loans were re-deemed with consequent redemption of €1,250 thousand of prepaid expenses;
• €4 thousand for fees on sureties.
On 24 February 2015, the Company signed a loan agreement with a pool of banks for the amount of €140 million and redeemed at the same time, previous loans amounting to €126 million.
TOTAL FINANCIAL INCOMEThe item “Foreign exchange gains” of €14,237 thousand relates to:• €147 thousand in foreign exchange gains relating to commercial transactions;• €2,035 thousand in foreign exchange gains relating to loans and current accounts in foreign currency;• €12,055 thousand for alignment with the end-of-period exchange rate.
The item “Dividends” of €21,009 thousand relates to earnings distributed during 2015 as follows:• Subsidiary Datalogic ADC S.r.l. for €20,473 thousand;• Company Idec Corporation €155 thousand;• Company Mandarin Capital Management Sa €381 thousand.
NOTE 22. TAXES
(€/000) 31.12.2015 31.12.2014
Income tax 2,673 1,255
Deferred taxes 241 (204)
Total 2,914 1,051
Deferred tax liabilities were calculated according to global allocation criteria, considering the cumulative amount of all interim dif-ferences, based on the average rates expected to be in force at the time these temporary differences had an effect.

149
Explanatory Notes to the financial statements
Notice of Auditing Firm’s FeesPursuant to article 149-duodecies of the Issuer Regulation, implementing Legislative Decree 58 of 24 February 1998, the follow-ing is the summary schedule of fees pertaining to the year 2014 provided by the independent auditors and divided in auditing and other services.
(€/000) Fees for auditing services
Other remuneration
Datalogic S.p.A. 162 11
RELATED-PARTY TRANSACTIONS
Related parties(€/000)
Hydra Immobiliare
Hydra S.p.A.
St. Ass. Caruso
ADC Group Automation Group
Informatics Real Estate Group
Datalogic IP Tech S.r.l.
Total
Receivables
Trade receivables - - - 5,818 1,818 438 85 98 8,258
Financial receivables - - - 322,487 124,174 - - 14,766 461,428
Tax receivables - 597 - - - - - - 597
Payables
Trade payables 1 - 94 2,662 44 2 6 35 2,845
Tax payables - - - - - - - 57 57
Financial payables - - - 235,319 99,820 1,680 4,682 - 341,502
Costs
Sales costs 71 - 188 206 45 - - 4 514
Financial costs - - - 362 81 2 5 - 450
Revenues
Trade receivables - - - 16,734 6,163 375 85 483 23,840
Financial revenues - - - 6,012 1,145 - - 69 7,226
TRANSACTIONS WITH COMPANIES CONTROLLED BY SHAREHOLDERSTransactions with Hydra Immobiliare, a company controlled by the reference Shareholders of the Company, refer to the rental of property by the Company (€71 thousand).
Company transactions with the Parent Company (Hydra S.p.A.) mainly relate to the Ires receivable of €597 thousand; the Company has joined the tax consolidation scheme, as a consolidated company (Hydra is the consolidator).
TRANSACTIONS WITH COMPANIES CONTROLLED BY MEMBERS OF THE BOARD OF DIRECTORSStudio Associato Caruso (headed up by the Director, Pier Paolo Caruso) billed the Company €188 thousand for tax consulting ser-vices in 2015.
REMUNERATION PAID TO DIRECTORS AND STATUTORY AUDITORS For this information, please refer to the report on remuneration which will be published pursuant to article 123-ter of the T.U.F. [Consolidated Law on Finance] and will be published on the website www.datalogic.com.
The Chairman of the Board of Directors(Mr. Romano Volta)

Annexes

151
Annexes
(€/000) Notes 31.12.2014 Reclassifications 31.12.2014Riclassified
1) Total revenues 17 464,645 464,645
Revenues from sale of products 441,567 441,567
Revenues from services 23,078 23,078
of which non-recurring 99
of which with related parties 6,053 6,053
2) Cost of goods sold 18 240,056 (2,886) 237,170
of which non-recurring 18 1,069 1,069
of which with related parties 316 316
Gross Profit (1-2) 224,589 2,886 227,475
3) Other operating revenues 19 2,239 2,239
of which non-recurring 19 0
of which with related parties 7 7
4) R&D expenses 18 43,196 43,196
of which non-recurring 18 0
of which amortisation, depreciation and write-downs pertaining to acquisitions 88 88
of which with related parties 18 9 9
5) Distribution expenses 18 86,438 2,886 89,324
of which non-recurring 18 1,119 1,119
of which with related parties 46 46
6) General and administrative expenses 18 46,501 46,501
of which non-recurring 18 1,950 1,950
of which amortisation, depreciation and write-downs pertaining to acquisitions 18 5,405 5,405
of which with related parties 1,093 1,093
7) Other operating expenses 18 3,785 3,785
of which non-recurring 18 1,579 1,579
Total operating costs 179,920 2,886 182,806
Operating result 46,908 0 46,908
8) Financial Income 20 26,831 26,831
of which with related parties 27 11
9) Financial expenses 20 34,585 34,585
Net Financial Income (expenses) (8-9) (7,754) 0 (7,754)
10) Profits from associates 3 25 25
Profit/(Loss) before taxes from the operating assets 39,179 0 39,179
Income tax 21 8,322 8,322
Profit/(Loss) for the period 30,857 0 30,857
Basic earnings/(loss) per share (€) 22 0.5306 0.5306
Diluted earnings/(loss) per share (€) 22 0.5306 0.5306
Annexes 12014 RESTATED CONSOLIDATED INCOME STATEMENT
Note: 2014 figures have been reclassified to render them consistent with 2015 figures, in light of some reorganisation made.
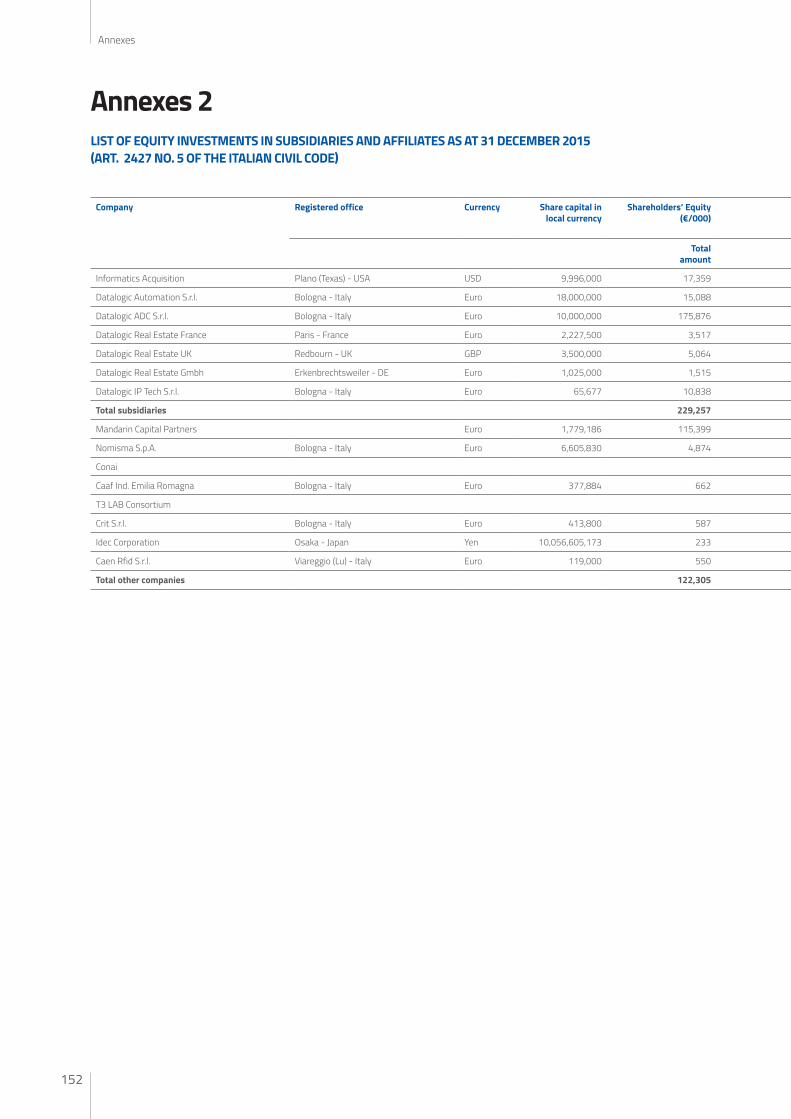
Annexes
152
Annexes 2LIST OF EQUITY INVESTMENTS IN SUBSIDIARIES AND AFFILIATES AS AT 31 DECEMBER 2015 (ART. 2427 NO. 5 OF THE ITALIAN CIVIL CODE)
Company Registered office Currency Share capital in local currency
Shareholders’ Equity (€/000)
Shareholders’ Equity (€/000)
Net Profit/(Loss) for the year (€/000)
Ownership Carrying value including provisions
for future charges
Differences
Total amount
Pro-rata amount
Total amount
Pro-rata amount (B) (B)-(A)
Informatics Acquisition Plano (Texas) - USA USD 9,996,000 17,359 17,359 (376) (376) 100% 11,011 (6,348)
Datalogic Automation S.r.l. Bologna - Italy Euro 18,000,000 15,088 15,088 9,491 9,491 100% 33,650 18,562
Datalogic ADC S.r.l. Bologna - Italy Euro 10,000,000 175,876 175,876 41,163 41,163 100% 105,463 (70,413)
Datalogic Real Estate France Paris - France Euro 2,227,500 3,517 3,517 (14) (14) 100% 3,919 402
Datalogic Real Estate UK Redbourn - UK GBP 3,500,000 5,064 5,064 (64) (64) 100% 3,668 (1,396)
Datalogic Real Estate Gmbh Erkenbrechtsweiler - DE Euro 1,025,000 1,515 1,515 (117) (117) 100% 1,806 291
Datalogic IP Tech S.r.l. Bologna - Italy Euro 65,677 10,838 4,996 (2,705) (1,247) 46% 15,082 10,086
Total subsidiaries 229,257 223,416 47,378 48,836 174,599 (48,817)
Mandarin Capital Partners Euro 1,779,186 115,399 692 3,192 19 0.60% 17 (675) as at 30.06.15
Nomisma S.p.A. Bologna - Italy Euro 6,605,830 4,874 4 80 0 0.08% 7 3 as at 31.12.14
Conai 0 n.a.
Caaf Ind. Emilia Romagna Bologna - Italy Euro 377,884 662 6 0 0 0.96% 4 (3) as at 31.08.15
T3 LAB Consortium 7 7
Crit S.r.l. Bologna - Italy Euro 413,800 587 0 (10) 0 0.01% 52 52 as at 31.12.14
Idec Corporation Osaka - Japan Yen 10,056,605,173 233 0 0 0 1.25% 3,394 n.a. as at 31.03.15
Caen Rfid S.r.l. Viareggio (Lu) - Italy Euro 119,000 550 110 55 11 20.0% 550 440 as at 31.12.14
Total other companies 122,305 813 3,317 31 4,031 (176)

153
Annexes
Annexes 2LIST OF EQUITY INVESTMENTS IN SUBSIDIARIES AND AFFILIATES AS AT 31 DECEMBER 2015 (ART. 2427 NO. 5 OF THE ITALIAN CIVIL CODE)
Company Registered office Currency Share capital in local currency
Shareholders’ Equity (€/000)
Shareholders’ Equity (€/000)
Net Profit/(Loss) for the year (€/000)
Ownership Carrying value including provisions
for future charges
Differences
Total amount
Pro-rata amount
Total amount
Pro-rata amount (B) (B)-(A)
Informatics Acquisition Plano (Texas) - USA USD 9,996,000 17,359 17,359 (376) (376) 100% 11,011 (6,348)
Datalogic Automation S.r.l. Bologna - Italy Euro 18,000,000 15,088 15,088 9,491 9,491 100% 33,650 18,562
Datalogic ADC S.r.l. Bologna - Italy Euro 10,000,000 175,876 175,876 41,163 41,163 100% 105,463 (70,413)
Datalogic Real Estate France Paris - France Euro 2,227,500 3,517 3,517 (14) (14) 100% 3,919 402
Datalogic Real Estate UK Redbourn - UK GBP 3,500,000 5,064 5,064 (64) (64) 100% 3,668 (1,396)
Datalogic Real Estate Gmbh Erkenbrechtsweiler - DE Euro 1,025,000 1,515 1,515 (117) (117) 100% 1,806 291
Datalogic IP Tech S.r.l. Bologna - Italy Euro 65,677 10,838 4,996 (2,705) (1,247) 46% 15,082 10,086
Total subsidiaries 229,257 223,416 47,378 48,836 174,599 (48,817)
Mandarin Capital Partners Euro 1,779,186 115,399 692 3,192 19 0.60% 17 (675) as at 30.06.15
Nomisma S.p.A. Bologna - Italy Euro 6,605,830 4,874 4 80 0 0.08% 7 3 as at 31.12.14
Conai 0 n.a.
Caaf Ind. Emilia Romagna Bologna - Italy Euro 377,884 662 6 0 0 0.96% 4 (3) as at 31.08.15
T3 LAB Consortium 7 7
Crit S.r.l. Bologna - Italy Euro 413,800 587 0 (10) 0 0.01% 52 52 as at 31.12.14
Idec Corporation Osaka - Japan Yen 10,056,605,173 233 0 0 0 1.25% 3,394 n.a. as at 31.03.15
Caen Rfid S.r.l. Viareggio (Lu) - Italy Euro 119,000 550 110 55 11 20.0% 550 440 as at 31.12.14
Total other companies 122,305 813 3,317 31 4,031 (176)

Annexes
154
Annexes 3HYDRA S.p.A.Registered office: via L. Alberti no. 1 - 40137 Bologna (BO) Share capital: Euro 1,200,000 fully paid up Bologna Companies Register n. 00445970379Bologna REA (Economic and Administrative Repertoire) no. 202001
FINANCIAL STATEMENTS AS AT 31.12.2014
STATEMENT OF FINANCIAL POSITION
ASSETS (€/000) 31.12.2014 31.12.2013
A) Unpaid subscribed capital (of which already called up)
B) Non-current assets
I. Intangible
1) Start-up and expansion costs
2) Research, development and advertising costs
3) Industrial patents and intellectual property rights
4) Concessions, licenses, trademarks and similar rights
5) Goodwill
6) Assets in progress and payments on account
7) Other intangible assets 90,054
90,054
II. Tangible
1) Land and buildings
2) Plant and machinery
3) Industrial and commercial equipment
4) Other tangible assets 1,422 1,422
5) Assets in progress and payments on account
1,422 1,422
III. Financial assets
1) Equity investments in:
a) subsidiaries 58,903,176 59,982,859
b) associates
c) parent companies
d) other companies 10,816,573 11,774,141
69,719,749 71,757,000
2) Receivables
a) due from subsidiaries
- within 12 months
- after 12 months
b) due from associates
- within 12 months
- after 12 months
c) due from parent companies
- within 12 months
- after 12 months
d) due from others
- within 12 months
- after 12 months 3,355,598 831,457
3,355,598 831,457
3,355,598 831,457
3) Treasury shares
4) Treasury shares (total nominal value) 73,075,347 72,588,457
Total non-current assets 73,076,769 72,679,933
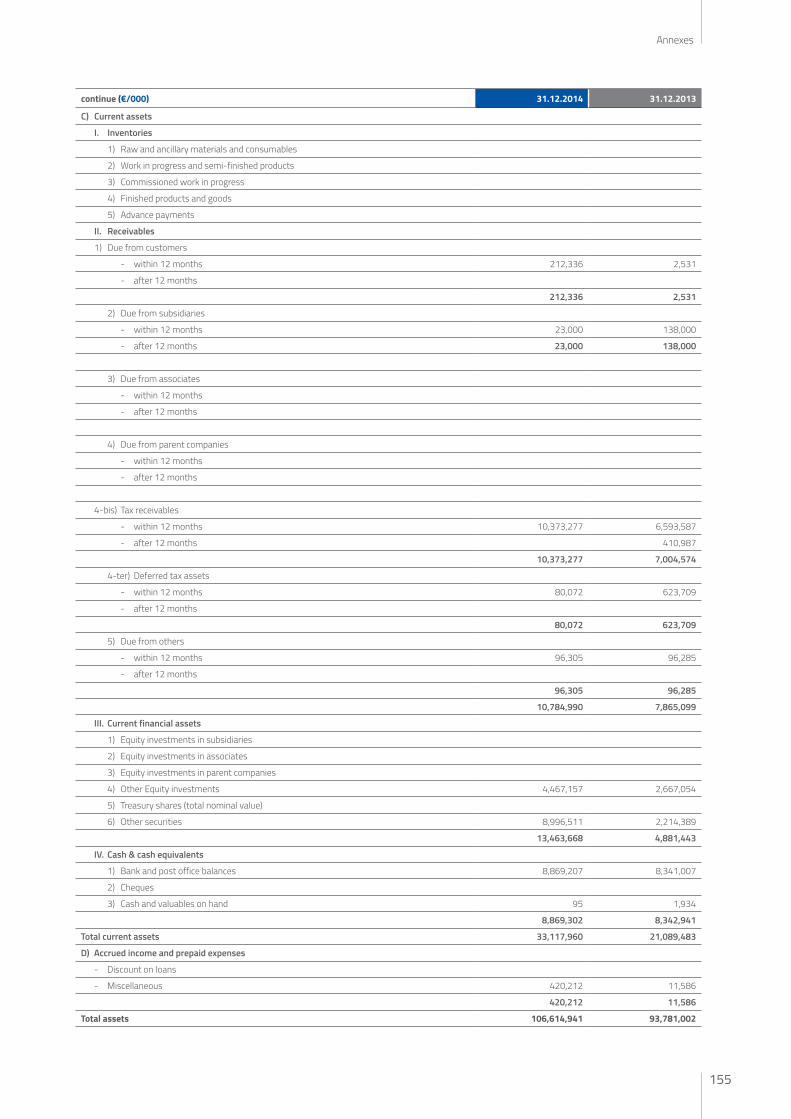
155
Annexes
continue (€/000) 31.12.2014 31.12.2013
C) Current assets
I. Inventories
1) Raw and ancillary materials and consumables
2) Work in progress and semi-finished products
3) Commissioned work in progress
4) Finished products and goods
5) Advance payments
II. Receivables
1) Due from customers
- within 12 months 212,336 2,531
- after 12 months
212,336 2,531
2) Due from subsidiaries
- within 12 months 23,000 138,000
- after 12 months 23,000 138,000
3) Due from associates
- within 12 months
- after 12 months
4) Due from parent companies
- within 12 months
- after 12 months
4-bis) Tax receivables
- within 12 months 10,373,277 6,593,587
- after 12 months 410,987
10,373,277 7,004,574
4-ter) Deferred tax assets
- within 12 months 80,072 623,709
- after 12 months
80,072 623,709
5) Due from others
- within 12 months 96,305 96,285
- after 12 months
96,305 96,285
10,784,990 7,865,099
III. Current financial assets
1) Equity investments in subsidiaries
2) Equity investments in associates
3) Equity investments in parent companies
4) Other Equity investments 4,467,157 2,667,054
5) Treasury shares (total nominal value)
6) Other securities 8,996,511 2,214,389
13,463,668 4,881,443
IV. Cash & cash equivalents
1) Bank and post office balances 8,869,207 8,341,007
2) Cheques
3) Cash and valuables on hand 95 1,934
8,869,302 8,342,941
Total current assets 33,117,960 21,089,483
D) Accrued income and prepaid expenses
- Discount on loans
- Miscellaneous 420,212 11,586
420,212 11,586
Total assets 106,614,941 93,781,002

Annexes
156
LIABILITIES (€/000) 31.12.2014 31.12.2013
A) Shareholders’ Equity
I. Share capital 1,200,000 1,200,000
II. Share premium reserve
III. Revaluation reserve
IV. Legal reserve 6,240,000 6,240,000
V. Statutory reserves
VI. Treasury share reserve
VII. Other reserves
Translation and rounding reserve 1 1
1 1
VIII. Earnings/(Losses) carried forward 28,001,803 22,158,598
IX. Profit for the year 12,247,205 5,843,205
Total Shareholders’ Equity 47,689,009 35,441,804
B) Provisions for risks and charges
1) Provision for retirement and similar benefits
2) Provision for taxes (including deferred taxes)
3) Others 49,399 49,399
Total provisions for risks and charges 49,399 49,399
C) Provision for employee severance indemnities
D) Payables
1) Bonds
- within 12 months 9,650,000 29,000,000
- after 12 months 30,000,000 9,650,000
39,650,000 38,650,000
2) Convertible bonds
- within 12 months
- after 12 months
3) Due to Shareholders for loans
- within 12 months
- after 12 months
4) Bank borrowings
- within 12 months 9,999,601 10,000,000
- after 12 months
9,999,601 10,000,000
5) Due to other lenders
- within 12 months
- after 12 months
6) Advance payments
- within 12 months
- after 12 months
7) Due to suppliers
- within 12 months 130,784 37,193
- after 12 months
130,784 37,193
8) Payables consisting of paper credit
- within 12 months
- after 12 months

157
Annexes
continue (€/000) 31.12.2014 31.12.2013
9) Due to subsidiaries
- within 12 months 8,719,000 8,225,000
- after 12 months
8,719,000 8,225,000
10) Due to associates
- within 12 months
- after 12 months
11) Due to parent companies
- within 12 months
- after 12 months
12) Tax payables
- within 12 months 106,169 276,002
- after 12 months
106,169 276,002
13) Due to pension and social security agencies
- within 12 months 2,215 2,831
- after 12 months
2,215 2,831
14) Other payables
- within 12 months 268,764 1,052,995
- after 12 months
268,764 1,052,995
Total payables 58,876,533 58,244,021
E) Accrued liabilities and deferred income
- Premium on loans
- Miscellaneous 45,778
45,778
Total liabilities 106,614,941 93,781,002

Annexes
158
MEMORANDUM ACCOUNTS
(€/000) 31.12.2014 31.12.2013
1) Risks undertaken by the Company
Guarantees
- to subsidiaries
- to associates
- to parent companies
- to subsidiaries under parent companies’ control
- to other companies
Endorsements
- to subsidiaries
- to associates
- to parent companies
- to subsidiaries under parent companies’ control
- to other companies
Other personal guarantees
- to subsidiaries
- to associates
- to parent companies
- to subsidiaries under parent companies’ control
- to other companies
Collaterals
- to subsidiaries
- to associates
- to parent companies
- to subsidiaries under parent companies’ control
- to other companies
Other risks
- receivables assigned with recourse
- other
2) Commitments undertaken by the Company 3,900,765
3) Third-party assets at the Company
- Outsourced products
- Assets deposited or on free loan at the Company
- Pledged assets or assets served as security deposit at the Company
- Other
4) Other memorandum accounts
Total memorandum accounts 3,900,765

159
Annexes
INCOME STATEMENT
(€/000) 31.12.2014 31.12.2013
A) Production value
1) Revenues from sales of products and services
2) Change in inventories of work in progress and semi-finished and finished products
3) Change in commissioned work in progress
4) In-house enhancement of tangible assets
5) Other revenues and income:
- Miscellaneous 176,734 48,631
- Revenue grants
- Investment grants (year’s portion)
176,734 48,631
Total production value 176,734 48,631
B) Production costs
6) Raw & ancillary materials, consumables and goods
7) Services 1,539,848 380,850
8) Rental, hire, leasing and royalties
9) Payroll & employee benefits
a) Wages & salaries
b) Social security charges
c) Employee severance indemnities
d) Retirement and similar benefits
e) Other costs
10) Amortisation, depreciation and write-downs
a) Amortisation of intangible assets 90,054 337,651
b) Depreciation of tangible assets
c) Other write-downs of non-current assets
d) Write-downs of current receivables and of cash equivalents
90,054 337,651
11) Changes in inventories of raw & ancillary materials, consumables and goods
12) Risk provisioning 49,399
13) Other provisioning
14) Miscellaneous operating expenses 48,220 33,333
Total production costs 1,678,122 801,233
Difference between production value and costs (A-B) (1,501,388) (752,602)
C) Financial Income and expenses
15) Income from Equity investments:
- from subsidiaries 11,685,169 6,000,048
- from associates
- from other 1,732,210 1,793,795
13,417,379 7,793,843

Annexes
160
continue (€/000) 31.12.2014 31.12.2013
16) Other financial income:
a) From non-current receivables
- from subsidiaries
- from associates
- from parent companies
- from others
b) From securities held as non-current assets
c) From securities held as current assets 221,336 64,028
d) Income other than the above:
- from subsidiaries
- from associates
- from parent companies
- from others 355,701 654,340
577,037 718,368
13,994,416 8,512,211
17) Interest and other financial expenses:
- from subsidiaries
- from associates
- from parent companies
- from others 625,192 2,584,723
625,192 2,584,723
17-bis) Foreign exchange gains and losses 293,067 24
Total financial income and expenses 13,662,291 5,927,512
D) Adjustments to value of financial assets
18) Write-ups:
a) of Equity investments
b) of non-current financial assets
c) of securities held as current assets
19) Write-downs:
a) of Equity investments
b) of non-current financial assets
c) of securities held as current assets
Net adjustments to value of financial assets
E) Extraordinary income (expenses)
20) Income:
- Capital gains on asset disposals
- Miscellaneous 6,785 44,603
6,785 44,604
21) Expenses:
- Capital losses on asset disposals
- Previous years’ taxes
- Miscellaneous 555 18
555 18
Net extraordinary income (expenses) 6,230 44,586
Pre-tax profit (A-B±C±D±E) 12,167,133 5,219,496
22) Income tax for the year – current, deferred and advance
a) Current income taxes
b) Deferred income taxes
c) Advance income taxes (80,072) (623,709)
d) Income and charges from tax consolidation treatment
(80,072) (623,709)
23) Profit/(Loss) for the year 12,247,205 5,843,205

161
Annexes
Annexes 4HYDRA S.p.A.Registered office: via L. Alberti no. 1 - 40137 Bologna (BO) Share capital: Euro 1,200,000 fully paid up Bologna Companies Register n. 00445970379Bologna REA (Economic and Administrative Repertoire) no. 202001
CONSOLIDATED STATEMENT OF FINANCIAL POSITION
ASSETS (€/000) Notes 31.12.2014 31.12.2013
A) Non-current assets (1+2+3+4+5+6+7+9) 376,217 329,128
1) Tangible assets 57,158 51,329
Land 1 5,365 5,223
Buildings 1 24,698 24,528
Other assets 1 22,674 19,823
Assets in progress and payments on account 1 4,421 1,755
2) Intangible assets 236,518 219,319
Goodwill 2 179,491 160,171
Development costs 2 6,809 6,339
Others 2 49,031 50,583
Assets in progress and payments on account 2 1,187 2,226
3) Equity investments in associates 3 1,808 1,783
4) Financial assets 37,149 15,801
Equity investments 5 14,298 15,443
Securities 5 361 358
Other 5 22,490
5) Loans
6) Trade and other receivables 7 2,877 2,575
7) Deferred tax assets 13 40,707 38,321
9) Medium/long-term tax receivables 13
B) Current assets (8+9+10+11+12+13+14) 279,521 295,174
8) Inventories 62,416 53,803
raw and ancillary materials and consumables 8 12,367 14,072
work in progress and semi-finished products 8 21,896 15,951
finished products and goods 8 28,153 23,780
9) Trade and other receivables 7 85,010 85,586
trade receivables 7 70,396 69,956
due within 12 months 7 69,106 68,409
of which from associates 7 1,281 1,536
of which from related parties 7 9 11
other receivables - accrued income and prepaid expenses 7 14,821 15,630
of which from related parties 171 171
13) Financial receivables 7
10) Tax receivables 9 18,256 11,741
11) Financial assets 5 18,521 7,162
Securities 6,084 3,617
Other 12,437 3,545
12) Loans
13) Financial assets - Derivative instruments 6 295
14) Cash and cash equivalents 10 95,023 136,882
Total assets (A+B) 655,738 624,302

Annexes
162
LIABILITIES (€/000) Notes 31.12.2014 31.12.2013
A) Total Shareholders' Equity (1+2+3+4+5) 11 246,478 176,498
1) Share capital 11 1,200 1,200
Share capital 1,200 1,200
Treasury shares (111,779) (111,779)
Share premium reserve 110,155 103,676
Treasury share reserve 1,624 8,103
2) Reserves 11 6,645 (10,613)
Consolidation reserve
Translation (loss) reserve 1,822 (8,924)
Reserve for exchange rate adjustment 3,737 (1,940)
Cash-flow hedge reserve (128) (196)
Actuarial gains and losses reserve (255) (265)
Valuation reserve for fair value assets held for sale 11 1,469 713
3) Profits/(Losses) of previous years 11 133,273 111,834
Profits/(Losses) of previous years 121,178 99,507
Capital contribution reserve, not subject to taxation
Legal reserve 6,240 6,240
IAS transition reserve 5,855 6,088
4) Group profit/(loss) for the period/year 11 26,769 18,707
5) Minority interests 11 78,591 55,369
Minority interest reserve 68,541 47,327
Profit pertaining to third parties 10,050 8,042
B) Non-current liabilities (6+7+8+9+10+11+12) 163,460 227,319
6) Financial payables 12 119,519 191,823
7) Financial liabilities - Derivative instruments 6 262 371
8) Tax payables 9 36 575
9) Deferred tax liabilities 13 22,149 17,406
10) Post-employment benefits 14 7,202 7,049
11) Provisions for risks and charges 15 11,211 7,447
12) Other liabilities 16 3,081 2,648
C) Current liabilities (13+14+15+16+17) 246,007 220,484
13) Trade and other payables 16 131,074 121,879
trade payables 16 92,091 84,749
of which within 12 months 16 91,742 84,428
of which to Parent Company 16
of which to associates 16 76 124
of which to related parties 16 273 197
other payables - accrued liabilities and deferred income 16 38,983 37,130
14) Tax payables 9 10,868 5,901
15) Provisions for risks and charges 15 8,440 7,047
16) Financial liabilities - Derivative instruments 6 14
17) Financial payables 12 95,625 85,643
Total liabilities (A+B+C) 655,738 624,302

163
Annexes
CONSOLIDATED STATEMENT OF FINANCIAL POSITION
(€/000) INCOME STATEMENT Notes 31.12.2014 31.12.2013
1) Total revenues 17 464,645 450,737
Revenues from sale of products 441,567 427,463
Revenues from services 23,078 23,274
of which from related parties 6,053 8,150
2) Cost of goods sold 18 240,056 238,414
of which non-recurring 18 1,069 (62)
of which from related parties 146 (170)
Gross Profit (1-2) 224,589 212,323
3) Other operating revenues 19 2,412 2,118
of which non-recurring 19 95
of which from related parties 347
4) R&D expenses 18 43,196 35,610
of which non-recurring 18 88 (4)
5) Distribution expenses 18 86,438 82,475
of which non-recurring 18 1,119 (975)
6) General and administrative expenses 18 47,134 48,315
of which non-recurring 18 1,950 (18)
of which amortisation, depreciation pertaining to acquisitions 18 5,405 5,765
of which from related parties 1,093 1,375
7) Other operating expenses 18 4,830 3,298
of which non-recurring 18 1,579
Total operating costs 181,598 169,698
Operating result 45,403 44,743
8) Financial Income 20 34,854 15,489
9) Financial expenses 20 35,221 25,769
Net Financial Income (expenses) (8-9) (367) (10,280)
10) Profits from associates 3 25 286
Profit/(loss) before taxes from the operating assets 45,061 34,749
Income tax 21 8,242 8,000
Profit/(Loss) for the period 36,819 26,749
CONSOLIDATED STATEMENT OF COMPREHENSIVE INCOME
(€/000) Notes 31.12.2014 31.12.2013
Net profit/(loss) for the period 36,819 26,749
Other components of the Statement of Comprehensive Income:
Profit/(Loss) on Cash Flow Hedges 11 90 555
of which tax effect (34) (205)
Profit/(Loss) due to translation of the accounts of foreign companies 11 15,431 (5,828)
Profit/(Loss) on exchange rate adjustments for financial assets available for sale 11 218 (1)
of which tax effect (83)
Reserve for exchange rate adjustment 11 8,309 (2,767)
of which tax effect (3,151) 1,050
Profit/(Loss) on exchange rate adjustments for fair value assets available for sale 11 609 713
of which tax effect (501)
Actuarial losses (236)
of which tax effect 90
Total other profit/(loss) net of the tax effect 24,657 (7,564)
Total net profit/(loss) for the period 61,476 19,185
Attributable to:
Parent Company Shareholders 41,453 12,951
Minority interests 20,023 5,521

Annexes
164
CONSOLIDATED STATEMENT OF CASH FLOW
(€/000) 31.12.2014 31.12.2013
Pre-tax profit 45,061 34,749
Depreciation and amortisation of tangible and intangible assets and write-downs 17,007 15,982
Change in employee benefits reserve 152 (318)
Provision to the write-down reserve 505 515
Net financial expenses/(income) including exchange rate differences 7,754 10,251
Adjustments to value of financial assets (25) (286)
Cash flow from operations before changes in Working Capital 70,454 60,893
Change in trade receivables (net of provisions) (*) (734) 12,081
Change in final inventories (*) (8,613) (4,650)
Change in current assets (*) 514 2,050
Other medium/long-term assets (*) 322 (397)
Change in trade payables (*) 7,549 13,383
Change in other current liabilities (*) 1,853 (16,756)
Other medium/long-term liabilities 433 14
Change in provisions for risks and charges 5,156 2,755
Commercial foreign exchange differences (2,680) (1,084)
Foreign exchange effect of Working Capital (583) (306)
Cash flow from operations after changes in Working Capital 73,671 67,983
Change in tax (9,033) (14,209)
Foreign exchange effect of tax 1,986 (466)
Interest paid and banking expenses (8,111) (6,441)
Other changes 2,246
Cash flow generated from operations (A) 60,759 46,867
(Increase)/Decrease in intangible assets excluding exchange rate effect (*) (1,474) (9,386)
(Increase)/Decrease in tangible assets excluding exchange rate effect (*) (11,206) (7,747)
Change in unconsolidated Equity investments 188 (1,230)
Acquisition of an Equity investment 0 0
Changes generated by investment activity (B) (12,492) (18,363)
Change in LT/ST financial receivables (31,340) 3,667
Change in short-term and medium/long-term financial debt (64,537) (29,349)
Financial foreign exchange differences 3,037 (2,636)
Purchase/sale of treasury shares 10,490 1,728
Change in reserves and exchange rate effect of financial assets/liabilities, Equity and tangible and intangible assets (4,710) 1,534
Dividend payment (3,066) (2,525)
Cash flow generated/(absorbed) by financial assets (C) (90,126) (27,581)
Net increase/(decrease) in available cash (A+B+C) (41,859) 923
Net cash and cash equivalents at beginning of period (Note 10) 136,882 135,959
Net cash and cash equivalents at end of period (Note 10) 95,023 136,882
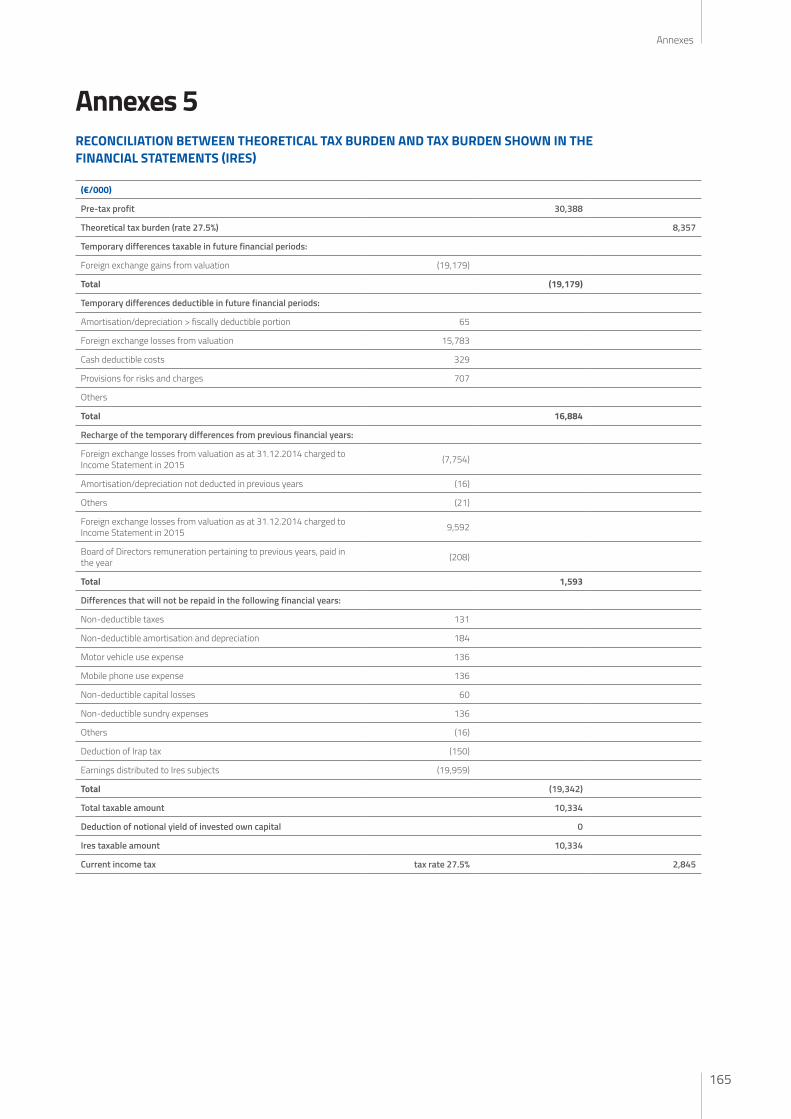
165
Annexes
Annexes 5RECONCILIATION BETWEEN THEORETICAL TAX BURDEN AND TAX BURDEN SHOWN IN THE FINANCIAL STATEMENTS (IRES)
(€/000)
Pre-tax profit 30,388
Theoretical tax burden (rate 27.5%) 8,357
Temporary differences taxable in future financial periods:
Foreign exchange gains from valuation (19,179)
Total (19,179)
Temporary differences deductible in future financial periods:
Amortisation/depreciation > fiscally deductible portion 65
Foreign exchange losses from valuation 15,783
Cash deductible costs 329
Provisions for risks and charges 707
Others
Total 16,884
Recharge of the temporary differences from previous financial years:
Foreign exchange losses from valuation as at 31.12.2014 charged to Income Statement in 2015 (7,754)
Amortisation/depreciation not deducted in previous years (16)
Others (21)
Foreign exchange losses from valuation as at 31.12.2014 charged to Income Statement in 2015 9,592
Board of Directors remuneration pertaining to previous years, paid in the year (208)
Total 1,593
Differences that will not be repaid in the following financial years:
Non-deductible taxes 131
Non-deductible amortisation and depreciation 184
Motor vehicle use expense 136
Mobile phone use expense 136
Non-deductible capital losses 60
Non-deductible sundry expenses 136
Others (16)
Deduction of Irap tax (150)
Earnings distributed to Ires subjects (19,959)
Total (19,342)
Total taxable amount 10,334
Deduction of notional yield of invested own capital 0
Ires taxable amount 10,334
Current income tax tax rate 27.5% 2,845

Annexes
166
DETERMINATION OF THE IRAP TAXABLE INCOME
(€/000)
Difference between production value and costs 849
Costs not significant to Irap 9,291
Revenue not significant to Irap -
Extraordinary revenue relevant to Irap -
Extraordinary expenses relevant to Irap -
Deductions for the purposes of Irap (INAIL premiums, costs for CFL, apprentices and handicapped employees, R&D) (8,923)
Deduction of value of production abroad
Total 1,217
Theoretical tax burden (rate 3.9%) 47
Total
Recharge of the temporary differences from previous financial years:
Goodwill amortisation (6)
Trademark amortisation (3)
Total (9)
Differences that will not be repaid in the following financial years:
Compensation for temporary and interim employees 900
Non-deductible amortisation and depreciation 184
Non-deductible extraordinary charges 60
Non-deductible costs 246
Payroll & employee benefits (9)
Amounts payable for employee secondment (53)
Total 1,328
Irap taxable income 2,536
Current Irap tax rate 3.9% 99

167
Annexes
Annexes 6a
CERTIFICATION ON THE CONSOLIDATED FINANCIAL STATEMENTS IN ACCORDANCE WITH ARTICLE 81-TER OF CONSOB REGULATION NO. 11971 OF 14 MAY 1999, AS AMENDED
1. I sottoscritti Romano Volta, in qualità di Amministratore Delegato e Sergio Borghesi, in qualità di Dirigente Prepos-to alla redazione dei documenti contabili societari della Datalogic S.p.A. attestano, tenuto anche conto di quanto previsto dall’art. 154-bis, commi 3 e 4, del Decreto Legislativo 24 febbraio 1998, n. 58:
• l’adeguatezza in relazione alle caratteristiche dell’impresa e• l’effettiva applicazione
delle procedure amministrative e contabili per la formazione del Bilancio consolidato nel corso dell’esercizio 2015.
2. La valutazione dell’adeguatezza delle procedure amministrative e contabili per la formazione del bilancio consolidato al 31 dicembre 2015 è basata su di un procedimento definito da Datalogic S.p.A. in coerenza con il modello Internal Control – Integrated Framework emesso dal Committee of Sponsoring Organizations of the Treadway Commission che rappresenta un framework di riferimento generalmente accettato a livello internazionale.
3. Si attesta, inoltre, che: 3,1 il Bilancio consolidato: a) è redatto in conformità ai principi contabili internazionali applicabili riconosciuti nella Comunità Europea ai sensi del
regolamento (CE) n. 1606/2002 del Parlamento Europeo e del Consiglio, del 19 luglio 2002; b) corrisponde alle risultanze dei libri e delle scritture contabili; c) è idoneo a fornire una rappresentazione veritiera e corretta della situazione patrimoniale, economica e finanziaria
dell’emittente e dell’insieme delle imprese incluse nel consolidamento.
3,2 La relazione sulla gestione comprende un’analisi attendibile dell’andamento e del risultato della gestione, nonché della situazione dell’emittente e dell’insieme delle imprese incluse nel consolidamento, unitamente alla descrizione dei principali rischi e incertezze cui sono esposti.
Lippo di Calderara di Reno (Bo), 4 marzo 2016
L’Amministratore Delegato Il Dirigente Preposto alla redazione dei documenti contabiliRomano Volta Sergio Borgheresi

Annexes
168
Annexes 6b
CERTIFICATION ON FINANCIAL STATEMENTS IN ACCORDANCE WITH ARTICLE 81-TER OF CONSOB REGULATION NO. 11971 OF 14 MAY 1999, AS AMENDED
1. I sottoscritti Romano Volta, in qualità di Amministratore Delegato e Sergio Borghesi, in qualità di Dirigente Preposto alla redazi-one dei documenti contabili societari della Datalogic S.p.A. attestano, tenuto anche conto di quanto previsto dall’art. 154-bis, commi 3 e 4, del decreto legislativo 24 febbraio 1998, n. 58:
• l’adeguatezza in relazione alle caratteristiche dell’impresa e• l’effettiva applicazione
delle procedure amministrative e contabili per la formazione del Bilancio civilistico nel corso dell’esercizio 2015.
2. La valutazione dell’adeguatezza delle procedure amministrative e contabili per la formazione del bilancio consolidato al 31 dicembre 2015 è basata su di un procedimento definito da Datalogic S.p.A. in coerenza con il modello Internal Control – Integrated Framework emesso dal Committee of Sponsoring Organizations of the Treadway Commission che rappresenta un framework di riferimento generalmente accettato a livello internazionale.
3. Si attesta, inoltre, che: 3,1 il Bilancio d’esercizio: a) è redatto in conformità ai principi contabili internazionali applicabili riconosciuti nella Comunità Europea ai sensi del
regolamento (CE) n. 1606/2002 del Parlamento Europeo e del Consiglio, del 19 luglio 2002; b) corrisponde alle risultanze dei libri e delle scritture contabili; c) è idoneo a fornire una rappresentazione veritiera e corretta della situazione patrimoniale, economica e finanziaria
dell’emittente e dell’insieme delle imprese incluse nel consolidamento.
3,2 La Relazione sulla Gestione comprende un’analisi attendibile dell’andamento e del risultato della gestione, nonché della situazione dell’emittente e dell’insieme delle imprese incluse nel consolidamento, unitamente alla descrizione dei principali rischi e incertezze cui sono esposti.
Lippo di Calderara di Reno (Bo), 4 marzo 2016
L’Amministratore Delegato Il Dirigente Preposto alla redazione dei documenti contabiliRomano Volta Sergio Borgheresi


Annexes
170
Annexes 7aINDEPENDENT AUDITOR’S REPORTS
Reconta Ernst & Young S.p.A.Sede Legale: Via Po, 32 - 00198 RomaCapitale Sociale � 1.402.500,00 i.v.Iscritta alla S.O. del Registro delle Imprese presso la C.C.I.A.A. di RomaCodice fiscale e numero di iscrizione 00434000584 - numero R.E.A. 250904P.IVA 00891231003Iscritta all’Albo Revisori Legali al n. 70945 Pubblicato sulla G.U. Suppl. 13 - IV Serie Speciale del 17/2/1998Iscritta all’Albo Speciale delle società di revisioneConsob al progressivo n. 2 delibera n.10831 del 16/7/1997
A member firm of Ernst & Young Global Limited
Reconta Ernst & Young S.p.A.Via Massimo D'Azeglio, 3440123 Bologna
Tel: +39 051 278311Fax: +39 051 236666ey.com
Independent auditor’s reportin accordance with articles 14 and 16 of Legislative Decree n. 39, dated 27 January 2010(Translation from the original Italian text)
To the Shareholders of DATALOGIC S.p.A.
Report on the consolidated financial statements
We have audited the accompanying consolidated financial statements of DATALOGIC Group, whichcomprise the consolidated statement of financial position as at 31 December 2015, and theconsolidated statement of income, the consolidated statement of comprehensive income, thestatement of changes in consolidated shareholders’ equity, the consolidated statement of cash flowand the related explanatory notes.
Directors’ responsibility for the consolidated financial statements
The Directors of DATALOGIC S.p.A. are responsible for the preparation of these consolidated financialstatements that give a true and fair view in accordance with International Financial ReportingStandards as adopted by the European Union as well as with the regulations issued to implement art. 9of Legislative Decree n. 38, dated 28 February 2005.
Auditor's responsibility
Our responsibility is to express an opinion on these consolidated financial statements based on ouraudit. We conducted our audit in accordance with International Standards on Auditing (ISA Italia)implemented in accordance with article 11, paragraph 3 of Legislative Decree n. 39, dated 27 January2010. Those standards require that we comply with ethical requirements and plan and perform theaudit to obtain reasonable assurance about whether the financial statements are free from materialmisstatement.
An audit involves performing procedures to obtain audit evidence about the amounts and disclosures inthe consolidated financial statements. The procedures selected depend on the auditor's professionaljudgment, including the assessment of the risks of material misstatement of the consolidated financialstatements, whether due to fraud or error. In making those risk assessments, the auditor considersinternal control relevant to the entity's preparation of the consolidated financial statements that give atrue and fair view in order to design audit procedures that are appropriate in the circumstances, butnot for the purpose of expressing an opinion on the effectiveness of the entity's internal control. Anaudit also includes evaluating the appropriateness of accounting policies used and the reasonablenessof accounting estimates made by Directors, as well as evaluating the overall presentation of theconsolidated financial statements.
We believe that the audit evidence we have obtained is sufficient and appropriate to provide a basis forour audit opinion.
Opinion
In our opinion, the consolidated financial statements give a true and fair view of the financial positionof DATALOGIC Group as at 31 December 2015, and of its financial performance and its cash flows forthe year then ended in accordance with International Financial Reporting Standards as adopted by theEuropean Union and with article 9 of Legislative Decree n. 38, dated 28 February 2005.

171
Annexes
3
Report on other legal and regulatory requirements
Opinion on the consistency of the Report on Operations and of specific information of the Report onCorporate Governance and the Company’s Ownership with the consolidated financial statements
We have performed the procedures required under audit standard SA Italia n. 720B in order to expressan opinion, as required by law, on the consistency of the Report on Operations and of specificinformation of the Report on Corporate Governance and the Company’s Ownership as provided for byarticle 123-bis, paragraph 4 of Legislative Decree n. 58, dated 24 February 1998, with theconsolidated financial statements. The Directors of DATALOGIC S.p.A. are responsible for thepreparation of the Report on Operations and of the Report on Corporate Governance and theCompany’s Ownership Structure in accordance with the applicable laws and regulations. In our opinionthe Report on Operations and the specific information of the Report on Corporate Governance and theCompany’s Ownership Structure are consistent with the consolidated financial statements ofDATALOGIC Group as at December 31 2015.
Bologna, 24 March 2016Reconta Ernst & Young S.p.A.Signed by: Alberto Rosa, partner
This report has been translated into the English language solely for the convenience of international readers.

Annexes
172
Annexes 7b
Reconta Ernst & Young S.p.A.Sede Legale: Via Po, 32 - 00198 RomaCapitale Sociale � 1.402.500,00 i.v.Iscritta alla S.O. del Registro delle Imprese presso la C.C.I.A.A. di RomaCodice fiscale e numero di iscrizione 00434000584 - numero R.E.A. 250904P.IVA 00891231003Iscritta all’Albo Revisori Legali al n. 70945 Pubblicato sulla G.U. Suppl. 13 - IV Serie Speciale del 17/2/1998Iscritta all’Albo Speciale delle società di revisioneConsob al progressivo n. 2 delibera n.10831 del 16/7/1997
A member firm of Ernst & Young Global Limited
Reconta Ernst & Young S.p.A.Via Massimo D'Azeglio, 3440123 Bologna
Tel: +39 051 278311Fax: +39 051 236666ey.com
Independent auditor’s reportin accordance with articles 14 and 16 of Legislative Decree n. 39, dated 27 January 2010(Translation from the original Italian text)
To the Shareholders of DATALOGIC S.p.A.
Report on the financial statements
We have audited the accompanying financial statements of DATALOGIC S.p.A., which comprise thestatement of financial position as at 31 December 2015, and the statement of income, the statementof comprehensive income, the statement of changes in shareholders’ equity, the statement of cashflow and the related explanatory notes.
Directors’ responsibility for the financial statements
The Directors of DATALOGIC S.p.A. are responsible for the preparation of these financial statementsthat give a true and fair view in accordance with International Financial Reporting Standards asadopted by the European Union as well as with the regulations issued to implement art. 9 of LegislativeDecree n. 38, dated 28 February 2005.
Auditor's responsibility
Our responsibility is to express an opinion on these financial statements based on our audit. Weconducted our audit in accordance with International Standards on Auditing (ISA Italia) implemented inaccordance with article 11, paragraph 3 of Legislative Decree n. 39, dated 27 January 2010. Thosestandards require that we comply with ethical requirements and plan and perform the audit to obtainreasonable assurance about whether the financial statements are free from material misstatement.
An audit involves performing procedures to obtain audit evidence about the amounts and disclosures inthe financial statements. The procedures selected depend on the auditor's professional judgment,including the assessment of the risks of material misstatement of the financial statements, whetherdue to fraud or error. In making those risk assessments, the auditor considers internal control relevantto the entity's preparation of the financial statements that give a true and fair view in order to designaudit procedures that are appropriate in the circumstances, but not for the purpose of expressing anopinion on the effectiveness of the entity's internal control. An audit also includes evaluating theappropriateness of accounting policies used and the reasonableness of accounting estimates made byDirectors, as well as evaluating the overall presentation of the financial statements.
We believe that the audit evidence we have obtained is sufficient and appropriate to provide a basis forour audit opinion.
Opinion
In our opinion, the financial statements give a true and fair view of the financial position of DATALOGICS.p.A. as at 31 December 2015, and of its financial performance and its cash flows for the year thenended in accordance with International Financial Reporting Standards as adopted by the EuropeanUnion and with article 9 of Legislative Decree n. 38, dated 28 February 2005.

173
Annexes
3
Report on other legal and regulatory requirements
Opinion on the consistency of the Report on Operations and of specific information of the Report onCorporate Governance and the Company’s Ownership with the financial statements
We have performed the procedures required under audit standard SA Italia n. 720B in order to expressan opinion, as required by law, on the consistency of the Report on Operations and of specificinformation of the Report on Corporate Governance and the Company’s Ownership as provided for byarticle 123-bis, paragraph 4 of Legislative Decree n. 58, dated 24 February 1998, with the financialstatements. The Directors of DATALOGIC S.p.A. are responsible for the preparation of the Report onOperations and of the Report on Corporate Governance and the Company’s Ownership Structure inaccordance with the applicable laws and regulations. In our opinion the Report on Operations and thespecific information of the Report on Corporate Governance and the Company’s Ownership Structureare consistent with the financial statements of DATALOGIC S.p.A. as at 31 December 2015.
Bologna, 24 March 2016Reconta Ernst & Young S.p.A.Signed by: Alberto Rosa, partner
This report has been translated into the English language solely for the convenience of international readers.
Annexes
174
Annexes 8
STATUTORY AUDITORS’ REPORT

175
Annexes

Annexes
176

177
Annexes

Annexes
178

179
Annexes

Annexes
180

181
Annexes

Annexes
182

183
Annexes

Annexes
184

185
Annexes


datalogic.com
DATALOGIC AND DATALOGIC LOGO ARE REGISTERED TRADEMARKS OF DATALOGIC S.P.A. IN MANY COUNTRIES, INCLUDING THE U.S.A. AND E.U. ALL RIGHTS RESERVED. ©2014 DATALOGIC. ALL RIGHTS RESERVED, INCLUDING THE RIGHT TO REPRODUCE THIS DOCUMENT, OR PORTIONS THEREOF, IN ANY FORM.
Copertina Highlights 2015.indd 2 02/05/16 15:58