Embed Size (px)
Citation preview
Copernicus IntroductionBucharest, Romania – 7th & 8th November 2013

Contents
IntroductionGMES CopernicusSix thematic areas
InfrastructureSpace data
An introduction to Remote Sensing
In-situ data
ApplicationsSummary & Questions

Introduction
GMES Copernicus"By changing the name from GMES to Copernicus we are paying homage to a great European scientist and observer: Nicolaus Copernicus” – Antonio Tajani, European Commission Vice President
Copernicus – Understanding our planetEuropean Programme to collect data and provide informationEnhance SafetyContribute to Europe’s strategy for growth and employmentMonitor climate changeManage natural resources
Air qualityOptimise agricultural activitiesPromote renewable energy
Disaster managementEmergency management
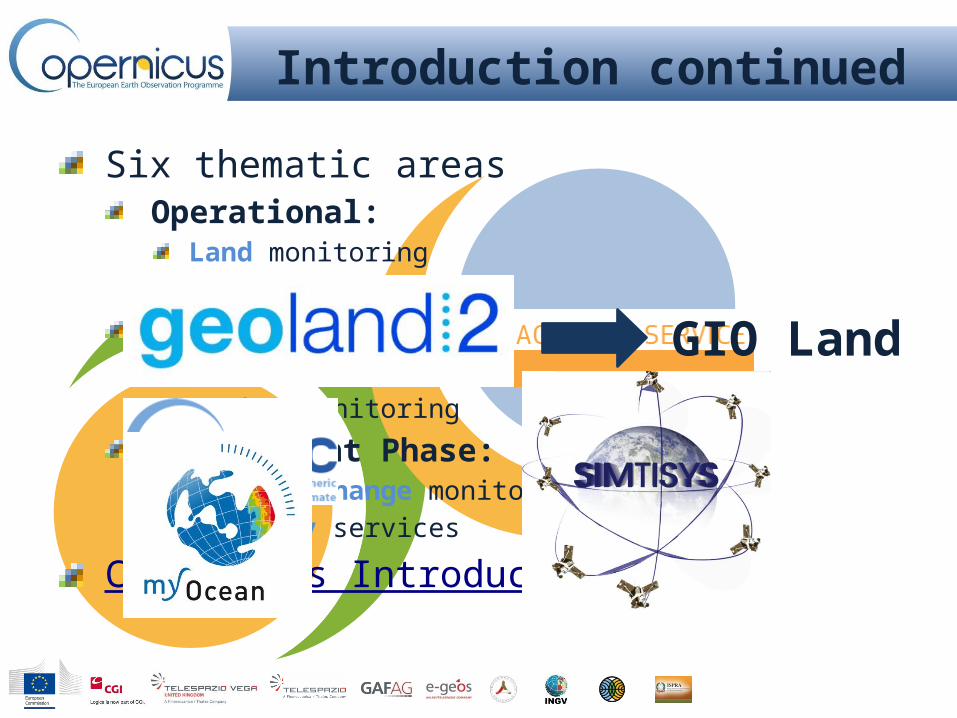
Six thematic areasOperational:
Land monitoringEmergency management
Pre-operational: Atmosphere monitoringMarine monitoring
Development Phase:Climate change monitoringSecurity services
Copernicus Introduction
Introduction continued
GIO Land

MERIS image showing Hurricane Frances passing near Haiti and the Dominican Republic, acquired 1 September 2004
Resolution approximately 1200 metres
Image: Processed by Brockmann Consult for ESA
Remote Sensing Introduction
Active vs Passive remote sensingResolution
Medium-low resolutionLand cover monitoringAgricultureCoastal dynamicsWeather

Pléiades Satellite Image – Central Park, New York, May 2012. Image: Astrium, CNES 2012
Remote Sensing Introduction
Active vs Passive remote sensingResolution
Very High Resolution (VHR)Urban area monitoringSecurity applications

Remote Sensing Introduction
Active vs Passive remote sensingResolutionOrbits
Near-polar (~90° inclination)Equatorial (0° inclination)
Sun-synchronousGeostationary

TanDEM-X
Infrastructure – Space DataContributing Missions
30 existing or planned5 categories
Synthetic Aperture Radar (SAR)Sensor transmits a pulse
Satellite receives the backscattered echoes
Returned signals from Earth’s surface are stored
Digital Elevation Models can be constructed

Salar de Uyuni,
Image: DLR
Salt flats of Salar de Uyuni, South America
Image: DLR

Infrastructure – Space DataOptical sensors
Passive Remote sensingSensors detect natural radiation emitted/reflected from the Earth’s surface
SPOT5Image: CNES
RapidEye image of Moscow, Russia
Image: RapidEye
False-colour composite of forest fires in southern France, summer 2003Image: CNES

Infrastructure – Space DataAltimetry systems
Active sensor using RadarPrecise measurements of the satellites height above the ocean by measuring the time and interval between transmission and reception of very short electromagnetic pulses
ApplicationsSea-surface height (ocean topography)Lateral extent of sea iceAltitude of icebergs above sea levelIce sheet topographyLand topographySea-surface wind speedsWave heights
Arctic applications Cryosat-2
Image: ESA
Measuring the freeboard of ice
Image: ESA

Infrastructure – Space DataRadiometryAdvanced Along-Track Scanning Radiometer (AATSR) – ENVISAT
Optical and Infrared sensorPrimary mission
Sea Surface Temperature Ocean processesOperational applications e.g. meterology
Can also be used for:Land Surface TemperatureClouds and AerosolsCryosphere
AATSR Global sea-surface temperature data map

Infrastructure – Space DataSpectrometry
Passive Remote Sensing
GOMOS & SCIAMACHY – EnvisatGOME – ERS-2No longer operationalMedium resolution
Atmospheric chemistryAir quality (Ozone)CloudsTrace Gases
2010-2011 changes in atmosphere

Sentinels
Sentinel-1Radar (SAR) imagery; all-weather, day/night for land and oceanPolar-orbiting pairCoverage
Europe and Canada’s main shipping routeevery 1-3 days
DataDelivery within an hour of acquisition
Continue heritage of Envisat and RadarsatObjectives/products
Sea-ice extentSea-ice mappingOil-spill monitoringForest, water and soil management

Sentinels
Sentinel-2High-resolution optical imagery for land servicesVisible, NIR, SWIR (comprising 13 spectral bands)Coverage
5-day revisit timeLarge swathHigh-spatial resolution
To continue heritage of Landsat and SPOTObjectives/products
Land-cover mapsLand-change mapsChlorophyll indexFlood/volcanic eruptions/landslide monitoring

Sentinels
Sentinel-3High accuracy, optical, radar and altimetry for marine and land servicesRadiometer (SLSTR – based on Envisat’s,
AATSR)Ocean and Land Colour Instrument
(OLCI – based on Envisat’s MERISDual-frequency Synthetic Aperture Radar
(SRAL – based on CryoSat)<2 day revisit time at equator for OLCI, <1 day for SLSTR
To continue heritage of ERS-2 and Envisat Objectives/products
Sea-surface topographySea-/land- surface temperatureOcean-/land- surface colourEnvironmental and climate monitoring

Sentinels
Sentinel-4 Payload on Meteosat Third Generation (MTG) for atmospheric composition monitoringUltraviolet Visible Near-infrared (UVN) spectrometerInfraRed Sounder (IRD)Will include data from other satellites
Sentinel-5Payload embarked on a MetOp Second Generation Satellite for atmospheric composition monitoring
To bridge gaps between Envisat, Sciamachy instrument and Sentinel-5 launch
Objectives/productsAtmospheric variablesAir qualitySolar radiationClimate monitoing
Infrastructure – In-situ Data
Main use of in-situ data is for calibration and validation of satellite data
Reduce bias of satellite-derived dataReduce the need for high radiometric calibrationMaximise/enhance the effectiveness of satellite dataConstrain models (data assimilation)
European Environment Agency (EEA) led work for Copernicus under the FP7 GMES In-Situ Coordination “GISC” project (finished October 2013)

GMES In-situ Coordination – GSIC
Goals:To document the in-situ data required by the services To identify gapsTo design an innovative and sustainable framework for open access to in-situ data
Monitoring networks currently provide robust integrated information and calibrate and validate the data from satellites
MapsGround-based weather stationsOcean buoysAir quality monitoring networks

Applications
Feedback Forms&
Questions