Embed Size (px)
Citation preview

Copernicus InstituteSustainable Development and Innovation Management
Outlook on Renewable Energy (and reducing GHG emissions).
Woudschoten Conferentie Chemistry2chemistry, Zeist, 2nd November 2012
André FaaijCopernicus Institute – Utrecht University
Head of Unit Energy & ResourcesTask Leader IEA Bioenergy Task 40, CLA Bioenergy IPCC - SRREN

Copernicus InstituteSustainable Development and Innovation Management
Houston we have a problem!
• Peak oil• Peak soil• Peak water• Peak biodiversity
loss• Peak population• Peak GDP
• Climate• Agriculture• Energy• Biodiversity• Poverty &
development
And it is urgent!

Copernicus InstituteSustainable Development and Innovation Management
Global population projections(stabilization at about 9 billion in
GEA)
1940 1960 1980 2000 2020 2040 2060 2080 2100
Worl
d p
opu
lati
on
(bill
ion)
0
2
4
6
8
10
12
14
16
18
2000 2020 2040 2060 2080 2100
Pop
ula
tion
(b
illio
n)
0
2
4
6
8
10
12
14
16
18GEA IndustrializedGEA Developing
[GEA, 2012]

Copernicus InstituteSustainable Development and Innovation Management
Economic development projections(developing countries avg. 3.5%/yr;
developed countries 1.2%/yr)
1940 1960 1980 2000 2020 2040 2060 2080 2100
Worl
d G
DP (
trill
ion U
S$ 2
00
5)
0
100
200
300
400
500
600
700
800
2000 2020 2040 2060 2080 2100
GD
P (
trill
ion
US
$ 2
00
5)
0
100
200
300
400
500GEA IndustrializedGEA Developing
[GEA, 2012]

Copernicus InstituteSustainable Development and Innovation Management
Transport…
0
200
400
600
800
0 10000 20000 30000
CA
mexico
belgium
denmark
italy
蘭
spain
sweden
Aus NZ
swiss
Jp
US
uk
Germany
仏
Taiwan Korea
china
india
GDP per capita(US$)
Vehicle ownership/1000 persons
Can result in 2 billion passenger cars in 2050Tripling compared to 2000

Copernicus InstituteSustainable Development and Innovation Management
The current global energy system
is dominated by fossil fuels.

Copernicus InstituteSustainable Development and Innovation Management
Global CO2 emissions from fossil fuels (IEA base
scenario; 2030)
[Source: IEA]
0
4000
8000
12000
16000
20000
power industry transport residential +services
othersectors
CO
2 em
issi
on
s (M
t/yr)
2030
2002

Copernicus InstituteSustainable Development and Innovation Management
More carbon in underground than the atmosphere (and oceans) can
swallow.

Copernicus InstituteSustainable Development and Innovation Management
GHG emissions vs. global temperature…; little
disagreement about the impact of a 6 oC change..
[IPCC-SRREN, 2012]

Copernicus InstituteSustainable Development and Innovation Management
Grenzen aan de groei…?
[Meadows]

Copernicus InstituteSustainable Development and Innovation Management
Nervous markets
…

Copernicus InstituteSustainable Development and Innovation Management
What to do?
Despair or ….Do somethingUse your climate toolkit

Copernicus InstituteSustainable Development and Innovation Management

Copernicus InstituteSustainable Development and Innovation Management
The BLUE Map Scenario – Towards a low-carbon energy sector
Baseline Scenario – business-as-usual; no adoption of new energy and climate policies
BLUE Map Scenario - energy-related CO2-emissions halved by 2050 through CO2-price and strong support policies Serves as basis for all IEA Technology Roadmaps 23% of global emission savings occur in the transport sector

Copernicus InstituteSustainable Development and Innovation Management
Historical Development of Global Primary Energy Supply from RE(1971 – 2007).
[IPCC-SRREN, 2011]

Copernicus InstituteSustainable Development and Innovation Management

Copernicus InstituteSustainable Development and Innovation Management
Global RE supply by source in Annex I (ANI) and Non-Annex I (NAI)
countries in 164 long-term scenarios (2030 and 2050).
Thick black line = median,Coloured box = 25th-75th percentile,Whiskers = total range across all reviewed scenarios.
[IPCC-SRREN, 2011]

Copernicus InstituteSustainable Development and Innovation Management
Global primary energy supply of biomass in 164 long-term scenarios in
2020, 2030 and 2050, grouped by different categories of atmospheric
CO2 concentration level in 2100
[IPCC-SRREN, 2011]

Copernicus InstituteSustainable Development and Innovation Management
Costs available RE technologies vs. fossil
energy costs.
[IPCC-SRREN, 2011]

Copernicus InstituteSustainable Development and Innovation Management

Copernicus InstituteSustainable Development and Innovation Management
RE costs have declined in the past and further
declinescan be expected in the
future.
[IPCC-SRREN, 2011]

Copernicus InstituteSustainable Development and Innovation Management
‘Learning investments’ – the cost of learning
Source: IEA, 2000

Copernicus InstituteSustainable Development and Innovation Management
Generic capital cost trend for early commercial units of a new power plant technology
Source: EPRI
Cap
ital C
ost
/ U
nit
of C
apac
ity
(co
nsta
nt c
urre
ncy)
Time
First commercial service
Second plant in service
3rd plant
4th plant 5th plant
Estimate Actual
Mature plant costs
Simplified cost estimate with incomplete data
Development period cost estimates
Available for commercial order
Preconstruction and licencing period
Finalized cost estimate
Design / construction period
Copernicus InstituteSustainable Development and Innovation Management
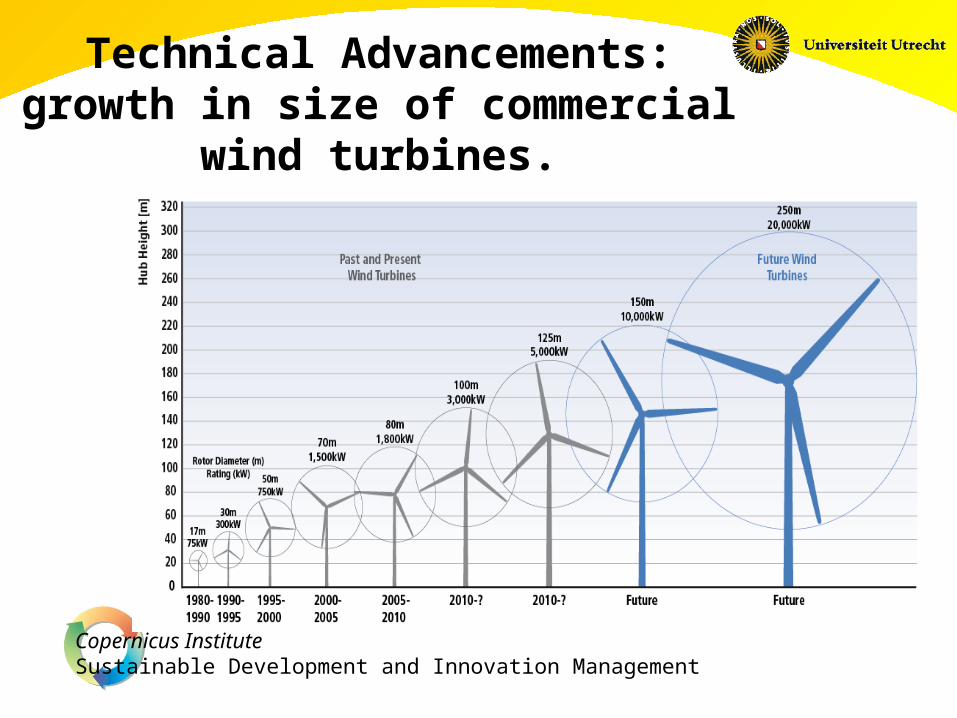
Technical Advancements: growth in size of commercial
wind turbines.

Copernicus InstituteSustainable Development and Innovation Management
CSP seen as driver for economic
development…

Copernicus InstituteSustainable Development and Innovation Management
Experience curve for primary forest fuels in Sweden and Finland (1975
and 2003).
Sou
rce:
Jun
ging
er F
aaij
et a
l., 2
005
Copernicus InstituteSustainable Development and Innovation Management
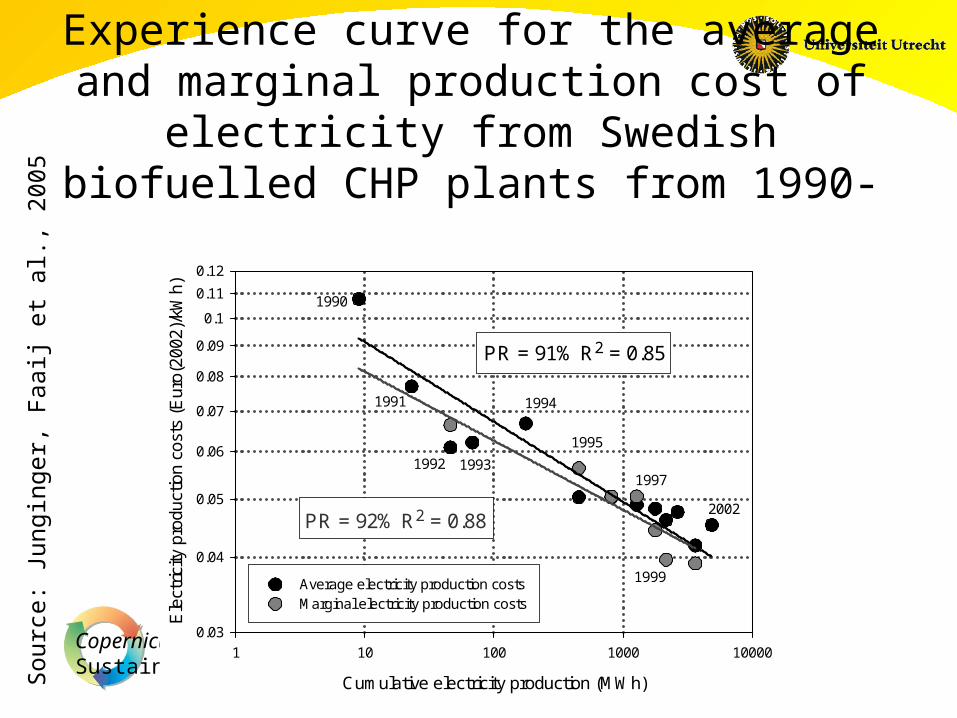
Experience curve for the average and marginal production cost of electricity
from Swedish biofuelled CHP plants from
1990-2002
Cumulative electricity production (MWh)
1 10 100 1000 10000
Ele
ctric
ity p
rodu
ctio
n co
sts
(Eur
o(20
02)/
kWh)
0.03
0.04
0.05
0.06
0.07
0.08
0.09
0.1
0.11
0.12
Average electricity production costs Marginal electricity production costs
PR = 92% R2 = 0.88
PR = 91% R2 = 0.85
1990
1991
1992 1993
1994
1995
2002
1997
1999
Sou
rce:
Jun
ging
er,
Faa
ij et
al.,
200
5

Copernicus InstituteSustainable Development and Innovation Management
Estimated future costs of sugarcane and ethanol
production assuming 8% annual growth
Cumulative sugarcane production [106 TC]1000 2000 4000 8000 16000 32000P
rodu
ctio
n co
sts
suga
rcan
e [U
S$/
tonn
e] a
nd e
than
ol [
US
$/m
3]
10
20
40
200
400
800
10 20 40 80 160 320 640 1280
SugarcaneEthanol prod. cost (excl. feedstock)Expected range of cane prod. costs in 2020Expected range of ethanol prod. costs in 2020
PR = 0.68 + 0.03
PR = 0.81 + 0.02
2020
2020
Cumulative ethanol production [106 m3]
Explaining the experience curve: Cost reductions of Brazilian ethanol from sugarcaneJ.D. van den Wall Bake, M. Junginger, A. Faaij, T.Poot, A. da Silva WalterBiomass & Bioenergy, 2008

Copernicus InstituteSustainable Development and Innovation Management
And such opportunities can be found in most
sectors…
[Martin Weiss et al., 2010]

Copernicus InstituteSustainable Development and Innovation Management
Key factors biomass potentials
Issue/effect Importance Impact on biomass potentials
Supply potential of biomass
supply as estimated in recent studies
Improvement agricultural management *** Choice of crops *** Food demands and human diet *** Use of degraded land *** Competition for water *** Use of agricultural/forestry by-products ** Protected area expansion ** Water use efficiency ** Climate change ** Alternative protein chains ** Demand for biomaterials *
Demand potential of biomass
demand as estimated in recent studies
Bio-energy demand versus supply ** Cost of biomass supply ** Learning in energy conversion ** Market mechanism food-feed-fuel **
Dornburg et al., Energy & Environmental Science 2010

Copernicus InstituteSustainable Development and Innovation Management
2050 Bioenergy Potentials & Deployment Levels
2008 Global Energy Total
Chapter 2 Possible
DeploymentLevels
2011 IPCCReview*
Land Use3
and 5million
km2
Chapter 10Modelled
DeploymentLevels for CO2 Concentration
Targets
Past LiteratureRange ofTechnicalPotentials0-1500 EJ
Glo
bal P
rimar
y En
ergy
Sup
ply,
EJ/
y
2008 Global Biomass Energy
2050 GlobalEnergyAR4, 2007
2050 Global Biomass
AR4,2007
<440 ppm
440-600 ppmTechnical
Potential
2050 Projections
Minimum
median75th
Maximum
100
300
150190
80
265300
Technical PotentialBased on 2008
Model and LiteratureAssessment
118
20 25
25th
Percentile
2000 Total Biomass Harvest for Food/Fodder/Fiberas Energy Content
[IPCC-SRREN, 2011]

Copernicus InstituteSustainable Development and Innovation Management
Projected production costs estimated for selected
developing technologies
[IPCC-SRREN, 2011]

Copernicus InstituteSustainable Development and Innovation Management
IEA Biofuel Roadmap: Vision
Global biofuel supply grows from 2.5 EJ today to 32 EJ in 2050 Biofuels share in total transport fuel increases from 2% today, to
27% in 2050 Diesel/kerosene-type biofuels key to decarbonise heavy transport modes
Large-scale deployment of advanced biofuels vital to meet the roadmap targets
Fina
l ene
rgy
(EJ)

Copernicus InstituteSustainable Development and Innovation Management
Biofuel Production Costs 2010-50
• Most conventional biofuels still have some potential for cost improvements
• Advanced biofuels reach cost parity around 2030 in an optimistic case
Production costs shown as untaxed retail price

Copernicus InstituteSustainable Development and Innovation Management
[IPCC-SRREN, 2011]
Driving forces, dimensions, scales…

Copernicus InstituteSustainable Development and Innovation Management Source: Statoil

Copernicus InstituteSustainable Development and Innovation Management
Conceptual CO2 transport configurations
National CO2network
Regional CO2 network & dedicated lines
Use existing gas production lines >2020
Trunk line to large UK offshore gas
fields
Trunk line to oil fields + aquifers in offshore UK/Norway region
National CO2network
Regional CO2 network & dedicated lines
Use existing gas production lines >2020
Trunk line to large UK offshore gas
fields
Trunk line to oil fields + aquifers in offshore UK/Norway region
Damen et al., 2008

Copernicus InstituteSustainable Development and Innovation Management
CO2 avoidance costs for electricity production (ref:
identical technology without CCS).
0
5
10
15
20
25
30
35
40
45
50
PC IGCC NGCC PC adv IGCCadv
IG-water IG-SOFC-
GT
NGCCadv
MR-CC CLC AZEP SOFC-GT
CO
2 m
itiga
tion
cost
s (€
/t C
O2)
State-of-the-art Advanced
Coal Gas
Damen et al., 2007

Copernicus InstituteSustainable Development and Innovation Management
Prepared Feedstock
ASU
GasifierGas
Cleanup
Power production
FT-liquids production
H2
production
AGR
MeOH production
Urea production
CO2
compressionClaus/SCOT
FT-fuels
MeOH
Urea
Liquid S
H2
O2
O2
N2
CO2
CO2H2S
S-compounds
Sour WGS
SweetWGS
An ultimate energ transition machine: flex-fuel
IG/synfuel/power +CCS
Major investments in China.- No oil for transport!- 50 % biomass + CCS = net 0 CO2 emission.
About 50%of carbon!
[Meerman et al., RSER 2011 & 2012]

Copernicus InstituteSustainable Development and Innovation Management
What are we waiting for?Yueyang Sinopec-ShellCoal gasification project; (China)
Shell gasifier arrivingat site September 2006.
15 licences in China at present…
Courtesy of Shell

Copernicus InstituteSustainable Development and Innovation Management
GHG emissions per km driven
[Van Vliet et al., 2009]
No CCS CCS

Copernicus InstituteSustainable Development and Innovation Management
Energy system transformation…
[Vuuren et al., Current opinions in Env. Sust., 2012]

Copernicus InstituteSustainable Development and Innovation Management
Final remarks• Business as Usual: likely given the current
governance capabilities; it’s correctional force and collateral damage may be impressive.
• Global Governance; preferred and to be pursued; but will it deliver on time?
• Smart economics: economic superiority for sectors, countries, households…; connects to current system capabilities and psychology.
– Develop (niche) markets and market volume.– Divert fossil fuel subsidies (budget neutral).– Rock solid innovation strategies backed by macro-
economic interests: THINK ASIA!!!.

Copernicus InstituteSustainable Development and Innovation Management
Niet lullen maar poetsen mensen
en dank voor uw aandacht
[email protected]/scopussrren.ipcc-wg3.de/report