Embed Size (px)
Citation preview
8/8/2019 Copar Edited With Charts
http://slidepdf.com/reader/full/copar-edited-with-charts 1/25
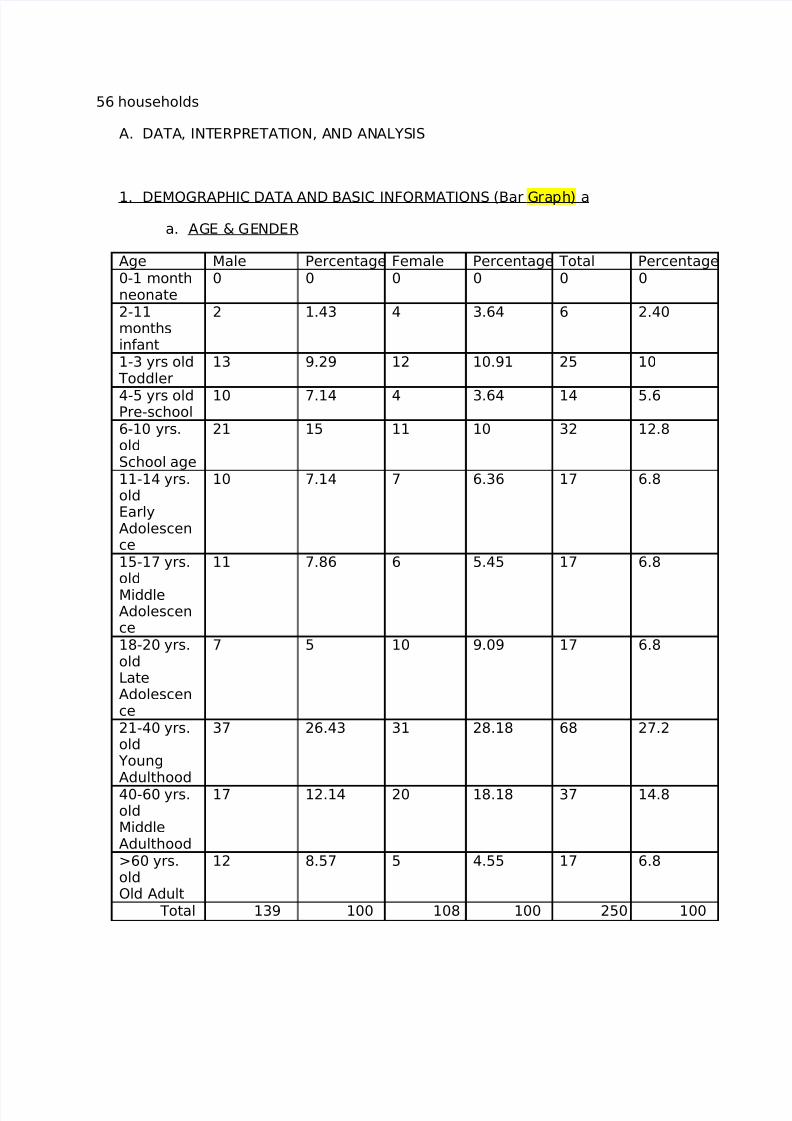
56 households
A. DATA, INTERPRETATION, AND ANALYSIS
1. DEMOGRAPHIC DATA AND BASIC INFORMATIONS (Bar Graph) a
a. AGE & GENDER
Age Male Percentage Female Percentage Total Percentage0-1 monthneonate
0 0 0 0 0 0
2-11monthsinfant
2 1.43 4 3.64 6 2.40
1-3 yrs old Toddler
13 9.29 12 10.91 25 10
4-5 yrs oldPre-school
10 7.14 4 3.64 14 5.6
6-10 yrs.oldSchool age
21 15 11 10 32 12.8
11-14 yrs.oldEarlyAdolescence
10 7.14 7 6.36 17 6.8
15-17 yrs.old
MiddleAdolescence
11 7.86 6 5.45 17 6.8
18-20 yrs.oldLateAdolescence
7 5 10 9.09 17 6.8
21-40 yrs.old
YoungAdulthood
37 26.43 31 28.18 68 27.2
40-60 yrs.oldMiddleAdulthood
17 12.14 20 18.18 37 14.8
>60 yrs.oldOld Adult
12 8.57 5 4.55 17 6.8
Total 139 100 108 100 250 100
8/8/2019 Copar Edited With Charts
http://slidepdf.com/reader/full/copar-edited-with-charts 2/25
b. CIVIL STATUS (18 YEARS OLD AND ABOVE) (Bar Graph) b
Category Male Percentage
Female Percentage
Total Percentage
Single 23 31.51 16 24.24 39 28.06Married 48 65.75 48 72.73 96 69.06
Widowed 2 2.74 2 3.03 4 2.88
Total 73 100 66 100 136 100
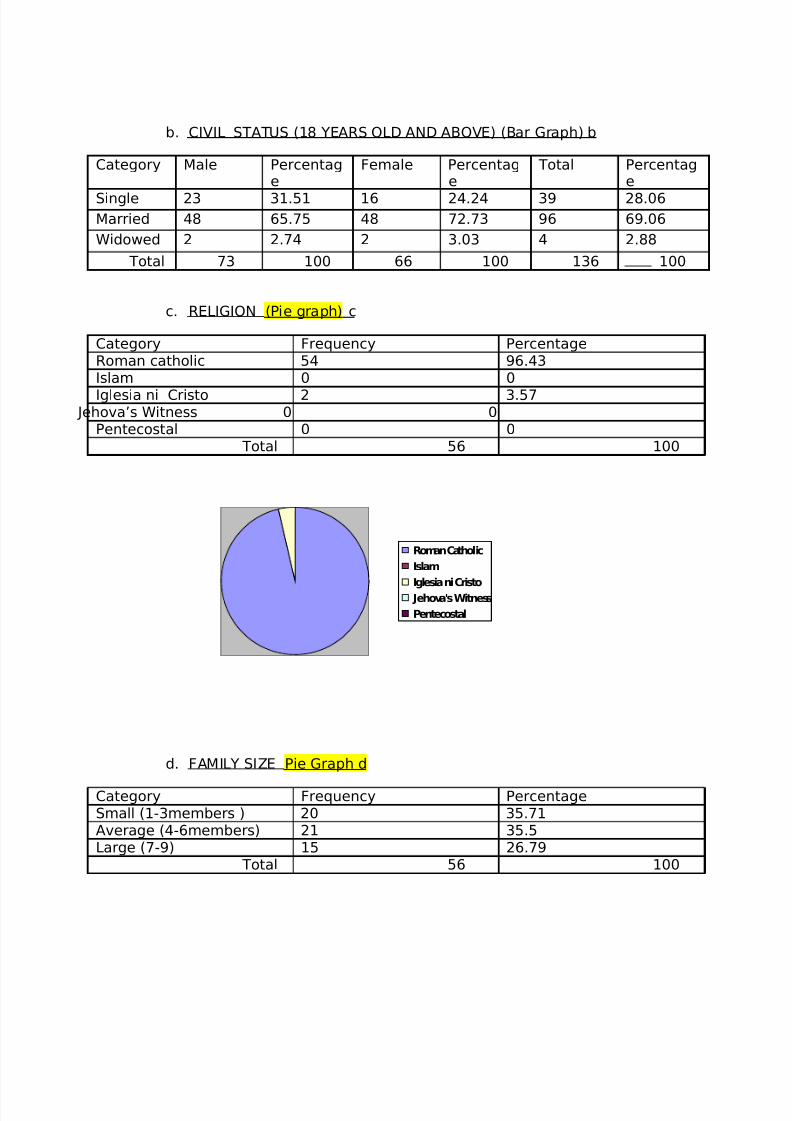
c. RELIGION (Pie graph) c
Category Frequency PercentageRoman catholic 54 96.43Islam 0 0
Iglesia ni Cristo 2 3.57 Jehova’s Witness 0 0Pentecostal 0 0
Total 56 100
Roman Catholic
Islam
Iglesia ni Cristo
Jehova's Witness
Pentecostal
d. FAMILY SIZE Pie Graph d
Category Frequency PercentageSmall (1-3members ) 20 35.71Average (4-6members) 21 35.5Large (7-9) 15 26.79
Total 56 100
8/8/2019 Copar Edited With Charts
http://slidepdf.com/reader/full/copar-edited-with-charts 3/25
e. EMPLOYMENT (HEAD OF THE FAMILY) Pie Graph a
Blue collar: skilled or unskilled and may involve manufacturing, mining, building,
and construction trades, mechanical work, maintenance, repair, and operations
maintenance or technical institutions.
White collar: non- manual labor often in an office; and the services industry worker
performs labor involving customer interactions, entertainment, retail and outside
sales.
Category Frequency PercentageBlue collar 60 96.77White collar 2 3.23
Total 62 100
f. SOURCES OF INCOME (15 years old and above) (Bar Graph) b
Category Male
Percentage
Female Percentage
total Percentage
Employed 59 70.24 18 25 77 49.36Self-employed
16 19.05 1 1.39 17 10.90
Unemployed 9 10.71 53 73.61 62 39.74 Total 84 100 72 100 156 100 Total number of residents aged 15 years old and above: 156
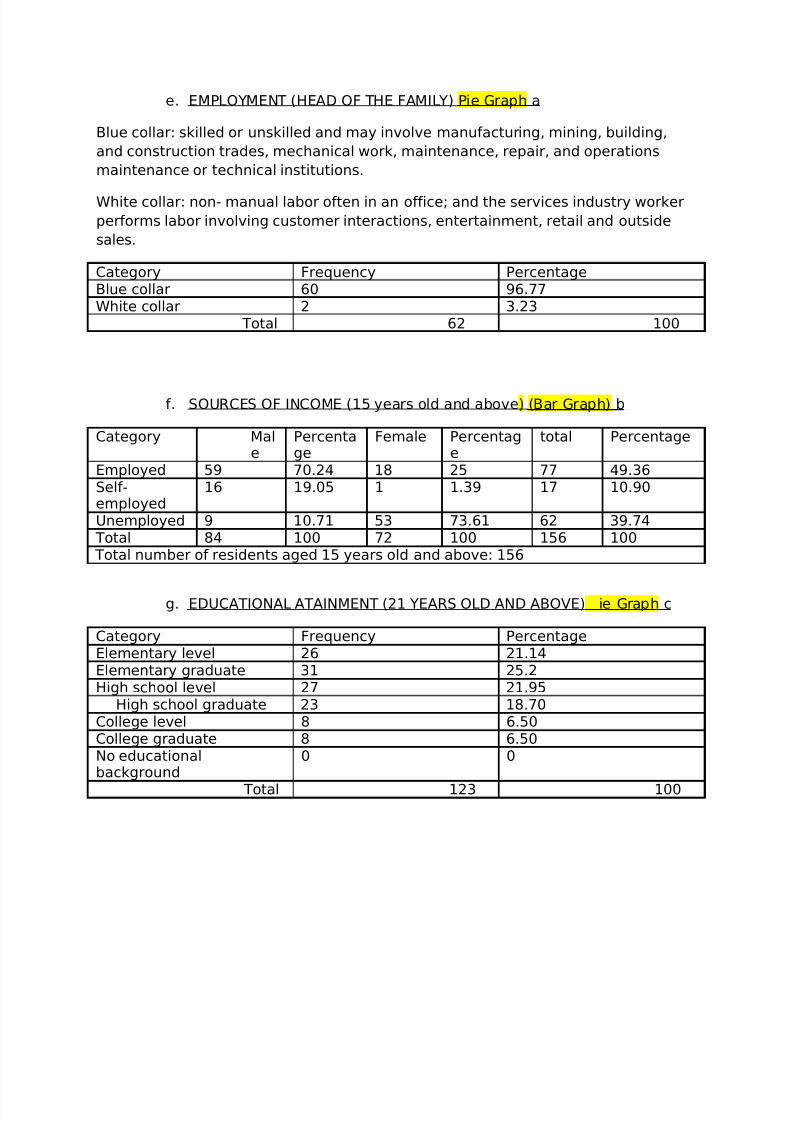
g. EDUCATIONAL ATAINMENT (21 YEARS OLD AND ABOVE) Pie Graph c
Category Frequency PercentageElementary level 26 21.14Elementary graduate 31 25.2High school level 27 21.95
High school graduate 23 18.70College level 8 6.50College graduate 8 6.50No educationalbackground
0 0
Total 123 100
8/8/2019 Copar Edited With Charts
http://slidepdf.com/reader/full/copar-edited-with-charts 4/25
Elementary Level
Elementary graduate
High school level
High school graduateCollege level
College graduate
No educational background
h. EDUCATIONAL BACKGROUND (7-20 YEARS OLD) Pie Graph d
Category Frequency PercentageSchooling 61 77.22Out of school youth 18 22.78
Total 79 100
i. ANIMAL OWNERSHIP Bar Graph a
Category
Nakabuhi
Freq
% Nakatali/Nakakulong
Freq
% TotalFrequen
cy
% TotalPercenta
geDog 33 70.2
114 29.7
947 7.95 100
Chicken
269 82.26
58 17.74
327 55.33
100
Carabao
1 33.33
2 66.67
3 0.51 100
Goat 46 100 46 7.78 100Pig 20 100 20 3.38 100Cow 0Cat 16 100 16 2.71Duck 54 100 54 9.14 100
Turkey 77 100 77 13.03
Bird 1 100 1 0.17 100 Total 396 67.0
1195 32.9
9591 100 100
8/8/2019 Copar Edited With Charts
http://slidepdf.com/reader/full/copar-edited-with-charts 5/25
DOG VACCINATION Pie Graph b
CATEGORY FREQUENCY PERCENTAGEVaccinated 15 31.91Not vaccinated 32 68.09
Total 47 100
2. ECONOMIC STATUS
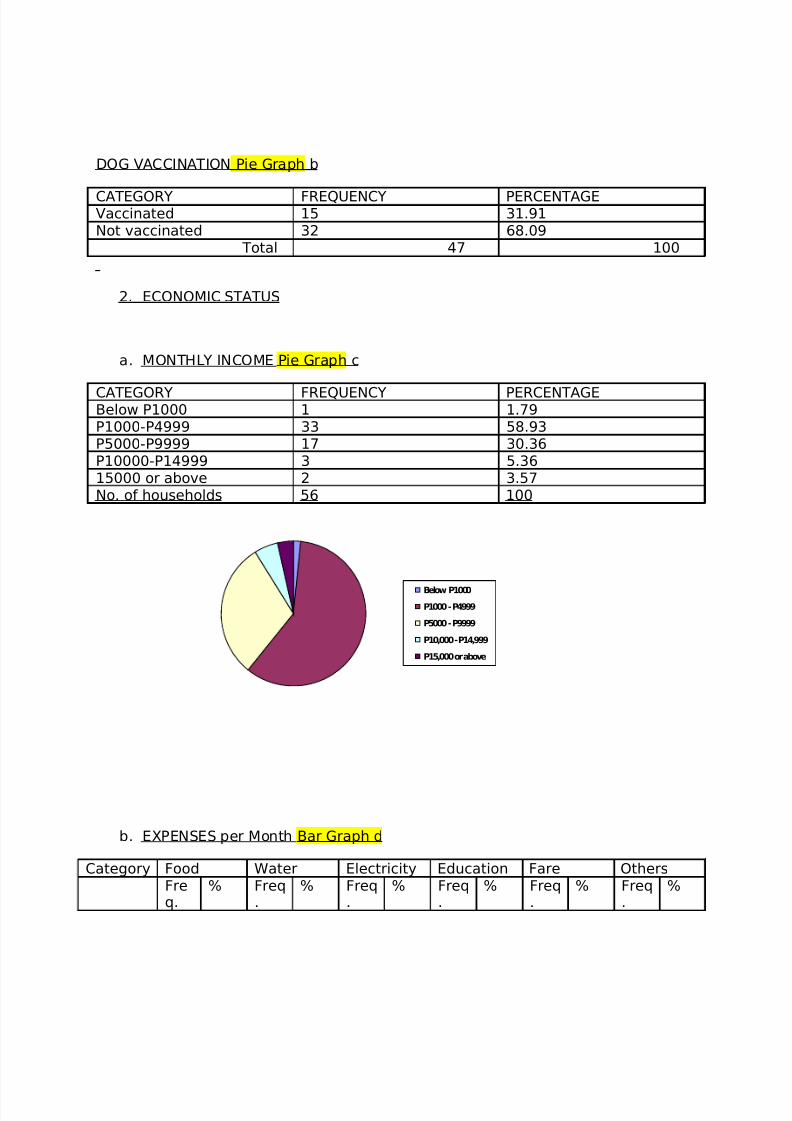
a. MONTHLY INCOME Pie Graph c
CATEGORY FREQUENCY PERCENTAGEBelow P1000 1 1.79P1000-P4999 33 58.93P5000-P9999 17 30.36P10000-P14999 3 5.3615000 or above 2 3.57No. of households 56 100
Below P1000
P1000 - P4999
P5000 - P9999
P10,000 - P14,999
P15,000 or above
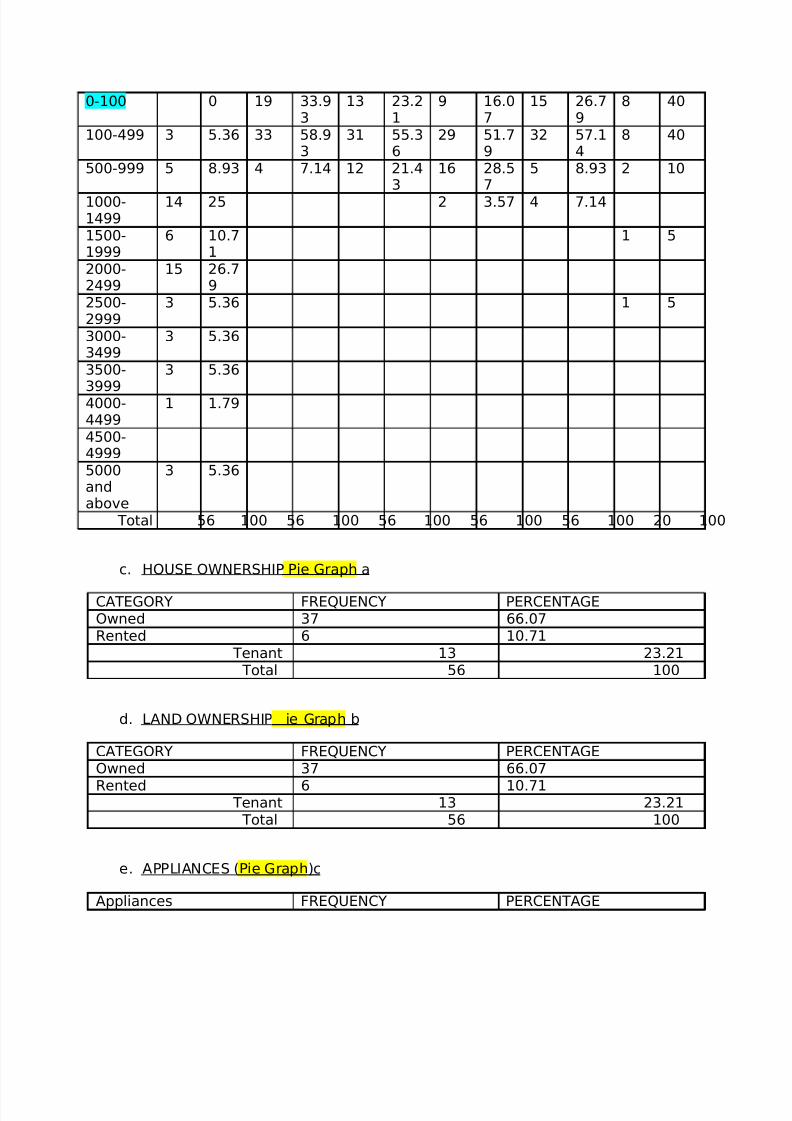
b. EXPENSES per Month Bar Graph d
Category Food Water Electricity Education Fare OthersFreq.
% Freq.
% Freq.
% Freq.
% Freq.
% Freq.
%
8/8/2019 Copar Edited With Charts
http://slidepdf.com/reader/full/copar-edited-with-charts 6/25
0-100 0 19 33.93
13 23.21
9 16.07
15 26.79
8 40
100-499 3 5.36 33 58.93
31 55.36
29 51.79
32 57.14
8 40
500-999 5 8.93 4 7.14 12 21.43
16 28.57
5 8.93 2 10
1000-1499
14 25 2 3.57 4 7.14
1500-1999
6 10.71
1 5
2000-2499
15 26.79
2500-2999
3 5.36 1 5
3000-3499
3 5.36
3500-
3999
3 5.36
4000-4499
1 1.79
4500-49995000andabove
3 5.36
Total 56 100 56 100 56 100 56 100 56 100 20 100
c. HOUSE OWNERSHIP Pie Graph a
CATEGORY FREQUENCY PERCENTAGEOwned 37 66.07Rented 6 10.71
Tenant 13 23.21 Total 56 100
d. LAND OWNERSHIP Pie Graph b
CATEGORY FREQUENCY PERCENTAGEOwned 37 66.07
Rented 6 10.71 Tenant 13 23.21 Total 56 100
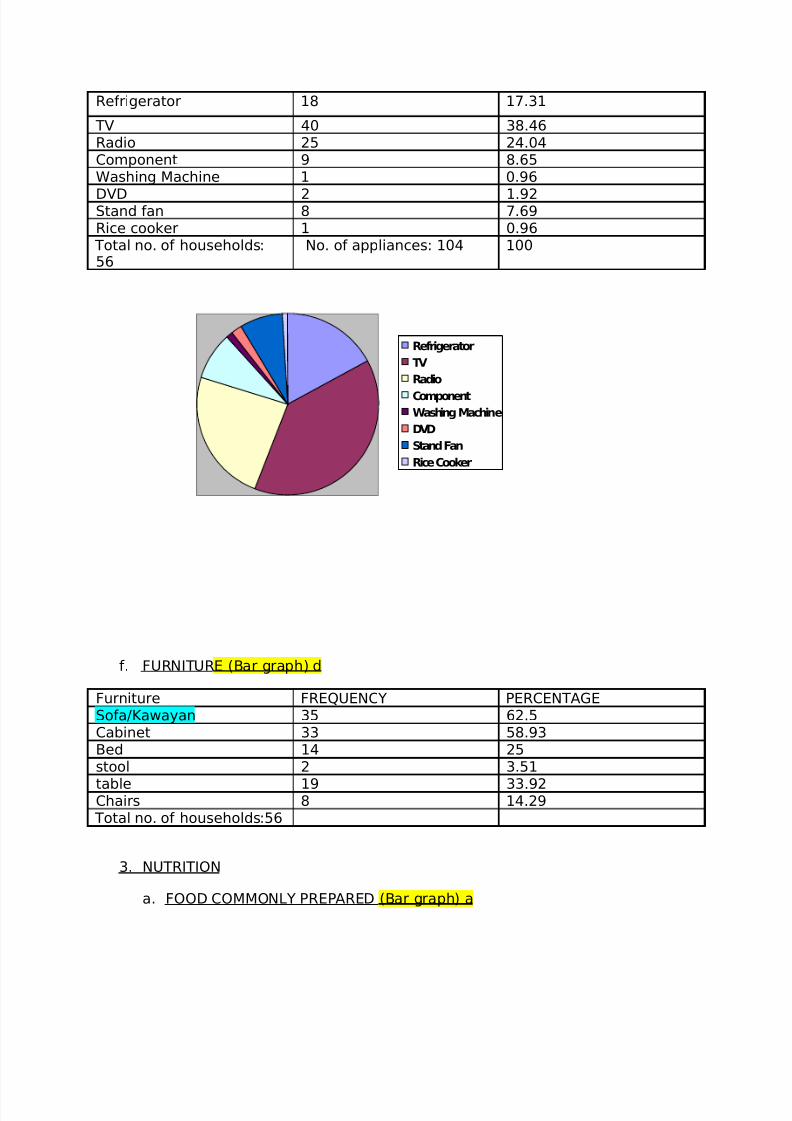
e. APPLIANCES (Pie Graph )c
Appliances FREQUENCY PERCENTAGE
8/8/2019 Copar Edited With Charts
http://slidepdf.com/reader/full/copar-edited-with-charts 7/25
Refrigerator 18 17.31
TV 40 38.46Radio 25 24.04Component 9 8.65Washing Machine 1 0.96
DVD 2 1.92Stand fan 8 7.69Rice cooker 1 0.96
Total no. of households:56
No. of appliances: 104 100
Refrigerator
TV
Radio
Component
Washing Machine
DVD
Stand Fan
Rice Cooker
f. FURNITUR E (Bar graph) d
Furniture FREQUENCY PERCENTAGESofa/Kawayan 35 62.5Cabinet 33 58.93Bed 14 25stool 2 3.51
table 19 33.92Chairs 8 14.29
Total no. of households:56
3. NUTRITION
a. FOOD COMMONLY PREPARED (Bar graph) a
8/8/2019 Copar Edited With Charts
http://slidepdf.com/reader/full/copar-edited-with-charts 8/25
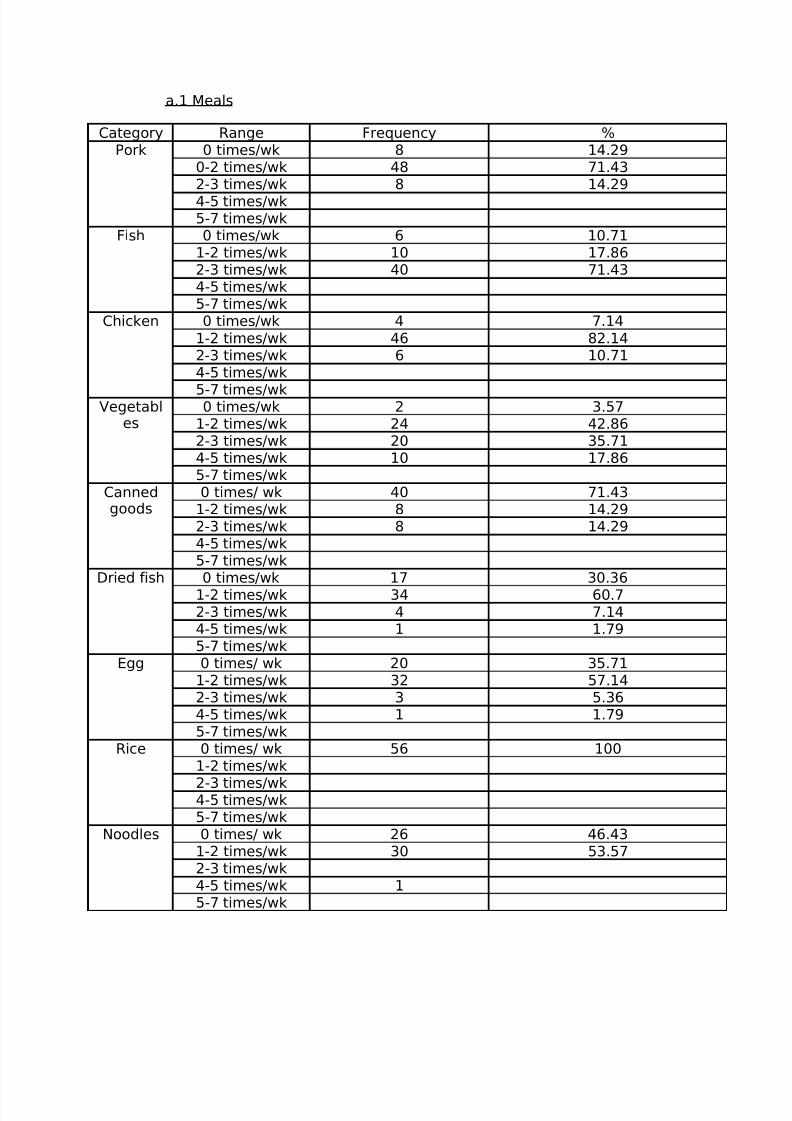
a.1 Meals
Category Range Frequency %Pork 0 times/wk 8 14.29
0-2 times/wk 48 71.432-3 times/wk 8 14.29
4-5 times/wk5-7 times/wk
Fish 0 times/wk 6 10.711-2 times/wk 10 17.862-3 times/wk 40 71.434-5 times/wk5-7 times/wk
Chicken 0 times/wk 4 7.14
1-2 times/wk 46 82.142-3 times/wk 6 10.714-5 times/wk
5-7 times/wkVegetabl
es0 times/wk 2 3.57
1-2 times/wk 24 42.862-3 times/wk 20 35.714-5 times/wk 10 17.865-7 times/wk
Cannedgoods
0 times/ wk 40 71.431-2 times/wk 8 14.292-3 times/wk 8 14.294-5 times/wk5-7 times/wk
Dried fish 0 times/wk 17 30.36
1-2 times/wk 34 60.72-3 times/wk 4 7.144-5 times/wk 1 1.795-7 times/wk
Egg 0 times/ wk 20 35.711-2 times/wk 32 57.142-3 times/wk 3 5.364-5 times/wk 1 1.795-7 times/wk
Rice 0 times/ wk 56 1001-2 times/wk
2-3 times/wk4-5 times/wk5-7 times/wk
Noodles 0 times/ wk 26 46.431-2 times/wk 30 53.572-3 times/wk4-5 times/wk 15-7 times/wk
8/8/2019 Copar Edited With Charts
http://slidepdf.com/reader/full/copar-edited-with-charts 9/25
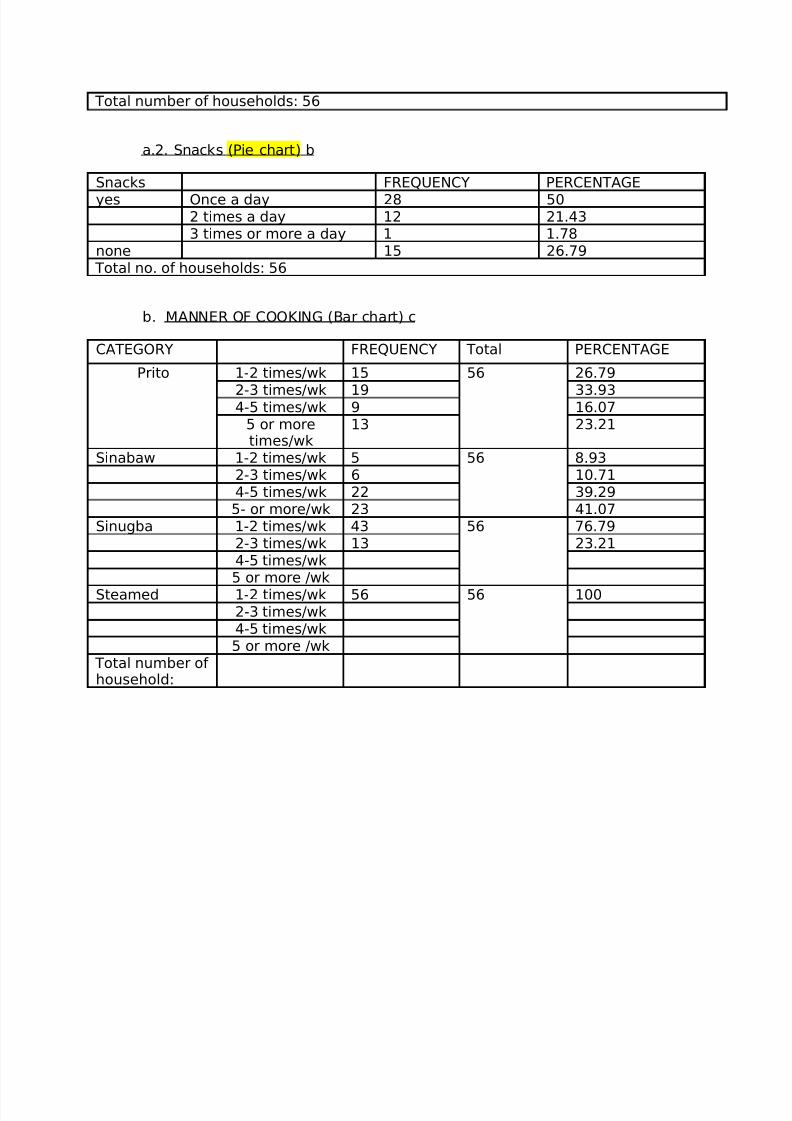
Total number of households: 56
a.2. Snacks (Pie chart) b
Snacks FREQUENCY PERCENTAGE
yes Once a day 28 502 times a day 12 21.433 times or more a day 1 1.78
none 15 26.79 Total no. of households: 56
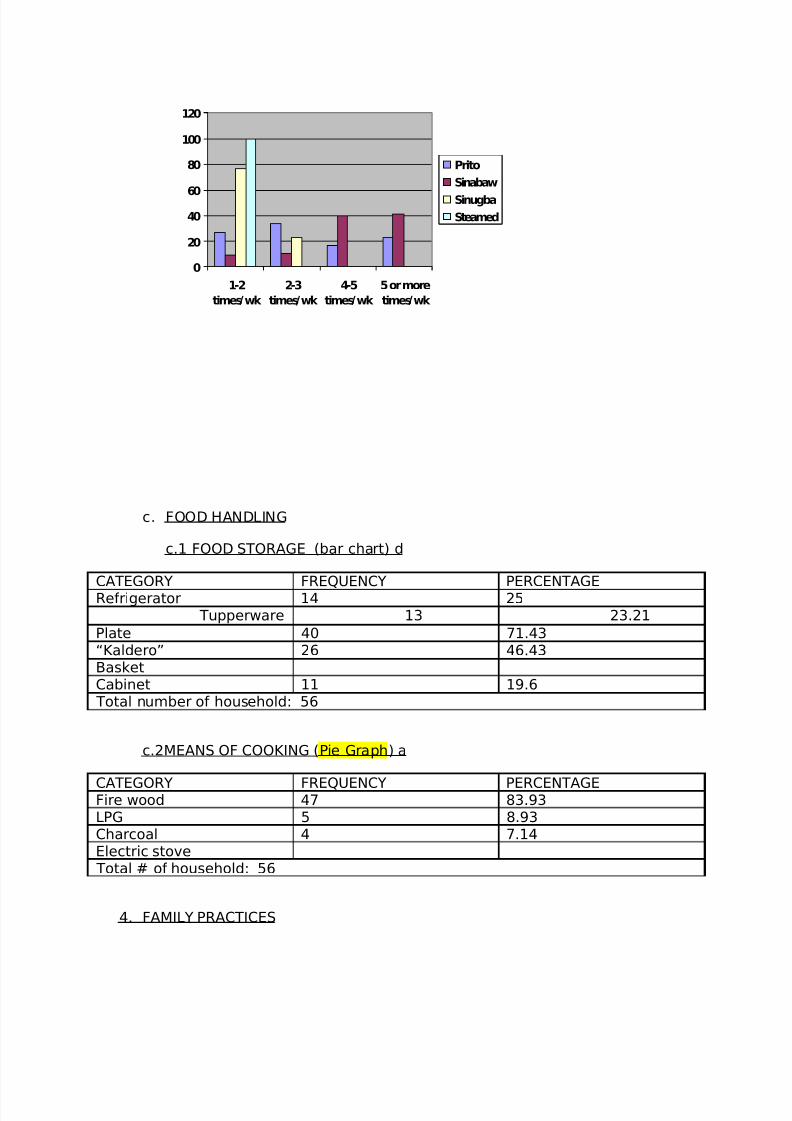
b. MANNER OF COOKING (Bar chart) c
CATEGORY FREQUENCY Total PERCENTAGE
Prito 1-2 times/wk 15 56 26.79
2-3 times/wk 19 33.934-5 times/wk 9 16.07
5 or moretimes/wk
13 23.21
Sinabaw 1-2 times/wk 5 56 8.932-3 times/wk 6 10.714-5 times/wk 22 39.295- or more/wk 23 41.07
Sinugba 1-2 times/wk 43 56 76.792-3 times/wk 13 23.214-5 times/wk5 or more /wk
Steamed 1-2 times/wk 56 56 1002-3 times/wk4-5 times/wk5 or more /wk
Total number of household:
8/8/2019 Copar Edited With Charts
http://slidepdf.com/reader/full/copar-edited-with-charts 10/25
0
20
40
60
80
100
120
1-2
times/wk
2-3
times/wk
4-5
times/wk
5 or more
times/wk
Prito
Sinabaw
Sinugba
Steamed
c. FOOD HANDLING
c.1 FOOD STORAGE (bar chart) d
CATEGORY FREQUENCY PERCENTAGERefrigerator 14 25
Tupperware 13 23.21
Plate 40 71.43“Kaldero” 26 46.43BasketCabinet 11 19.6
Total number of household: 56
c.2MEANS OF COOKING (Pie Graph ) a
CATEGORY FREQUENCY PERCENTAGEFire wood 47 83.93LPG 5 8.93Charcoal 4 7.14Electric stove
Total # of household: 56
4. FAMILY PRACTICES
8/8/2019 Copar Edited With Charts
http://slidepdf.com/reader/full/copar-edited-with-charts 11/25
a. FAMILY PLANNING (Bar graph) b
CATEGORY FREQUENCY PERCENTAGENone 22 52.38Pills 8 19.04IUD 2 4.76
Withdrawal 3 7.14Ligation 2 4.76Calendar method 4 9.56Abstinence 1 2.38CondomVasectomyInjection 1 2.38
Total number of married couples : 42
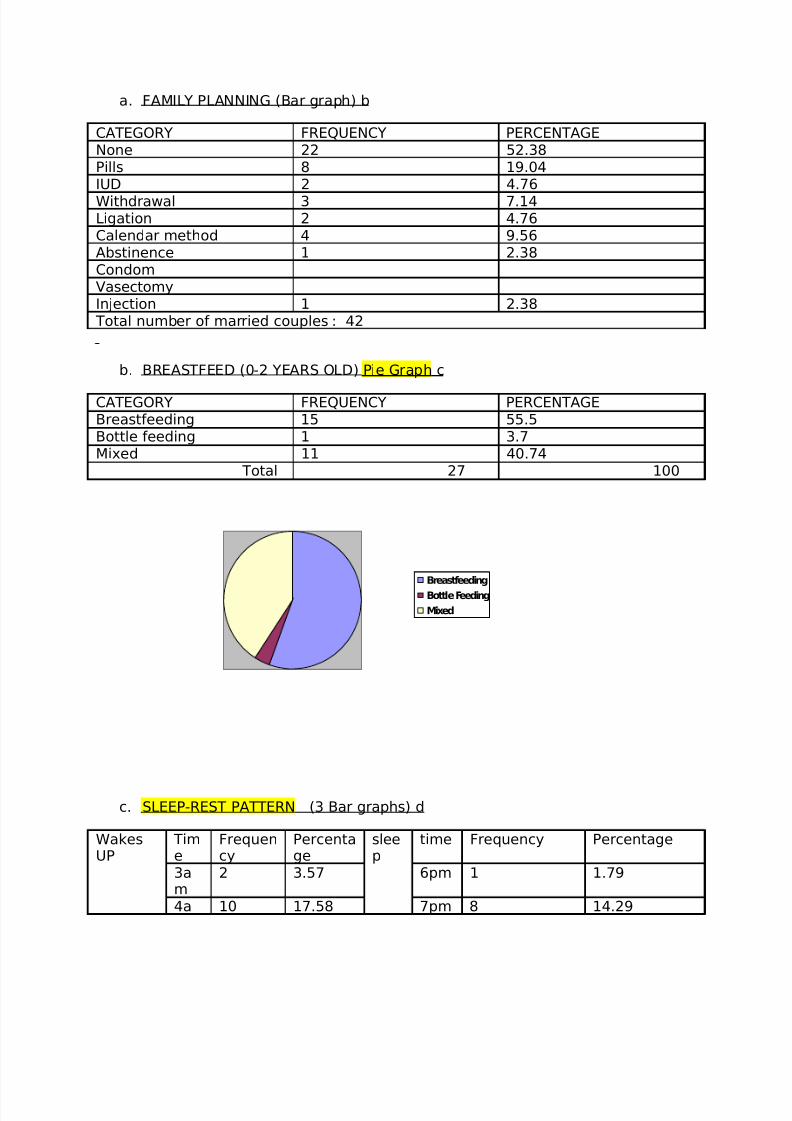
b. BREASTFEED (0-2 YEARS OLD) Pie Graph c
CATEGORY FREQUENCY PERCENTAGEBreastfeeding 15 55.5Bottle feeding 1 3.7Mixed 11 40.74
Total 27 100
Breastfeeding
Bottle Feeding
Mixed
c. SLEEP-REST PATTERN (3 Bar graphs) d
WakesUP
Time
Frequency
Percentage
sleep
time Frequency Percentage
3am
2 3.57 6pm 1 1.79
4a 10 17.58 7pm 8 14.29
8/8/2019 Copar Edited With Charts
http://slidepdf.com/reader/full/copar-edited-with-charts 12/25
m5am
30 53.57 8pm 18 32.14
6am
11 19.64 9pm 21 37.5
7am
3 5.36 10pm
4 7.14
8am
11pm
3 5.36
9am
12am
1 1.79
Total no. of households:56 Total no. of households: 56siesta tim
eFrequency
Percentage
none
26 46.43
12 4 7.14
1 15 26.792 11 19.6434
Total no. of household: 56
d. DECEASED FAMILY MEMBER (bar graph) a
REASONS No. of deceasedfamily members
PERCENTAGE
Pneumonia 0
Cough 0Cancer 2 3.57Please add! 0Old age 0ulcer 2 3.57During birth 1 1.79
Total number of household: 56
e. HYGIENE (aged 12 and below) (bar graph) b
CATEGORY FREQUENCY PERCENTAGE
Taking a bath everyday 55 65.48Brushing of teeth 50 59.52Wearing of slippers 50 59.52Wearing of clean clothing 49 58.3
Trimming of nails on bothupper and lowerextremities
34 40.48
Presence of wounds and 10 19.64
8/8/2019 Copar Edited With Charts
http://slidepdf.com/reader/full/copar-edited-with-charts 13/25
skin disease Total number of children aged 12 years old and below: 84
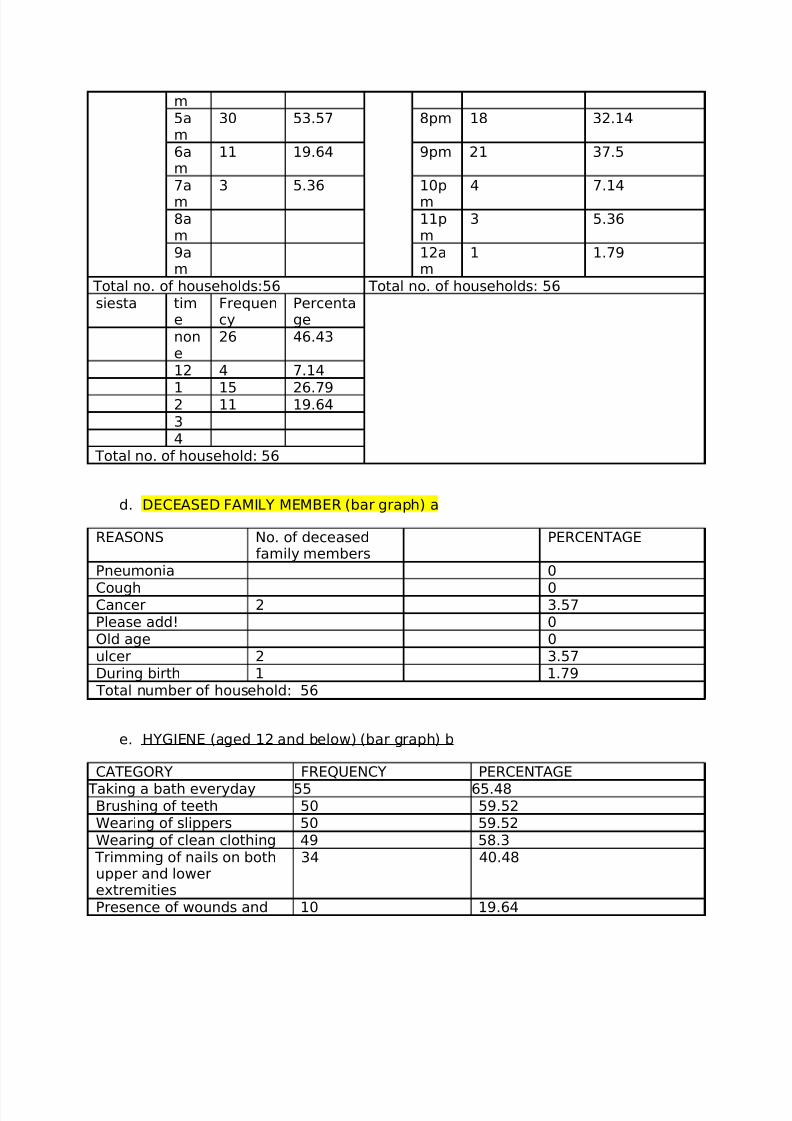
f. CULTURAL PRACTICES (Bar graph) c
ACTIVITIES IN THE CHURCHACTIVELYPARTICIPATED
FREQUENCY
PERCENTAGE
PARTICIPATED DURINGFIESTA
FREQUENCY
PERCENTAGE
Gkk 3 5.36 yes 25 51.79Patron fiesta 13 23.21 no 19 33.93Religiousseminars
5 8.93
none 6 10.71Cleaning 1 1.79Going tomass
1 1.79
Total number of household: 56
Gkk
Patron fiesta
Religiousseminars
none
Cleaning
Goingto mass
yes no
5. HEALTH SERVICES AND RECREATIONAL ACTIVITES
a. KNOWN BARANGAY HALL SERVICES bar graph a
CATEGORY FREQUENCY PERCENTAGECedula 39 69.64
Barangay clearance 29 51.79Livelihood programs 16 28.57Resolving conflicts withinbarangay
22 39.29
Feeding program 23 41.07Road 16 28.57Not aware 2 0.36
Total no. of households 56 100
8/8/2019 Copar Edited With Charts
http://slidepdf.com/reader/full/copar-edited-with-charts 14/25
b. KNOWN HEALTH CENTER SERVICES bar graph b
CATEGORY FREQUENCY PERCENTAGEImmunization 45 80.36
Medical check-ups 36 64.29Prenatal check-ups 35 62.5Free medications 26 46.43B.P. Taking 39 69.64Dental Check-Ups 23 41.07Family Planning 34 60.71Not aware 1 0.18Animal Vaccination 27 48.21
Total number of households: 56
c. RECREATIONAL FACILITIES( KAMI NA BAHALA DITO )
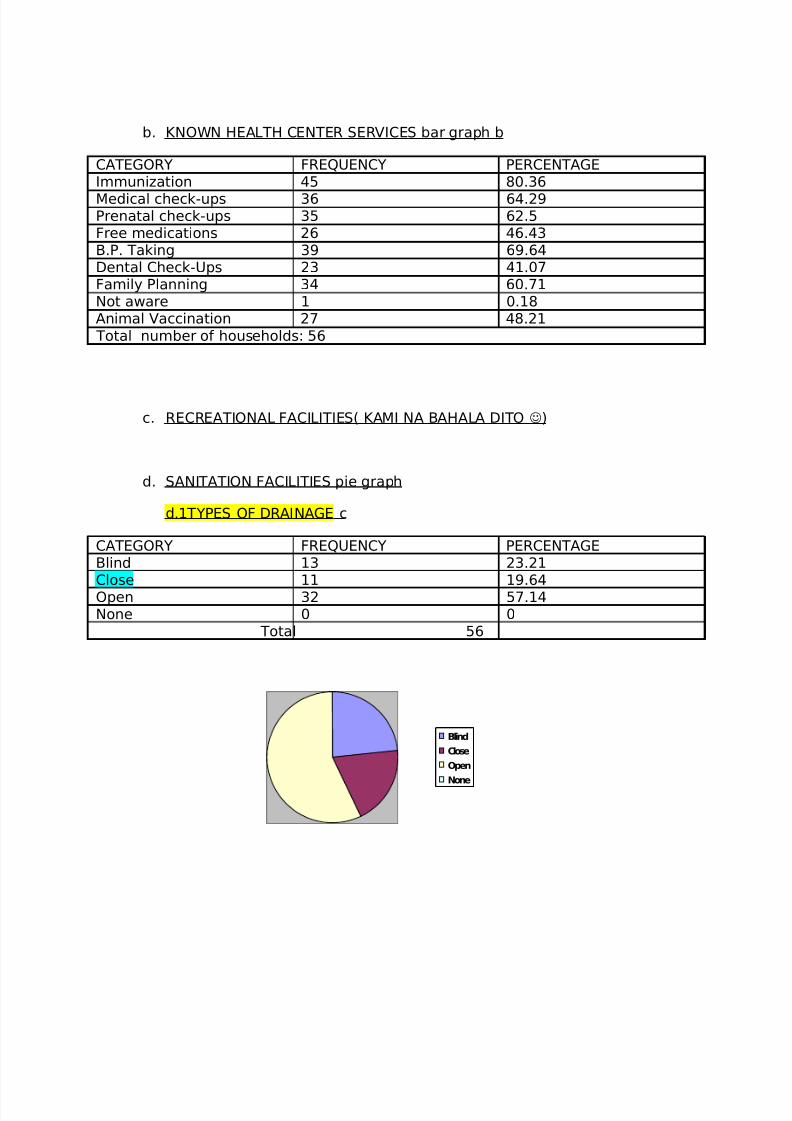
d. SANITATION FACILITIES pie graph
d.1TYPES OF DRAINAGE c
CATEGORY FREQUENCY PERCENTAGEBlind 13 23.21Close 11 19.64Open 32 57.14None 0 0
Total 56
Blind
Close
Open
None
8/8/2019 Copar Edited With Charts
http://slidepdf.com/reader/full/copar-edited-with-charts 15/25
d.2 GARBAGE DISPOSAL pie graph a
CATEGORY FREQUENCY PERCENTAGEBurning 34 60.71Compost pit 16 28.51Segregate 6 10.71
CENRO collection Total number of household 56
d.3 TYPES OF TOILET pie graph b
CATEGORY FREQUENCY PERCENTAGEWater-sealed 24 42.86%“Antipolo” 13 23.21%Flush 19 33.93%
Total 56 100%
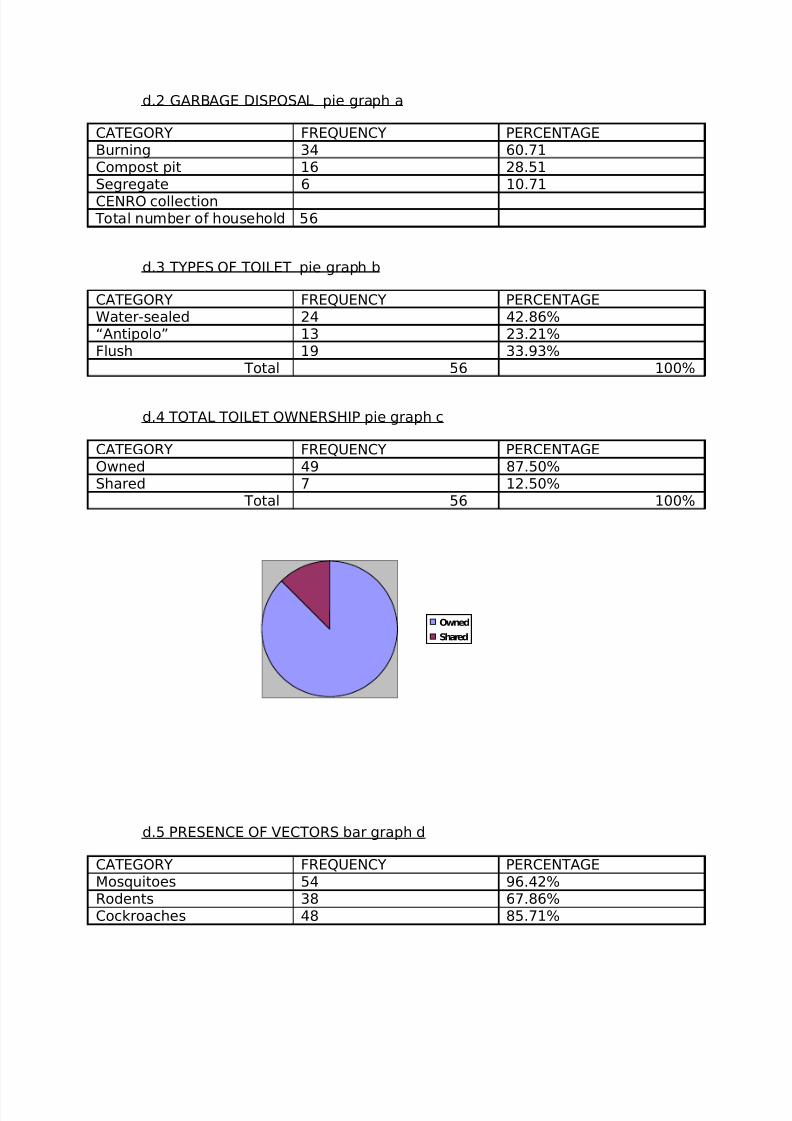
d.4 TOTAL TOILET OWNERSHIP pie graph c
CATEGORY FREQUENCY PERCENTAGEOwned 49 87.50%Shared 7 12.50%
Total 56 100%
Owned
Shared
d.5 PRESENCE OF VECTORS bar graph d
CATEGORY FREQUENCY PERCENTAGEMosquitoes 54 96.42%Rodents 38 67.86%Cockroaches 48 85.71%
8/8/2019 Copar Edited With Charts
http://slidepdf.com/reader/full/copar-edited-with-charts 16/25
Flies 49 87.50% Total number of household: 56
e. SOURCE OF WATER AND ELECTRICITY a
2 pie graphs
Source SOURCE FREQUENCY PERCENTAGEWater Nawasa 40 71.43%
Others (DCWD) 16 28.57% Total no. of households:56Electricity Davao Light 42 75%
Others (COOP) 14 25% Total no. of households:56
f. HERBAL PLANTS bar graph b
CATEGORY FREQUENCY PERCENTAGEGabon 12 14.63%Kalabo 2 2.44%
Tawa-tawa 19 23.17%BayabasLagundi 21 25.61%Malunggay 14 17.07%
Tanglad 5 6.10% Tuba-tuba 1 1.22%Kepe-kepeMayanaSambong 5 6.10%Paw
Yakon 1 1.22%Luba 1 1.22%Add more (Canada) 1 1.22%
Total 82 100%
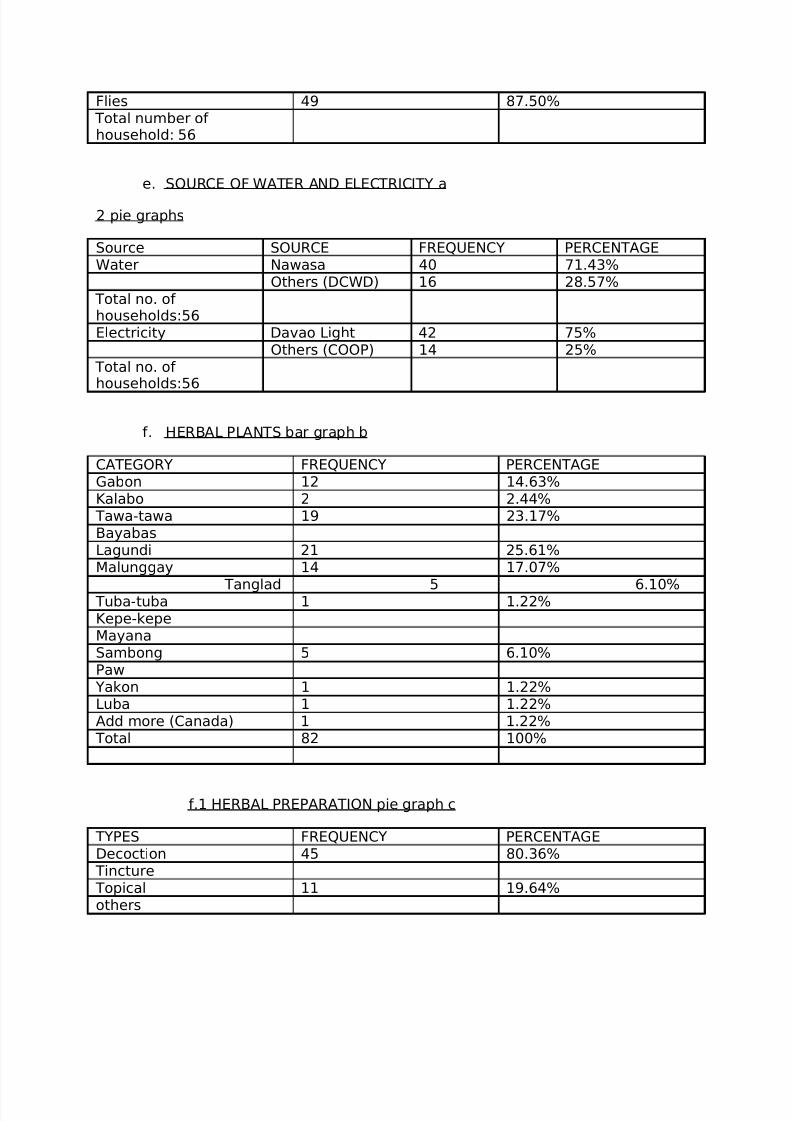
f.1 HERBAL PREPARATION pie graph c
TYPES FREQUENCY PERCENTAGEDecoction 45 80.36%
Tincture Topical 11 19.64%others
8/8/2019 Copar Edited With Charts
http://slidepdf.com/reader/full/copar-edited-with-charts 17/25
Total no. of households
Decoction
Tincture
Topical
others
g. Spraying
g.1 KNOW THE RIGHT TIME AND DAY OF SPRAYING pie graph d
KNOWLEGE FREQUENCY PERC5ENTAGEAware 33 58.93%Not aware 23 41.07%
Total no. of household
56 100%
g.2 EFFECT OF SPRAYING pie graph a
KNOWLEGE FREQUENCY PERCENTAGEAware 42 75%Not aware 14 25%
Total no. of household
56 100%
g.3 ACTIONS WHILE SPRAYING IS DONE pie graph b
ACTIONS FREQUENCY PERCENTAGEWearing of mask 15 26.79%Staying away from
the area
35 62.50%
OthersNone 6 10.71%
Total no. of household
56 100%
6. EDUCATIONAL FACILITIES (kami na bahala dito )
8/8/2019 Copar Edited With Charts
http://slidepdf.com/reader/full/copar-edited-with-charts 18/25
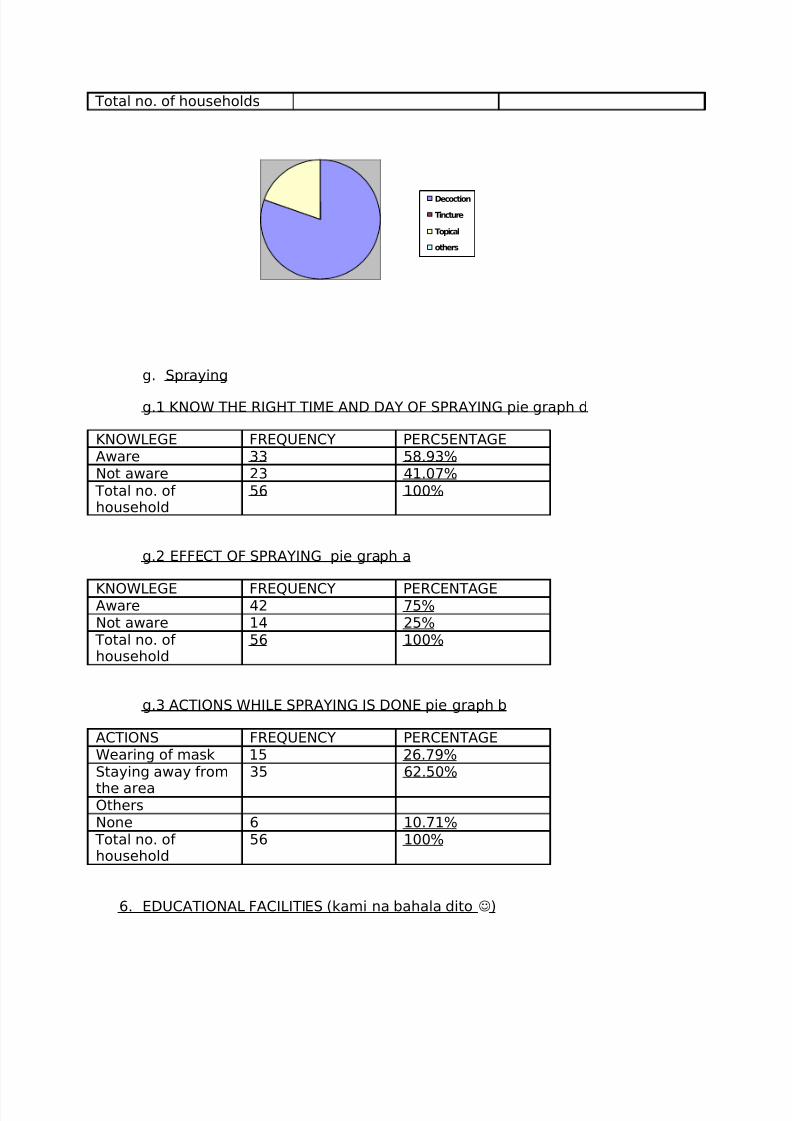
7. COMMUNITY ORGANIZATION bar graph c
ORGANIZATION
FREQUENCY PERCENTAGE
Karanso 4 7.14%Women 2 3.57%GKK 5 8.93%None 10 17.86%
Total no. of households: 56
0.00%
5.00%
10.00%
15.00%
20.00%
Karanso
Women
GKK
None
8. COMMUNITY PROBLEMS AND NEEDS
a. FAMILY PROBLEMS pie graph d
CATEGORY FREQUENCY PERCENTAGEFood supply 9 16.07%
Misunderstanding amongfamily members
10 17.86%
Lack of medical supply 23 41.07%Gambling /vices 4 7.14%Large family size 10 17.86%Others
Total number of household:56
8/8/2019 Copar Edited With Charts
http://slidepdf.com/reader/full/copar-edited-with-charts 19/25
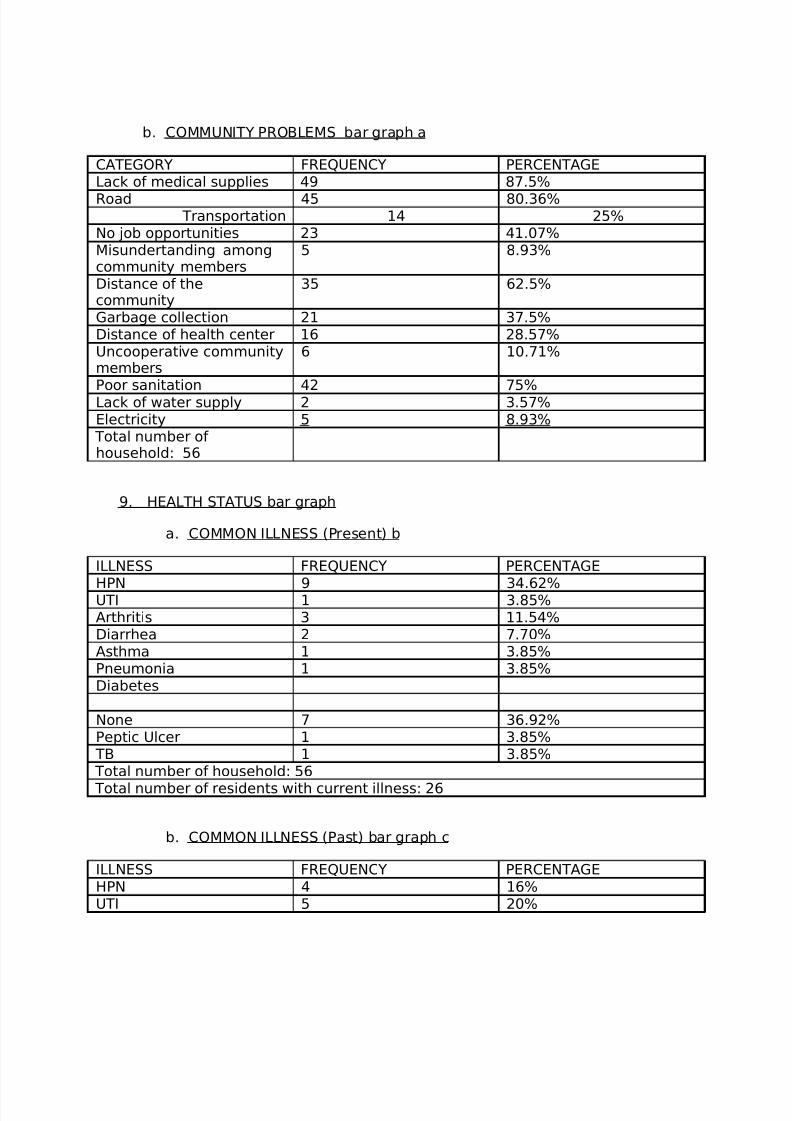
b. COMMUNITY PROBLEMS bar graph a
CATEGORY FREQUENCY PERCENTAGELack of medical supplies 49 87.5%
Road 45 80.36% Transportation 14 25%No job opportunities 23 41.07%Misundertanding amongcommunity members
5 8.93%
Distance of thecommunity
35 62.5%
Garbage collection 21 37.5%Distance of health center 16 28.57%Uncooperative communitymembers
6 10.71%
Poor sanitation 42 75%Lack of water supply 2 3.57%Electricity 5 8.93%
Total number of household: 56
9. HEALTH STATUS bar graph
a. COMMON ILLNESS (Present) b
ILLNESS FREQUENCY PERCENTAGE
HPN 9 34.62%UTI 1 3.85%Arthritis 3 11.54%Diarrhea 2 7.70%Asthma 1 3.85%Pneumonia 1 3.85%Diabetes
None 7 36.92%Peptic Ulcer 1 3.85%
TB 1 3.85% Total number of household: 56
Total number of residents with current illness: 26
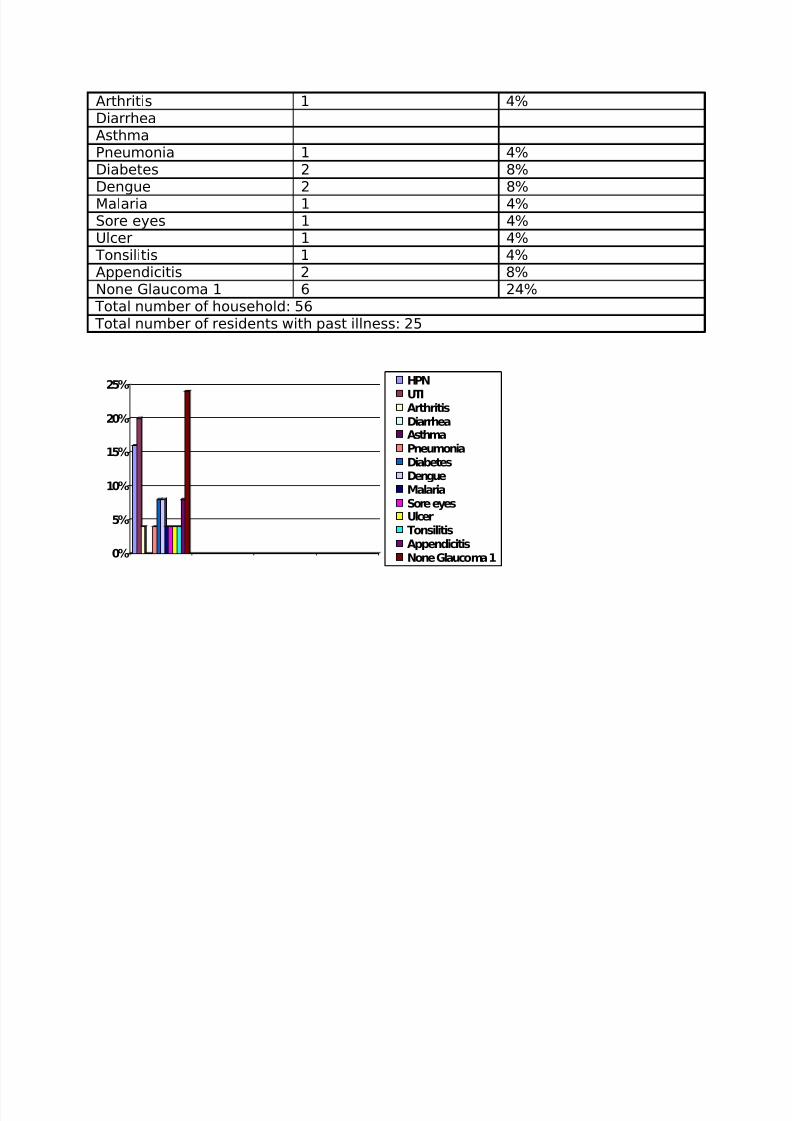
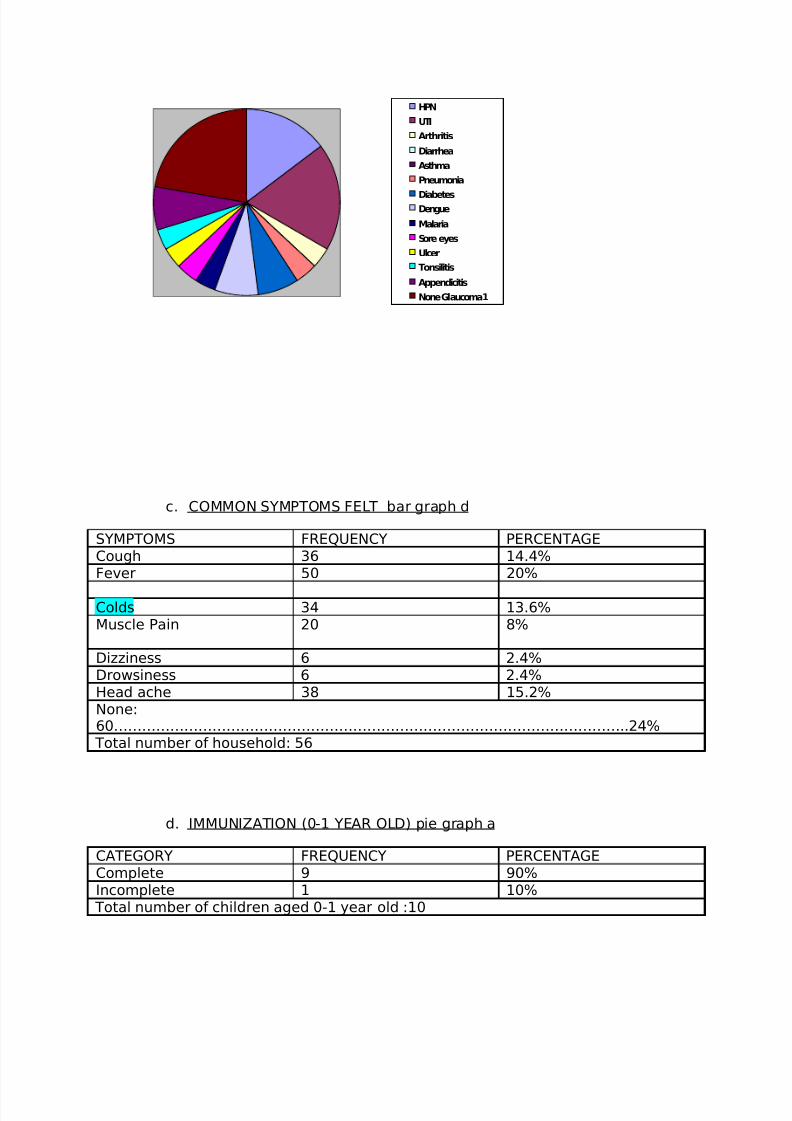
b. COMMON ILLNESS (Past) bar graph c
ILLNESS FREQUENCY PERCENTAGE
HPN 4 16%UTI 5 20%
8/8/2019 Copar Edited With Charts
http://slidepdf.com/reader/full/copar-edited-with-charts 20/25
Arthritis 1 4%DiarrheaAsthmaPneumonia 1 4%Diabetes 2 8%Dengue 2 8%Malaria 1 4%Sore eyes 1 4%Ulcer 1 4%
Tonsilitis 1 4%Appendicitis 2 8%None Glaucoma 1 6 24%
Total number of household: 56
Total number of residents with past illness: 25
0%
5%
10%
15%
20%
25% HPN
UTIArthritisDiarrheaAsthmaPneumoniaDiabetesDengueMalariaSore eyesUlcerTonsilitisAppendicitisNone Glaucoma 1
8/8/2019 Copar Edited With Charts
http://slidepdf.com/reader/full/copar-edited-with-charts 21/25
HPN
UTI
Arthritis
Diarrhea
Asthma
Pneumonia
DiabetesDengue
Malaria
Sore eyes
Ulcer
Tonsilitis
Appendicitis
None Glaucoma 1
c. COMMON SYMPTOMS FELT bar graph d
SYMPTOMS FREQUENCY PERCENTAGECough 36 14.4%Fever 50 20%
Colds 34 13.6%Muscle Pain 20 8%
Dizziness 6 2.4%Drowsiness 6 2.4%Head ache 38 15.2%None:60………………………………………………………………………………………………..24%
Total number of household: 56
d. IMMUNIZATION (0-1 YEAR OLD) pie graph a
CATEGORY FREQUENCY PERCENTAGEComplete 9 90%Incomplete 1 10%
Total number of children aged 0-1 year old :10
8/8/2019 Copar Edited With Charts
http://slidepdf.com/reader/full/copar-edited-with-charts 22/25
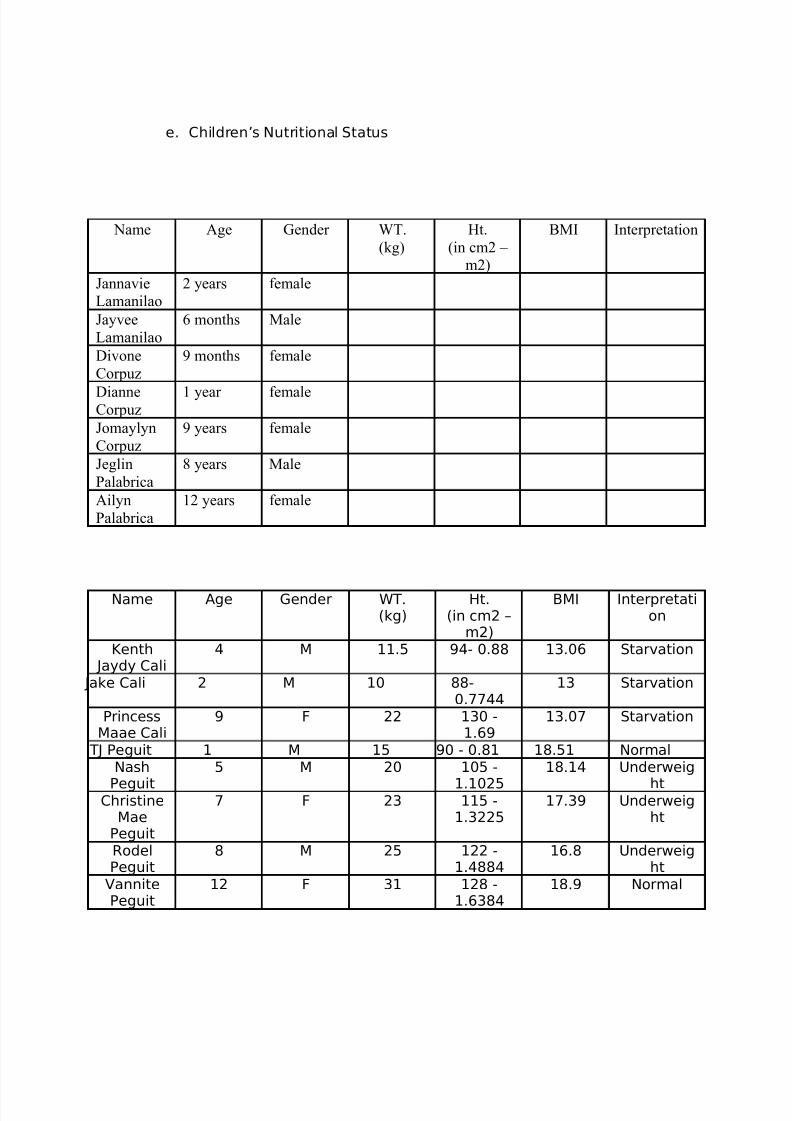
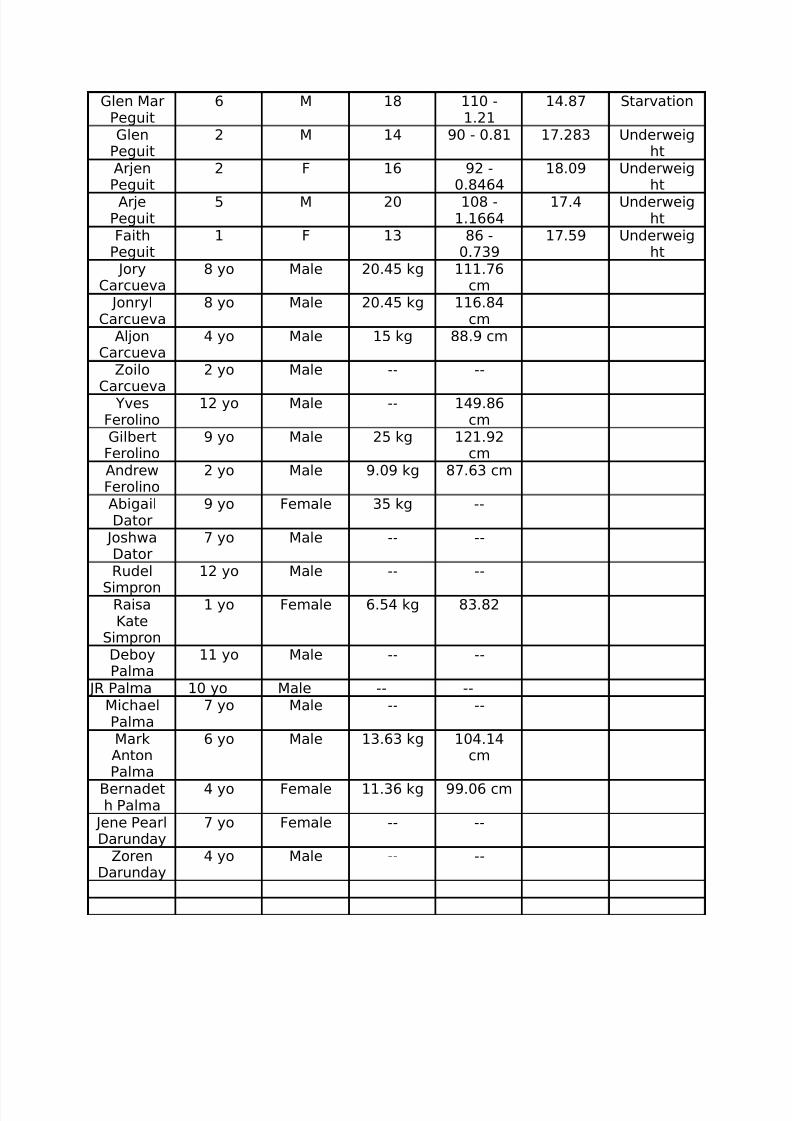
e. Children’s Nutritional Status
Name Age Gender WT.
(kg)
Ht.
(in cm2 – m2)
BMI Interpretation
JannavieLamanilao
2 years female
Jayvee
Lamanilao
6 months Male
Divone
Corpuz
9 months female
DianneCorpuz
1 year female
Jomaylyn
Corpuz
9 years female
Jeglin
Palabrica
8 years Male
Ailyn
Palabrica
12 years female
Name Age Gender WT.(kg)
Ht.(in cm2 –
m2)
BMI Interpretation
Kenth Jaydy Cali
4 M 11.5 94- 0.88 13.06 Starvation
Jake Cali 2 M 10 88-0.7744
13 Starvation
PrincessMaae Cali
9 F 22 130 -1.69
13.07 Starvation
TJ Peguit 1 M 15 90 - 0.81 18.51 NormalNash
Peguit
5 M 20 105 -
1.1025
18.14 Underweig
htChristine
MaePeguit
7 F 23 115 -1.3225
17.39 Underweight
RodelPeguit
8 M 25 122 -1.4884
16.8 Underweight
VannitePeguit
12 F 31 128 -1.6384
18.9 Normal
8/8/2019 Copar Edited With Charts
http://slidepdf.com/reader/full/copar-edited-with-charts 23/25
Glen MarPeguit
6 M 18 110 -1.21
14.87 Starvation
GlenPeguit
2 M 14 90 - 0.81 17.283 Underweight
ArjenPeguit
2 F 16 92 -0.8464
18.09 Underweight
ArjePeguit
5 M 20 108 -1.1664
17.4 Underweight
FaithPeguit
1 F 13 86 -0.739
17.59 Underweight
JoryCarcueva
8 yo Male 20.45 kg 111.76cm
JonrylCarcueva
8 yo Male 20.45 kg 116.84cm
AljonCarcueva
4 yo Male 15 kg 88.9 cm
Zoilo
Carcueva
2 yo Male -- --
YvesFerolino
12 yo Male -- 149.86cm
GilbertFerolino
9 yo Male 25 kg 121.92cm
AndrewFerolino
2 yo Male 9.09 kg 87.63 cm
AbigailDator
9 yo Female 35 kg --
JoshwaDator
7 yo Male -- --
Rudel
Simpron
12 yo Male -- --
RaisaKate
Simpron
1 yo Female 6.54 kg 83.82
DeboyPalma
11 yo Male -- --
JR Palma 10 yo Male -- --MichaelPalma
7 yo Male -- --
MarkAntonPalma
6 yo Male 13.63 kg 104.14cm
Bernadeth Palma
4 yo Female 11.36 kg 99.06 cm
Jene PearlDarunday
7 yo Female -- --
ZorenDarunday
4 yo Male -- --
8/8/2019 Copar Edited With Charts
http://slidepdf.com/reader/full/copar-edited-with-charts 24/25
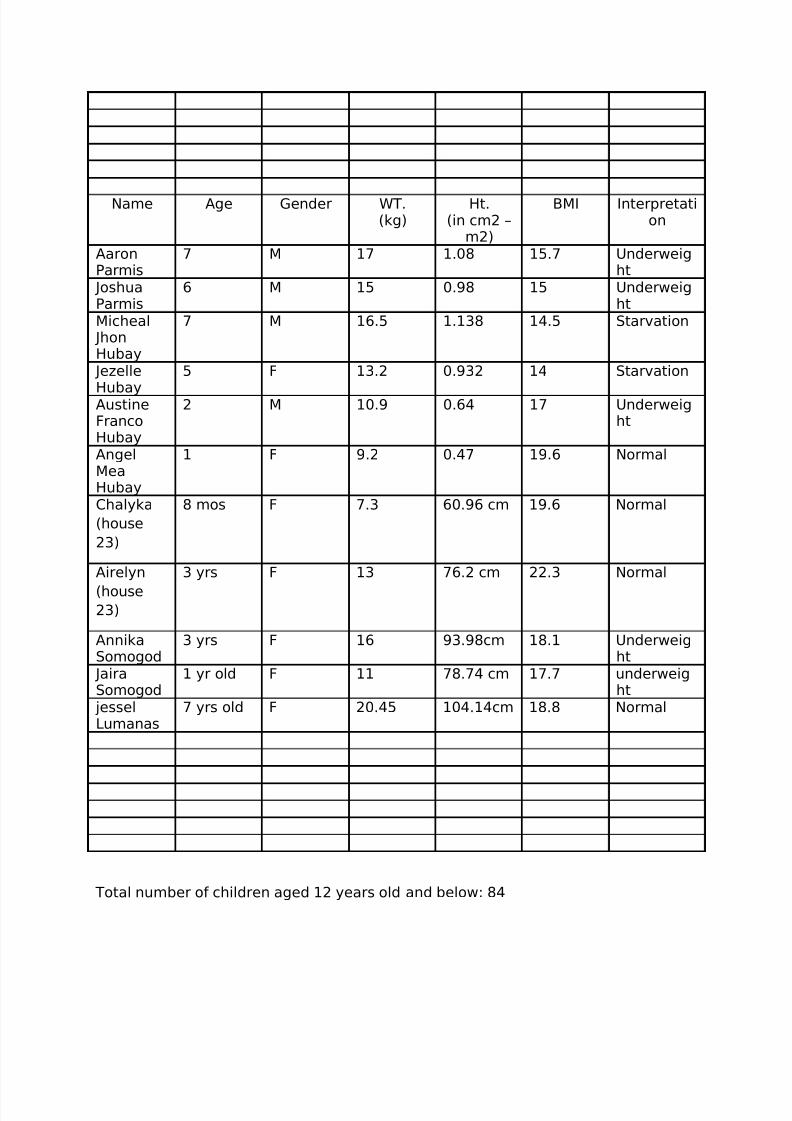
Name Age Gender WT.(kg)
Ht.(in cm2 –
m2)
BMI Interpretation
AaronParmis
7 M 17 1.08 15.7 Underweight
JoshuaParmis
6 M 15 0.98 15 Underweight
Micheal JhonHubay
7 M 16.5 1.138 14.5 Starvation
Jezelle
Hubay
5 F 13.2 0.932 14 Starvation
AustineFrancoHubay
2 M 10.9 0.64 17 Underweight
AngelMeaHubay
1 F 9.2 0.47 19.6 Normal
Chalyka
(house
23)
8 mos F 7.3 60.96 cm 19.6 Normal
Airelyn
(house23)
3 yrs F 13 76.2 cm 22.3 Normal
AnnikaSomogod
3 yrs F 16 93.98cm 18.1 Underweight
JairaSomogod
1 yr old F 11 78.74 cm 17.7 underweight
jesselLumanas
7 yrs old F 20.45 104.14cm 18.8 Normal
Total number of children aged 12 years old and below: 84
8/8/2019 Copar Edited With Charts
http://slidepdf.com/reader/full/copar-edited-with-charts 25/25
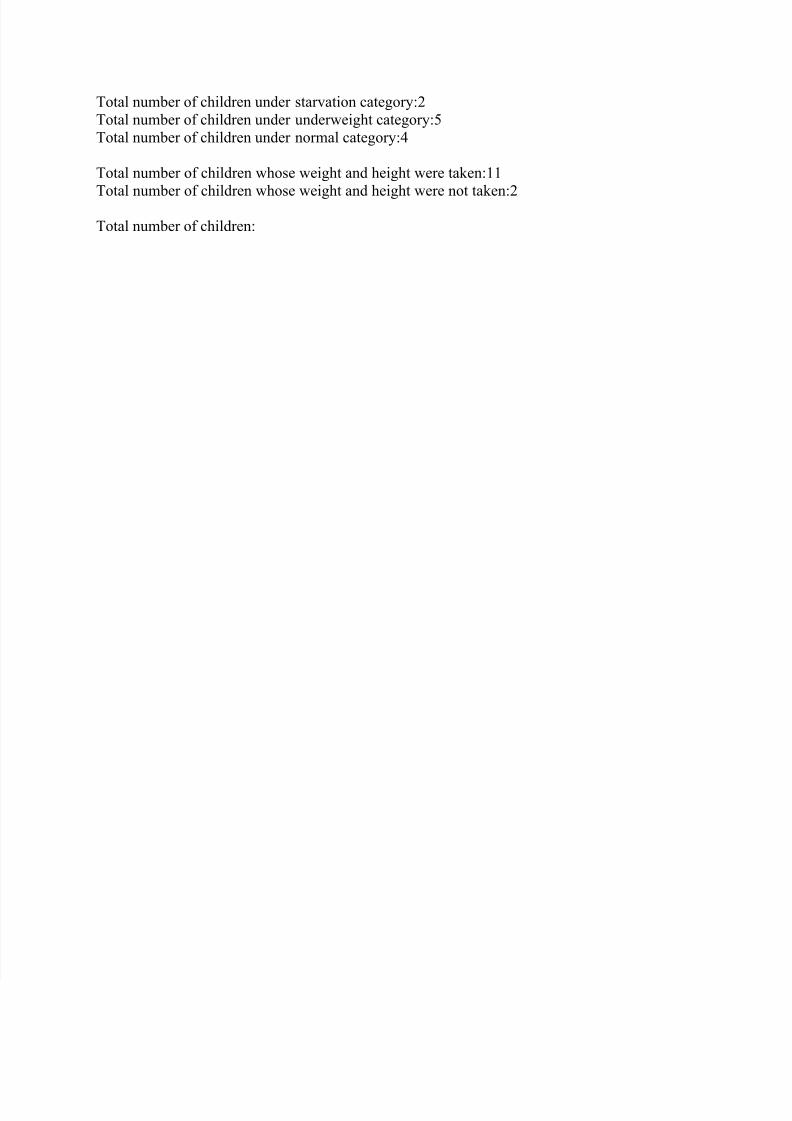
Total number of children under starvation category:2
Total number of children under underweight category:5
Total number of children under normal category:4
Total number of children whose weight and height were taken:11
Total number of children whose weight and height were not taken:2
Total number of children: