Embed Size (px)
Citation preview
CoP6 bis Outcomes Clinic
Implications for the Global Carbon Market
July 30, 2001World Bank
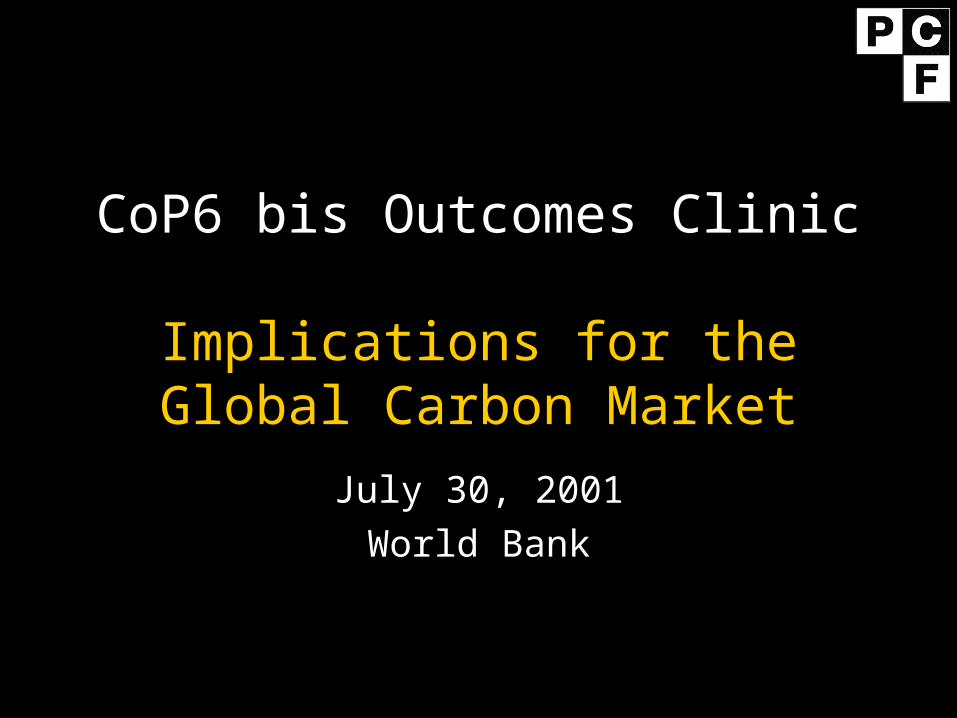
Public Sector (6)
Governments of Netherlands, Finland, Sweden, Norway, Canada, and Japan Bank for International Cooperation
Private Sector: (17)
RWE - Germany, Gaz de France, Tokyo Electric Power, Deutsche Bank, Chubu Electric, Chugoku Electric, Kyushu Electric, Shikoku Electric, Tohoku Electric, Mitsui, Mitsubishi, Electrabel, NorskHydro- Norway, Statoil -Norway, BP-Amoco, Fortum, RaboBank, NL
PCF Subscribers ($145 million)
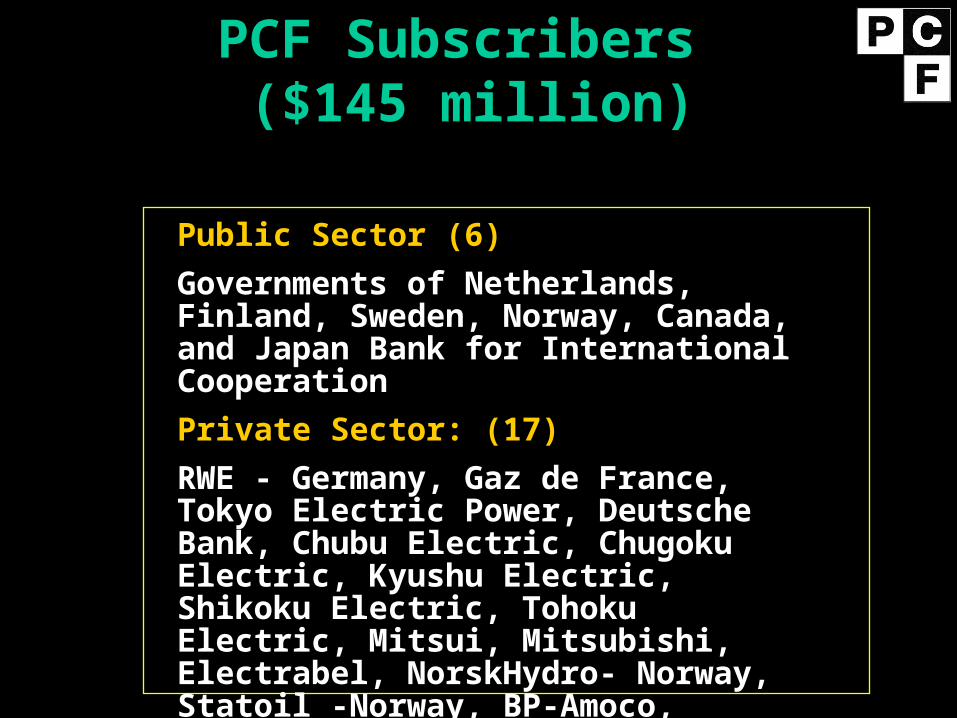
Host Country Committee
Joined (through MoU or Project Endorsement)
Latin America (13)Argentina, Brazil, Chile, Colombia, Costa Rica, El Salvador, Guatemala, Guyana, Honduras, Mexico, Nicaragua, Peru, Uruguay
Africa (9)Benin, Burkina Faso, Ghana, Kenya, Morocco, Senegal, Swaziland, Uganda, Togo, Zimbabwe
Eastern Europe/ C Asia (7)Bulgaria, Czech R., Hungary, Kazakhstan, Latvia, Poland, Romania
ConsideringBhutan, Belarus, Egypt, Sri Lanka, Thailand
Asia (1)India
Key Demonstration Effects
… that investments under CDM/JI can:• Earn export revenue for Developing
Countries/Transition Economies engaging in the new ER commodity trade
• Increase the profitability of cleaner more efficient technology in energy, industry, and transport sectors
• Contribute to sustainable development … and how private sector and governments can implement the CDM/JI project cycle and compete in emerging carbon market
PCF Status and Focus
Deal flow far exceeds funding - several carbon contracts now under negotiation
� >50 deals with $350m+ carbon purchases under review
� Targeting signed Emissions Reductions Purchase Agreements (ERPAs)� by end 2001 15 deals of $45-50mm in Chile,
Costa Rica, Nicaragua, Brazil, India, Uganda, Romania, Morocco
� by July 2002 ~$35mm in Guatemala, Argentina, Honduras, Thailand, El Salvador, Belarus, Nicaragua, Czech;
� Under review or on hold for FY02 ~$40mm: China, Kazakhastan, Belarus, Guyana, Hungary, Poland
� Constraints: FMU and country capacity, quality of asset

$0t/Co2
$1t/Co2
$2t/Co2
$3t/Co2
$4t/Co2
$5t/Co2
$6t/Co2
$7t/Co2
$8t/Co2
$0/tC
$5/tC
$10/tC
$15/tC
$20/tC
$25/tC
Options
Non verified ERs
Third-Party verified
Verified and Kyoto compatible
Government approved
permits
Carbon prices on past transactions
Based on data provided by Natsource for the PCF, June 2001.

Early developments of the market 1997 to 2001
• Partial information available.
• Within OECD and EITs: 40-60 MtCO2e have been transacted.
• In developing countries: Less activity but growing. Mostly government funded, but private activity growing.
• General trend towards sophistication: buyers clubs (PCF), traders, financial derivatives (options), integrated marketplaces, etc.

Demand and supply under Kyoto scenarios
Total Annex Bdemand for ERs
Domestic carbon sinks
Hot Air financial flow to Russia and EE
Action within OECDRemainder Russia and EE (trading and JI)
Developing countries (CDM)
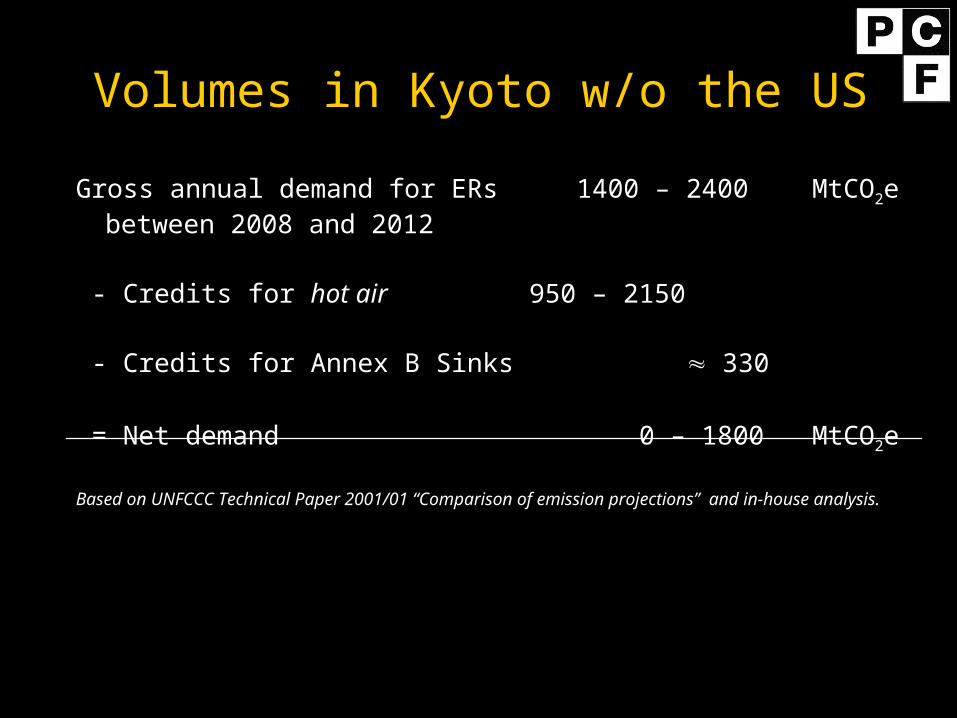
Volumes in Kyoto w/o the US
Gross annual demand for ERs 1400 – 2400 MtCO2ebetween 2008 and 2012
- Credits for hot air 950 – 2150
- Credits for Annex B Sinks 330
= Net demand 0 – 1800 MtCO2e
Based on UNFCCC Technical Paper 2001/01 “Comparison of emission projections” and in-house analysis.
Carbon Market Impact
• Hot Air and new Annex I Sinks Allowances depresses CDM/JI market– W/o US, up to 100% of OECD needs may be
met by Hot Air+sinks.
• Both CDM/JI “project-based” Market and “Hot –Air” (emissions trading) market will be “policy-driven”– Hot Air may be cheap but politically
unpalatable– CDM/JI project-based more expensive and
difficult but high quality and politically acceptable

Prices in Post CoP6 World
• With full competition, market analysis suggests:
– CDM trades down to $0-7/tCO2;
– lower range of $0-4/tCO2 more likely– PCF pays $3-4/tCO2
• Non-KP Market drivers are significant: OECD domestic regimes and Corporate Voluntary market
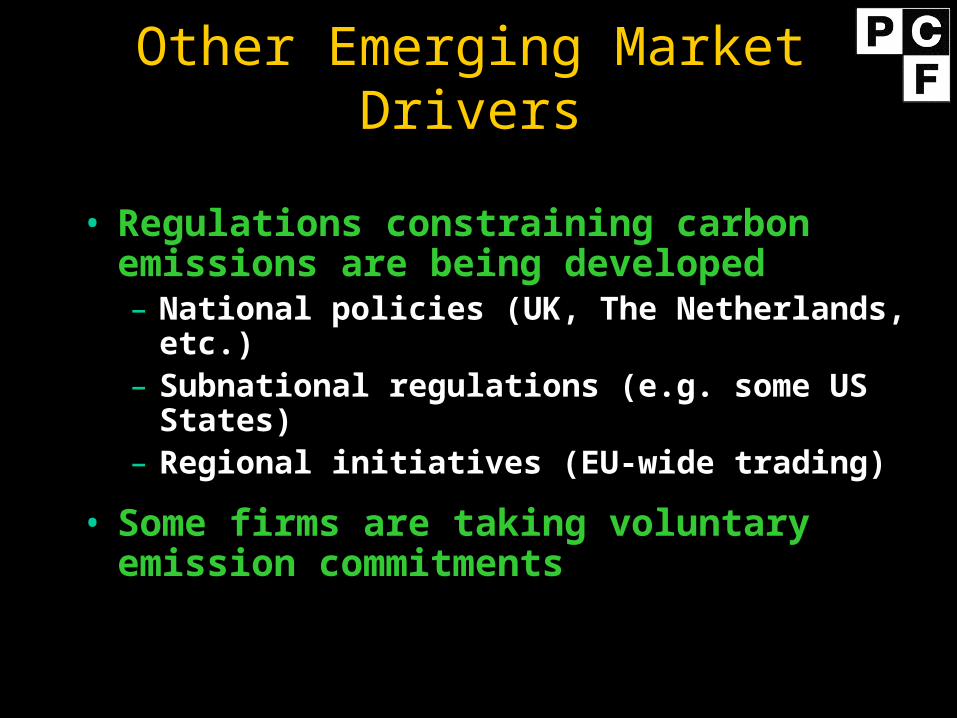
Other Emerging Market Drivers
• Regulations constraining carbon emissions are being developed– National policies (UK, The Netherlands,
etc.)– Subnational regulations (e.g. some US
States)– Regional initiatives (EU-wide trading)
• Some firms are taking voluntary emission commitments

Current or projected national policies
Trading Start-up Project-based mechanism?
EU Yes 2005 At least from 2008UK Yes . 2001 YesFrance Yes 2003? YesNorway Yes 2005 or earlier YesGermany No LaterDenmark Yes 2001 YesSweden Yes 2005 or later YesNetherlands Ongoing work YesFinland Ongoing work YesIreland Ongoing work Ongoing workAustralia Yes US dependent YesUSA Yes ? YesCanada Yes US dependent Japan Ongoing work YesNew Zealand Yes Not decided YesRussia No Yes
Based on Confederation of Norwegian Business and Industry: “Meeting the Kyoto Protocol Commitments, Summary - Domestic Emissions Trading Schemes”, January 2001.
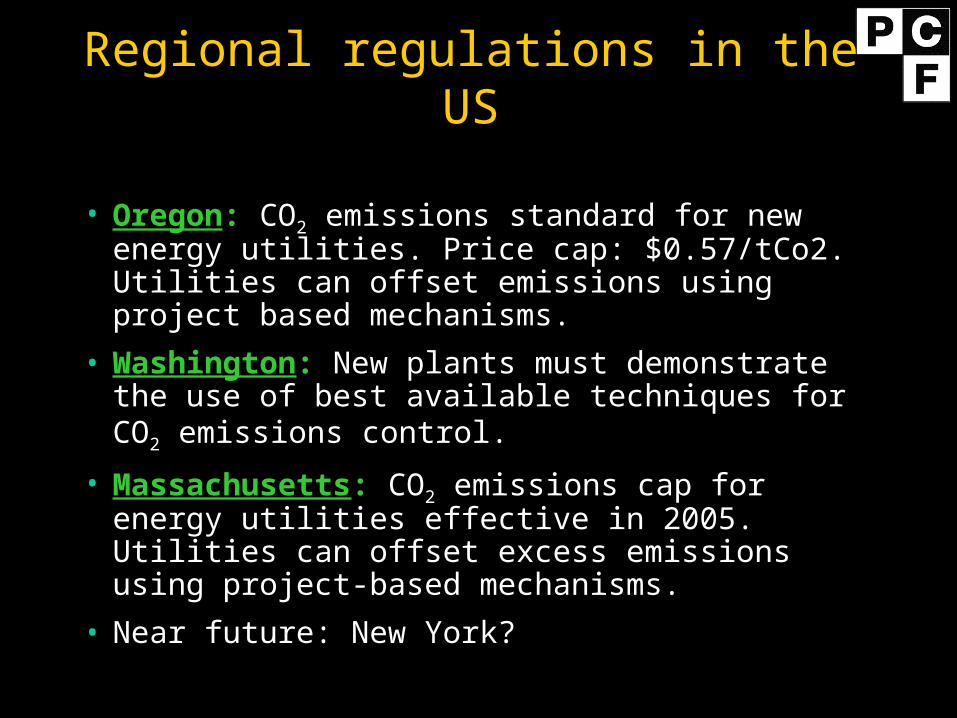
Regional regulations in the US
• Oregon: CO2 emissions standard for new energy utilities. Price cap: $0.57/tCo2. Utilities can offset emissions using project based mechanisms.
• Washington: New plants must demonstrate the use of best available techniques for CO2 emissions control.
• Massachusetts: CO2 emissions cap for energy utilities effective in 2005. Utilities can offset excess emissions using project-based mechanisms.
• Near future: New York?
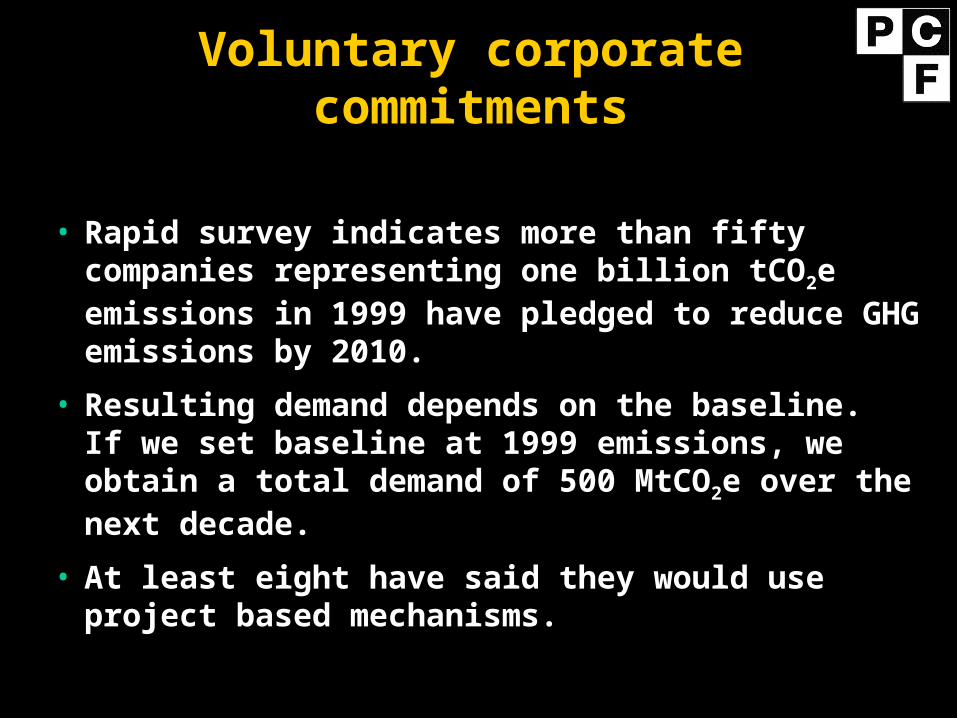
Voluntary corporate commitments
• Rapid survey indicates more than fifty companies representing one billion tCO2e emissions in 1999 have pledged to reduce GHG emissions by 2010.
• Resulting demand depends on the baseline. If we set baseline at 1999 emissions, we obtain a total demand of 500 MtCO2e over the next decade.
• At least eight have said they would use project based mechanisms.
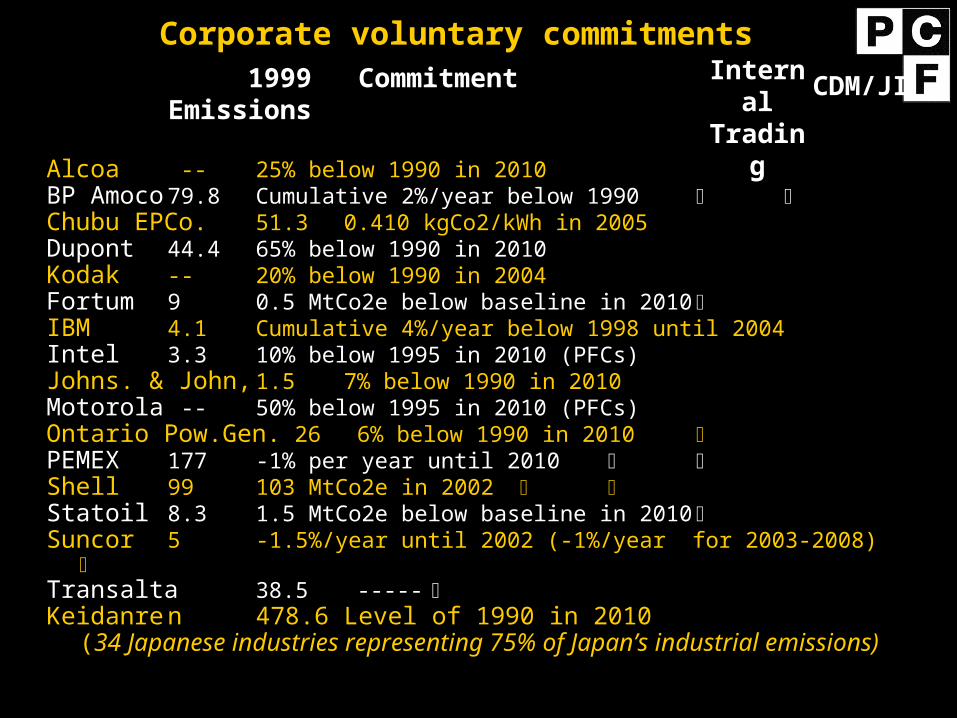
Alcoa -- 25% below 1990 in 2010BP Amoco 79.8 Cumulative 2%/year below 1990 Chubu EPCo. 51.3 0.410 kgCo2/kWh in 2005Dupont 44.4 65% below 1990 in 2010Kodak -- 20% below 1990 in 2004Fortum 9 0.5 MtCo2e below baseline in 2010 IBM 4.1 Cumulative 4%/year below 1998 until 2004
Intel 3.3 10% below 1995 in 2010 (PFCs) Johns. & John, 1.5 7% below 1990 in 2010Motorola -- 50% below 1995 in 2010 (PFCs)Ontario Pow.Gen. 26 6% below 1990 in 2010 PEMEX 177 -1% per year until 2010 Shell 99 103 MtCo2e in 2002 Statoil 8.3 1.5 MtCo2e below baseline in 2010 Suncor 5 -1.5%/year until 2002 (-1%/year for 2003-2008)
Transalta 38.5 ----- Keidanre n 478.6 Level of 1990 in 2010
(34 Japanese industries representing 75% of Japan’s industrial emissions)
1999 Emissions
Commitment Internal Trading
CDM/JI
Corporate voluntary commitments
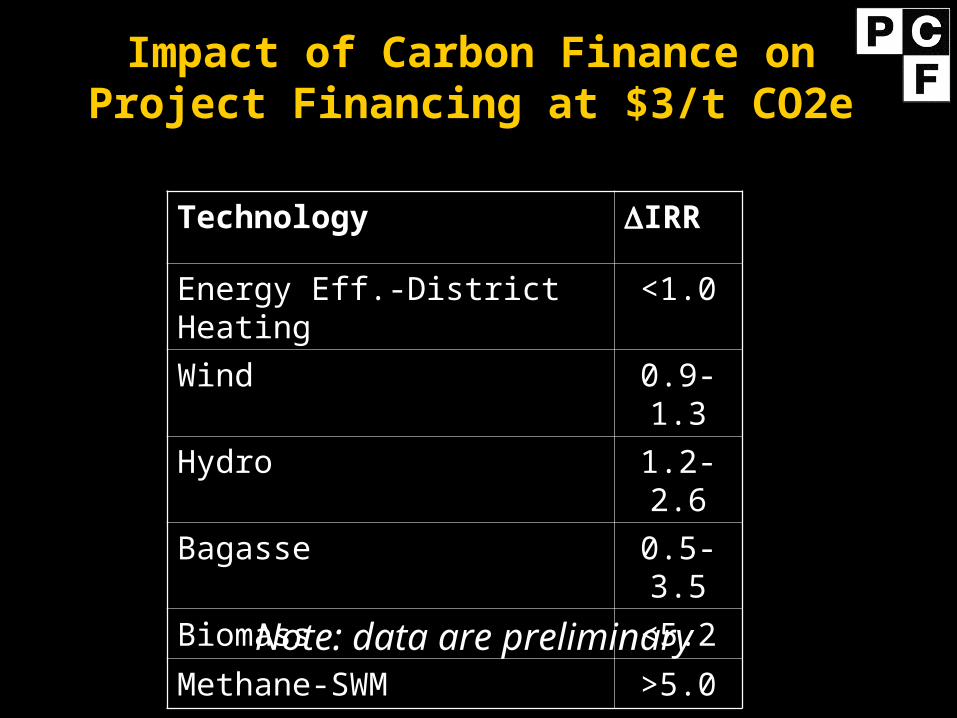
Impact of Carbon Finance on Project Financing at $3/t CO2e
Technology IRR
Energy Eff.-District Heating <1.0
Wind 0.9-1.3
Hydro 1.2-2.6
Bagasse 0.5-3.5
Biomass <5.2
Methane-SWM >5.0
Note: data are preliminary
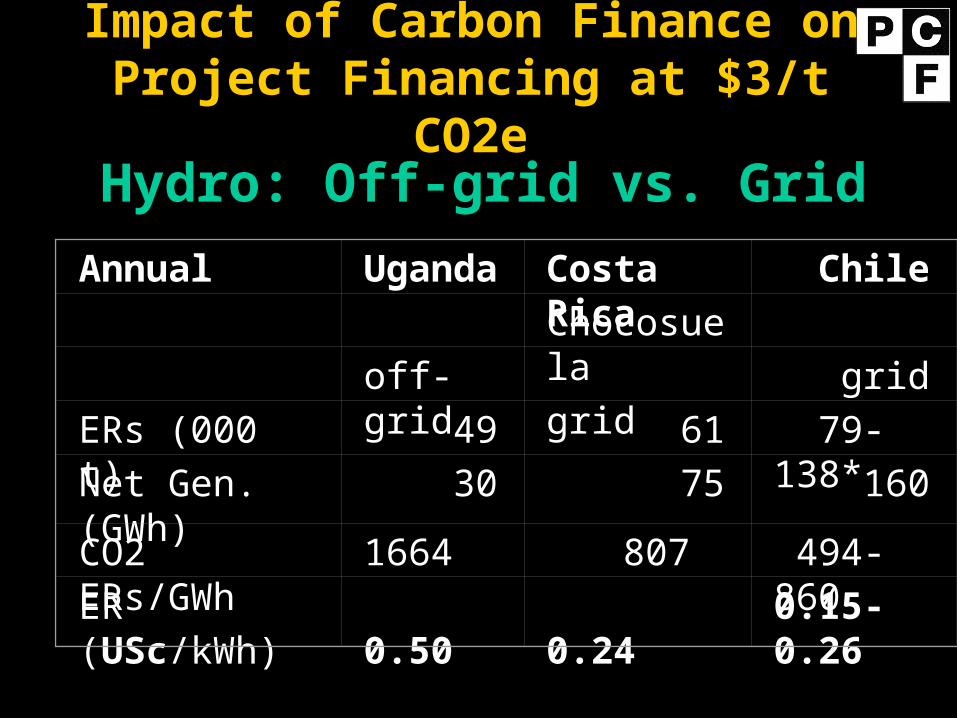
Impact of Carbon Finance on Project Financing at $3/t
CO2e
Annual Uganda Costa Rica Chile
Chocosuela
off-grid grid grid
ERs (000 t) 49 61 79-138*
Net Gen.(GWh) 30 75 160
CO2 ERs/GWh 1664 807 494-860
ER (USc/kWh) 0.50 0.24
* Gas vs.
0.15-0.26
coal BL
Hydro: Off-grid vs. Grid
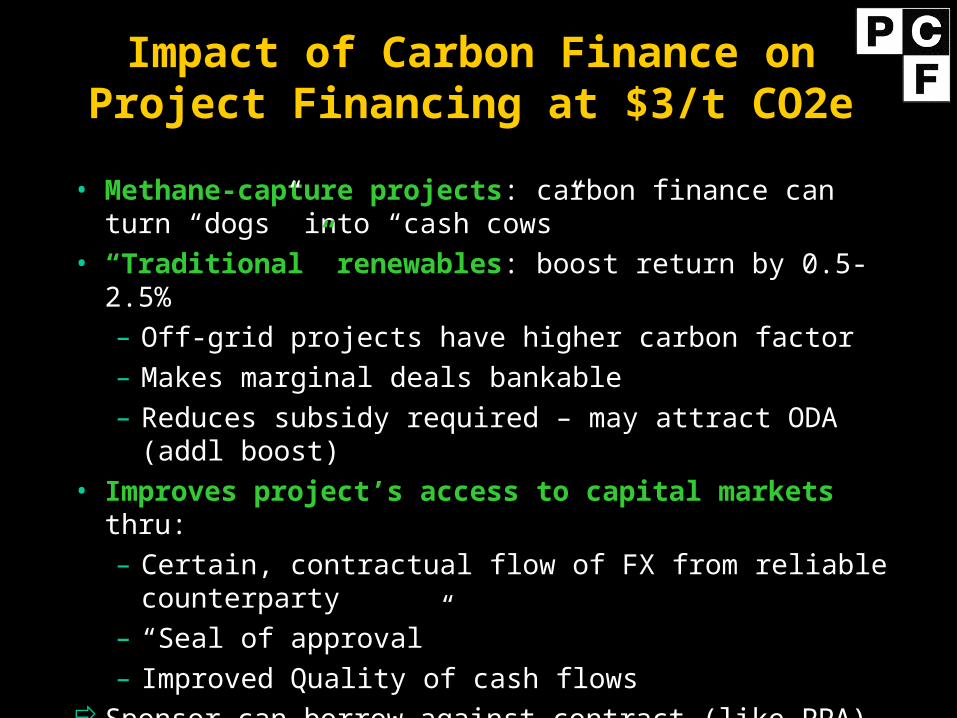
• Methane-capture projects: carbon finance can turn “dogs” into “cash cows”
• “Traditional” renewables: boost return by 0.5-2.5%– Off-grid projects have higher carbon factor– Makes marginal deals bankable– Reduces subsidy required – may attract ODA (addl
boost)• Improves project’s access to capital markets thru:
– Certain, contractual flow of FX from reliable counterparty
– “Seal of approval” – Improved Quality of cash flows
Sponsor can borrow against contract (like PPA)
Impact of Carbon Finance on Project Financing at $3/t CO2e
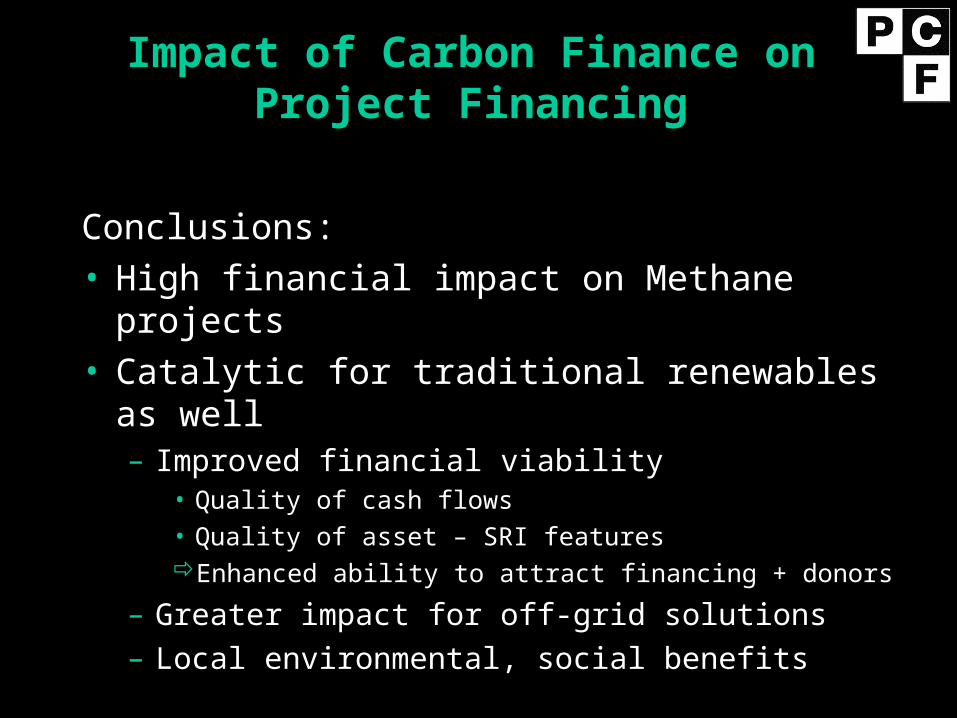
Conclusions:• High financial impact on Methane projects• Catalytic for traditional renewables as well
– Improved financial viability• Quality of cash flows• Quality of asset – SRI featuresEnhanced ability to attract financing + donors
– Greater impact for off-grid solutions– Local environmental, social benefits
Impact of Carbon Finance on Project Financing
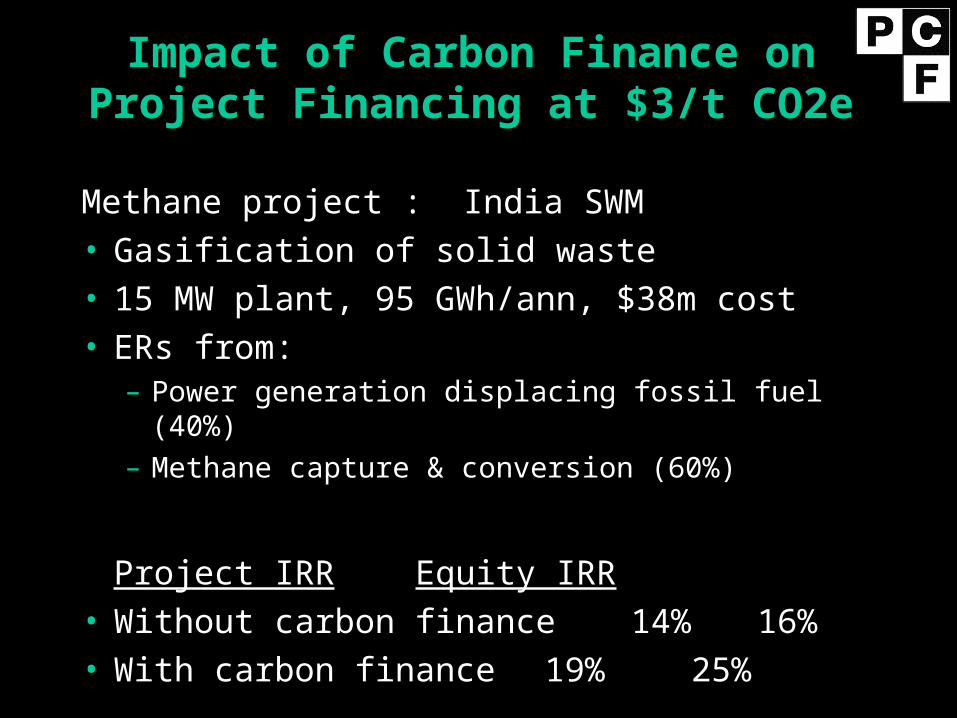
Methane project : India SWM• Gasification of solid waste• 15 MW plant, 95 GWh/ann, $38m cost• ERs from:
– Power generation displacing fossil fuel (40%) – Methane capture & conversion (60%)
Project IRR Equity IRR• Without carbon finance14% 16%• With carbon finance 19% 25%
Impact of Carbon Finance on Project Financing at $3/t CO2e

Impact of Carbon Finance on Project Financing at $3/t CO2e
Country Project Tot. ($m)
ERs ($m)
IRR w/o
IRR w/ER
IRR
Romania DH 37 5.5 10.5 11.4 0.9
Costa Rica Wind 18.6 0.5 9.7 10.6 0.9
Jamaica Wind 26 4 17 18 1.0
Morocco Wind 200 14 12.7 14.0 1.3
Chile Hydro 37 4 9.2 10.4 1.2
Costa Rica Hydro 1.3 0.1 7.1 9.7 2.6
Guyana Bagasse 50 6 7.2 7.7 0.5
Nicaragua Bagasse 3.1 0.3 14.6 18.2 3.6
Brazil Biomass 53 13 8.3 13.5 5.2
Latvia Methane 16 2.5 11.4 18.8 7.4
India Methane 40 8 13.8 18.7 4.9
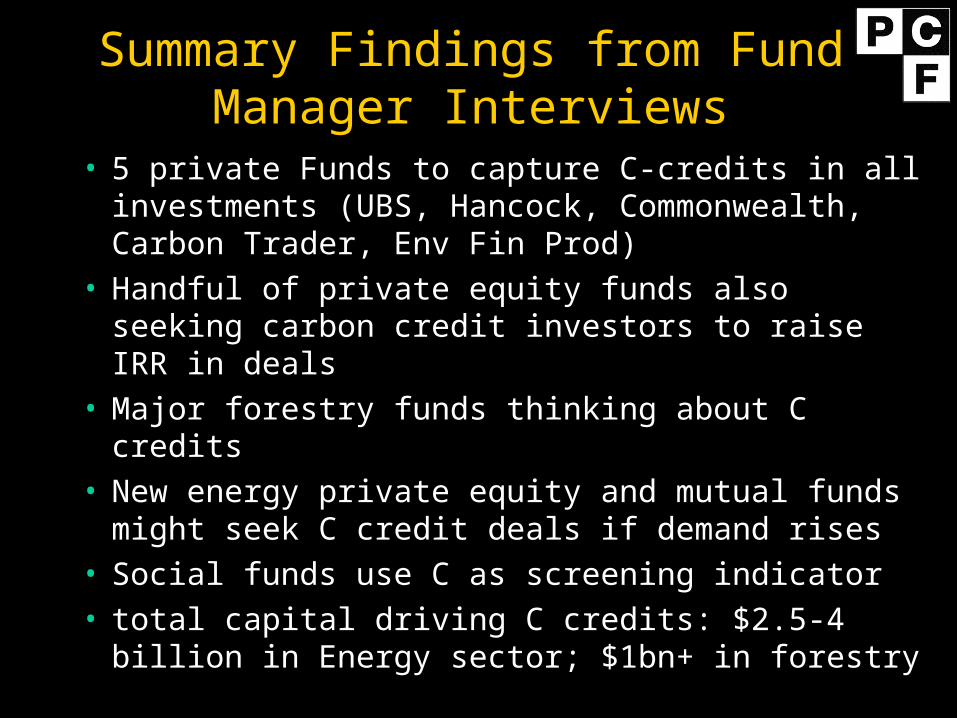
Summary Findings from Fund Manager Interviews
• 5 private Funds to capture C-credits in all investments (UBS, Hancock, Commonwealth, Carbon Trader, Env Fin Prod)
• Handful of private equity funds also seeking carbon credit investors to raise IRR in deals
• Major forestry funds thinking about C credits• New energy private equity and mutual funds
might seek C credit deals if demand rises• Social funds use C as screening indicator• total capital driving C credits: $2.5-4 billion in
Energy sector; $1bn+ in forestry
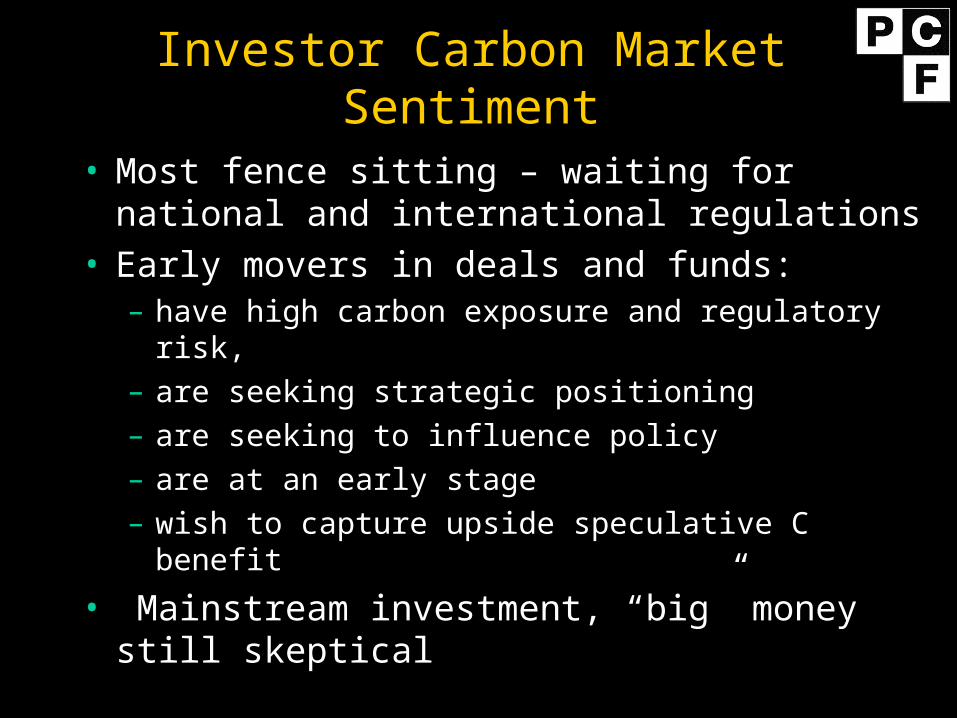
Investor Carbon Market Sentiment
• Most fence sitting – waiting for national and international regulations
• Early movers in deals and funds:– have high carbon exposure and regulatory risk,– are seeking strategic positioning – are seeking to influence policy– are at an early stage– wish to capture upside speculative C benefit
• Mainstream investment, “big” money still skeptical
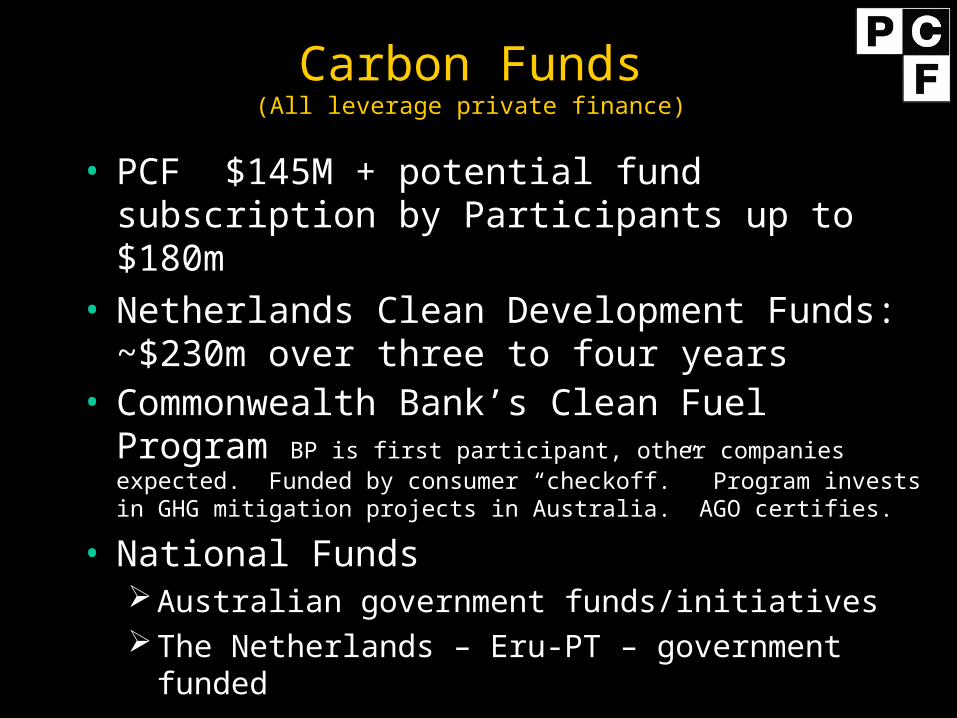
Carbon Funds(All leverage private finance)
• PCF $145M + potential fund subscription by Participants up to $180m
• Netherlands Clean Development Funds: ~$230m over three to four years
• Commonwealth Bank’s Clean Fuel Program BP is first participant, other companies expected. Funded by consumer “checkoff.” Program invests in GHG mitigation projects in Australia. AGO certifies.
• National FundsAustralian government funds/initiatives The Netherlands – Eru-PT – government funded
Typology of Funds/Plays
• Pure Carbon Funds (PCF, National Funds)• Private Equity Funds
Aimed at JI/CDM Projects New Energy, RE, EE Funds with Carbon Credits Forestry Funds with Carbon Credits Energy or Forestry Funds that Could Add Carbon Credits
• Mutual Funds with % in Private Equity• NGO Funds• Sustainability, Social, Ethical Mutual funds• Corporate “Funds” Earmarked for Carbon
Credit Investment


![Tris(ethylenediammonium) bis[(2-aminoethyl)ammonium] bis ...journals.iucr.org/e/issues/2010/05/00/wm2326/wm2326.pdf · Tris(ethylenediammonium) bis[(2-amino-ethyl)ammonium] bis[bis(l](https://img.pdfslide.us/doc/110x75/5e49e7fe0e042522d772f14a/trisethylenediammonium-bis2-aminoethylammonium-bis-trisethylenediammonium.jpg)