Embed Size (px)
Citation preview
CoP16 Inf. 32 (English only / Únicamente en inglés / Seulement en anglais)
CONVENTION ON INTERNATIONAL TRADE IN ENDANGERED SPECIES OF WILD FAUNA AND FLORA
____________________
Sixteenth meeting of the Conference of the Parties Bangkok (Thailand), 3-14 March 2013
CITES TRADE: RECENT TRENDS IN INTERNATIONAL TRADE IN APPENDIX II-LISTED SPECIES (1996-2010)
The attached document* has been submitted by the Secretariat in relation to agenda item 21 on Capacity building.
* The geographical designations employed in this document do not imply the expression of any opinion whatsoever on the part of the
CITES Secretariat or the United Nations Environment Programme concerning the legal status of any country, territory, or area, or concerning the delimitation of its frontiers or boundaries. The responsibility for the contents of the document rests exclusively with its author.
CoP16 Inf. 32 – p. 1
CITES Trade: recent trends in international trade in Appendix II‐listed species (1996‐2010)
CITES Project No. S‐383
Prepared for the CITES Secretariat
by
United Nations Environment Programme World Conservation Monitoring Centre
December 2012
PREPARED FOR CITES Secretariat, Geneva, Switzerland. This report was made possible as a result of the generous financial support by the European Commission. This publication may be reproduced for educational or non‐profit purposes without special permission, provided acknowledgement to the source is made. Reuse of any figures is subject to permission from the original rights holders. No use of this publication may be made for resale or any other commercial purpose without permission in writing from CITES. Applications for permission, with a statement of purpose and extent of reproduction, should be sent to the CITES Secretary General. The contents of this report do not necessarily reflect the views or policies of UNEP, CITES, the CITES Secretariat, or contributory organisations. The designations employed and the presentations of material do not imply the expressions of any opinion whatsoever on the part of UNEP, CITES, the CITES Secretariat, or contributory organisations concerning the legal status of any country, territory, city area or its authorities, or concerning the delimitation of its frontiers or boundaries or the designation of its name, frontiers or boundaries. The mention of a commercial entity or product in this publication does not imply endorsement by UNEP.
ABOUT UNEP‐WORLD CONSERVATION MONITORING CENTRE The United Nations Environment Programme World Conservation Monitoring Centre (UNEP‐WCMC) is the specialist biodiversity assessment centre of the United Nations Environment Programme (UNEP), the world’s foremost intergovernmental environmental organisation. The Centre has been in operation for over 30 years, combining scientific research with practical policy advice.
CITATION CITES Secretariat (2012). CITES Trade: recent trends
in international trade in Appendix II‐listed species
(1996‐2010). Prepared by UNEP‐WCMC, Cambridge.
© Copyright: 2012, CITES Secretariat
UNEP World Conservation Monitoring Centre
219 Huntingdon Road,Cambridge,CB3 0DL United Kingdom Tel: +44 (0) 1223 277314 Fax: +44 (0) 1223 277136 Email: species@unep‐wcmc.org Website: www.unep‐wcmc.org
Contents
Foreword ..........................................................................................................................................1
Key findings .....................................................................................................................................1
Introduction.....................................................................................................................................1
Snapshot: wildlife trade and sustainable development ................................................................1
VALUE OF CITES TRADE ...................................................................................................................................... 4
Methodology ................................................................................................................................... 7
Trade sections ................................................................................................................................. 7
Valuation methodology..................................................................................................................9
Trade trends in major taxa............................................................................................................ 11
MAMMALS ...........................................................................................................................................................11 BIRDS ................................................................................................................................................................. 14 REPTILES.............................................................................................................................................................16 AMPHIBIANS .......................................................................................................................................................19 FISH ................................................................................................................................................................... 21 INVERTEBRATES ................................................................................................................................................. 23 PLANTS.............................................................................................................................................................. 28
Annex 1: Reporting obligations..................................................................................................... 31
Annex 2: Using CITES trade data...................................................................................................32
Foreword
The Convention on International Trade in Endangered Species of Wild Fauna and Flora (CITES) is often described as conservation and sustainable use in action.
While the early foundations for such a global instrument can be traced back to IUCN resolutions from the early 1960’s, the final impetus for a convention came from Recommendation 99 of the Action Plan for the Human Environment adopted in Stockholm in 1972 at the United Nations Conference on the Human Environment. This recommendation included a call for the preparation and adoption of a global treaty to regulate international trade in certain species of wild plants and animals and CITES was adopted the following year at the ‘World Wildlife Conference’ in Washington D.C.
Forty years later at the United Nations Conference on Sustainable Development (Rio+20), governments placed CITES among the 283 paragraphs of final outcome document of the meeting, The Future We Want, to indicate the Convention’s continuing relevance to the conservation and sustainable use of biodiversity and to sustainable development. Paragraph of the document 203 reads:
We recognize the important role of the Convention on International Trade in Endangered Species of Wild Fauna and Flora, an international agreement that stands at the intersection between trade, the environment and development, promotes the conservation and sustainable use of biodiversity, should contribute to tangible benefits for local people, and ensures that no species entering into international trade is threatened with extinction. We recognize the economic, social and environmental impacts of illicit trafficking in wildlife, where firm and strengthened action needs to be taken on both the supply and demand sides. In this regard, we emphasize the importance of effective international cooperation among relevant multilateral environmental agreements and international organizations. We further stress the importance of basing the listing of species on agreed criteria.
CITES is unique among many biodiversity multilateral environmental agreements (MEAs) in that it produces primary data that may be used to develop early warning indicators of unsustainable levels of international trade in species. The CITES trade data, currently holds details of 12,000,000 trade transactions. It is growing by over 850,000 records a year and it provides a basis for monitoring the effective implementation of CITES, including through the Review of Significant Trade.
It is within the context of the conservation and sustainable use of biodiversity that the CITES Secretariat commissioned the report on CITES Trade: recent trends in international trade in Appendix II‐listed species (1996‐2010). This report is based on CITES trade data, and will be the first of a number of publications planned to assist Parties gain access to the knowledge needed to manage wildlife trade sustainably.
The report aims to improve understanding of how CITES can help to ensure that the use of wildlife is sustainable and how it can contribute tangible benefits for local people.
The Secretariat is most grateful to the European Commission for the generous funding that made the publication of this Report possible.
John E. Scanlon
Secretary‐General
1
Key findings
This report provides an analysis of trends (1996‐2010) in international trade in species included in Appendix II of the Convention on International Trade in Endangered Species of Wild Fauna (CITES).
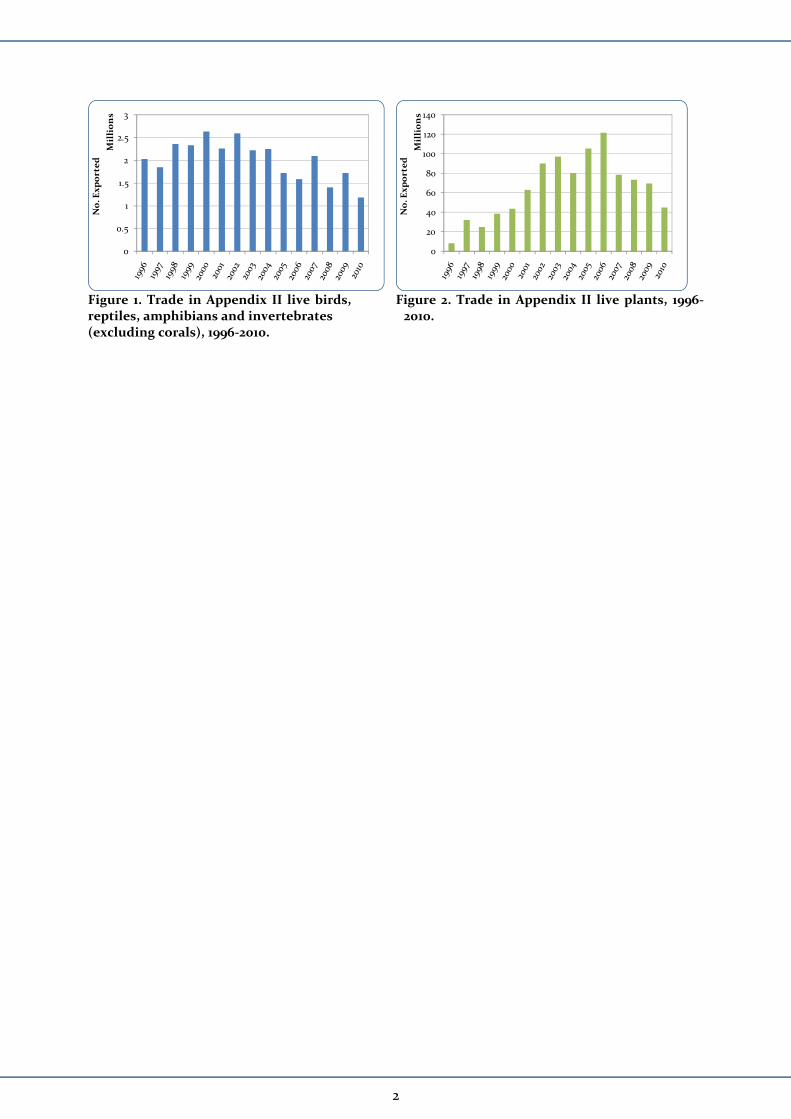
Overall volumes of trade in CITES Appendix II live animals and plants peaked in 2000 and 2006, respectively (Figures 1 and 2) with a decline seen since then. The decrease in 2009‐2010 reflects delays in reporting of trade data and, potentially, global market factors.
A notable decrease in reported trade in caviar is evident with volumes traded in 2005‐2010 substantially lower than volumes in trade prior to that. Trade in Appendix II timber species has increased since 2003, coinciding with new listings of timber species in CITES Appendix II, as has trade in mammal skins particularly in the years 2006‐2008.
For many taxonomic groups there was a notable increase in the number of captive‐produced or ranched specimens in trade with a decrease in the number of wild specimens.
Of the almost 34,000 species listed in CITES Appendix II (representing over 96% of all CITES‐listed species), the majority of the trade in the key terms analysed in this report is accounted for by a relatively small number of taxa.
Through the mechanisms it puts in place to support a sustainable trade, CITES plays an important role in achieving sustainable development.
Using a preliminary methodology based on species specific price data reported to customs in the United States of America, the value of commercial trade in major trade terms (live birds, amphibians, reptiles and invertebrates together with reptile and mammal skins and mammal hunting trophies and skulls, tusks and bodies) for CITES‐listed Appendix II animals is estimated to range between USD 350‐530 million per year, giving a total value of almost USD 2.2 billion for the years 2006‐2010. Reptiles (live and skins) accounted for 61% of the value of this trade.
The total value of CITES trade is likely to be much higher if more comprehensive price data can be accessed for the full range of animal commodities (including for example, high value products such as caviar extract). Total value would be further increased where price data can be obtained for CITES trade which is primarily non‐commercial (such as zoological or biomedical purposes) which may still have an economic value, and pre‐Convention items, along with data for plants and Appendix I and III animals. Furthermore a recent study on the snake skin trade has shown that in the case of finished goods, up to 96% of the value of the trade can be delivered post‐import and factors such as this could substantially increase the value of the legal trade in CITES species.
Submission of CITES annual reports by the deadline was variable. For the years 2006‐2009, 40‐50% of reports were submitted on time, with 63% submitted within six months of the deadline. Where annual report submission is late, detection of key patterns of trade may be constrained and appropriate data may not be available for key CITES processes such as the Review of Significant Trade and the formulation of non‐detriment findings. In some cases (e.g. plants) reporting of the trade at the higher taxonomic level was common. Other reporting issues included deviations from recommended terms, use of synonyms, and misspellings.
1
0
0.5
1
1.5
2
2.5
3
No. E
xported
Millions
0
20
40
60
80
100
120
140
No. E
xported
Millions
Figure 1. Trade in Appendix II live birds, Figure 2. Trade in Appendix II live plants, 1996‐reptiles, amphibians and invertebrates 2010. (excluding corals), 1996‐2010.
2
Introduction
This report provides an analysis of recent trends in international trade in species included in Appendix II of the Convention on International Trade in Endangered Species of Wild Fauna (CITES). The aim is to enable the CITES community to improve its understanding of the global trends in international wildlife trade and to support improved implementation of the Convention. The role that CITES can play to support sustainable development is also discussed along with a preliminary assessment of the monetary value of trade in CITES Appendix II animal species. Further details on the methodology used and associated caveats in the trade analysis and value‐related calculations can be found in the methodology section.
CITES is an international agreement between States that aims to ensure that international trade in specimens of wild animals and plants does not threaten their survival. CITES affords varying degrees of protection to close to 35,000 species of animals and plants. The trade in these species is diverse, ranging from reptile leather to medicinal plants, and it operates at various scales, from large commercial enterprises to small‐scale traders.
Every year, Parties to CITES are required to submit reports (known as CITES annual reports) detailing their trade in CITES‐listed species. These data are entered into the CITES Trade Database, managed for the CITES Secretariat by UNEP‐WCMC. The CITES Trade Database provides a unique resource of over 12 million trade records, (growing by approximately 850,000 trade records per year) representing the entire reported trade in CITES‐listed species for almost 40 years.
CITES trade data provide the basis for monitoring the implementation of the Convention and are used to inform many key CITES processes such as making non‐detriment findings, reviewing trade levels to ensure sustainable use of species (e.g. the CITES ‘Review of Significant Trade’), quota management, assessment of compliance and reviewing the appropriateness of species listed in the Appendices.
Data used in this report cover trade in Appendix II species over the period 1996‐2010. The trade data used were taken from the CITES Trade Database on 29 February 2012, and key trade terms only were selected.
The status of the species according to the IUCN Red List of Threatened Species has been included in the report for background information. The status of species in the IUCN Red List is evaluated by taxonomic experts and reviewers using the IUCN Red List Categories and Criteria (http://www.iucnredlist.org/technical‐documents/categories‐and‐criteria). While the Red List can provide a useful indication of the status of species, it should be noted that the assessments are carried out at a global scale and therefore are not necessarily a reflection of the status of national populations. Furthermore the categories should not be interpreted as having a legally binding status.
CITES and Non‐detriment findings
All CITES Parties must ensure that their trade in CITES‐listed species is sustainable. In order to achieve this Parties undertake a “non‐detriment finding” or a sustainability assessment on whether the export of a particular species will impact negatively on the survival of that species in the wild.
A non‐detriment finding is essentially a science‐based risk assessment. It should consider a range of information including: population status; distribution; population trends; harvest; other biological and ecological factors; and trade information.
Analysis of trade data can help to identify noteworthy patterns of trade and be an important part of a risk assessment. Trade data can obtained from the CITES Trade database (see Annex 4 for more information).
3
Snapshot: wildlife trade and sustainable development
What is sustainable development?
According to Our Common Future, also known as the Brundtland Report1: "Sustainable development is development that meets the needs of the present without compromising the ability of future generations to meet their own needs. It contains within it two key concepts:
the concept of needs, in particular the essential needs of the world's poor, to which overriding priority should be given; and
the idea of limitations imposed by the state of technology and social organization on the environment's ability to meet present and future needs."
1World Commission on Environment and Development (WCED). Our common future. Oxford: OUP1987
The international trade in wildlife is a global industry that supports the livelihoods of people around the world. When managed sustainably, the trade can provide incentives for species and habitat conservation; it can be a direct source of income through harvest and sale of animals and plants, and an indirect source of income through the multiple industries that it supports e.g. tourism, manufacturing etc.
Governments are increasingly moving towards improved management of natural resources with mounting recognition of the multiple services and benefits provided to humans by species and ecosystems. Through the mechanisms it puts in
place to support sustainable trade, CITES can play an important role in supporting sustainable development1. Currently close to 35,000 species of animals and plants are listed in the CITES appendices.
0
100
200
300
400
500
600
2006 2007 2008 2009 2010
Value (US$)
Millions
Amphibians
Invertebrates
Fish
Birds
Mammals
Reptiles
Value of CITES trade
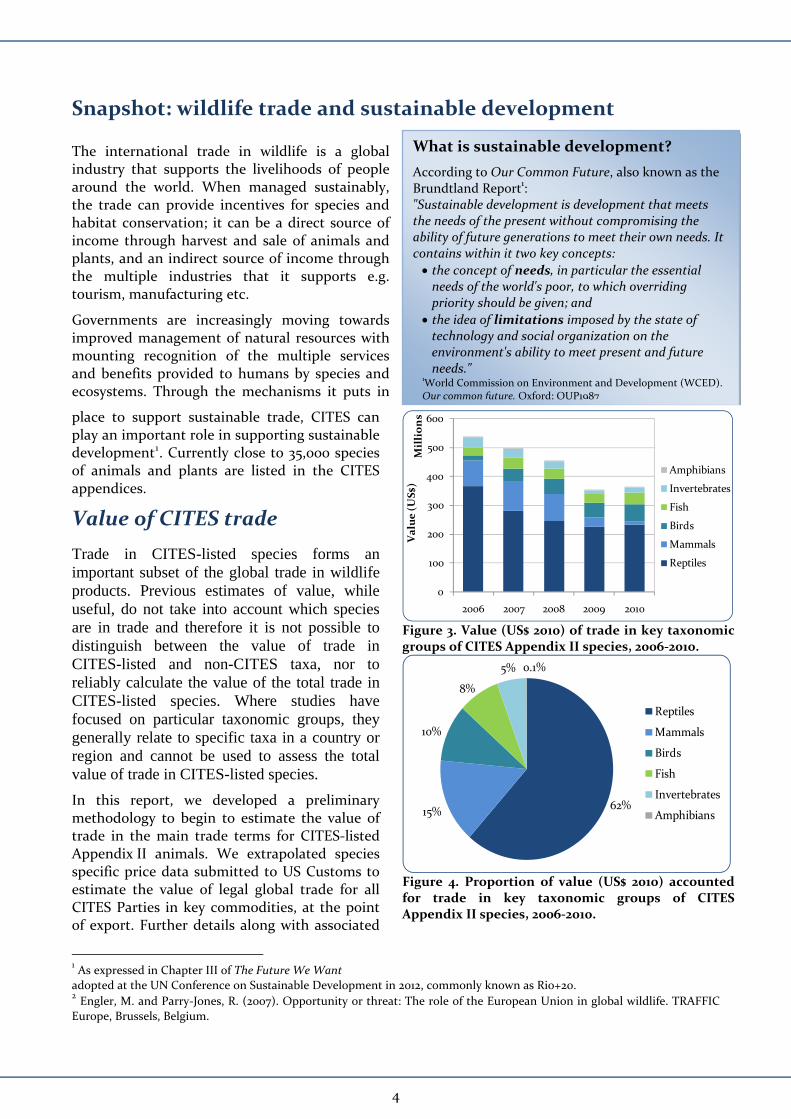
Trade in CITES-listed species forms an important subset of the global trade in wildlife products. Previous estimates of value, while useful, do not take into account which species are in trade and therefore it is not possible to distinguish between the value of trade in CITES-listed and non-CITES taxa, nor to reliably calculate the value of the total trade in CITES-listed species. Where studies have focused on particular taxonomic groups, they generally relate to specific taxa in a country or region and cannot be used to assess the total value of trade in CITES-listed species.
Figure 3. Value (US$ 2010) of trade in key taxonomic groups of CITES Appendix II species, 2006‐2010.
62%15%
10%
8%
5% 0.1%
Reptiles
Mammals
Birds
Fish
Invertebrates
Amphibians
Figure 4. Proportion of value (US$ 2010) accounted for trade in key taxonomic groups of CITES Appendix II species, 2006‐2010.
In this report, we developed a preliminary methodology to begin to estimate the value of trade in the main trade terms for CITES‐listed Appendix II animals. We extrapolated species specific price data submitted to US Customs to estimate the value of legal global trade for all CITES Parties in key commodities, at the point of export. Further details along with associated
1 As expressed in Chapter III of The Future We Want
adopted at the UN Conference on Sustainable Development in 2012, commonly known as Rio+20. 2 Engler, M. and Parry‐Jones, R. (2007). Opportunity or threat: The role of the European Union in global wildlife. TRAFFIC
Europe, Brussels, Belgium.
4
caveats to this approach are included in the methodology section of this report.
Using this methodology, the value of key trade in Appendix II animals is estimated to range from between USD350‐530 million per year, giving a total value of almost USD2.2 billion over five years (Figure 3). An apparent decrease in the value of trade in 2009 and 2010 may be due to delays in reporting of trade data with 72% of 2009 and 56% of 2010 reports submitted at the time of the analysis, but may also potentially be a result of global market conditions.
Species specific price data for Appendix II plants, similar to those used for the analysis of animal data, were unavailable for a sufficiently high number of records for all species except one, and therefore a meaningful and comparable assessment of the value of plants could not be undertaken using the standardised methodology. However, trade in plants includes very valuable timber species such as African Teak, Big‐leaf Mahogany and Central American Cedar as well as many millions of orchids and cacti. The value of this trade is likely to be very high. Price data were available for trade in Big‐leaf Mahogany Swietenia macrophylla and we estimated that this trade alone is likely to have been worth an estimated USD168 million during the period 2006‐2010. It is hoped that further development of the methodology to include plants and a more comprehensive range of trade terms can be undertaken in the near future.
The trade in live reptiles and reptile skins accounted for 62% of the total value of the trade in key terms for Appendix II animals 2006‐2010 (Figure 4), reflecting the relatively high volume of trade in this group. Trade in mammals accounted for 15% of the total value and live birds accounted for 10%.
The direct value at import or export of the international trade in CITES species is just one aspect of their monetary value. Value addition through the trade chain can also add significant amounts to the final value as shown in a recent study of the Snake Skin Trade in South East Asia2 (see text box). In addition, the indirect or wider benefits provided by utilisation and subsequent trade can be substantial. For example, the mean hunting trophy price for an African lion in Namibia in 2011 was USD22,940, with daily hunting fees of USD1,975 and hunt packages requiring a minimum stay of 20 days3. The manufacture of species derived products also contributes to livelihoods and the local economy.
Species are the building blocks of ecosystems. Many species that are traded internationally play important roles in the provision of ecosystem services. Ensuring that utilisation and trade in these species is sustainable will have many wider benefits, for ecosystems and the people that rely on them.
2 ITC 2012. Trade in South East Asian Python Skins. ITC, TRAFFIC, IUCN. Geneva. 3 Lindsey P.A., Balme G.A., Booth V.R. & Midlane N. (2011) The significance of African lions for the financial viability of
trophy hunting and the maintenance of wild land. PLoS ONE 7(1): e29332.
The benefits of trade in wildlife
The many and varied benefits provided by trade in wildlife has been recognised by CITES Parties.
Through Resolution Conf. 8.3 (Rev. CoP13), the Conference of the Parties to CITES recognizes “that commercial trade may be beneficial to the conservation of species and ecosystems, and to the development of local people when carried out at levels that are not detrimental to the survival of the species in question; and that implementation of CITES‐listing decisions should take into account potential impacts on the livelihoods of the poor.”
5
For example, birdwing butterflies are highly traded species that may play an important role in plant pollination. Migratory species such as the Saiga antelope and other CITES listed species may play an important role in nutrient cycling during migration, and peccaries and other fruit‐eating species can be important seed dispersers. Many CITES‐listed species also provide important income as local foods and medicines.
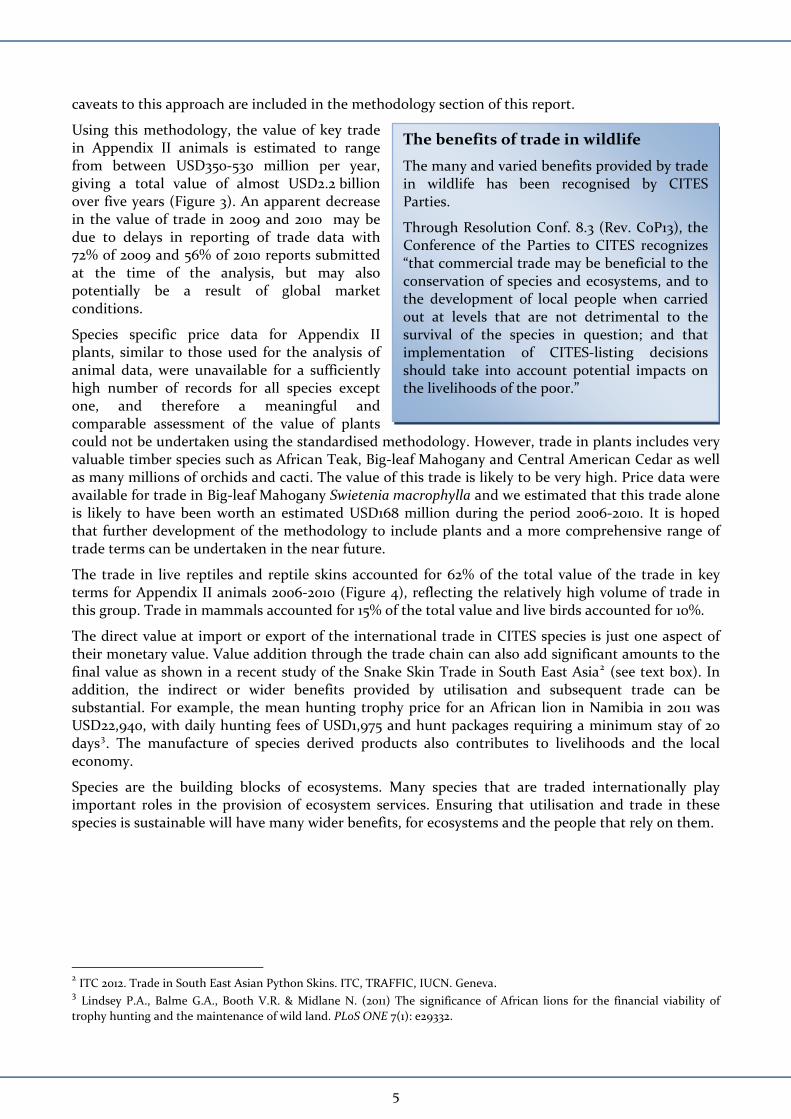
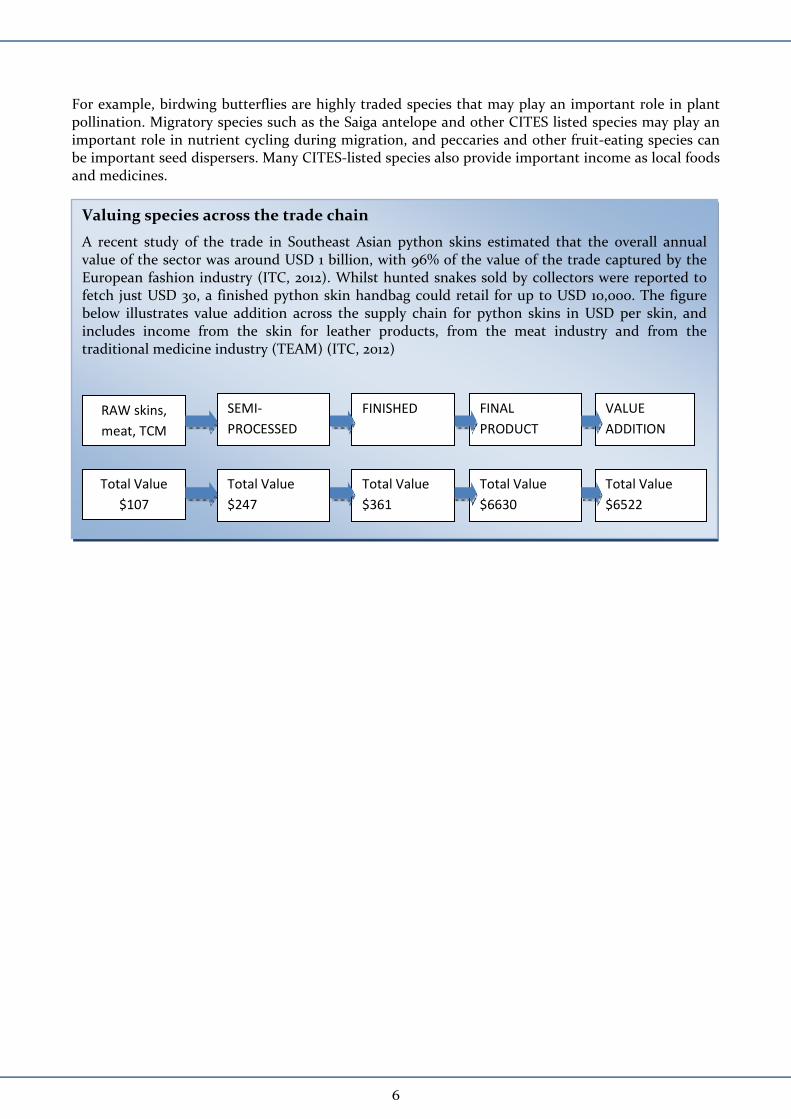
Valuing species across the trade chain
A recent study of the trade in Southeast Asian python skins estimated that the overall annual value of the sector was around USD 1 billion, with 96% of the value of the trade captured by the European fashion industry (ITC, 2012). Whilst hunted snakes sold by collectors were reported to fetch just USD 30, a finished python skin handbag could retail for up to USD 10,000. The figure below illustrates value addition across the supply chain for python skins in USD per skin, and includes income from the skin for leather products, from the meat industry and from the traditional medicine industry (TEAM) (ITC, 2012)
RAW skins,
meat, TCM
SEMI‐
PROCESSED
FINISHED FINAL
PRODUCT
VALUE
ADDITION
Total Value
$107
Total Value
$247
Total Value
$361
Total Value
$6630
Total Value
$6522
6
Methodology
Trade sections
Data included
This analysis considers trade in Appendix II species over the period 1996‐2010. The data used were taken from the CITES Trade Database on 29 February 2012. Any annual reports not included in the database at that time were not included in this analysis (all Annual Reports for 2010 were due by 31st October 2011).
Trade figures are based on exporter‐reported data. Only direct exports are analysed, with re‐export data excluded.
Trade terms
The trade terms included within this analysis for each taxonomic group are as follows:
Mammals: o Hunting trophies: includes ‘trophies’, ‘skins’ (purpose4 H and P), ‘skulls’, ‘bodies’ and
‘tusks’ (for elephants and hippos). o Skins: includes all commercial skins (purpose T and without a purpose specified) and
reptile sides converted to skins.
Birds – live animals
Reptiles – live animals and skins
Amphibians – live animals
Fish – caviar (kg)
Invertebrates – live (excluding coral), live and raw corals, and bodies
Plants – live plants and timber (m3). Timber includes trade recorded as ‘timber’, ‘sawn wood’, ‘timber pieces’, ‘logs’, and ‘veneer’. Where possible, conversion factors based on the average weight given in the CITES Identification Manual was used to convert kg to m3.
4 Purpose codes as outlined in: Guidelines for the preparation and submission of CITES annual reports (February 2011)
Code Description
T Commercial
Z Zoo
G Botanical garden
Q Circus or travelling exhibition
S Scientific
H Hunting trophy
P Personal
M Medical (including biomedical research)
E Educational
N Reintroduction or introduction into the wild
B Breeding in captivity or artificial propagation
L Law enforcement / judicial / forensic
7
8
All other trade terms were excluded from the study to facilitate the snapshot analysis.
Purpose3
The analysis focussed on trade that was reported for commercial purposes (purpose T (Trade)) and trade recorded without a purpose specified. Trade in mammal trophies reported as personal possessions (purpose P) and hunting trophies (purpose H) was also included in the analysis.
Trade in all other purposes (B, E, G, L, M, N, Q, S, Z5 and P, H for groups other than mammals) have been excluded from the analysis.
Source6
The analysis focuses on the following broad source categories:
Wild – trade recorded as wild sourced (W), Unknown (U), and no source specified.
Captive‐produced –trade recorded as captive‐bred (C and D‐ Appendix I ) and captive‐born (F)
Ranched – trade recorded as ranched (R)
Artificially Propagated – trade recorded as Artificially propagated (A and D – Appendix I)
Trade in pre‐Convention (O) and seized/confiscated (I) items have been excluded from the analysis.
6 Source codes as outlined in: Guidelines for the preparation and submission of CITES annual reports (February 2011) Code Description
W Specimens taken from the wild
R Ranched specimens: specimens of animals reared in a controlled environment, taken as eggs or juveniles from the wild, where they would otherwise have had a very low probability of surviving to adulthood
D Appendix‐I animals bred in captivity for commercial purposes in operations included in the Secretariat's Register, in accordance with Resolution Conf. 12.10 (Rev. CoP15), and Appendix‐I plants artificially propagated for commercial purposes, as well as parts and derivatives thereof, exported under the provisions of Article VII, paragraph 4, of the Convention
A Plants that are artificially propagated in accordance with Resolution Conf. 11.11 (Rev. CoP15), as well as parts and derivatives thereof, exported under the provisions of Article VII, paragraph 5 (specimens of species included in Appendix I that have been propagated artificially for non‐commercial purposes and specimens of species included in Appendices II and III)
C Animals bred in captivity in accordance with Resolution Conf. 10.16 (Rev.), as well as parts and derivatives thereof, exported under the provisions of Article VII, paragraph 5
F Animals born in captivity (F1 or subsequent generations) that do not fulfil the definition of ‘bred in captivity’ in Resolution Conf. 10.16 (Rev.), as well as parts and derivatives thereof
U Source unknown (must be justified)
I Confiscated or seized specimens (may be used with another code)
O Pre‐Convention specimens
Valuation methodology
An initial review of price data available for trade in selected items of Appendix II CITES‐listed species was undertaken. On the basis of the species coverage, level of detail, and consistency of the dataset, the “Declared U.S. Dollar Value” data from the U.S. CITES Annual Reports were used as the basis for calculations of the value of trade in CITES‐listed species. The United States is a major importer and exporter of CITES‐listed species and therefore Customs data included price data for a very high number of CITES species in trade. These price data were extrapolated to calculate the value of trade in CITES listed species globally.
Global volumes of trade were derived from the CITES Trade Database.
U.S. price data used
The Declared U.S. Dollar Value is the amount in U.S. dollars declared by the trader at the point of export from or import to the United States. The Declared U.S. Dollar Value data provided in the U.S. CITES Annual Reports for the years 2006‐2010 were used. Both import and export price data were included in the analysis.
On account of limited price data available for plants in the U.S. dataset (two taxa only), plants were excluded from the analysis. It is hoped that further datasets can be obtained and the methodology developed to address this issue in the future.
Data for animals were standardised to comply with CITES accepted codes (for further information on CITES codes for terms, sources and units, see http://www.cites.org/eng/notif/2011/E019A.pdf). Only data that equated to number of animals or kg (caviar and coral only) were included. Units and source codes were converted or grouped to allow for more meaningful analysis.
Price per taxon per year (2006‐2010) was corrected for inflation by using a conversion factor (see http://www.usinflationcalculator.com/) to express prices as estimates of US dollars in 2010.
The median USD price for each family/unit/ source/term combination was calculated. Family‐level price data were used so that median prices would be based on a higher number of records, thus providing a more robust price estimate. Furthermore, calculations done at the family level provided value data for a higher proportion of trade records in the CITES trade data.
CITES trade data
Trade data were extracted from the CITES Trade Database to determine global trade volumes of Appendix II taxa as reported by exporters in 2006‐2010 for the parameters (trade terms, sources and purposes) listed above.
Calculating global value of trade data
To estimate the monetary value of global trade in selected terms of CITES Appendix II animal species, the median price value for each family/unit/source/term combination was multiplied by the global volume of reported trade.
Where the family median was based on a small number of records (≤5 records) or where price data were unavailable for a family/unit/source/term combination (e.g. because the US had not traded in the taxon in question), proxy values were used (e.g. median price at the Order level for the same unit/term/source or using the price for trade in the same Order but in a similar but different term or source). Where no proxy was found or available proxies were based on less than five records (1747 trade transactions in total), these transactions were excluded from the analysis.
The price dataset initially included 325,364 relevant price records for animal species. Median price values were subsequently calculated for 377 family/unit/source/term combinations. The global trade data used included 175,452 trade records, with price value data available for 173,705 of these records.
9
10
Considerations
A number of assumptions were made in order to undertake the calculations for this report.
Only price data from US imports and exports were used, which were then extrapolated to estimate the value of trade from other countries. However, in reality there will be price differences between countries for the same species and there will be differences in the quality of products, leading to price differences. Our estimates of the financial value of the trade in key terms of CITES Appendix II animals is therefore an approximation of the actual earnings at one stage in the market chain.
The calculations were undertaken on a subset of CITES trade, mirroring the terms, units, sources and purposes used for the trade analysis (as outlined above ) and focussing only on Appendix II animals. Furthermore, records were excluded if no price data were available or if no adequate proxy was identified. Therefore calculations are likely to be an underestimate of total value of legal trade in the selected Appendix II animals.
Proxy data for price calculations may not always reflect the true price of a species.
The price for any given species/commodity may vary according to size of animal, shipment size, variety (e.g. rare breeds) – such detail is not captured in the CITES trade data. An initial analysis of the data used in this report indicated that median shipment sizes were comparable between the two datasets.
The analysis only captures legal reported trade and does not capture illegal trade.
Price data reported to customs may underestimate retail values.
The analysis does not capture value post import – where much value can be added7.
In future, it is intended to refine the methodology to further verify assumptions and to include species listed in Appendix I and III, other terms and price data for plants.
7 ITC, 2012. Trade in South East Asian python skins. ITC, TRAFFIC, IUCN, Geneva.
Trade trends in major taxa
Mammals
Mammals are traded as live animals, as well as for their parts and derivatives. This analysis focuses on trade in hunting trophies and commercially traded skins as these terms were thought to represent high value and high volume trades respectively.
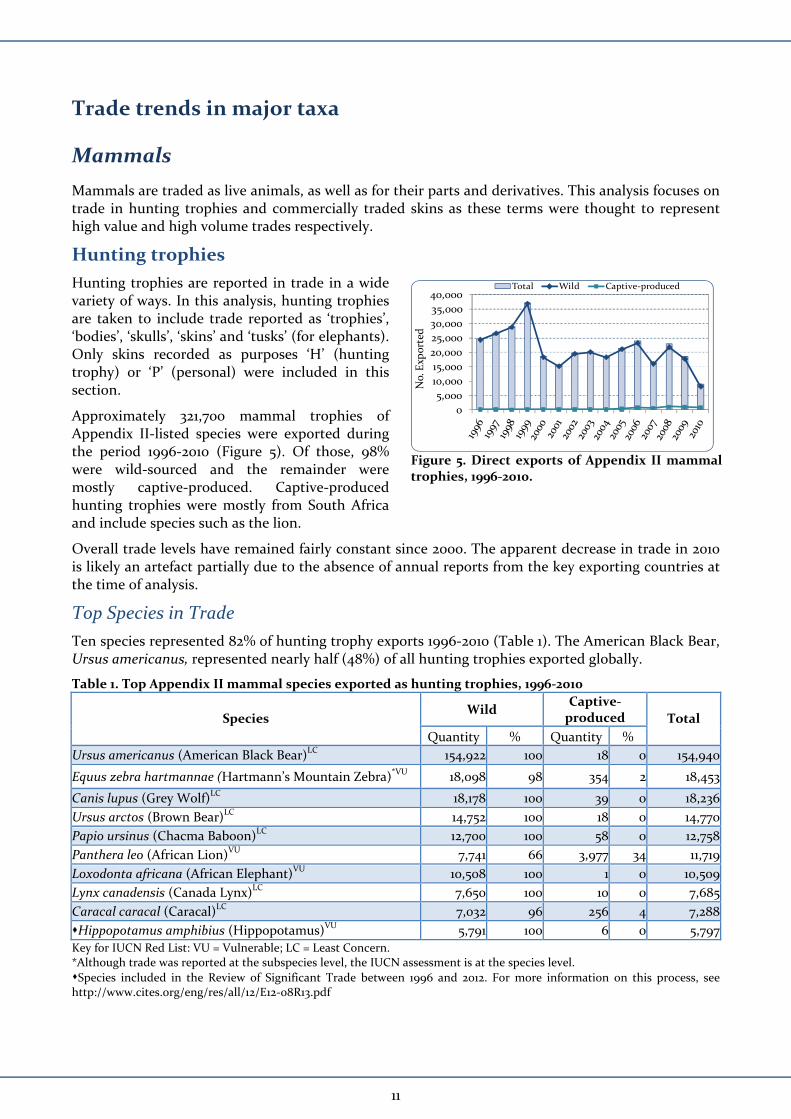
Hunting trophies
Hunting trophies are reported in trade in a wide variety of ways. In this analysis, hunting trophies are taken to include trade reported as ‘trophies’, ‘bodies’, ‘skulls’, ‘skins’ and ‘tusks’ (for elephants). Only skins recorded as purposes ‘H’ (hunting trophy) or ‘P’ (personal) were included in this section.
Approximately 321,700 mammal trophies of Appendix II‐listed species were exported during the period 1996‐2010 (Figure 5). Of those, 98% were wild‐sourced and the remainder were mostly captive‐produced. Captive‐produced hunting trophies were mostly from South Africa and include species such as the lion.
Overall trade levels have remained fairly constant since 2000. The apparent decrease in trade in 2010 is likely an artefact partially due to the absence of annual reports from the key exporting countries at the time of analysis.
Top Species in Trade
Ten species represented 82% of hunting trophy exports 1996‐2010 (Table 1). The American Black Bear, Ursus americanus, represented nearly half (48%) of all hunting trophies exported globally.
Table 1. Top Appendix II mammal species exported as hunting trophies, 1996‐2010
Wild Captive‐produced Species
Quantity % Quantity %
Total
Ursus americanus (American Black Bear)LC 154,922 100 18 0 154,940
Equus zebra hartmannae (Hartmann’s Mountain Zebra)*VU 18,098 98 354 2 18,453
Canis lupus (Grey Wolf)LC 18,178 100 39 0 18,236
Ursus arctos (Brown Bear)LC 14,752 100 18 0 14,770
Papio ursinus (Chacma Baboon)LC 12,700 100 58 0 12,758
Panthera leo (African Lion)VU 7,741 66 3,977 34 11,719
Loxodonta africana (African Elephant)VU 10,508 100 1 0 10,509
Lynx canadensis (Canada Lynx)LC 7,650 100 10 0 7,685
Caracal caracal (Caracal)LC 7,032 96 256 4 7,288
Hippopotamus amphibius (Hippopotamus)VU 5,791 100 6 0 5,797
Key for IUCN Red List: VU = Vulnerable; LC = Least Concern. *Although trade was reported at the subspecies level, the IUCN assessment is at the species level.
Species included in the Review of Significant Trade between 1996 and 2012. For more information on this process, see http://www.cites.org/eng/res/all/12/E12‐08R13.pdf
0
5,000
10,000
15,000
20,000
25,000
30,000
35,000
40,000
No. Exp
orted
Total Wild Captive‐produced
Figure 5. Direct exports of Appendix II mammal trophies, 1996‐2010.
11
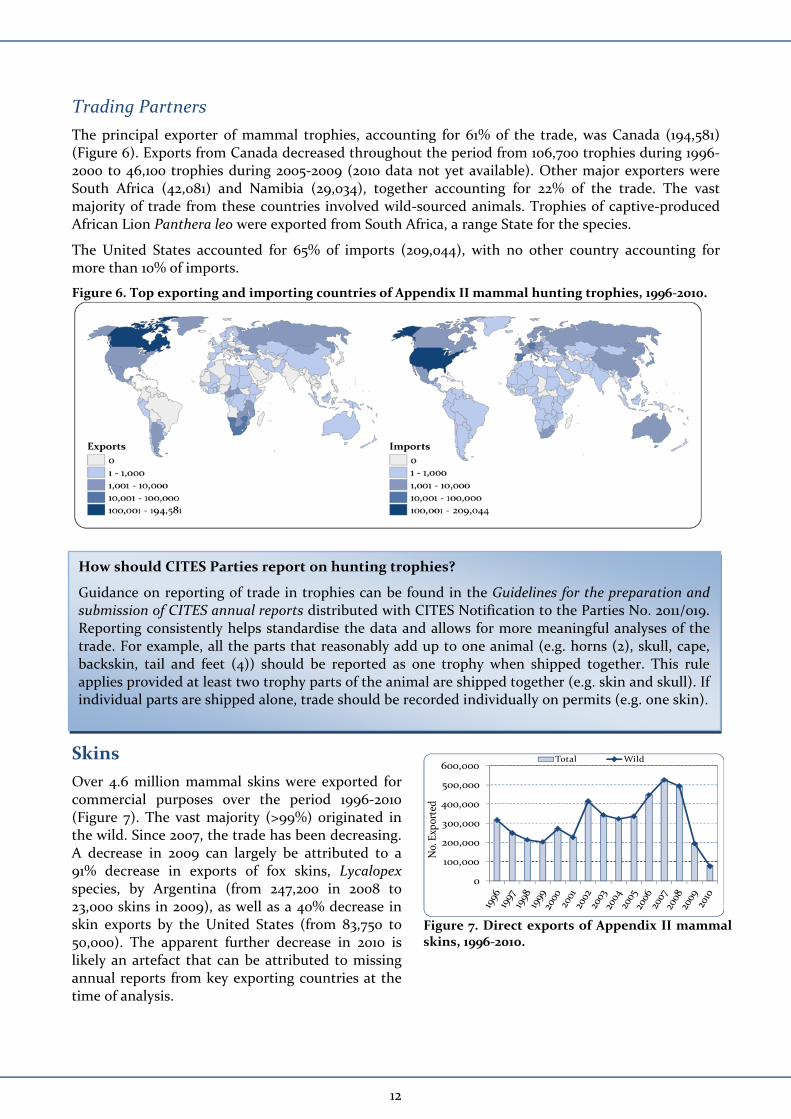
Trading Partners
The principal exporter of mammal trophies, accounting for 61% of the trade, was Canada (194,581) (Figure 6). Exports from Canada decreased throughout the period from 106,700 trophies during 1996‐2000 to 46,100 trophies during 2005‐2009 (2010 data not yet available). Other major exporters were South Africa (42,081) and Namibia (29,034), together accounting for 22% of the trade. The vast majority of trade from these countries involved wild‐sourced animals. Trophies of captive‐produced African Lion Panthera leo were exported from South Africa, a range State for the species.
The United States accounted for 65% of imports (209,044), with no other country accounting for more than 10% of imports.
Figure 6. Top exporting and importing countries of Appendix II mammal hunting trophies, 1996‐2010.
Skins
Over 4.6 million mammal skins were exported for commercial purposes over the period 1996‐2010 (Figure 7). The vast majority (>99%) originated in the wild. Since 2007, the trade has been decreasing. A decrease in 2009 can largely be attributed to a 91% decrease in exports of fox skins, Lycalopex species, by Argentina (from 247,200 in 2008 to 23,000 skins in 2009), as well as a 40% decrease in skin exports by the United States (from 83,750 to 50,000). The apparent further decrease in 2010 is likely an artefact that can be attributed to missing annual reports from key exporting countries at the time of analysis.
0
100,000
200,000
300,000
400,000
500,000
600,000
No. Exp
orted
Total Wild
Figure 7. Direct exports of Appendix II mammal skins, 1996‐2010.
How should CITES Parties report on hunting trophies?
Guidance on reporting of trade in trophies can be found in the Guidelines for the preparation and submission of CITES annual reports distributed with CITES Notification to the Parties No. 2011/019. Reporting consistently helps standardise the data and allows for more meaningful analyses of the trade. For example, all the parts that reasonably add up to one animal (e.g. horns (2), skull, cape, backskin, tail and feet (4)) should be reported as one trophy when shipped together. This rule applies provided at least two trophy parts of the animal are shipped together (e.g. skin and skull). If individual parts are shipped alone, trade should be recorded individually on permits (e.g. one skin).
12
13
Top Species in Trade
Five species represented around 80% of the trade (Table 2).
Table 2. Top Appendix II mammal species exported as commercial skins, 1996‐2010
Wild Captive‐produced Species
Quantity % Quantity % Total
Lycalopex griseus (South American Grey Fox)LC 1,421,900 100 1,421,900
Pecari tajacu (Collared Peccary)LC 644,274 100 644,274
Lontra canadensis (North American Otter)LC 602,975 100 1,270 <1 604,245
Arctocephalus pusillus (Afro‐Australian Fur Seal)LC 543,644 100 543,644
Lynx rufus (Canada Lynx)LC 452,487 100 59 <1 452,546
Key for IUCN Red List: LC = Least Concern Species included in the Review of Significant Trade between 1996 and 2012. For more information on this process, see http://www.cites.org/eng/res/all/12/E12‐08R13.pdf
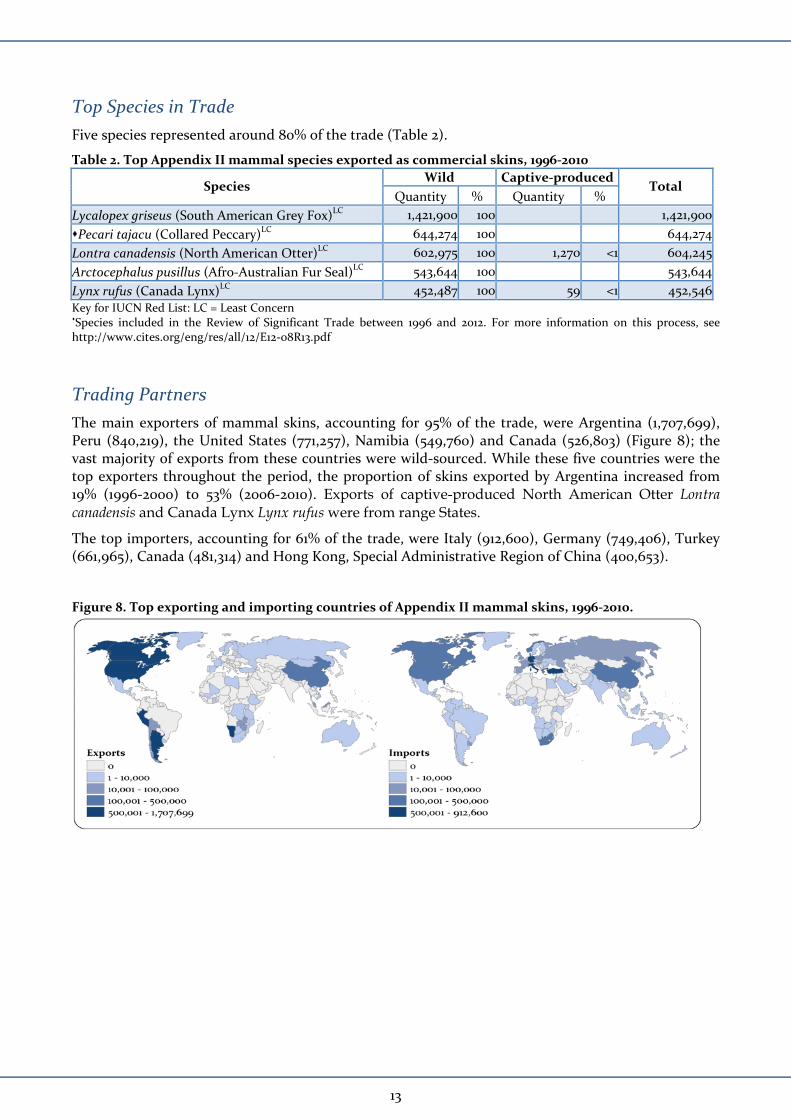
Trading Partners
The main exporters of mammal skins, accounting for 95% of the trade, were Argentina (1,707,699), Peru (840,219), the United States (771,257), Namibia (549,760) and Canada (526,803) (Figure 8); the vast majority of exports from these countries were wild‐sourced. While these five countries were the top exporters throughout the period, the proportion of skins exported by Argentina increased from 19% (1996‐2000) to 53% (2006‐2010). Exports of captive-produced North American Otter Lontra canadensis and Canada Lynx Lynx rufus were from range States.
The top importers, accounting for 61% of the trade, were Italy (912,600), Germany (749,406), Turkey (661,965), Canada (481,314) and Hong Kong, Special Administrative Region of China (400,653).
Figure 8. Top exporting and importing countries of Appendix II mammal skins, 1996‐2010.
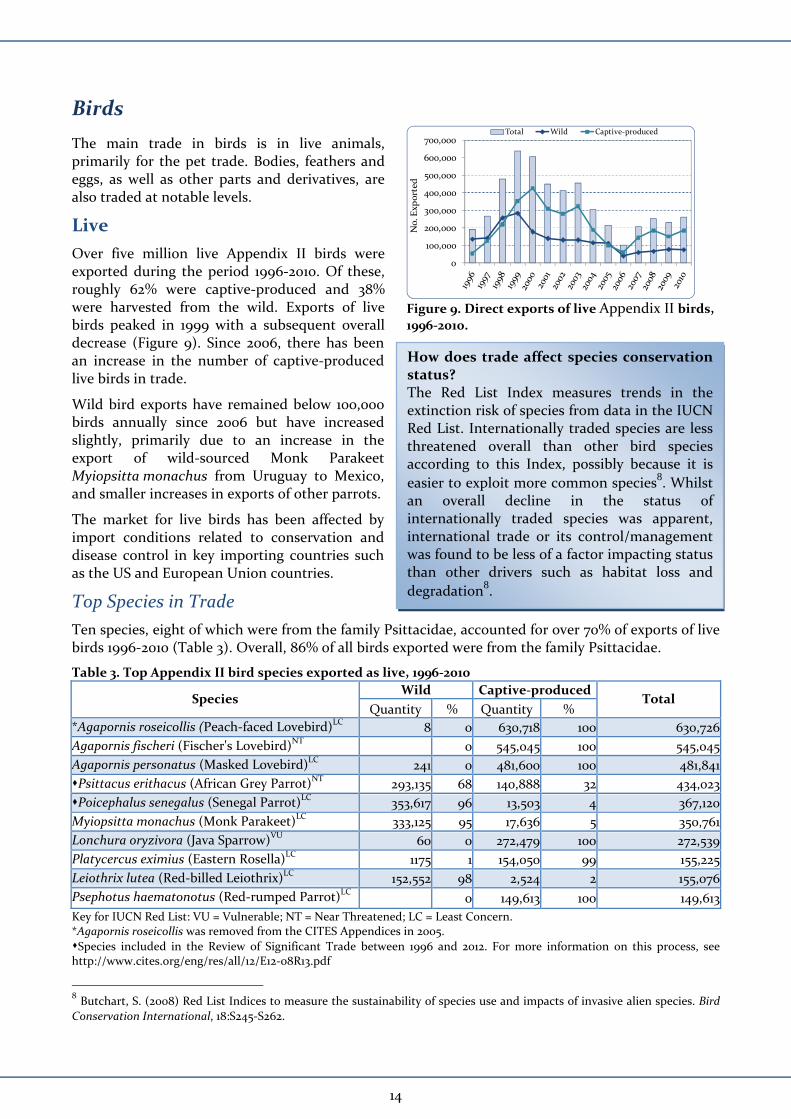
Birds
The main trade in birds is in live animals, primarily for the pet trade. Bodies, feathers and eggs, as well as other parts and derivatives, are also traded at notable levels.
Live
Over five million live Appendix II birds were exported during the period 1996‐2010. Of these, roughly 62% were captive‐produced and 38% were harvested from the wild. Exports of live birds peaked in 1999 with a subsequent overall decrease (Figure 9). Since 2006, there has been an increase in the number of captive‐produced live birds in trade.
Wild bird exports have remained below 100,000 birds annually since 2006 but have increased slightly, primarily due to an increase in the export of wild‐sourced Monk Parakeet Myiopsitta monachus from Uruguay to Mexico, and smaller increases in exports of other parrots.
The market for live birds has been affected by import conditions related to conservation and disease control in key importing countries such as the US and European Union countries.8
Top Species in Trade
Ten species, eight of which were from the family Psittacidae, accounted for over 70% of exports of live birds 1996‐2010 (Table 3). Overall, 86% of all birds exported were from the family Psittacidae.
Table 3. Top Appendix II bird species exported as live, 1996‐2010
Wild Captive‐produced Species
Quantity % Quantity % Total
*Agapornis roseicollis (Peach‐faced Lovebird)LC 8 0 630,718 100 630,726
Agapornis fischeri (Fischer's Lovebird)NT 0 545,045 100 545,045
Agapornis personatus (Masked Lovebird)LC 241 0 481,600 100 481,841
Psittacus erithacus (African Grey Parrot)NT 293,135 68 140,888 32 434,023
Poicephalus senegalus (Senegal Parrot)LC 353,617 96 13,503 4 367,120
Myiopsitta monachus (Monk Parakeet)LC 333,125 95 17,636 5 350,761
Lonchura oryzivora (Java Sparrow)VU 60 0 272,479 100 272,539
Platycercus eximius (Eastern Rosella)LC 1175 1 154,050 99 155,225
Leiothrix lutea (Red‐billed Leiothrix)LC 152,552 98 2,524 2 155,076
Psephotus haematonotus (Red‐rumped Parrot)LC 0 149,613 100 149,613
Key for IUCN Red List: VU = Vulnerable; NT = Near Threatened; LC = Least Concern. *Agapornis roseicollis was removed from the CITES Appendices in 2005.
Species included in the Review of Significant Trade between 1996 and 2012. For more information on this process, see http://www.cites.org/eng/res/all/12/E12‐08R13.pdf
8 Butchart, S. (2008) Red List Indices to measure the sustainability of species use and impacts of invasive alien species. Bird
Conservation International, 18:S245‐S262.
0
100,000
200,000
300,000
400,000
500,000
600,000
700,000
No. Exp
orted
Total Wild Captive‐produced
Figure 9. Direct exports of live Appendix II birds, 1996‐2010. How does trade affect species conservation status? The Red List Index measures trends in the extinction risk of species from data in the IUCN Red List. Internationally traded species are less threatened overall than other bird species according to this Index, possibly because it is
easier to exploit more common species8. Whilst
an overall decline in the status of internationally traded species was apparent, international trade or its control/management was found to be less of a factor impacting status than other drivers such as habitat loss and
degradation8.
14
15
Top Trading Partners
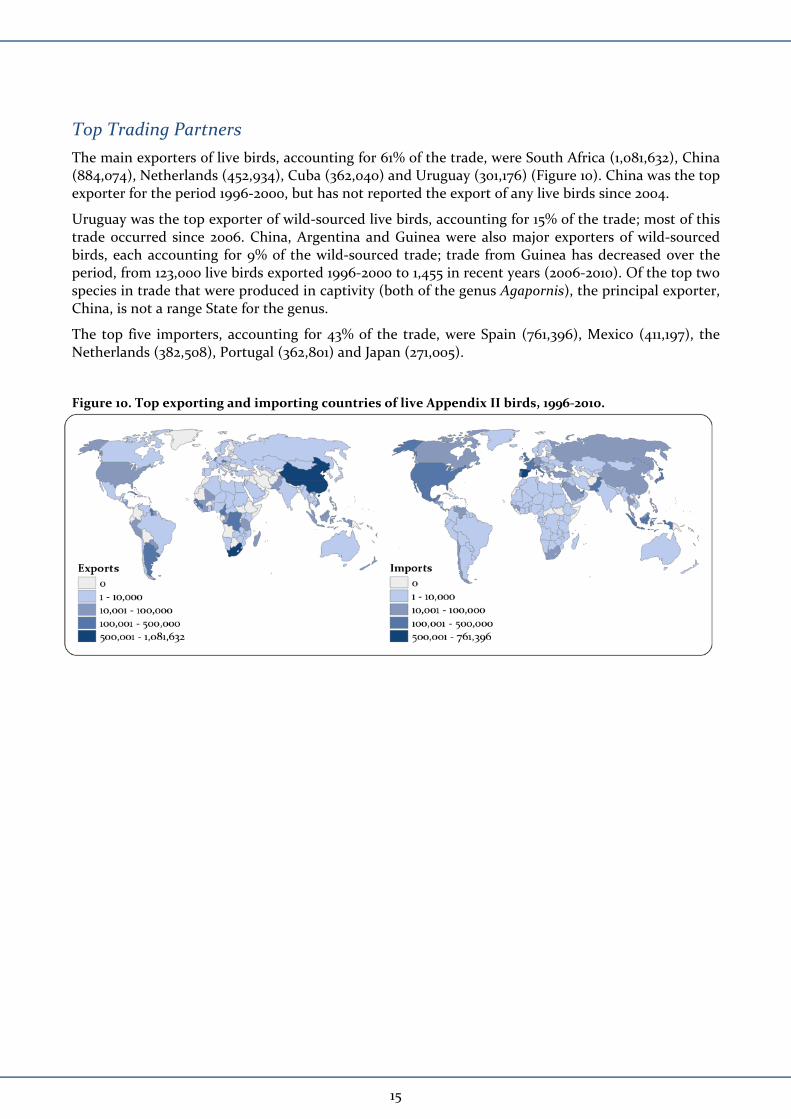
The main exporters of live birds, accounting for 61% of the trade, were South Africa (1,081,632), China (884,074), Netherlands (452,934), Cuba (362,040) and Uruguay (301,176) (Figure 10). China was the top exporter for the period 1996‐2000, but has not reported the export of any live birds since 2004.
Uruguay was the top exporter of wild‐sourced live birds, accounting for 15% of the trade; most of this trade occurred since 2006. China, Argentina and Guinea were also major exporters of wild‐sourced birds, each accounting for 9% of the wild‐sourced trade; trade from Guinea has decreased over the period, from 123,000 live birds exported 1996‐2000 to 1,455 in recent years (2006‐2010). Of the top two species in trade that were produced in captivity (both of the genus Agapornis), the principal exporter, China, is not a range State for the genus.
The top five importers, accounting for 43% of the trade, were Spain (761,396), Mexico (411,197), the Netherlands (382,508), Portugal (362,801) and Japan (271,005).
Figure 10. Top exporting and importing countries of live Appendix II birds, 1996‐2010.
Reptiles
Reptiles are traded in many different forms, but the main trade is in live animals and skins. Manufactured products (watch straps etc.) are also traded at high volumes.
Live
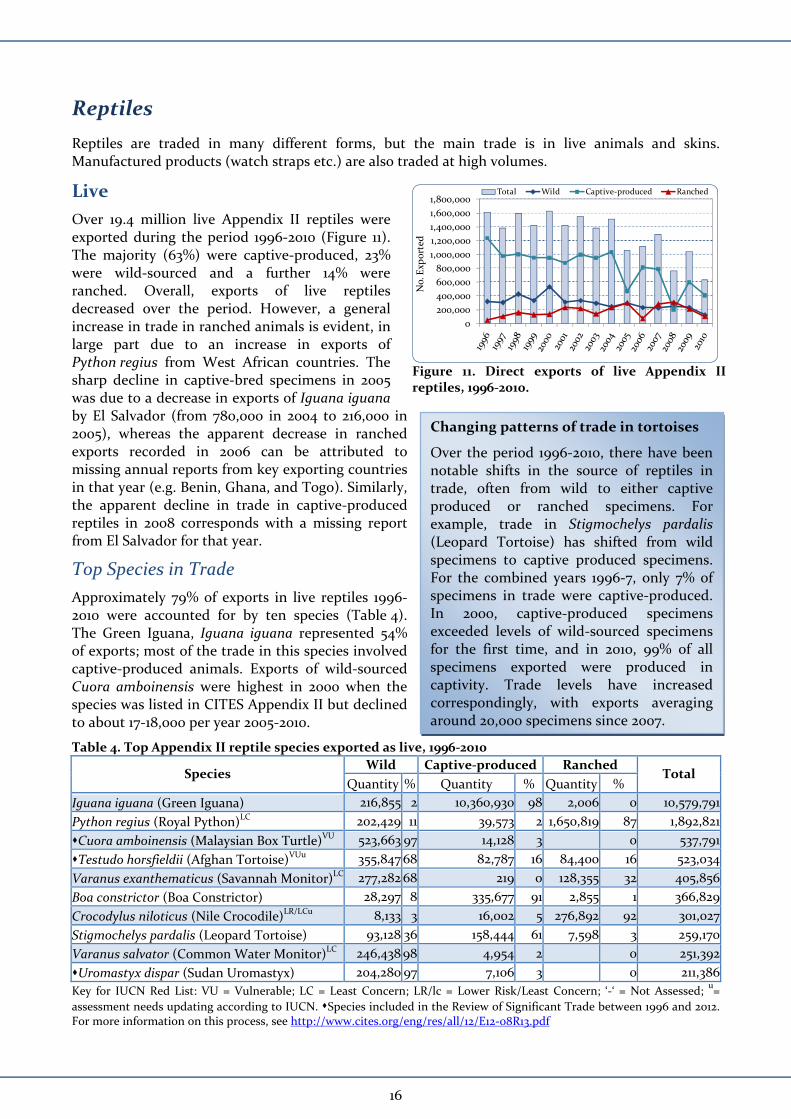
Over 19.4 million live Appendix II reptiles were exported during the period 1996‐2010 (Figure 11). The majority (63%) were captive‐produced, 23% were wild‐sourced and a further 14% were ranched. Overall, exports of live reptiles decreased over the period. However, a general increase in trade in ranched animals is evident, in large part due to an increase in exports of Python regius from West African countries. The sharp decline in captive‐bred specimens in 2005 was due to a decrease in exports of Iguana iguana by El Salvador (from 780,000 in 2004 to 216,000 in 2005), whereas the apparent decrease in ranched exports recorded in 2006 can be attributed to missing annual reports from key exporting countries in that year (e.g. Benin, Ghana, and Togo). Similarly, the apparent decline in trade in captive‐produced reptiles in 2008 corresponds with a missing report from El Salvador for that year.
Top Species in Trade
Approximately 79% of exports in live reptiles 1996‐2010 were accounted for by ten species (Table 4). The Green Iguana, Iguana iguana represented 54% of exports; most of the trade in this species involved captive‐produced animals. Exports of wild‐sourced Cuora amboinensis were highest in 2000 when the species was listed in CITES Appendix II but declined to about 17‐18,000 per year 2005‐2010.
Table 4. Top Appendix II reptile species exported as live, 1996‐2010
Wild Captive‐produced Ranched Species
Quantity % Quantity % Quantity % Total
Iguana iguana (Green Iguana) 216,855 2 10,360,930 98 2,006 0 10,579,791
Python regius (Royal Python)LC 202,429 11 39,573 2 1,650,819 87 1,892,821
Cuora amboinensis (Malaysian Box Turtle)VU 523,663 97 14,128 3 0 537,791
Testudo horsfieldii (Afghan Tortoise)VUu 355,847 68 82,787 16 84,400 16 523,034
Varanus exanthematicus (Savannah Monitor)LC 277,282 68 219 0 128,355 32 405,856
Boa constrictor (Boa Constrictor) 28,297 8 335,677 91 2,855 1 366,829
Crocodylus niloticus (Nile Crocodile)LR/LCu 8,133 3 16,002 5 276,892 92 301,027
Stigmochelys pardalis (Leopard Tortoise) 93,128 36 158,444 61 7,598 3 259,170
Varanus salvator (Common Water Monitor)LC 246,438 98 4,954 2 0 251,392
Uromastyx dispar (Sudan Uromastyx) 204,280 97 7,106 3 0 211,386
Key for IUCN Red List: VU = Vulnerable; LC = Least Concern; LR/lc = Lower Risk/Least Concern; ‘‐‘ = Not Assessed; u=
assessment needs updating according to IUCN. Species included in the Review of Significant Trade between 1996 and 2012. For more information on this process, see http://www.cites.org/eng/res/all/12/E12‐08R13.pdf
0
200,000
400,000
600,000
800,000
1,000,000
1,200,000
1,400,000
1,600,000
1,800,000
No. Exp
orted
Total Wild Captive‐produced Ranched
Figure 11. Direct exports of live Appendix II reptiles, 1996‐2010.
Changing patterns of trade in tortoises
Over the period 1996‐2010, there have been notable shifts in the source of reptiles in trade, often from wild to either captive produced or ranched specimens. For example, trade in Stigmochelys pardalis (Leopard Tortoise) has shifted from wild specimens to captive produced specimens. For the combined years 1996‐7, only 7% of specimens in trade were captive‐produced. In 2000, captive‐produced specimens exceeded levels of wild‐sourced specimens for the first time, and in 2010, 99% of all specimens exported were produced in captivity. Trade levels have increased correspondingly, with exports averaging around 20,000 specimens since 2007.
16
Top Trading Partners
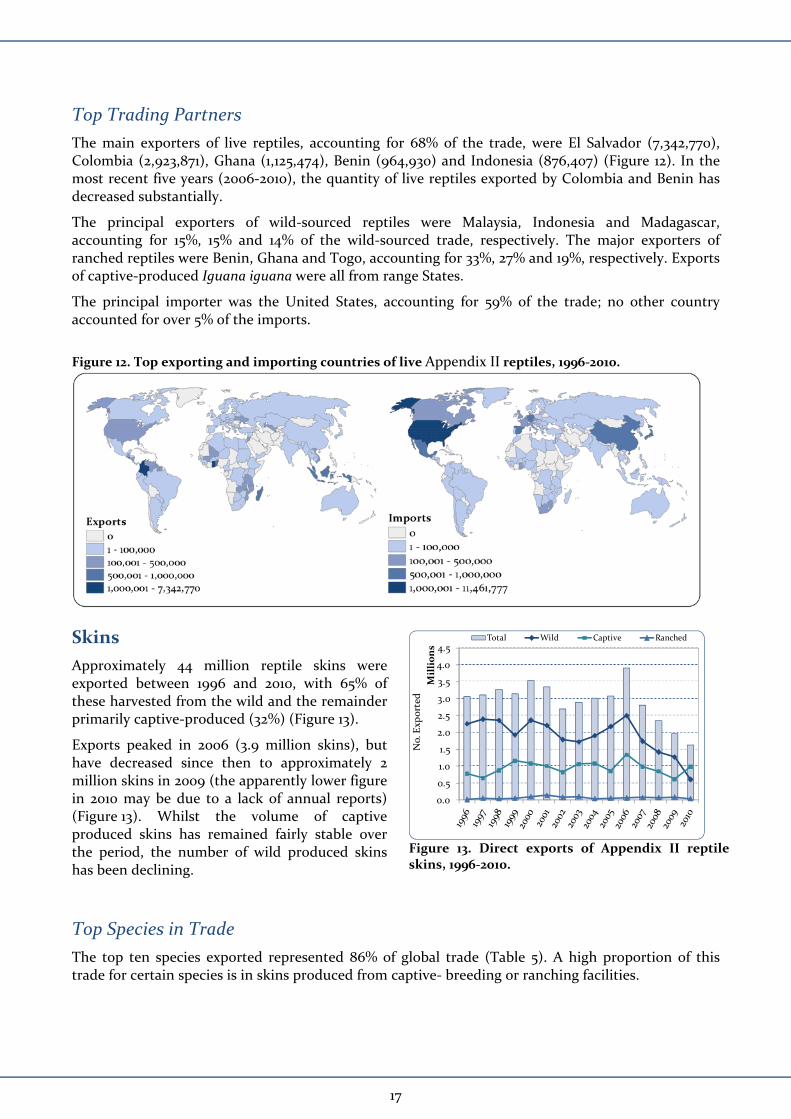
The main exporters of live reptiles, accounting for 68% of the trade, were El Salvador (7,342,770), Colombia (2,923,871), Ghana (1,125,474), Benin (964,930) and Indonesia (876,407) (Figure 12). In the most recent five years (2006‐2010), the quantity of live reptiles exported by Colombia and Benin has decreased substantially.
The principal exporters of wild‐sourced reptiles were Malaysia, Indonesia and Madagascar, accounting for 15%, 15% and 14% of the wild‐sourced trade, respectively. The major exporters of ranched reptiles were Benin, Ghana and Togo, accounting for 33%, 27% and 19%, respectively. Exports of captive‐produced Iguana iguana were all from range States.
The principal importer was the United States, accounting for 59% of the trade; no other country accounted for over 5% of the imports.
Figure 12. Top exporting and importing countries of live Appendix II reptiles, 1996‐2010.
Skins
Approximately 44 million reptile skins were exported between 1996 and 2010, with 65% of these harvested from the wild and the remainder primarily captive‐produced (32%) (Figure 13).
Exports peaked in 2006 (3.9 million skins), but have decreased since then to approximately 2 million skins in 2009 (the apparently lower figure in 2010 may be due to a lack of annual reports) (Figure 13). Whilst the volume of captive produced skins has remained fairly stable over the period, the number of wild produced skins has been declining.
Top Species in Trade
The top ten species exported represented 86% of global trade (Table 5). A high proportion of this trade for certain species is in skins produced from captive‐ breeding or ranching facilities.
0.0
0.5
1.0
1.5
2.0
2.5
3.0
3.5
4.0
4.5
No. Exp
orted
Millions
Total Wild Captive Ranched
Figure 13. Direct exports of Appendix II reptile skins, 1996‐2010.
17
18
Table 5. Top Appendix II reptile species exported as skins, 1996‐2010
Wild Captive‐produced Ranched Species
Quantity % Quantity % Quantity % Total
Caiman crocodilus fuscus (Brown Spectacled Caiman)LC* u
64,218 1 9,658,061 99 0 0 9,722,279
Varanus salvator (Common Water Monitor)LC 8,103,652 100 6,500 0 0 0 8,110,152
Python reticulatus (Reticulated Python) 4,533,436 87 686,344 13 0 0 5,219,780
Alligator mississippiensis (American Alligator)LR/LC u
2,447,218 57 1,659,780 39 167,347 4 4,274,345
Varanus niloticus (Nile Monitor) 2,213,292 100 0 0 0 0 2,213,292
Tupinambis merianae (Argentine Black and
White Tegu) LC 2,059,678 100 0 0 0 0 2,059,678
Crocodylus niloticus (Nile Crocodile)LR/LC u 192,148 11 931,977 55 577,273 34 1,701,398
Tupinambis rufescens (Argentine Teju) LC 1,639,900 100 0 0 0 0 1,639,900
Naja sputatrix (Indonesian Cobra)LC 1,518,205 100 0 0 0 0 1,518,205
Tupinambis teguixin (Banded Tegu) LC 1,035,022 100 0 0 0 0 1,035,022
Key: LC = Least Concern; LR/lc = Lower risk/Least concern); ‘‐’ = Not assessed; u= assessment needs updating according to
IUCN *Caiman crocodilus was assessed at the species level; C.c. fuscus has not been assessed. Tupinambis rufescens and T.
teguixin are considered to be synonyms of T. merianae according to the IUCN; the Red List assessment reflects the assessment for T. merianae.
Species included in the Review of Significant Trade between 1996 and 2012. For more information on this process, see http://www.cites.org/eng/res/all/12/E12‐08R13.pdf
Top Trading Partners
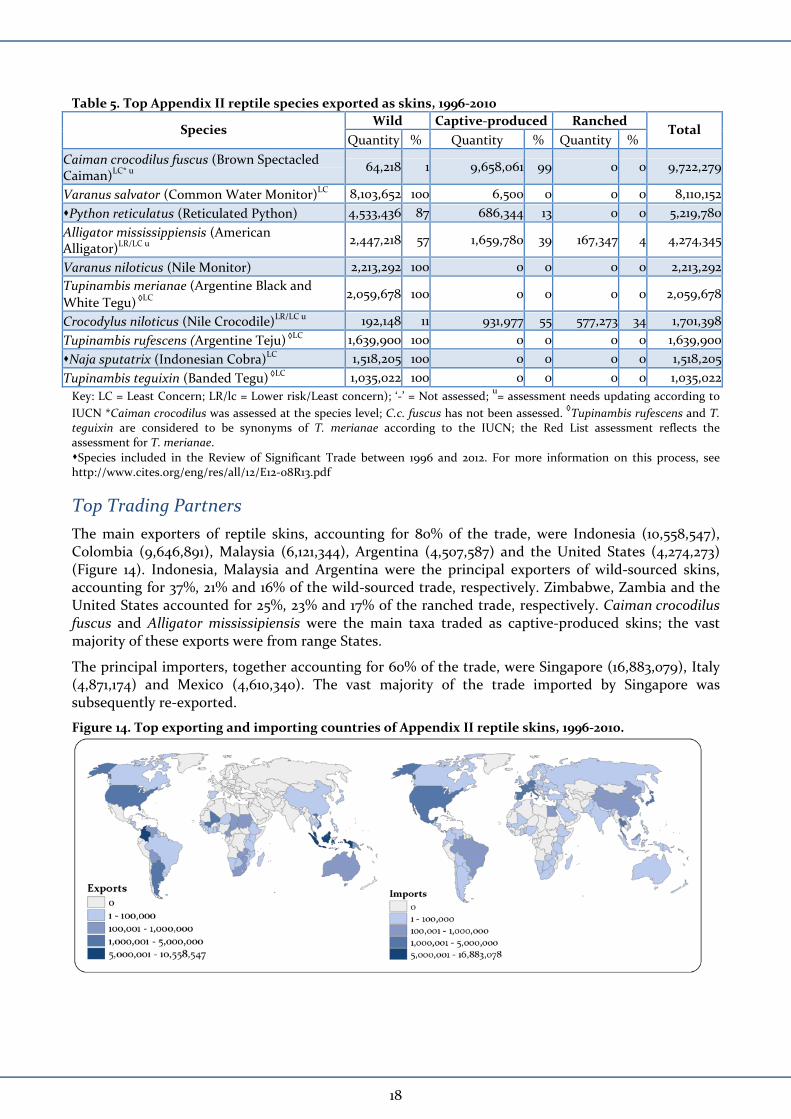
The main exporters of reptile skins, accounting for 80% of the trade, were Indonesia (10,558,547), Colombia (9,646,891), Malaysia (6,121,344), Argentina (4,507,587) and the United States (4,274,273) (Figure 14). Indonesia, Malaysia and Argentina were the principal exporters of wild‐sourced skins, accounting for 37%, 21% and 16% of the wild‐sourced trade, respectively. Zimbabwe, Zambia and the United States accounted for 25%, 23% and 17% of the ranched trade, respectively. Caiman crocodilus fuscus and Alligator mississipiensis were the main taxa traded as captive‐produced skins; the vast majority of these exports were from range States.
The principal importers, together accounting for 60% of the trade, were Singapore (16,883,079), Italy (4,871,174) and Mexico (4,610,340). The vast majority of the trade imported by Singapore was subsequently re‐exported.
Figure 14. Top exporting and importing countries of Appendix II reptile skins, 1996‐2010.
Amphibians
Amphibians are primarily traded as live animals, although meat is also exported.
Live
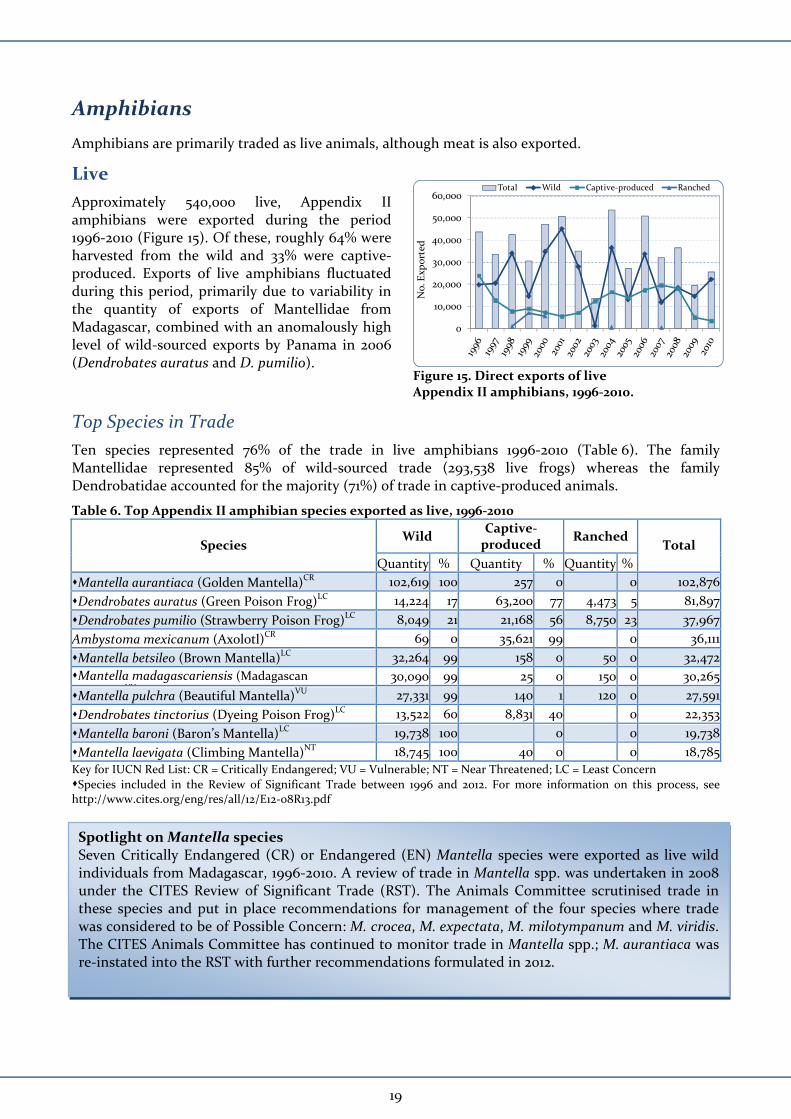
Approximately 540,000 live, Appendix II amphibians were exported during the period 1996‐2010 (Figure 15). Of these, roughly 64% were harvested from the wild and 33% were captive‐produced. Exports of live amphibians fluctuated during this period, primarily due to variability in the quantity of exports of Mantellidae from Madagascar, combined with an anomalously high level of wild‐sourced exports by Panama in 2006 (Dendrobates auratus and D. pumilio).
Top Species in Trade
Ten species represented 76% of the trade in live amphibians 1996‐2010 (Table 6). The family Mantellidae represented 85% of wild‐sourced trade (293,538 live frogs) whereas the family Dendrobatidae accounted for the majority (71%) of trade in captive‐produced animals.
Table 6. Top Appendix II amphibian species exported as live, 1996‐2010
Wild Captive‐produced
Ranched Species
Quantity % Quantity % Quantity %
Total
Mantella aurantiaca (Golden Mantella)CR 102,619 100 257 0 0 102,876
Dendrobates auratus (Green Poison Frog)LC 14,224 17 63,200 77 4,473 5 81,897
Dendrobates pumilio (Strawberry Poison Frog)LC 8,049 21 21,168 56 8,750 23 37,967
Ambystoma mexicanum (Axolotl)CR 69 0 35,621 99 0 36,111
Mantella betsileo (Brown Mantella)LC 32,264 99 158 0 50 0 32,472
Mantella madagascariensis (Madagascan VU
30,090 99 25 0 150 0 30,265
Mantella pulchra (Beautiful Mantella)VU 27,331 99 140 1 120 0 27,591
Dendrobates tinctorius (Dyeing Poison Frog)LC 13,522 60 8,831 40 0 22,353
Mantella baroni (Baron’s Mantella)LC 19,738 100 0 0 19,738
Mantella laevigata (Climbing Mantella)NT 18,745 100 40 0 0 18,785
Key for IUCN Red List: CR = Critically Endangered; VU = Vulnerable; NT = Near Threatened; LC = Least Concern
Species included in the Review of Significant Trade between 1996 and 2012. For more information on this process, see http://www.cites.org/eng/res/all/12/E12‐08R13.pdf
0
10,000
20,000
30,000
40,000
50,000
60,000
No. Exp
orted
Total Wild Captive‐produced Ranched
Figure 15. Direct exports of live Appendix II amphibians, 1996‐2010.
Spotlight on Mantella species Seven Critically Endangered (CR) or Endangered (EN) Mantella species were exported as live wild individuals from Madagascar, 1996‐2010. A review of trade in Mantella spp. was undertaken in 2008 under the CITES Review of Significant Trade (RST). The Animals Committee scrutinised trade in these species and put in place recommendations for management of the four species where trade was considered to be of Possible Concern: M. crocea, M. expectata, M. milotympanum and M. viridis. The CITES Animals Committee has continued to monitor trade in Mantella spp.; M. aurantiaca was re‐instated into the RST with further recommendations formulated in 2012.
19
Top Trading Partners
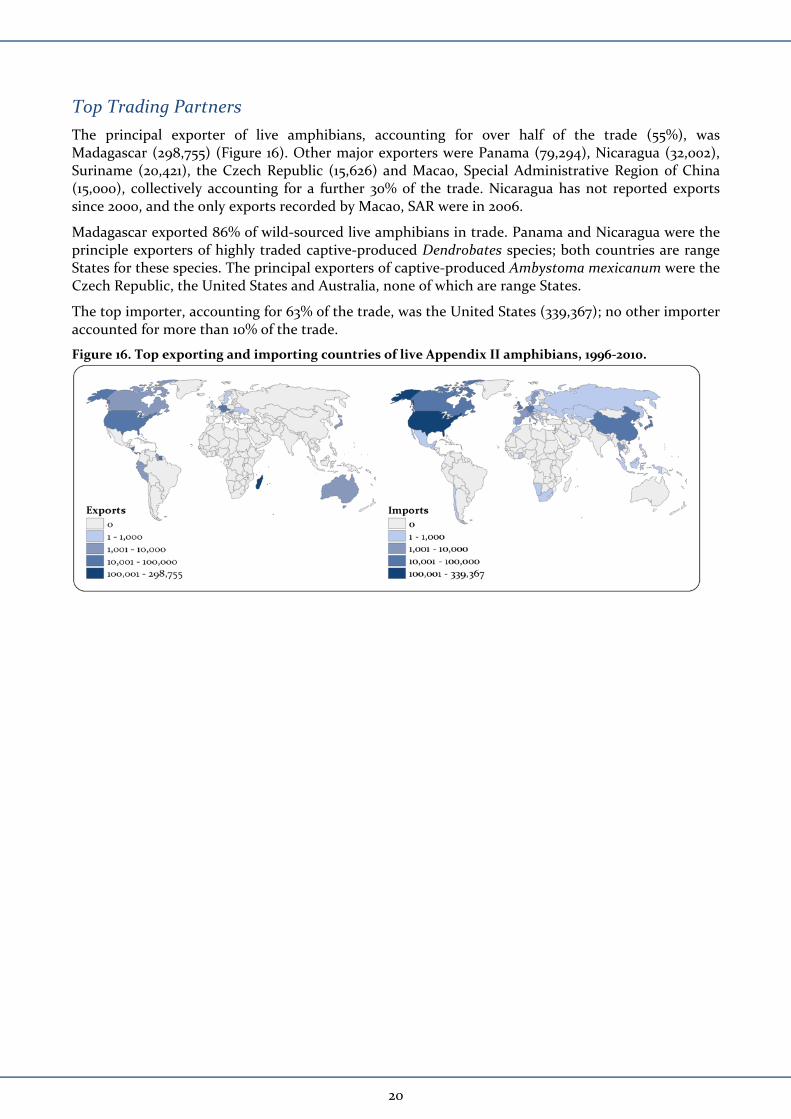
The principal exporter of live amphibians, accounting for over half of the trade (55%), was Madagascar (298,755) (Figure 16). Other major exporters were Panama (79,294), Nicaragua (32,002), Suriname (20,421), the Czech Republic (15,626) and Macao, Special Administrative Region of China (15,000), collectively accounting for a further 30% of the trade. Nicaragua has not reported exports since 2000, and the only exports recorded by Macao, SAR were in 2006.
Madagascar exported 86% of wild‐sourced live amphibians in trade. Panama and Nicaragua were the principle exporters of highly traded captive‐produced Dendrobates species; both countries are range States for these species. The principal exporters of captive‐produced Ambystoma mexicanum were the Czech Republic, the United States and Australia, none of which are range States.
The top importer, accounting for 63% of the trade, was the United States (339,367); no other importer accounted for more than 10% of the trade.
Figure 16. Top exporting and importing countries of live Appendix II amphibians, 1996‐2010.
20
Fish
Caviar was selected for analysis as the most valuable fishery commodity managed by the convention.
Caviar
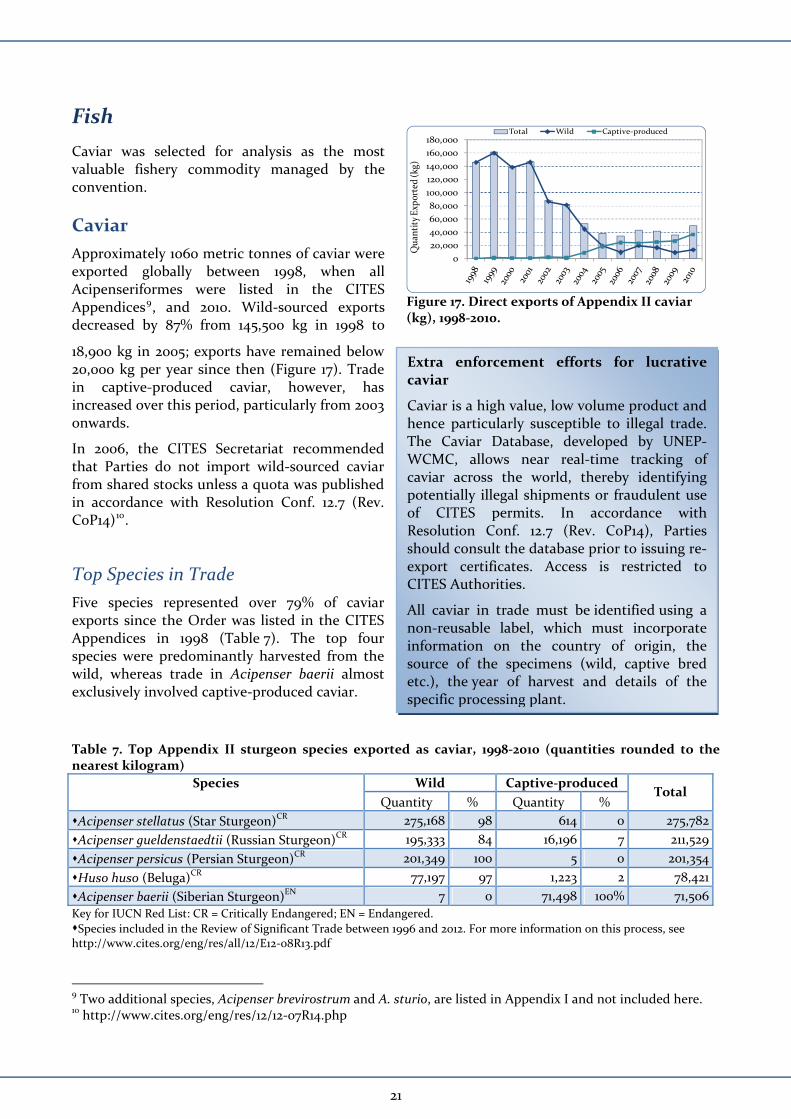
Approximately 1060 metric tonnes of caviar were exported globally between 1998, when all Acipenseriformes were listed in the CITES Appendices9, and 2010. Wild‐sourced exports decreased by 87% from 145,500 kg in 1998 to
18,900 kg in 2005; exports have remained below 20,000 kg per year since then (Figure 17). Trade in captive‐produced caviar, however, has increased over this period, particularly from 2003 onwards.
In 2006, the CITES Secretariat recommended that Parties do not import wild‐sourced caviar from shared stocks unless a quota was published in accordance with Resolution Conf. 12.7 (Rev. CoP14)10.
Top Species in Trade
Five species represented over 79% of caviar exports since the Order was listed in the CITES Appendices in 1998 (Table 7). The top four species were predominantly harvested from the wild, whereas trade in Acipenser baerii almost exclusively involved captive‐produced caviar.
Table 7. Top Appendix II sturgeon species exported as caviar, 1998‐2010 (quantities rounded to the nearest kilogram)
Wild Captive‐produced Species
Quantity % Quantity % Total
Acipenser stellatus (Star Sturgeon)CR 275,168 98 614 0 275,782
Acipenser gueldenstaedtii (Russian Sturgeon)CR 195,333 84 16,196 7 211,529
Acipenser persicus (Persian Sturgeon)CR 201,349 100 5 0 201,354
Huso huso (Beluga)CR 77,197 97 1,223 2 78,421
Acipenser baerii (Siberian Sturgeon)EN 7 0 71,498 100% 71,506
Key for IUCN Red List: CR = Critically Endangered; EN = Endangered.
Species included in the Review of Significant Trade between 1996 and 2012. For more information on this process, see http://www.cites.org/eng/res/all/12/E12‐08R13.pdf
9 Two additional species, Acipenser brevirostrum and A. sturio, are listed in Appendix I and not included here. 10 http://www.cites.org/eng/res/12/12‐07R14.php
Extra enforcement efforts for lucrative caviar
Caviar is a high value, low volume product and hence particularly susceptible to illegal trade. The Caviar Database, developed by UNEP‐WCMC, allows near real‐time tracking of caviar across the world, thereby identifying potentially illegal shipments or fraudulent use of CITES permits. In accordance with Resolution Conf. 12.7 (Rev. CoP14), Parties should consult the database prior to issuing re‐export certificates. Access is restricted to CITES Authorities.
All caviar in trade must be identified using a non‐reusable label, which must incorporate information on the country of origin, the source of the specimens (wild, captive bred etc.), the year of harvest and details of the specific processing plant.
0
20,000
40,000
60,000
80,000
100,000
120,000
140,000
160,000
180,000
Quan
tity Exp
orted (k
g)
Total Wild Captive‐produced
Figure 17. Direct exports of Appendix II caviar (kg), 1998‐2010.
21
Top Trading Partners
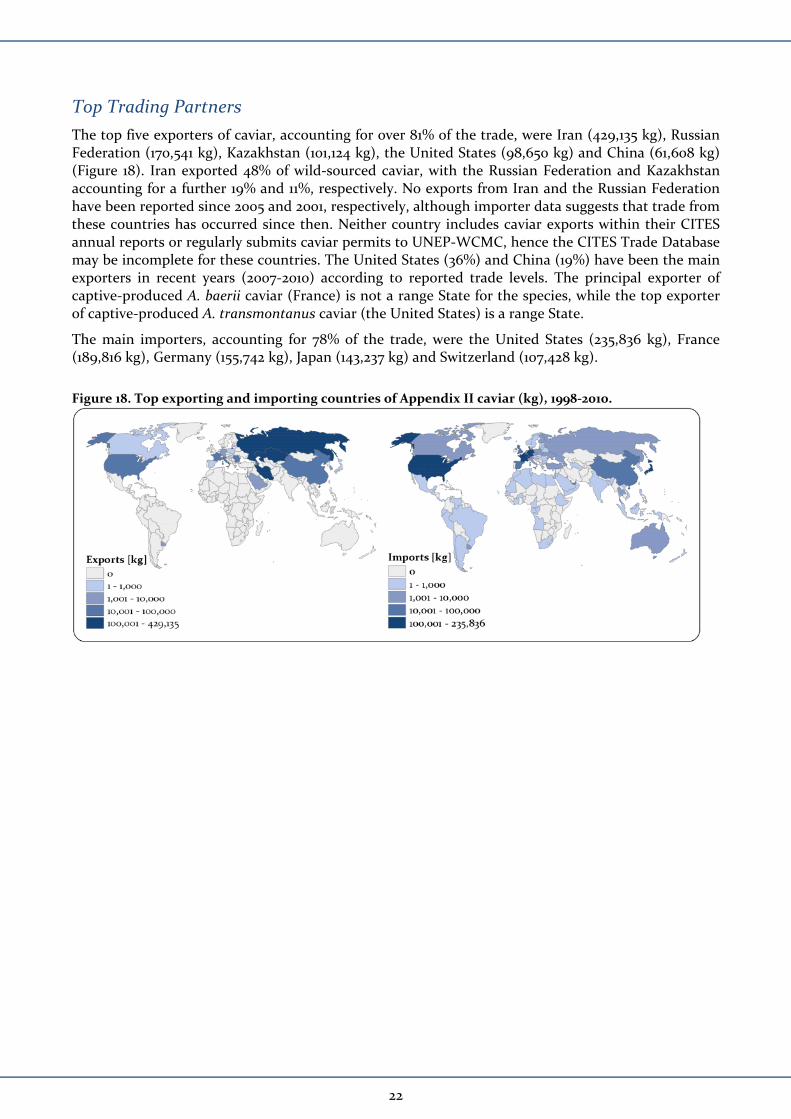
The top five exporters of caviar, accounting for over 81% of the trade, were Iran (429,135 kg), Russian Federation (170,541 kg), Kazakhstan (101,124 kg), the United States (98,650 kg) and China (61,608 kg) (Figure 18). Iran exported 48% of wild‐sourced caviar, with the Russian Federation and Kazakhstan accounting for a further 19% and 11%, respectively. No exports from Iran and the Russian Federation have been reported since 2005 and 2001, respectively, although importer data suggests that trade from these countries has occurred since then. Neither country includes caviar exports within their CITES annual reports or regularly submits caviar permits to UNEP‐WCMC, hence the CITES Trade Database may be incomplete for these countries. The United States (36%) and China (19%) have been the main exporters in recent years (2007‐2010) according to reported trade levels. The principal exporter of captive‐produced A. baerii caviar (France) is not a range State for the species, while the top exporter of captive‐produced A. transmontanus caviar (the United States) is a range State.
The main importers, accounting for 78% of the trade, were the United States (235,836 kg), France (189,816 kg), Germany (155,742 kg), Japan (143,237 kg) and Switzerland (107,428 kg).
Figure 18. Top exporting and importing countries of Appendix II caviar (kg), 1998‐2010.
22
Invertebrates
Trade in invertebrates covers a broad range of taxa and terms which are reported in many different ways. In order to facilitate a meaningful analysis in this section, trade in invertebrates is discussed according to the following categories: live invertebrates other than corals, invertebrate bodies and corals, including both raw corals and live corals.
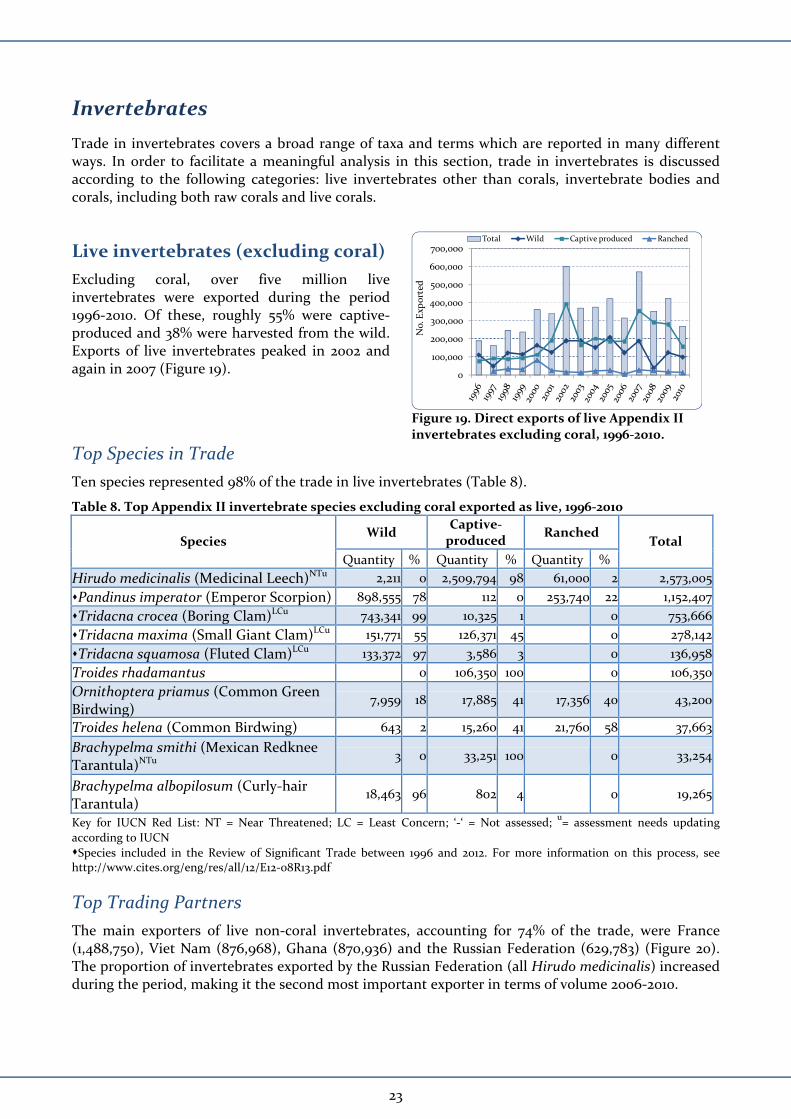
Live invertebrates (excluding coral)
Excluding coral, over five million live invertebrates were exported during the period 1996‐2010. Of these, roughly 55% were captive‐produced and 38% were harvested from the wild. Exports of live invertebrates peaked in 2002 and again in 2007 (Figure 19).
Top Species in Trade
Ten species represented 98% of the trade in live invertebrates (Table 8).
Table 8. Top Appendix II invertebrate species excluding coral exported as live, 1996‐2010
Wild Captive‐produced
Ranched Species
Quantity % Quantity % Quantity %
Total
Hirudo medicinalis (Medicinal Leech)NTu 2,211 0 2,509,794 98 61,000 2 2,573,005
Pandinus imperator (Emperor Scorpion) 898,555 78 112 0 253,740 22 1,152,407
Tridacna crocea (Boring Clam)LCu 743,341 99 10,325 1 0 753,666
Tridacna maxima (Small Giant Clam)LCu 151,771 55 126,371 45 0 278,142
Tridacna squamosa (Fluted Clam)LCu 133,372 97 3,586 3 0 136,958
Troides rhadamantus 0 106,350 100 0 106,350
Ornithoptera priamus (Common Green Birdwing)
7,959 18 17,885 41 17,356 40 43,200
Troides helena (Common Birdwing) 643 2 15,260 41 21,760 58 37,663
Brachypelma smithi (Mexican Redknee Tarantula)NTu 3 0 33,251 100 0 33,254
Brachypelma albopilosum (Curly‐hair Tarantula)
18,463 96 802 4 0 19,265
Key for IUCN Red List: NT = Near Threatened; LC = Least Concern; ‘‐‘ = Not assessed; u= assessment needs updating
according to IUCN
Species included in the Review of Significant Trade between 1996 and 2012. For more information on this process, see http://www.cites.org/eng/res/all/12/E12‐08R13.pdf
Top Trading Partners
The main exporters of live non‐coral invertebrates, accounting for 74% of the trade, were France (1,488,750), Viet Nam (876,968), Ghana (870,936) and the Russian Federation (629,783) (Figure 20). The proportion of invertebrates exported by the Russian Federation (all Hirudo medicinalis) increased during the period, making it the second most important exporter in terms of volume 2006‐2010.
0
100,000
200,000
300,000
400,000
500,000
600,000
700,000
No. Exp
orted
Total Wild Captive produced Ranched
Figure 19. Direct exports of live Appendix II invertebrates excluding coral, 1996‐2010.
23
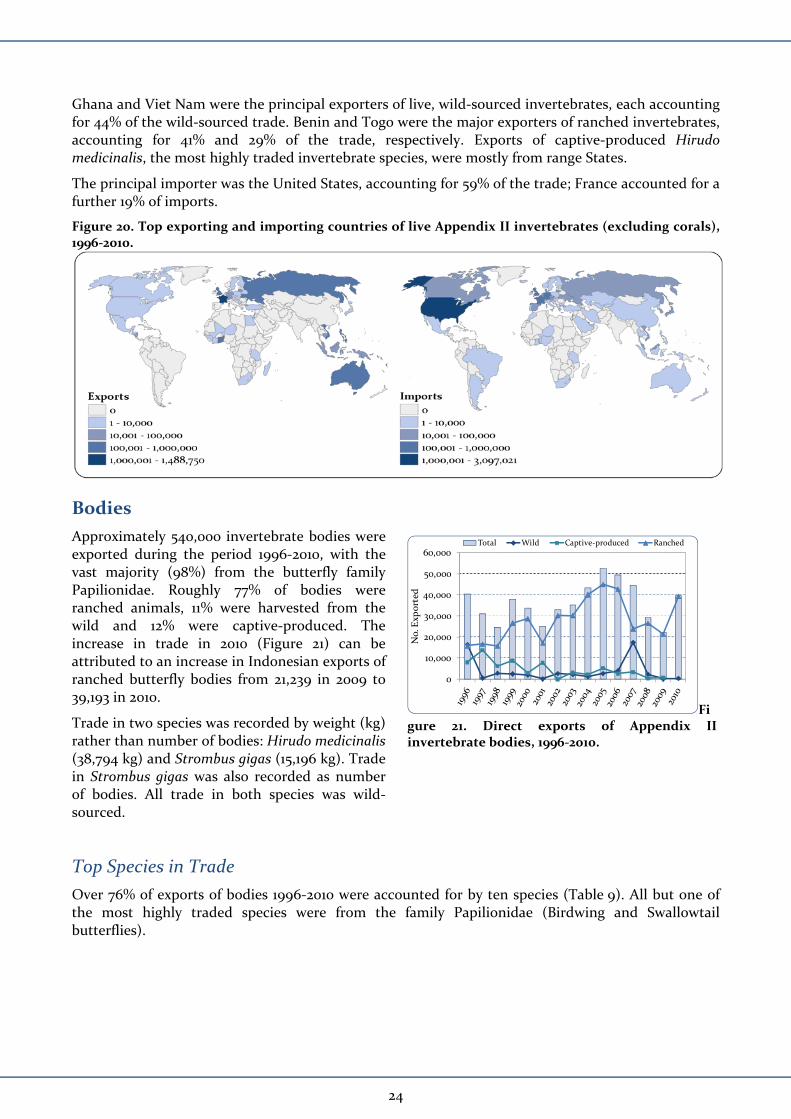
Ghana and Viet Nam were the principal exporters of live, wild‐sourced invertebrates, each accounting for 44% of the wild‐sourced trade. Benin and Togo were the major exporters of ranched invertebrates, accounting for 41% and 29% of the trade, respectively. Exports of captive‐produced Hirudo medicinalis, the most highly traded invertebrate species, were mostly from range States.
The principal importer was the United States, accounting for 59% of the trade; France accounted for a further 19% of imports.
Figure 20. Top exporting and importing countries of live Appendix II invertebrates (excluding corals), 1996‐2010.
Bodies
Approximately 540,000 invertebrate bodies were exported during the period 1996‐2010, with the vast majority (98%) from the butterfly family Papilionidae. Roughly 77% of bodies were ranched animals, 11% were harvested from the wild and 12% were captive‐produced. The increase in trade in 2010 (Figure 21) can be attributed to an increase in Indonesian exports of ranched butterfly bodies from 21,239 in 2009 to 39,193 in 2010.
Trade in two species was recorded by weight (kg) rather than number of bodies: Hirudo medicinalis (38,794 kg) and Strombus gigas (15,196 kg). Trade in Strombus gigas was also recorded as number of bodies. All trade in both species was wild‐sourced.
Top Species in Trade
Over 76% of exports of bodies 1996‐2010 were accounted for by ten species (Table 9). All but one of the most highly traded species were from the family Papilionidae (Birdwing and Swallowtail butterflies).
0
10,000
20,000
30,000
40,000
50,000
60,000
No. Exp
orted
Total Wild Captive‐produced Ranched
Figure 21. Direct exports of Appendix II invertebrate bodies, 1996‐2010.
24
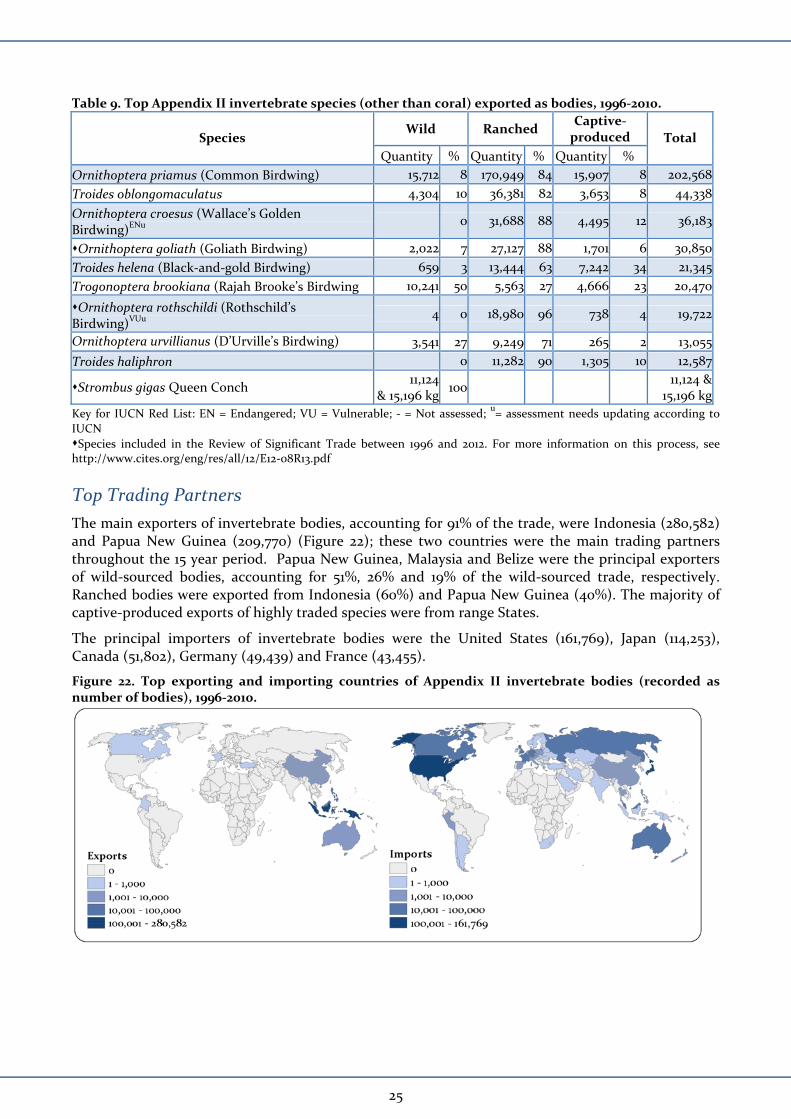
Table 9. Top Appendix II invertebrate species (other than coral) exported as bodies, 1996‐2010.
Wild Ranched Captive‐produced Species
Quantity % Quantity % Quantity %
Total
Ornithoptera priamus (Common Birdwing) 15,712 8 170,949 84 15,907 8 202,568
Troides oblongomaculatus 4,304 10 36,381 82 3,653 8 44,338
Ornithoptera croesus (Wallace’s Golden Birdwing)ENu 0 31,688 88 4,495 12 36,183
Ornithoptera goliath (Goliath Birdwing) 2,022 7 27,127 88 1,701 6 30,850
Troides helena (Black‐and‐gold Birdwing) 659 3 13,444 63 7,242 34 21,345
Trogonoptera brookiana (Rajah Brooke’s Birdwing 10,241 50 5,563 27 4,666 23 20,470
Ornithoptera rothschildi (Rothschild’s Birdwing)VUu
4 0 18,980 96 738 4 19,722
Ornithoptera urvillianus (D’Urville’s Birdwing) 3,541 27 9,249 71 265 2 13,055
Troides haliphron 0 11,282 90 1,305 10 12,587
Strombus gigas Queen Conch 11,124
& 15,196 kg 100
11,124 & 15,196 kg
Key for IUCN Red List: EN = Endangered; VU = Vulnerable; ‐ = Not assessed; u= assessment needs updating according to
IUCN
Species included in the Review of Significant Trade between 1996 and 2012. For more information on this process, see http://www.cites.org/eng/res/all/12/E12‐08R13.pdf
Top Trading Partners
The main exporters of invertebrate bodies, accounting for 91% of the trade, were Indonesia (280,582) and Papua New Guinea (209,770) (Figure 22); these two countries were the main trading partners throughout the 15 year period. Papua New Guinea, Malaysia and Belize were the principal exporters of wild‐sourced bodies, accounting for 51%, 26% and 19% of the wild‐sourced trade, respectively. Ranched bodies were exported from Indonesia (60%) and Papua New Guinea (40%). The majority of captive‐produced exports of highly traded species were from range States.
The principal importers of invertebrate bodies were the United States (161,769), Japan (114,253), Canada (51,802), Germany (49,439) and France (43,455).
Figure 22. Top exporting and importing countries of Appendix II invertebrate bodies (recorded as number of bodies), 1996‐2010.
25
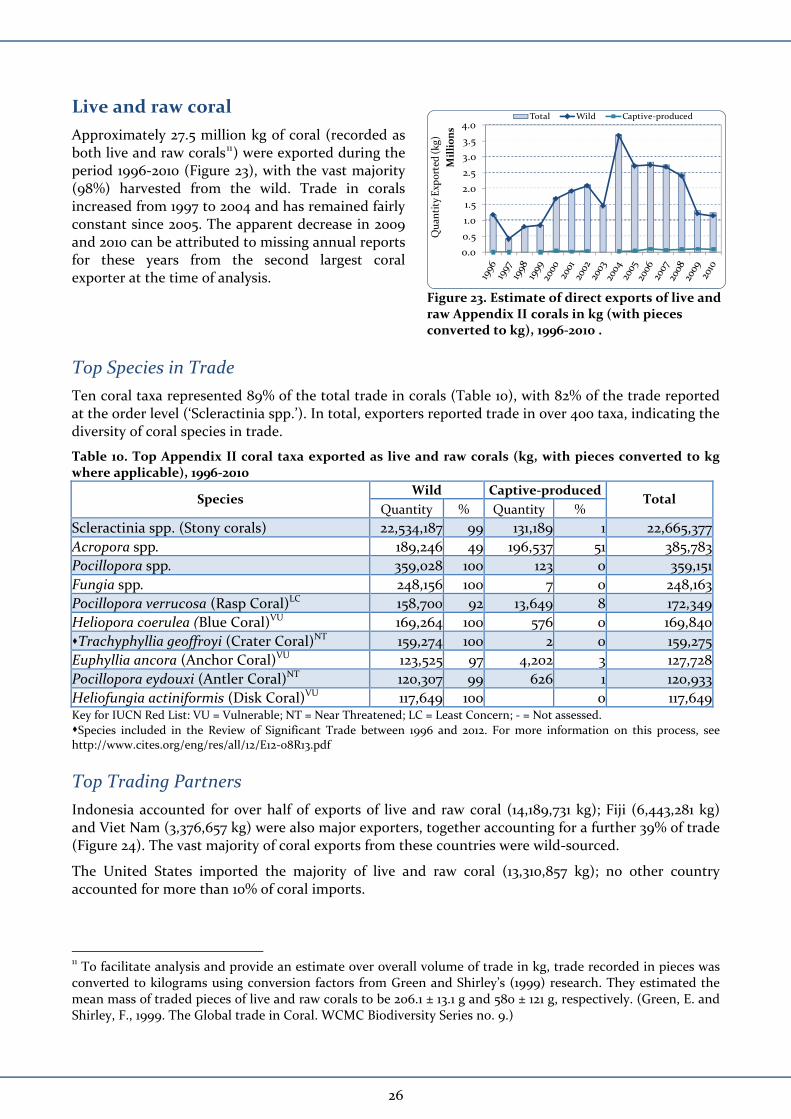
Live and raw coral
Approximately 27.5 million kg of coral (recorded as both live and raw corals11) were exported during the period 1996‐2010 (Figure 23), with the vast majority (98%) harvested from the wild. Trade in corals increased from 1997 to 2004 and has remained fairly constant since 2005. The apparent decrease in 2009 and 2010 can be attributed to missing annual reports for these years from the second largest coral exporter at the time of analysis.
Top Species in Trade
Ten coral taxa represented 89% of the total trade in corals (Table 10), with 82% of the trade reported at the order level (‘Scleractinia spp.’). In total, exporters reported trade in over 400 taxa, indicating the diversity of coral species in trade.
Table 10. Top Appendix II coral taxa exported as live and raw corals (kg, with pieces converted to kg where applicable), 1996‐2010
Wild Captive‐produced Species
Quantity % Quantity % Total
Scleractinia spp. (Stony corals) 22,534,187 99 131,189 1 22,665,377
Acropora spp. 189,246 49 196,537 51 385,783
Pocillopora spp. 359,028 100 123 0 359,151
Fungia spp. 248,156 100 7 0 248,163
Pocillopora verrucosa (Rasp Coral)LC 158,700 92 13,649 8 172,349
Heliopora coerulea (Blue Coral)VU 169,264 100 576 0 169,840
Trachyphyllia geoffroyi (Crater Coral)NT 159,274 100 2 0 159,275
Euphyllia ancora (Anchor Coral)VU 123,525 97 4,202 3 127,728
Pocillopora eydouxi (Antler Coral)NT 120,307 99 626 1 120,933
Heliofungia actiniformis (Disk Coral)VU 117,649 100 0 117,649 Key for IUCN Red List: VU = Vulnerable; NT = Near Threatened; LC = Least Concern; ‐ = Not assessed.
Species included in the Review of Significant Trade between 1996 and 2012. For more information on this process, see http://www.cites.org/eng/res/all/12/E12‐08R13.pdf
Top Trading Partners
Indonesia accounted for over half of exports of live and raw coral (14,189,731 kg); Fiji (6,443,281 kg) and Viet Nam (3,376,657 kg) were also major exporters, together accounting for a further 39% of trade (Figure 24). The vast majority of coral exports from these countries were wild‐sourced.
The United States imported the majority of live and raw coral (13,310,857 kg); no other country accounted for more than 10% of coral imports.
11 To facilitate analysis and provide an estimate over overall volume of trade in kg, trade recorded in pieces was converted to kilograms using conversion factors from Green and Shirley’s (1999) research. They estimated the mean mass of traded pieces of live and raw corals to be 206.1 ± 13.1 g and 580 ± 121 g, respectively. (Green, E. and Shirley, F., 1999. The Global trade in Coral. WCMC Biodiversity Series no. 9.)
0.0
0.5
1.0
1.5
2.0
2.5
3.0
3.5
4.0
Quan
tity Exp
orted (kg)
Millions
Total Wild Captive‐produced
Figure 23. Estimate of direct exports of live and raw Appendix II corals in kg (with pieces converted to kg), 1996‐2010 .
26
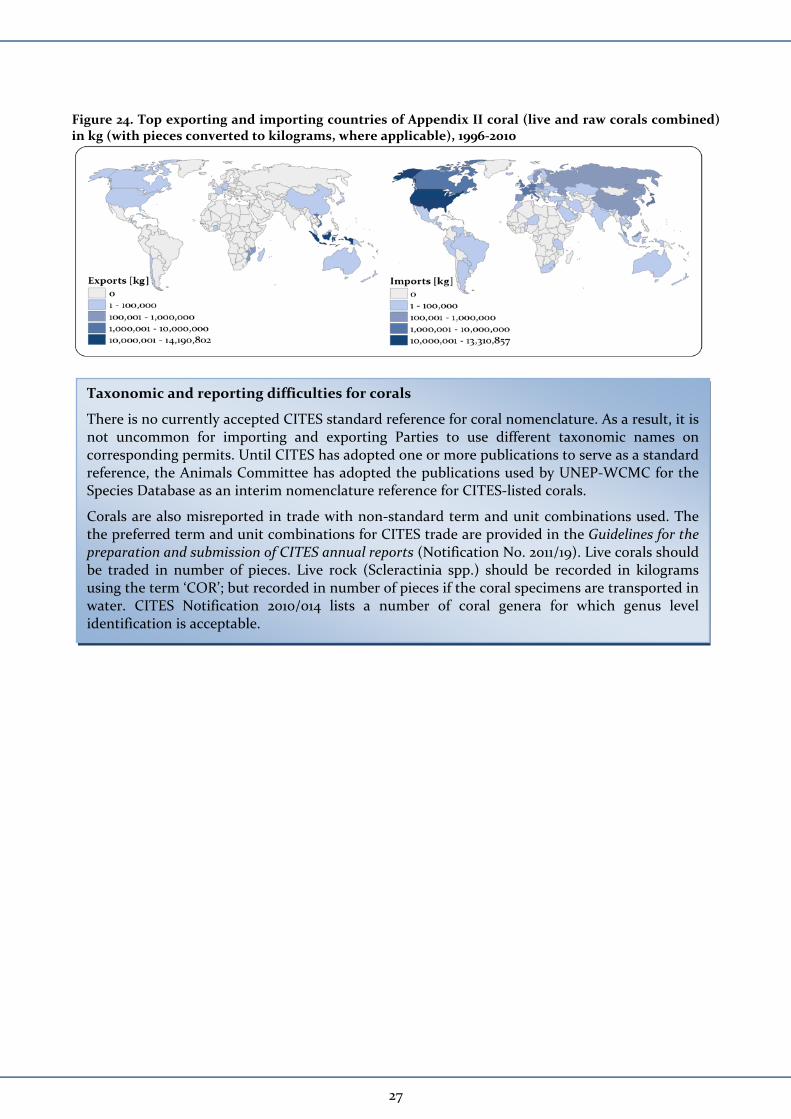
Figure 24. Top exporting and importing countries of Appendix II coral (live and raw corals combined) in kg (with pieces converted to kilograms, where applicable), 1996‐2010
Taxonomic and reporting difficulties for corals
There is no currently accepted CITES standard reference for coral nomenclature. As a result, it is not uncommon for importing and exporting Parties to use different taxonomic names on corresponding permits. Until CITES has adopted one or more publications to serve as a standard reference, the Animals Committee has adopted the publications used by UNEP‐WCMC for the Species Database as an interim nomenclature reference for CITES‐listed corals.
Corals are also misreported in trade with non‐standard term and unit combinations used. The the preferred term and unit combinations for CITES trade are provided in the Guidelines for the preparation and submission of CITES annual reports (Notification No. 2011/19). Live corals should be traded in number of pieces. Live rock (Scleractinia spp.) should be recorded in kilograms using the term ‘COR’; but recorded in number of pieces if the coral specimens are transported in water. CITES Notification 2010/014 lists a number of coral genera for which genus level identification is acceptable.
27
Plants
Live Plants
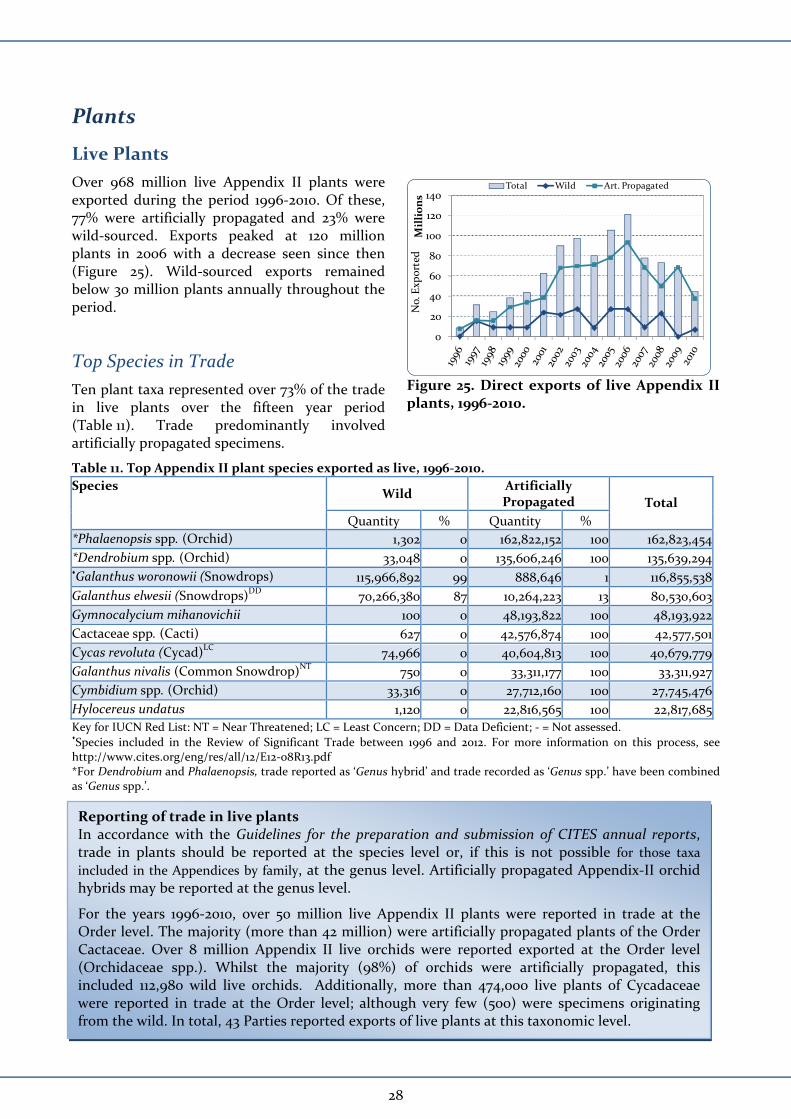
Over 968 million live Appendix II plants were exported during the period 1996‐2010. Of these, 77% were artificially propagated and 23% were wild‐sourced. Exports peaked at 120 million plants in 2006 with a decrease seen since then (Figure 25). Wild‐sourced exports remained below 30 million plants annually throughout the period.
Top Species in Trade
Ten plant taxa represented over 73% of the trade in live plants over the fifteen year period (Table 11). Trade predominantly involved artificially propagated specimens.
Table 11. Top Appendix II plant species exported as live, 1996‐2010.
Wild Artificially Propagated
Species
Quantity % Quantity %
Total
*Phalaenopsis spp. (Orchid) 1,302 0 162,822,152 100 162,823,454
*Dendrobium spp. (Orchid) 33,048 0 135,606,246 100 135,639,294 Galanthus woronowii (Snowdrops) 115,966,892 99 888,646 1 116,855,538
Galanthus elwesii (Snowdrops)DD 70,266,380 87 10,264,223 13 80,530,603
Gymnocalycium mihanovichii 100 0 48,193,822 100 48,193,922
Cactaceae spp. (Cacti) 627 0 42,576,874 100 42,577,501
Cycas revoluta (Cycad)LC 74,966 0 40,604,813 100 40,679,779
Galanthus nivalis (Common Snowdrop)NT 750 0 33,311,177 100 33,311,927
Cymbidium spp. (Orchid) 33,316 0 27,712,160 100 27,745,476
Hylocereus undatus 1,120 0 22,816,565 100 22,817,685
Key for IUCN Red List: NT = Near Threatened; LC = Least Concern; DD = Data Deficient; ‐ = Not assessed. Species included in the Review of Significant Trade between 1996 and 2012. For more information on this process, see http://www.cites.org/eng/res/all/12/E12‐08R13.pdf *For Dendrobium and Phalaenopsis, trade reported as ‘Genus hybrid’ and trade recorded as ‘Genus spp.’ have been combined as ‘Genus spp.’.
0
20
40
60
80
100
120
140
No. Exp
orted
Millions
Total Wild Art. Propagated
Figure 25. Direct exports of live Appendix II plants, 1996‐2010.
Reporting of trade in live plants In accordance with the Guidelines for the preparation and submission of CITES annual reports, trade in plants should be reported at the species level or, if this is not possible for those taxa included in the Appendices by family, at the genus level. Artificially propagated Appendix‐II orchid hybrids may be reported at the genus level.
For the years 1996‐2010, over 50 million live Appendix II plants were reported in trade at the Order level. The majority (more than 42 million) were artificially propagated plants of the Order Cactaceae. Over 8 million Appendix II live orchids were reported exported at the Order level (Orchidaceae spp.). Whilst the majority (98%) of orchids were artificially propagated, this included 112,980 wild live orchids. Additionally, more than 474,000 live plants of Cycadaceae were reported in trade at the Order level; although very few (500) were specimens originating from the wild. In total, 43 Parties reported exports of live plants at this taxonomic level.
28
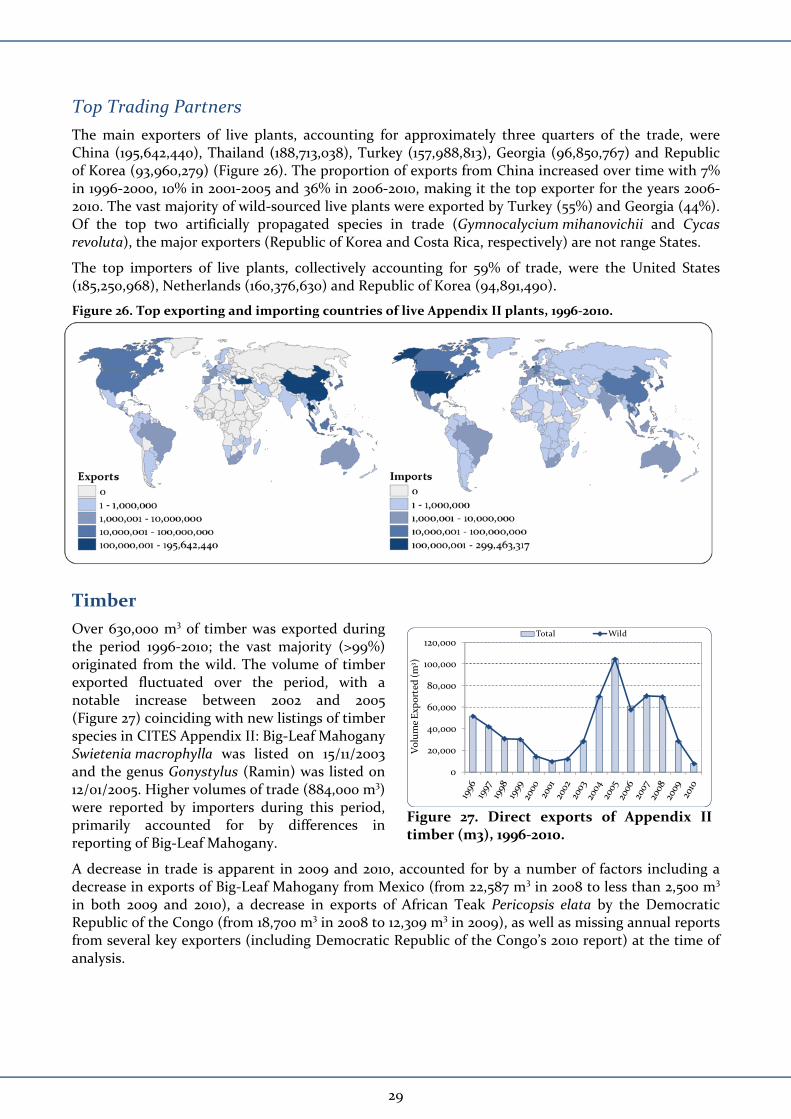
Top Trading Partners
The main exporters of live plants, accounting for approximately three quarters of the trade, were China (195,642,440), Thailand (188,713,038), Turkey (157,988,813), Georgia (96,850,767) and Republic of Korea (93,960,279) (Figure 26). The proportion of exports from China increased over time with 7% in 1996‐2000, 10% in 2001‐2005 and 36% in 2006‐2010, making it the top exporter for the years 2006‐2010. The vast majority of wild‐sourced live plants were exported by Turkey (55%) and Georgia (44%). Of the top two artificially propagated species in trade (Gymnocalycium mihanovichii and Cycas revoluta), the major exporters (Republic of Korea and Costa Rica, respectively) are not range States.
The top importers of live plants, collectively accounting for 59% of trade, were the United States (185,250,968), Netherlands (160,376,630) and Republic of Korea (94,891,490).
Figure 26. Top exporting and importing countries of live Appendix II plants, 1996‐2010.
Timber
Over 630,000 m3 of timber was exported during the period 1996‐2010; the vast majority (>99%) originated from the wild. The volume of timber exported fluctuated over the period, with a notable increase between 2002 and 2005 (Figure 27) coinciding with new listings of timber species in CITES Appendix II: Big‐Leaf Mahogany Swietenia macrophylla was listed on 15/11/2003 and the genus Gonystylus (Ramin) was listed on 12/01/2005. Higher volumes of trade (884,000 m3) were reported by importers during this period, primarily accounted for by differences in reporting of Big‐Leaf Mahogany.
A decrease in trade is apparent in 2009 and 2010, accounted for by a number of factors including a decrease in exports of Big‐Leaf Mahogany from Mexico (from 22,587 m3 in 2008 to less than 2,500 m3 in both 2009 and 2010), a decrease in exports of African Teak Pericopsis elata by the Democratic Republic of the Congo (from 18,700 m3 in 2008 to 12,309 m3 in 2009), as well as missing annual reports from several key exporters (including Democratic Republic of the Congo’s 2010 report) at the time of analysis.
0
20,000
40,000
60,000
80,000
100,000
120,000
Volume Exp
orted (m
3)
Total Wild
Figure 27. Direct exports of Appendix II timber (m3), 1996‐2010.
29
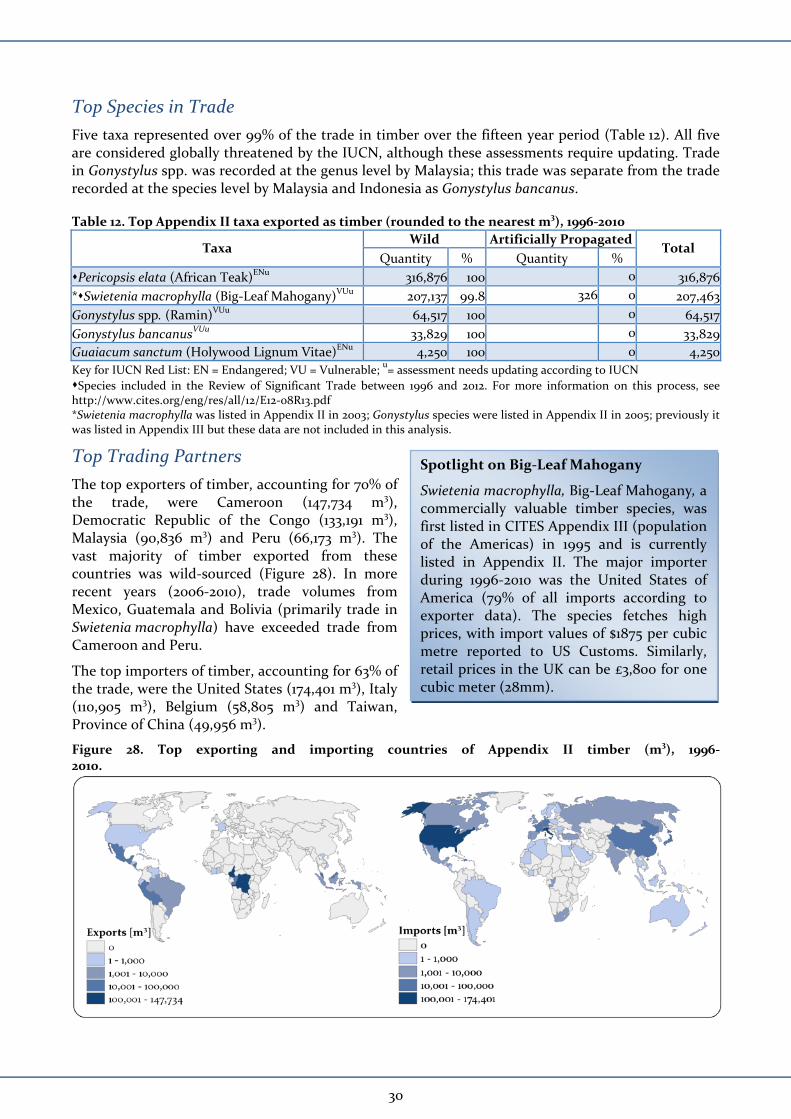
Top Species in Trade
Five taxa represented over 99% of the trade in timber over the fifteen year period (Table 12). All five are considered globally threatened by the IUCN, although these assessments require updating. Trade in Gonystylus spp. was recorded at the genus level by Malaysia; this trade was separate from the trade recorded at the species level by Malaysia and Indonesia as Gonystylus bancanus. Table 12. Top Appendix II taxa exported as timber (rounded to the nearest m3), 1996‐2010
Wild Artificially Propagated Taxa
Quantity % Quantity % Total
Pericopsis elata (African Teak)ENu 316,876 100 0 316,876
*Swietenia macrophylla (Big‐Leaf Mahogany)VUu 207,137 99.8 326 0 207,463
Gonystylus spp. (Ramin)VUu 64,517 100 0 64,517
Gonystylus bancanusVUu 33,829 100 0 33,829
Guaiacum sanctum (Holywood Lignum Vitae)ENu 4,250 100 0 4,250
Key for IUCN Red List: EN = Endangered; VU = Vulnerable; u= assessment needs updating according to IUCN
Species included in the Review of Significant Trade between 1996 and 2012. For more information on this process, see http://www.cites.org/eng/res/all/12/E12‐08R13.pdf *Swietenia macrophylla was listed in Appendix II in 2003; Gonystylus species were listed in Appendix II in 2005; previously it was listed in Appendix III but these data are not included in this analysis.
Top Trading Partners
The top exporters of timber, accounting for 70% of the trade, were Cameroon (147,734 m3), Democratic Republic of the Congo (133,191 m3), Malaysia (90,836 m3) and Peru (66,173 m3). The vast majority of timber exported from these countries was wild‐sourced (Figure 28). In more recent years (2006‐2010), trade volumes from Mexico, Guatemala and Bolivia (primarily trade in Swietenia macrophylla) have exceeded trade from Cameroon and Peru.
The top importers of timber, accounting for 63% of the trade, were the United States (174,401 m3), Italy (110,905 m3), Belgium (58,805 m3) and Taiwan, Province of China (49,956 m3).
Figure 28. Top exporting and importing countries of Appendix II timber (m3), 1996‐2010.
Spotlight on Big‐Leaf Mahogany
Swietenia macrophylla, Big‐Leaf Mahogany, a commercially valuable timber species, was first listed in CITES Appendix III (population of the Americas) in 1995 and is currently listed in Appendix II. The major importer during 1996‐2010 was the United States of America (79% of all imports according to exporter data). The species fetches high prices, with import values of $1875 per cubic metre reported to US Customs. Similarly, retail prices in the UK can be £3,800 for one cubic meter (28mm).
30
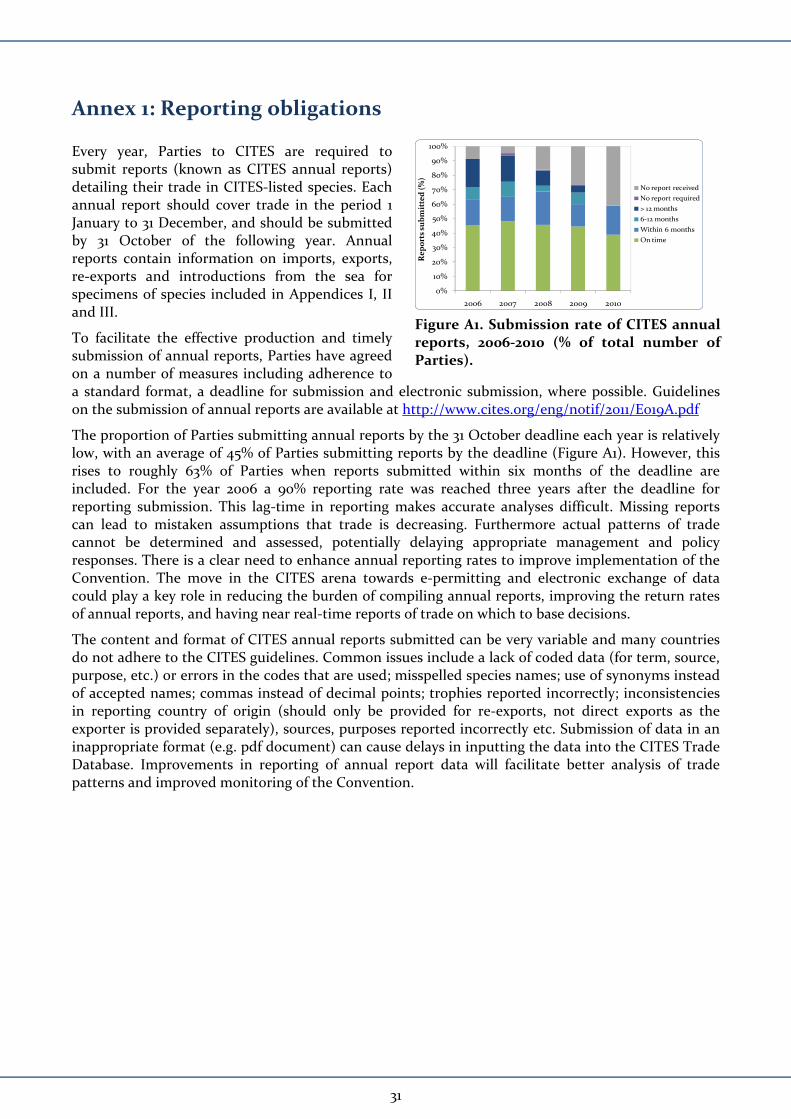
Annex 1: Reporting obligations
0%
10%
20%
30%
40%
50%
60%
70%
80%
90%
100%
2006 2007 2008 2009 2010
Reports su
bmitted (%)
No report received
No report required
> 12 months
6‐12 months
Within 6 months
On time
Figure A1. Submission rate of CITES annual reports, 2006‐2010 (% of total number of Parties).
Every year, Parties to CITES are required to submit reports (known as CITES annual reports) detailing their trade in CITES‐listed species. Each annual report should cover trade in the period 1 January to 31 December, and should be submitted by 31 October of the following year. Annual reports contain information on imports, exports, re‐exports and introductions from the sea for specimens of species included in Appendices I, II and III.
To facilitate the effective production and timely submission of annual reports, Parties have agreed on a number of measures including adherence to a standard format, a deadline for submission and electronic submission, where possible. Guidelines on the submission of annual reports are available at http://www.cites.org/eng/notif/2011/E019A.pdf
The proportion of Parties submitting annual reports by the 31 October deadline each year is relatively low, with an average of 45% of Parties submitting reports by the deadline (Figure A1). However, this rises to roughly 63% of Parties when reports submitted within six months of the deadline are included. For the year 2006 a 90% reporting rate was reached three years after the deadline for reporting submission. This lag‐time in reporting makes accurate analyses difficult. Missing reports can lead to mistaken assumptions that trade is decreasing. Furthermore actual patterns of trade cannot be determined and assessed, potentially delaying appropriate management and policy responses. There is a clear need to enhance annual reporting rates to improve implementation of the Convention. The move in the CITES arena towards e‐permitting and electronic exchange of data could play a key role in reducing the burden of compiling annual reports, improving the return rates of annual reports, and having near real‐time reports of trade on which to base decisions.
The content and format of CITES annual reports submitted can be very variable and many countries do not adhere to the CITES guidelines. Common issues include a lack of coded data (for term, source, purpose, etc.) or errors in the codes that are used; misspelled species names; use of synonyms instead of accepted names; commas instead of decimal points; trophies reported incorrectly; inconsistencies in reporting country of origin (should only be provided for re‐exports, not direct exports as the exporter is provided separately), sources, purposes reported incorrectly etc. Submission of data in an inappropriate format (e.g. pdf document) can cause delays in inputting the data into the CITES Trade Database. Improvements in reporting of annual report data will facilitate better analysis of trade patterns and improved monitoring of the Convention.
31
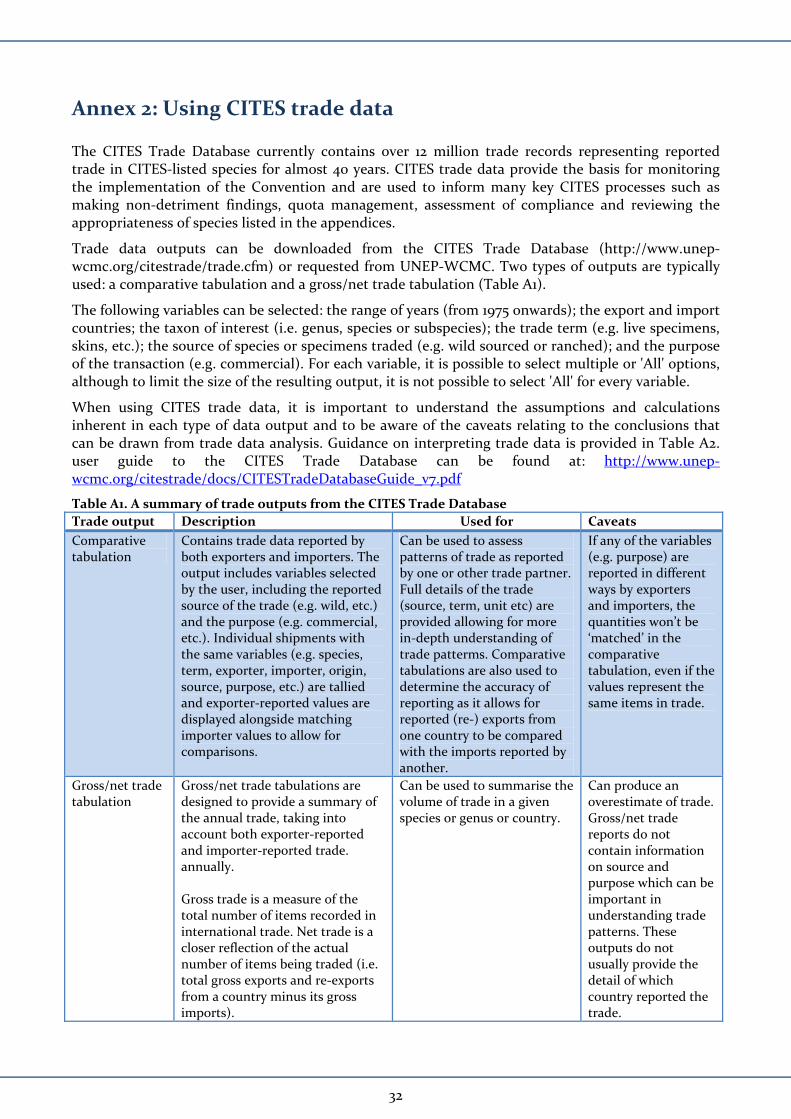
Annex 2: Using CITES trade data
The CITES Trade Database currently contains over 12 million trade records representing reported trade in CITES‐listed species for almost 40 years. CITES trade data provide the basis for monitoring the implementation of the Convention and are used to inform many key CITES processes such as making non‐detriment findings, quota management, assessment of compliance and reviewing the appropriateness of species listed in the appendices.
Trade data outputs can be downloaded from the CITES Trade Database (http://www.unep‐wcmc.org/citestrade/trade.cfm) or requested from UNEP‐WCMC. Two types of outputs are typically used: a comparative tabulation and a gross/net trade tabulation (Table A1).
The following variables can be selected: the range of years (from 1975 onwards); the export and import countries; the taxon of interest (i.e. genus, species or subspecies); the trade term (e.g. live specimens, skins, etc.); the source of species or specimens traded (e.g. wild sourced or ranched); and the purpose of the transaction (e.g. commercial). For each variable, it is possible to select multiple or 'All' options, although to limit the size of the resulting output, it is not possible to select 'All' for every variable.
When using CITES trade data, it is important to understand the assumptions and calculations inherent in each type of data output and to be aware of the caveats relating to the conclusions that can be drawn from trade data analysis. Guidance on interpreting trade data is provided in Table A2. user guide to the CITES Trade Database can be found at: http://www.unep‐wcmc.org/citestrade/docs/CITESTradeDatabaseGuide_v7.pdf
Table A1. A summary of trade outputs from the CITES Trade Database
Trade output Description Used for Caveats
Comparative tabulation
Contains trade data reported by both exporters and importers. The output includes variables selected by the user, including the reported source of the trade (e.g. wild, etc.) and the purpose (e.g. commercial, etc.). Individual shipments with the same variables (e.g. species, term, exporter, importer, origin, source, purpose, etc.) are tallied and exporter‐reported values are displayed alongside matching importer values to allow for comparisons.
Can be used to assess patterns of trade as reported by one or other trade partner. Full details of the trade (source, term, unit etc) are provided allowing for more in‐depth understanding of trade patterms. Comparative tabulations are also used to determine the accuracy of reporting as it allows for reported (re‐) exports from one country to be compared with the imports reported by another.
If any of the variables (e.g. purpose) are reported in different ways by exporters and importers, the quantities won’t be ‘matched’ in the comparative tabulation, even if the values represent the same items in trade.
Gross/net trade tabulation
Gross/net trade tabulations are designed to provide a summary of the annual trade, taking into account both exporter‐reported and importer‐reported trade. annually. Gross trade is a measure of the total number of items recorded in international trade. Net trade is a closer reflection of the actual number of items being traded (i.e. total gross exports and re‐exports from a country minus its gross imports).
Can be used to summarise the volume of trade in a given species or genus or country.
Can produce an overestimate of trade. Gross/net trade reports do not contain information on source and purpose which can be important in understanding trade patterns. These outputs do not usually provide the detail of which country reported the trade.
32
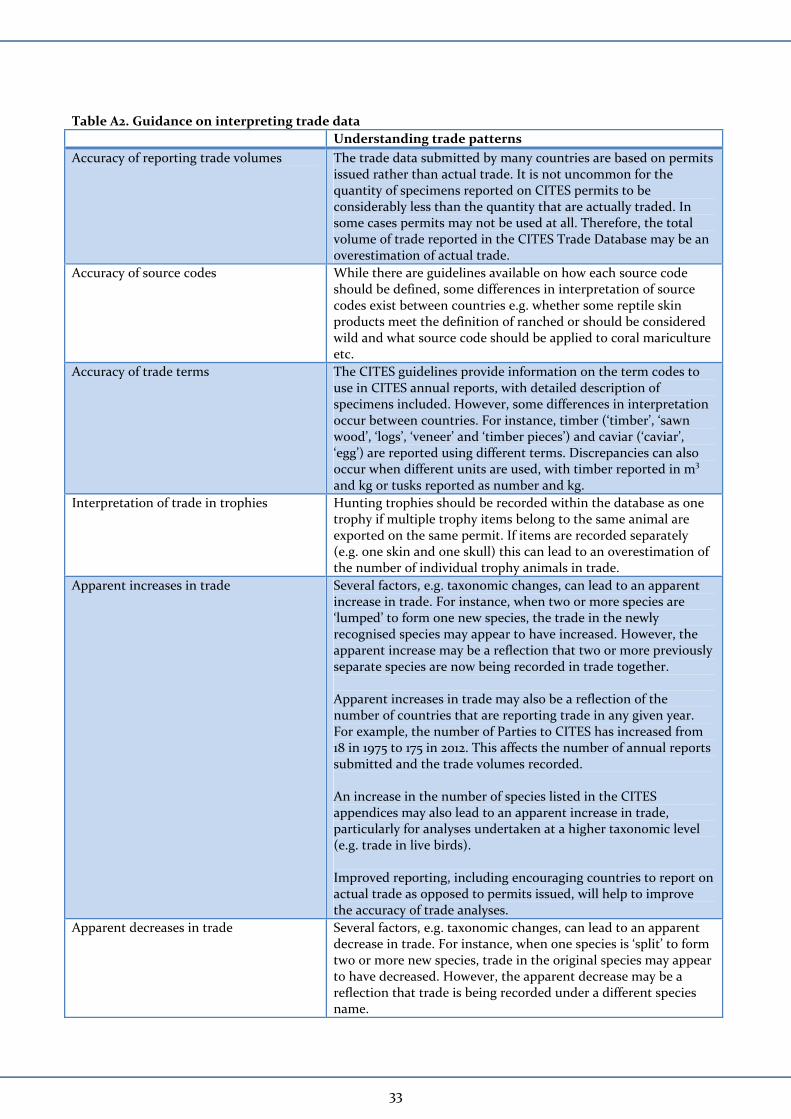
Table A2. Guidance on interpreting trade data
Understanding trade patterns
Accuracy of reporting trade volumes The trade data submitted by many countries are based on permits issued rather than actual trade. It is not uncommon for the quantity of specimens reported on CITES permits to be considerably less than the quantity that are actually traded. In some cases permits may not be used at all. Therefore, the total volume of trade reported in the CITES Trade Database may be an overestimation of actual trade.
Accuracy of source codes While there are guidelines available on how each source code should be defined, some differences in interpretation of source codes exist between countries e.g. whether some reptile skin products meet the definition of ranched or should be considered wild and what source code should be applied to coral mariculture etc.
Accuracy of trade terms The CITES guidelines provide information on the term codes to use in CITES annual reports, with detailed description of specimens included. However, some differences in interpretation occur between countries. For instance, timber (‘timber’, ‘sawn wood’, ‘logs’, ‘veneer’ and ‘timber pieces’) and caviar (‘caviar’, ‘egg’) are reported using different terms. Discrepancies can also occur when different units are used, with timber reported in m3
and kg or tusks reported as number and kg.
Interpretation of trade in trophies Hunting trophies should be recorded within the database as one trophy if multiple trophy items belong to the same animal are exported on the same permit. If items are recorded separately (e.g. one skin and one skull) this can lead to an overestimation of the number of individual trophy animals in trade.
Apparent increases in trade Several factors, e.g. taxonomic changes, can lead to an apparent increase in trade. For instance, when two or more species are ‘lumped’ to form one new species, the trade in the newly recognised species may appear to have increased. However, the apparent increase may be a reflection that two or more previously separate species are now being recorded in trade together. Apparent increases in trade may also be a reflection of the number of countries that are reporting trade in any given year. For example, the number of Parties to CITES has increased from 18 in 1975 to 175 in 2012. This affects the number of annual reports submitted and the trade volumes recorded. An increase in the number of species listed in the CITES appendices may also lead to an apparent increase in trade, particularly for analyses undertaken at a higher taxonomic level (e.g. trade in live birds). Improved reporting, including encouraging countries to report on actual trade as opposed to permits issued, will help to improve the accuracy of trade analyses.
Apparent decreases in trade Several factors, e.g. taxonomic changes, can lead to an apparent decrease in trade. For instance, when one species is ‘split’ to form two or more new species, trade in the original species may appear to have decreased. However, the apparent decrease may be a reflection that trade is being recorded under a different species name.
33
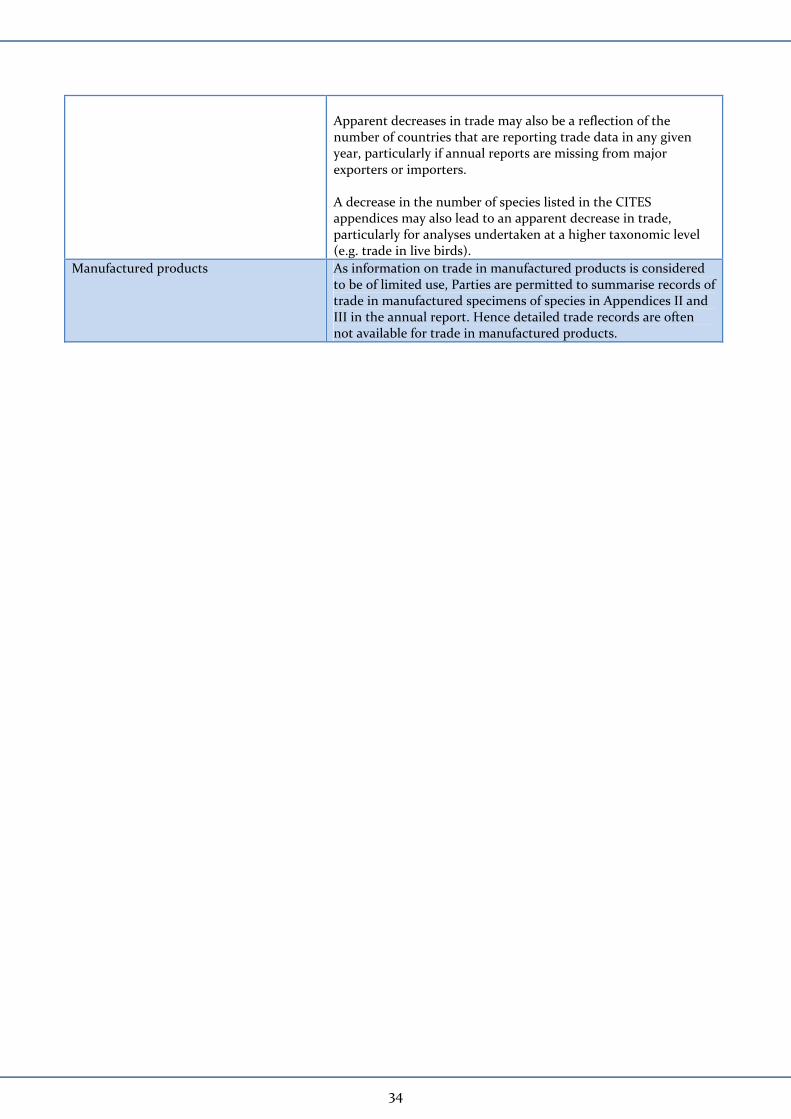
34
Apparent decreases in trade may also be a reflection of the number of countries that are reporting trade data in any given year, particularly if annual reports are missing from major exporters or importers. A decrease in the number of species listed in the CITES appendices may also lead to an apparent decrease in trade, particularly for analyses undertaken at a higher taxonomic level (e.g. trade in live birds).
Manufactured products As information on trade in manufactured products is considered to be of limited use, Parties are permitted to summarise records of trade in manufactured specimens of species in Appendices II and III in the annual report. Hence detailed trade records are often not available for trade in manufactured products.