Embed Size (px)
Citation preview
COORDINATION CHEMISTRY OF 3d-TRANSITION METALS OF SOME N,S/N,N DONOR SETS:
SYNTHESIS, CHARACTERIZATION, STRUCTURE AND REACTIVITY
SYNOPSIS
Submitted for the partial fulfilment of the requirements for the degree
of
Doctor of Philosophy in Science The University of Burdwan November - 2012
ANIMESH PATRA, M.Sc.
DEPARTMENT OF CHEMISTRY
THE UNIVERSITY OF BURDWAN
BURDWAN -713104
INDIA
ii
SYNOPSIS
The research field dealing with the transition metal complexes of the ligands having
N,S/N,S,O donor centers has expanded enormously during recent years. The interest is
due to the application of these chelates in modeling of biomolecules, in the field of
chemical and biological reactivity and in nuclear medicine. Nowadays it is a challenge
for the coordination chemists to design appropriate ligand frames with the purpose to
synthesize metal complexes with predetermined properties. The tetradentate/tridentate
N2S2/N,S,O environment and their 3d metal complexes are of current interest because of
their rich physicochemical properties, reactivity patterns, and potential applications in
many important chemical processes in the fields of medicine, bioorganic chemistry,
catalysis and electrochemical, organic solar cells and electrooptical sensors.
1,3-bis(2-pyridylmethylthio)alkane/toluene and salicylideneamino-dithiaalkane are
such type of ligands in which N,S and N,S,O donor centres exist respectively. Here,
1,3-bis(2-pyridylmethylthio)alkane/toluene organic moieties containing two borderline
base pyridine-N and two soft thioether-S donor centres act as tetradentate neutral N2S2
ligands and 1,8-bis(salicylideneamino)-3,6-dithiaoctane having hard donor imine-N and
phenolate-O, soft thioether S donor centres act as a tridentate dibasic/monobasic ligands.
In this thesis the synthesis, structure and reactivity of 3d metal ions with these ligands
have been explored. The characterization of the complexes have been carried out by
elemental analyses, conductance measurement, IR, UV-Vis, CV study and, in most of
the cases the detailed structural analysis has been established by single crystal X-ray
crystallography in terms of their bond length, bond angles etc.
Chapter I deals with a partial review of coordination chemistry of some 3d metal
ions with N,S and N,S,O donor sets. Open chain or macrocyclic ligands having different
types of organic backbone have been used to obtain transition metal complexes to
explore chemical and biological reactivities in terms of electron exchange properties.
The environments of the donor sets have been discussed to point out the donor
behaviour. For this purpose to explore the factors which govern the coordination
behaviour towards 3d metal ions and pharmacological applications of the resulting
complexes, the reactivities of benzothiazole, 2-aminobenzothiazoles, 2-amino-5,7-
disubstituted benzothiazoles, 2-pyrrolylthiones, 2-mercaptobenzothiazole, pyrazole–
thioether, mercatoamine, 2-formylpyridine thiosemicarbazone, 2-acetylpyridine
iii
thiosemi-carbazone towards transition metals, particularly 3d metal ions have been
discussed in details.
Chapter II describes the synthesis, spectral, structural characterization of the
[Fe(II)(L1)Cl2] (1),[Co(II)(L1)Cl2] (2) and [Ni(II)(L1)Cl2] (3) [where L1 = 1,3-bis(2-
pyridylmethylthio)propane], were synthesized and isolated in their pure form and along
with the reactivity of complexes. The solid state structures of complexes [Fe(II)(L1)Cl2]
(1) and[Ni(II)(L1)Cl2] (3) have been established by single crystal X-ray crystallography.
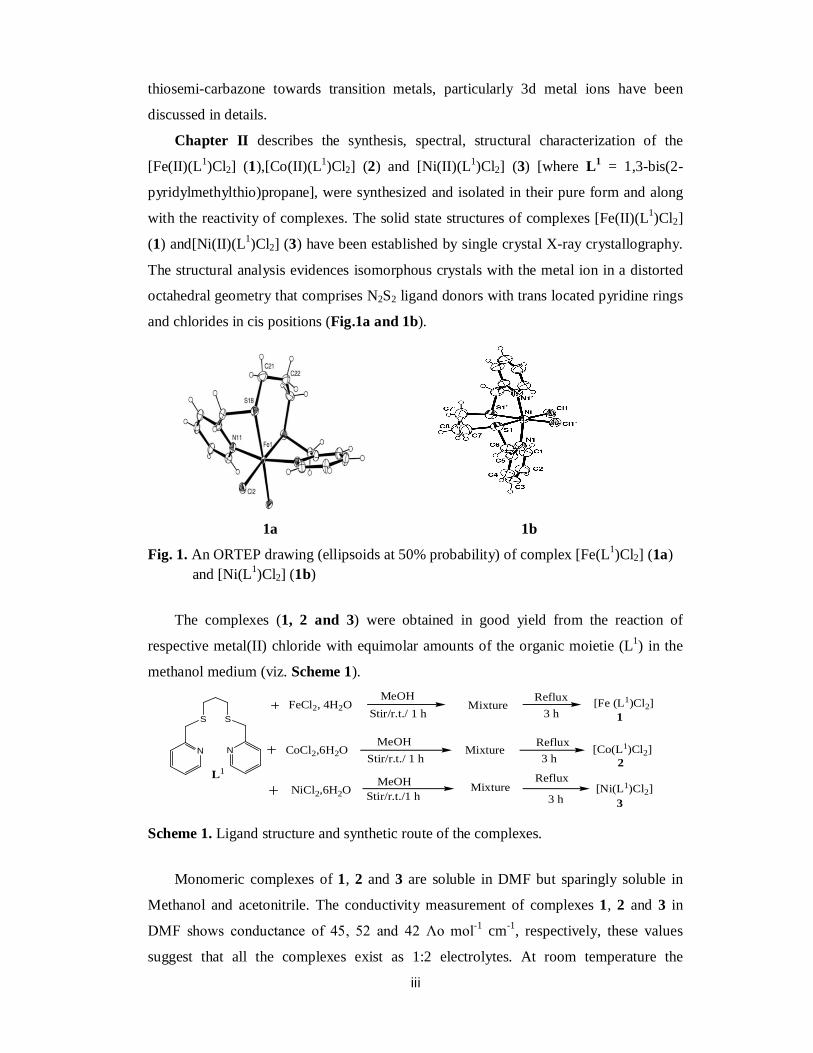
The structural analysis evidences isomorphous crystals with the metal ion in a distorted
octahedral geometry that comprises N2S2 ligand donors with trans located pyridine rings
and chlorides in cis positions (Fig.1a and 1b).
1a 1b
Fig. 1. An ORTEP drawing (ellipsoids at 50% probability) of complex [Fe(L1)Cl2] (1a) and [Ni(L1)Cl2] (1b)
The complexes (1, 2 and 3) were obtained in good yield from the reaction of
respective metal(II) chloride with equimolar amounts of the organic moietie (L1) in the
methanol medium (viz. Scheme 1).
Scheme 1. Ligand structure and synthetic route of the complexes.
Monomeric complexes of 1, 2 and 3 are soluble in DMF but sparingly soluble in
Methanol and acetonitrile. The conductivity measurement of complexes 1, 2 and 3 in
DMF shows conductance of 45, 52 and 42 Λo mol-1 cm-1, respectively, these values
suggest that all the complexes exist as 1:2 electrolytes. At room temperature the
S S
N N
L1
FeCl2, 4H2OStir/r.t./ 1 h
MeOHMixture
Reflux3 h
[Fe (L1)Cl2]
Stir/r.t./ 1 hMeOH
MixtureReflux3 h
[Co(L1)Cl2]
MeOHStir/r.t./1 h
MixtureReflux
3 h[Ni(L1)Cl2]
2
3NiCl2,6H2O
1
CoCl2,6H2O
iv
magnetic moment () of all the complexes are 5.45, 4.91 and 3.08 B.M. which are
equivalent to four, three and one unpaired electron, as expected, in each case. Infrared
spectral data of all the complexes 1-3 exhibit an intense band at 1468- 1472 cm-1
indicate C=N band for all the complexes and in addition to the C-S at 760cm-1. The (Fe –
Cl,Co-Cl and Ni-Cl band is observed at 362, 327 and 285 cm-1 respectively. The electronic
absorption spectra of complexes 1–3 were recorded at room temperature using
dimethylformamide as the solvent. All the spectra in the high energy region (below 400
nm) exhibit bands corresponding to intramolecular * and n * transitions.
In the electronic spectrum of [Fe(L1)Cl2], a prominent peak around 475 nm with a
shoulder at about 752 nm was observed, corresponding to MLCT and d–d transitions,
respectively. The electronic spectrum of 2 shows bands at 425, 560 and 967 nm,
assignable to the transitions 4T1g4T1g(P), 4T1g4A2g(F) and 4T1g4T2g(F),
respectively. The position of these bands indicates an octahedral geometry about the
CoII ion. The spectrum of 3 exhibits bands at 475, 685 and 873 nm, which may be
assigned to 3A2g(F) 3T1g(P), 3A2g(F) 3T1g(F) and 3A2g(F) 3T2g(F) transitions,
respectively.
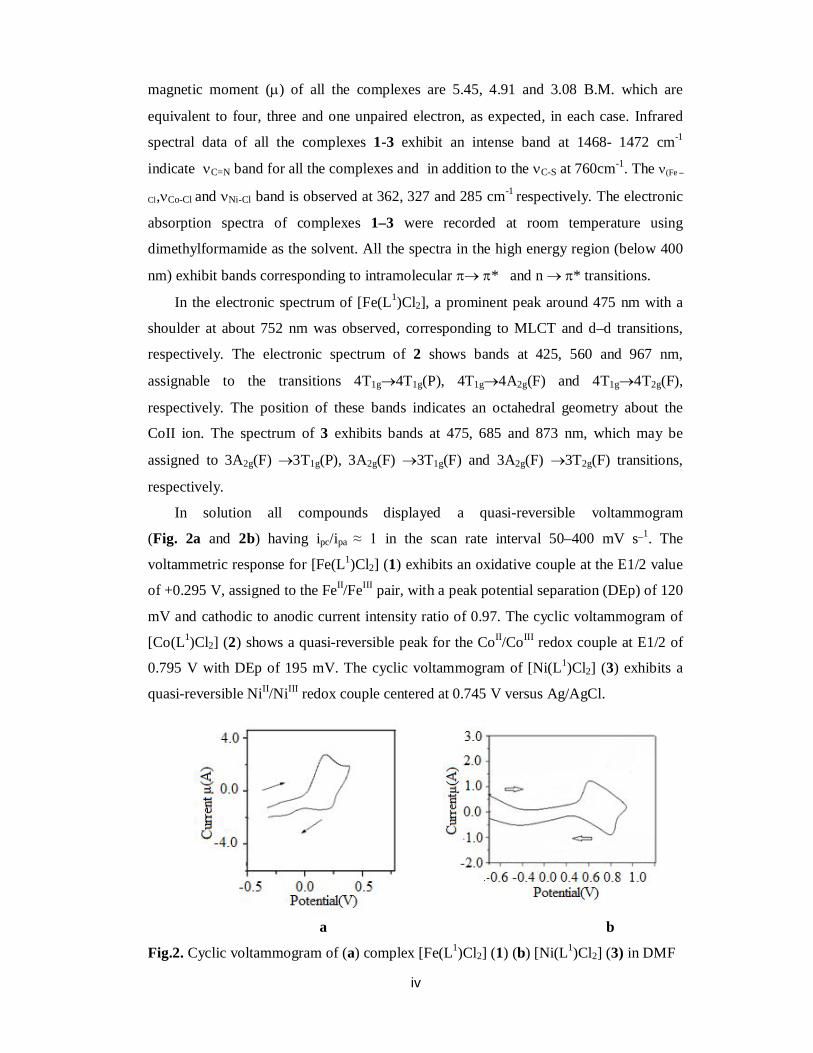
In solution all compounds displayed a quasi-reversible voltammogram
(Fig. 2a and 2b) having ipc/ipa ≈ 1 in the scan rate interval 50–400 mV s_1. The
voltammetric response for [Fe(L1)Cl2] (1) exhibits an oxidative couple at the E1/2 value
of +0.295 V, assigned to the FeII/FeIII pair, with a peak potential separation (DEp) of 120
mV and cathodic to anodic current intensity ratio of 0.97. The cyclic voltammogram of
[Co(L1)Cl2] (2) shows a quasi-reversible peak for the CoII/CoIII redox couple at E1/2 of
0.795 V with DEp of 195 mV. The cyclic voltammogram of [Ni(L1)Cl2] (3) exhibits a
quasi-reversible NiII/NiIII redox couple centered at 0.745 V versus Ag/AgCl.
a b
Fig.2. Cyclic voltammogram of (a) complex [Fe(L1)Cl2] (1) (b) [Ni(L1)Cl2] (3) in DMF
v
Here, the E1/2 value for complex 3 lies at the higher side of the range generally
measured, 0.3–0.8 V, for the NiII/NiIII oxidation potential data for thioether containing
nickel(II) complexes, indicating that NiII is fairly stabilised in 3.
The synthesis and characterization of four new mononuclear complexes (4a-d) and
a polymeric coordination zinc(II) complex (5) with a pyridylmethylthioether N2S2 donor
set have been described in the Chapter III. On reaction with chloride ions or
pseudohalides (azide, cyanate and thiocyanate ions) in ethanol at refluxing temperature,
the reaction mixture of the organic molecule L1 and zinc(II) acetate gave hexa-
coordinated mononuclear zinc(II) complexes of the general formula [Zn(L1)(X2)] (X =
Cl-, N3-, NCO- and SCN-). On the other hand, the organic ligand L1 with the zinc(II)
perchlorate salt, a coordination polymeric complex formulated as
{[ZnL1(ClO4)(H2O)](ClO4)}n (5) was separated in the solid state.he synthetic procedure
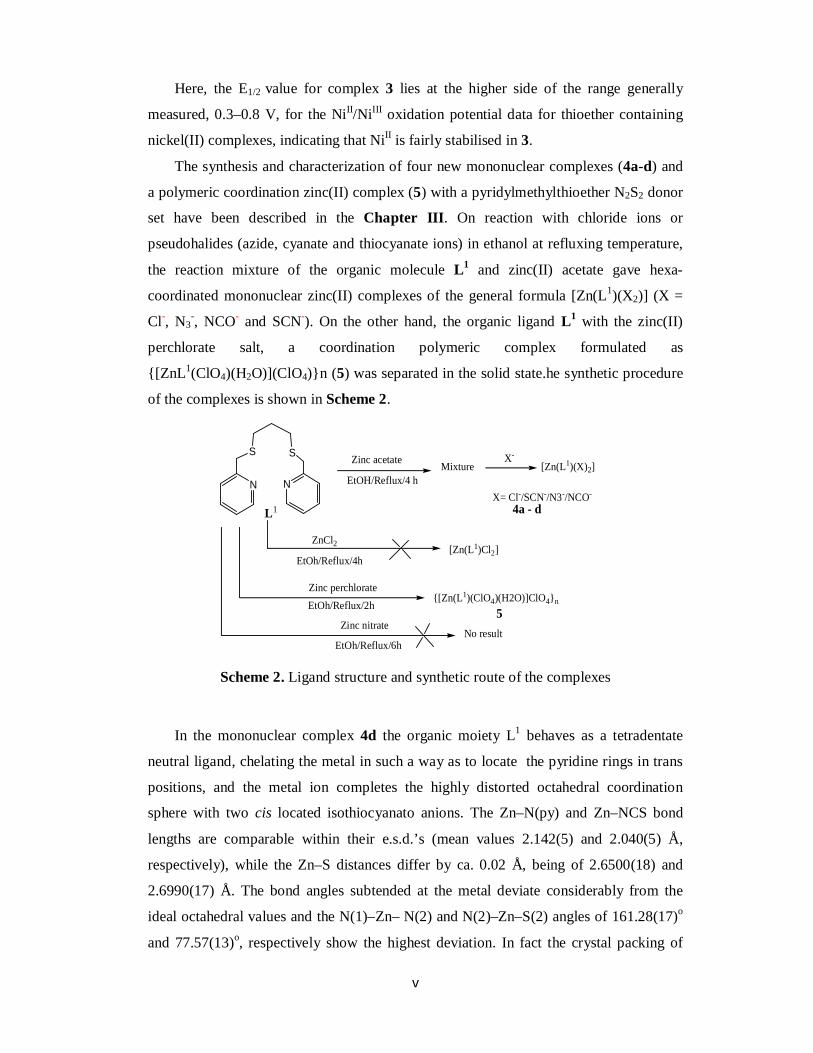
of the complexes is shown in Scheme 2.
Scheme 2. Ligand structure and synthetic route of the complexes
In the mononuclear complex 4d the organic moiety L1 behaves as a tetradentate
neutral ligand, chelating the metal in such a way as to locate the pyridine rings in trans
positions, and the metal ion completes the highly distorted octahedral coordination
sphere with two cis located isothiocyanato anions. The Zn–N(py) and Zn–NCS bond
lengths are comparable within their e.s.d.’s (mean values 2.142(5) and 2.040(5) Å,
respectively), while the Zn–S distances differ by ca. 0.02 Å, being of 2.6500(18) and
2.6990(17) Å. The bond angles subtended at the metal deviate considerably from the
ideal octahedral values and the N(1)–Zn– N(2) and N(2)–Zn–S(2) angles of 161.28(17)o
and 77.57(13)o, respectively show the highest deviation. In fact the crystal packing of
S S
N N
Zinc acetate
EtOH/Reflux/4 hMixture
X-[Zn(L1)(X)2]
X= Cl-/SCN-/N3-/NCO-
4a - dL1
ZnCl2
EtOh/Reflux/4h[Zn(L1)Cl2]
Zinc perchlorateEtOh/Reflux/2h
{[Zn(L1)(ClO4)(H2O)]ClO4}n
Zinc nitrate
EtOh/Reflux/6hNo result
5
vi
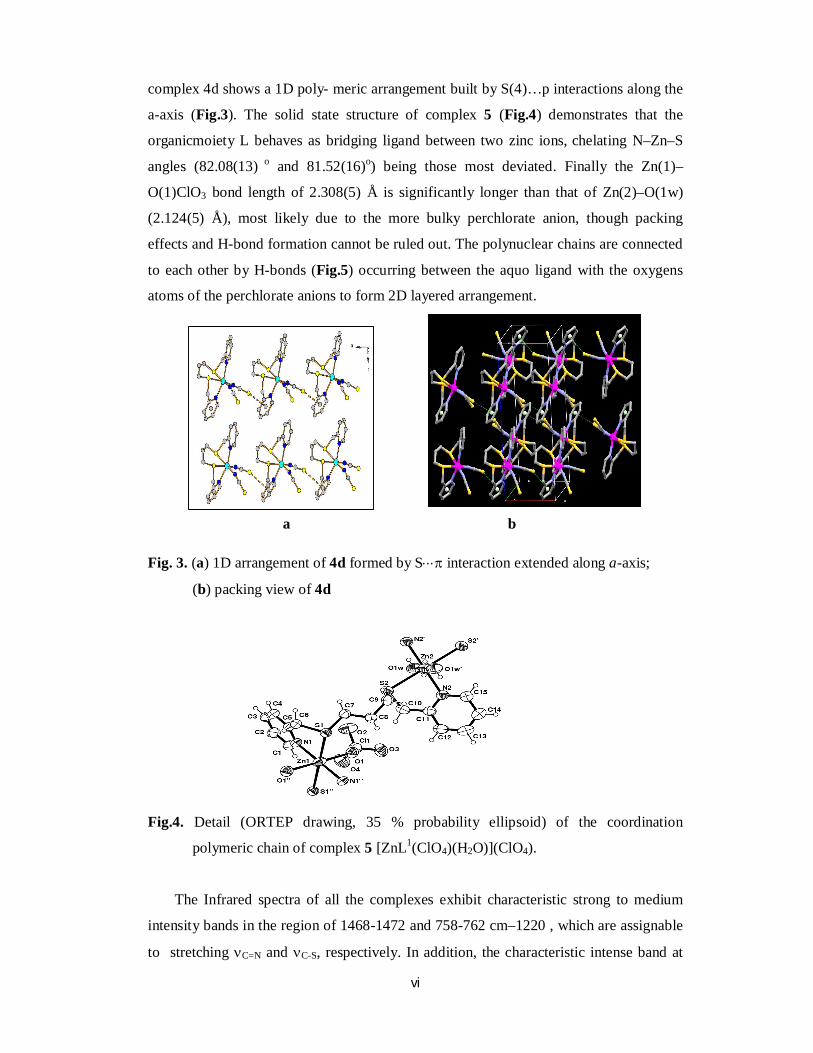
complex 4d shows a 1D poly- meric arrangement built by S(4)…p interactions along the
a-axis (Fig.3). The solid state structure of complex 5 (Fig.4) demonstrates that the
organicmoiety L behaves as bridging ligand between two zinc ions, chelating N–Zn–S
angles (82.08(13) o and 81.52(16)o) being those most deviated. Finally the Zn(1)–
O(1)ClO3 bond length of 2.308(5) Å is significantly longer than that of Zn(2)–O(1w)
(2.124(5) Å), most likely due to the more bulky perchlorate anion, though packing
effects and H-bond formation cannot be ruled out. The polynuclear chains are connected
to each other by H-bonds (Fig.5) occurring between the aquo ligand with the oxygens
atoms of the perchlorate anions to form 2D layered arrangement.
a b
Fig. 3. (a) 1D arrangement of 4d formed by S interaction extended along a-axis;
(b) packing view of 4d
Fig.4. Detail (ORTEP drawing, 35 % probability ellipsoid) of the coordination
polymeric chain of complex 5 [ZnL1(ClO4)(H2O)](ClO4).
The Infrared spectra of all the complexes exhibit characteristic strong to medium
intensity bands in the region of 1468-1472 and 758-762 cm–1220 , which are assignable
to stretching C=N and C-S, respectively. In addition, the characteristic intense band at
vii
2035 cm–1 in 4b, intense band at 2167 cm–1 in 4c and the strong band at 2085 cm–1 in 4d
confirms the presence of terminal end-on azide, terminal N-bonded NCO, and N-bonded
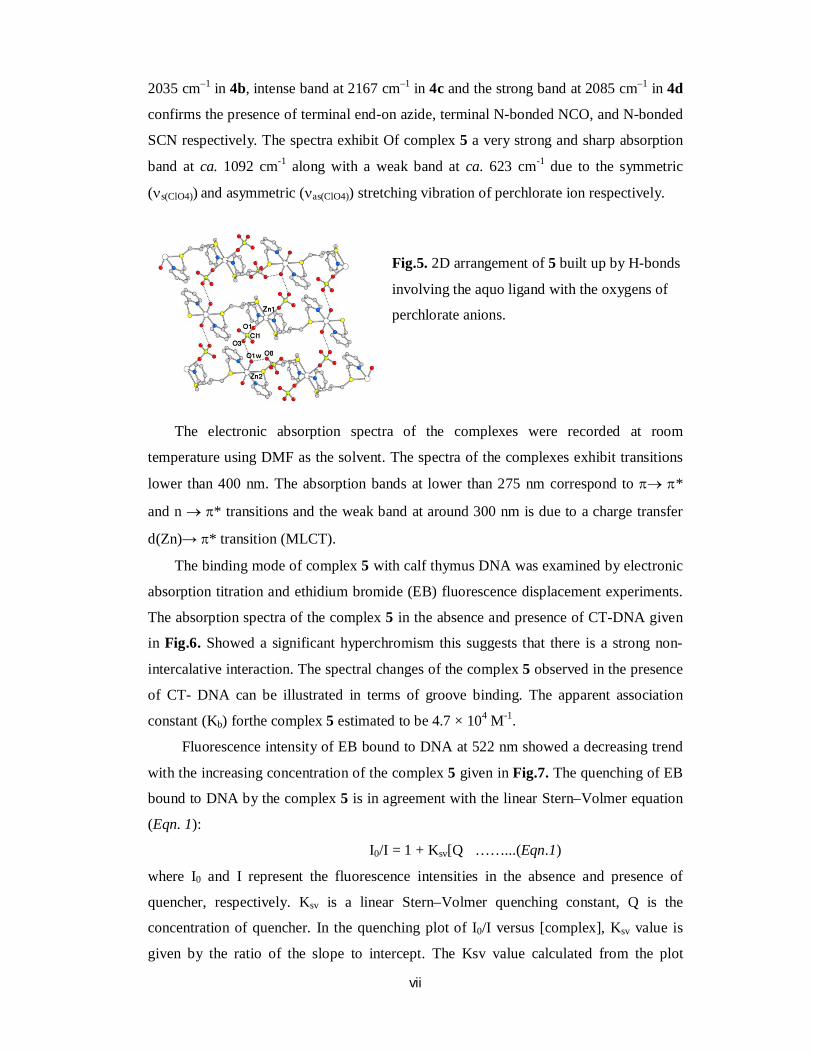
SCN respectively. The spectra exhibit Of complex 5 a very strong and sharp absorption
band at ca. 1092 cm-1 along with a weak band at ca. 623 cm-1 due to the symmetric
(s(ClO4)) and asymmetric (as(ClO4)) stretching vibration of perchlorate ion respectively.
Fig.5. 2D arrangement of 5 built up by H-bonds
involving the aquo ligand with the oxygens of
perchlorate anions.
The electronic absorption spectra of the complexes were recorded at room
temperature using DMF as the solvent. The spectra of the complexes exhibit transitions
lower than 400 nm. The absorption bands at lower than 275 nm correspond to *
and n * transitions and the weak band at around 300 nm is due to a charge transfer
d(Zn)→ * transition (MLCT).
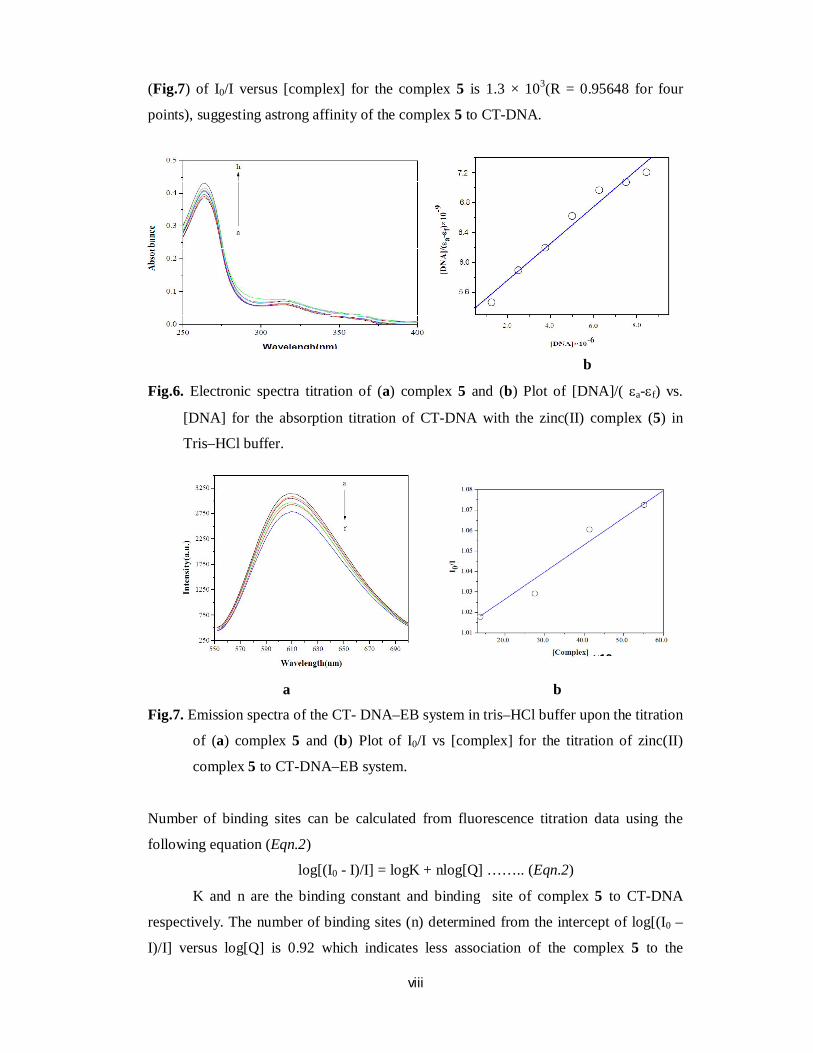
The binding mode of complex 5 with calf thymus DNA was examined by electronic
absorption titration and ethidium bromide (EB) fluorescence displacement experiments.
The absorption spectra of the complex 5 in the absence and presence of CT-DNA given
in Fig.6. Showed a significant hyperchromism this suggests that there is a strong non-
intercalative interaction. The spectral changes of the complex 5 observed in the presence
of CT- DNA can be illustrated in terms of groove binding. The apparent association
constant (Kb) forthe complex 5 estimated to be 4.7 × 10⁴ M-1.
Fluorescence intensity of EB bound to DNA at 522 nm showed a decreasing trend
with the increasing concentration of the complex 5 given in Fig.7. The quenching of EB
bound to DNA by the complex 5 is in agreement with the linear Stern–Volmer equation
(Eqn. 1):
I0/I = 1 + Ksv[Q ……...(Eqn.1)
where I0 and I represent the fluorescence intensities in the absence and presence of
quencher, respectively. Ksv is a linear Stern–Volmer quenching constant, Q is the
concentration of quencher. In the quenching plot of I0/I versus [complex], Ksv value is
given by the ratio of the slope to intercept. The Ksv value calculated from the plot
viii
(Fig.7) of I0/I versus [complex] for the complex 5 is 1.3 × 10³(R = 0.95648 for four
points), suggesting astrong affinity of the complex 5 to CT-DNA.
b
Fig.6. Electronic spectra titration of (a) complex 5 and (b) Plot of [DNA]/( a-f) vs.
[DNA] for the absorption titration of CT-DNA with the zinc(II) complex (5) in
Tris–HCl buffer.
a b
Fig.7. Emission spectra of the CT- DNA–EB system in tris–HCl buffer upon the titration
of (a) complex 5 and (b) Plot of I0/I vs [complex] for the titration of zinc(II)
complex 5 to CT-DNA–EB system.
Number of binding sites can be calculated from fluorescence titration data using the
following equation (Eqn.2)
log[(I0 - I)/I] = logK + nlog[Q] …….. (Eqn.2)
K and n are the binding constant and binding site of complex 5 to CT-DNA
respectively. The number of binding sites (n) determined from the intercept of log[(I0 –
I)/I] versus log[Q] is 0.92 which indicates less association of the complex 5 to the
×10
ix
number of DNA bases, also suggesting strong affinity of the complex 5 through surface
or groove binding.
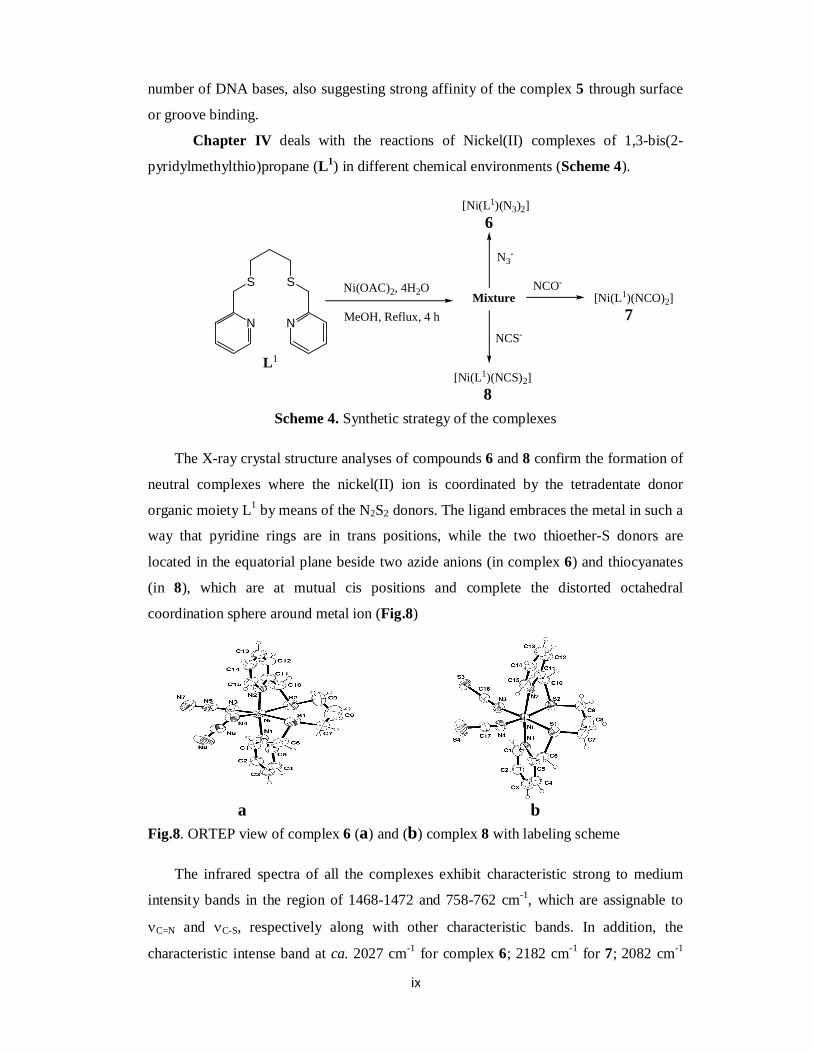
Chapter IV deals with the reactions of Nickel(II) complexes of 1,3-bis(2-
pyridylmethylthio)propane (L1) in different chemical environments (Scheme 4).
Scheme 4. Synthetic strategy of the complexes
The X-ray crystal structure analyses of compounds 6 and 8 confirm the formation of
neutral complexes where the nickel(II) ion is coordinated by the tetradentate donor
organic moiety L1 by means of the N2S2 donors. The ligand embraces the metal in such a
way that pyridine rings are in trans positions, while the two thioether-S donors are
located in the equatorial plane beside two azide anions (in complex 6) and thiocyanates
(in 8), which are at mutual cis positions and complete the distorted octahedral
coordination sphere around metal ion (Fig.8)
a b Fig.8. ORTEP view of complex 6 (a) and (b) complex 8 with labeling scheme
The infrared spectra of all the complexes exhibit characteristic strong to medium
intensity bands in the region of 1468-1472 and 758-762 cm-1, which are assignable to
C=N and C-S, respectively along with other characteristic bands. In addition, the
characteristic intense band at ca. 2027 cm-1 for complex 6; 2182 cm-1 for 7; 2082 cm-1
S
N
S
N
Ni(OAC)2, 4H2O
MeOH, Reflux, 4 hMixture
NCO-
N3-
NCS-
[Ni(L1)(NCO)2] 7
[Ni(L1)(N3)2] 6
[Ni(L1)(NCS)2] 8
L1
x
for 8 are assignable to N3, NCO and NCS respectively. The electronic absorption spectra
of complexes 6-8 were recorded at room temperature using DMF as solvent. In
octahedral nickel (II) complexes, three spin allowed transitions are expected from the
energy level diagram for d8 ions due to 3A2g 3T1g (P), 3A2g 3T1g(F), 3A2g 3T2g
transitions, which are observed from low to high wavelengths, respectively.
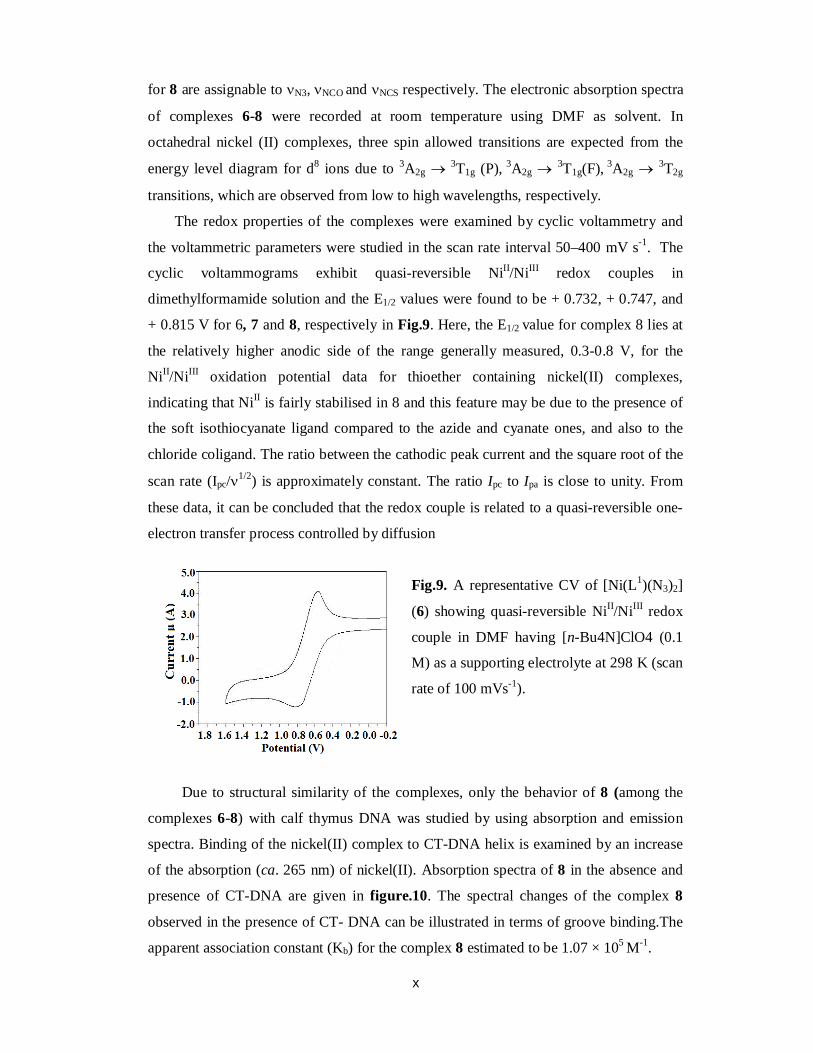
The redox properties of the complexes were examined by cyclic voltammetry and
the voltammetric parameters were studied in the scan rate interval 50–400 mV s-1. The
cyclic voltammograms exhibit quasi-reversible NiII/NiIII redox couples in
dimethylformamide solution and the E1/2 values were found to be + 0.732, + 0.747, and
+ 0.815 V for 6, 7 and 8, respectively in Fig.9. Here, the E1/2 value for complex 8 lies at
the relatively higher anodic side of the range generally measured, 0.3-0.8 V, for the
NiII/NiIII oxidation potential data for thioether containing nickel(II) complexes,
indicating that NiII is fairly stabilised in 8 and this feature may be due to the presence of
the soft isothiocyanate ligand compared to the azide and cyanate ones, and also to the
chloride coligand. The ratio between the cathodic peak current and the square root of the
scan rate (Ipc/1/2) is approximately constant. The ratio Ipc to Ipa is close to unity. From
these data, it can be concluded that the redox couple is related to a quasi-reversible one-
electron transfer process controlled by diffusion
Fig.9. A representative CV of [Ni(L1)(N3)2]
(6) showing quasi-reversible NiII/NiIII redox
couple in DMF having [n-Bu4N]ClO4 (0.1
M) as a supporting electrolyte at 298 K (scan
rate of 100 mVs-1).
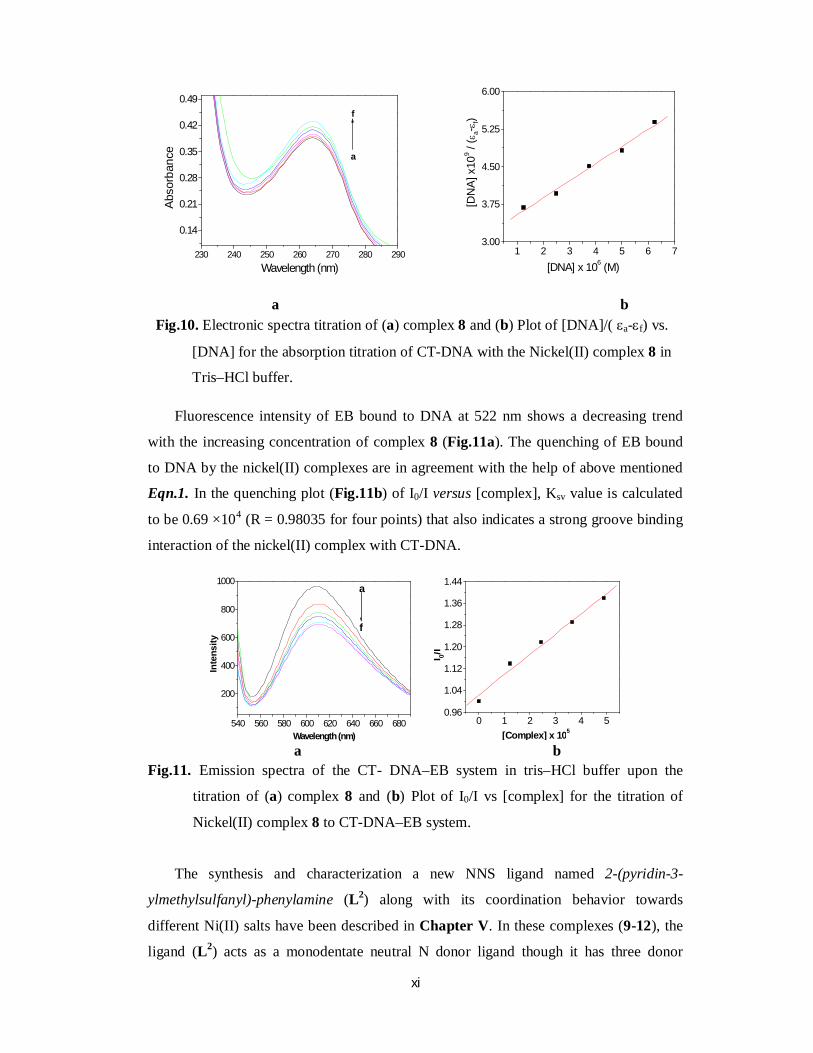
Due to structural similarity of the complexes, only the behavior of 8 (among the
complexes 6-8) with calf thymus DNA was studied by using absorption and emission
spectra. Binding of the nickel(II) complex to CT-DNA helix is examined by an increase
of the absorption (ca. 265 nm) of nickel(II). Absorption spectra of 8 in the absence and
presence of CT-DNA are given in figure.10. The spectral changes of the complex 8
observed in the presence of CT- DNA can be illustrated in terms of groove binding.The
apparent association constant (Kb) for the complex 8 estimated to be 1.07 × 10⁵ M-1.
xi
a b Fig.10. Electronic spectra titration of (a) complex 8 and (b) Plot of [DNA]/( a-f) vs.
[DNA] for the absorption titration of CT-DNA with the Nickel(II) complex 8 in
Tris–HCl buffer.
Fluorescence intensity of EB bound to DNA at 522 nm shows a decreasing trend
with the increasing concentration of complex 8 (Fig.11a). The quenching of EB bound
to DNA by the nickel(II) complexes are in agreement with the help of above mentioned
Eqn.1. In the quenching plot (Fig.11b) of I0/I versus [complex], Ksv value is calculated
to be 0.69 ×10⁴ (R = 0.98035 for four points) that also indicates a strong groove binding
interaction of the nickel(II) complex with CT-DNA.
a b Fig.11. Emission spectra of the CT- DNA–EB system in tris–HCl buffer upon the
titration of (a) complex 8 and (b) Plot of I0/I vs [complex] for the titration of
Nickel(II) complex 8 to CT-DNA–EB system.
The synthesis and characterization a new NNS ligand named 2-(pyridin-3-
ylmethylsulfanyl)-phenylamine (L2) along with its coordination behavior towards
different Ni(II) salts have been described in Chapter V. In these complexes (9-12), the
ligand (L2) acts as a monodentate neutral N donor ligand though it has three donor
230 240 250 260 270 280 290
0.14
0.21
0.28
0.35
0.42
0.49f
a
Abso
rban
ce
Wavelength (nm)1 2 3 4 5 6 7
3.00
3.75
4.50
5.25
6.00
[DN
A] x
109 /
(a-
f)
[DNA] x 106 (M)
540 560 580 600 620 640 660 680
200
400
600
800
1000
f
a
Inte
nsity
Wavelength (nm)0 1 2 3 4 5
0.96
1.04
1.12
1.20
1.28
1.36
1.44
I 0/I
[Complex] x 105
xii
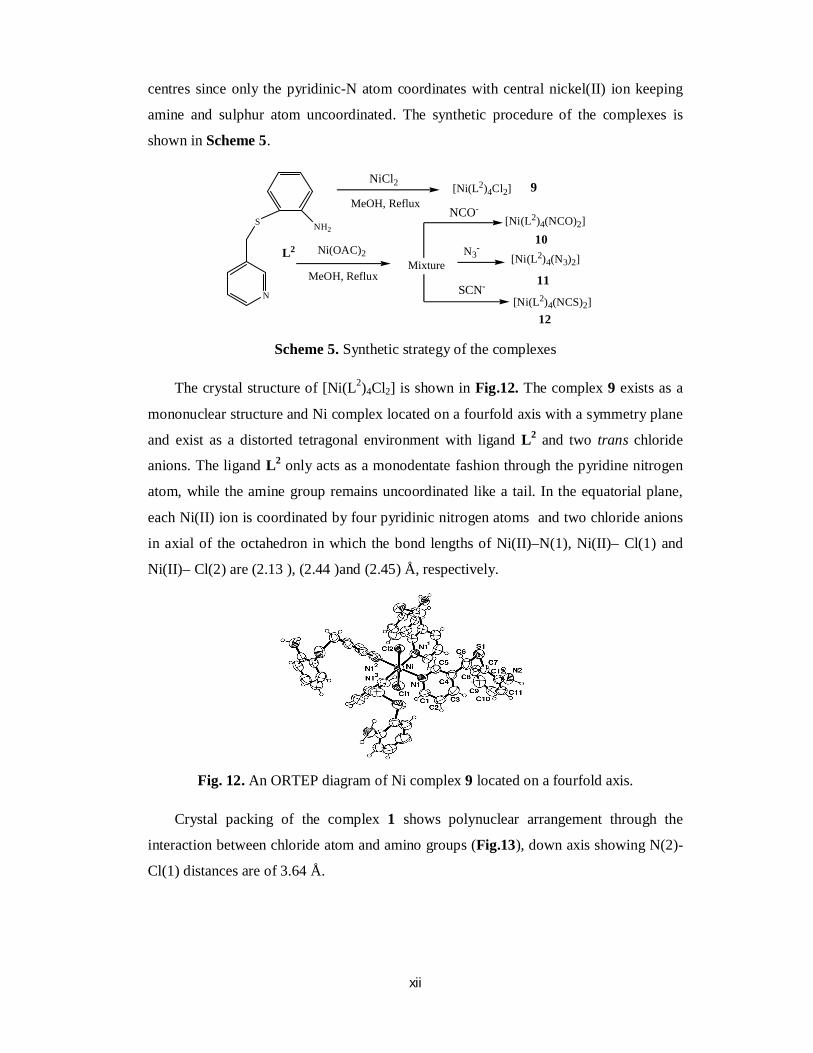
centres since only the pyridinic-N atom coordinates with central nickel(II) ion keeping
amine and sulphur atom uncoordinated. The synthetic procedure of the complexes is
shown in Scheme 5.
Scheme 5. Synthetic strategy of the complexes
The crystal structure of [Ni(L2)4Cl2] is shown in Fig.12. The complex 9 exists as a
mononuclear structure and Ni complex located on a fourfold axis with a symmetry plane
and exist as a distorted tetragonal environment with ligand L2 and two trans chloride
anions. The ligand L2 only acts as a monodentate fashion through the pyridine nitrogen
atom, while the amine group remains uncoordinated like a tail. In the equatorial plane,
each Ni(II) ion is coordinated by four pyridinic nitrogen atoms and two chloride anions
in axial of the octahedron in which the bond lengths of Ni(II)–N(1), Ni(II)– Cl(1) and
Ni(II)– Cl(2) are (2.13 ), (2.44 )and (2.45) Å, respectively.
Fig. 12. An ORTEP diagram of Ni complex 9 located on a fourfold axis.
Crystal packing of the complex 1 shows polynuclear arrangement through the
interaction between chloride atom and amino groups (Fig.13), down axis showing N(2)-
Cl(1) distances are of 3.64 Å.
S
N
NH2
NiCl2
MeOH, Reflux[Ni(L2)4Cl2]
Ni(OAC)2
MeOH, RefluxMixture
N3-
[Ni(L2)4(NCO)2]
[Ni(L2)4(N3)2]
[Ni(L2)4(NCS)2]
NCO-
SCN-
L2
9
10
11
12
xiii
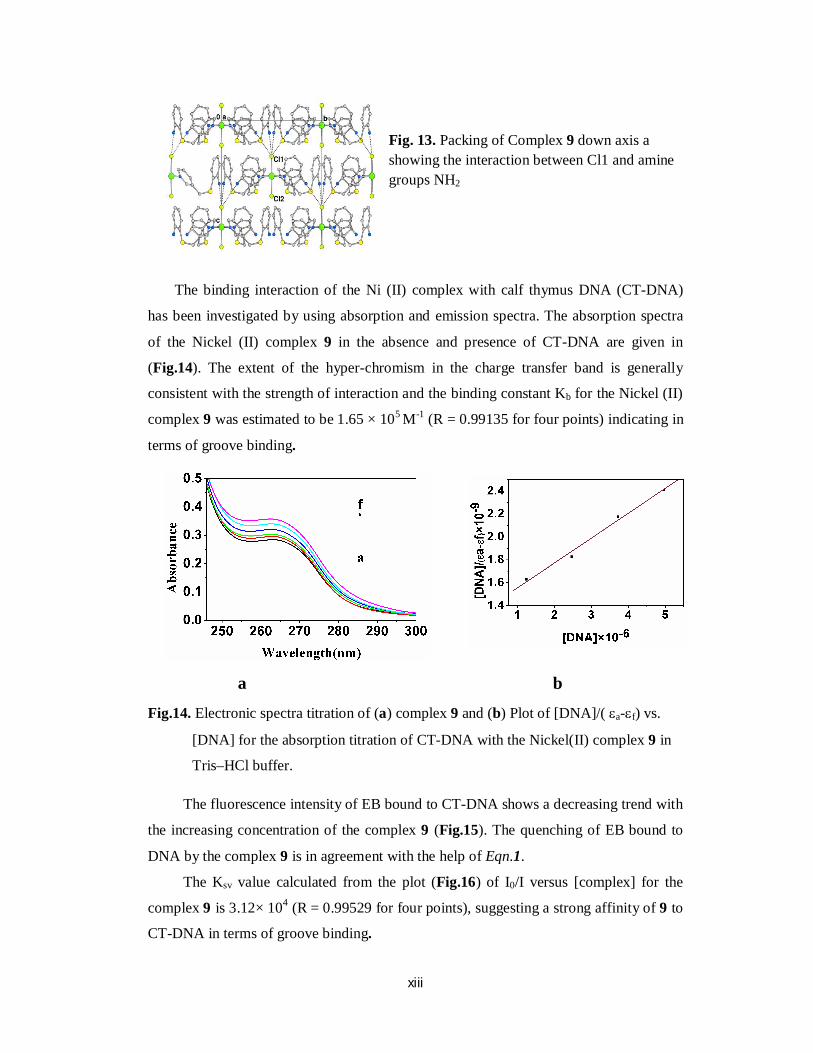
Fig. 13. Packing of Complex 9 down axis a showing the interaction between Cl1 and amine groups NH2
The binding interaction of the Ni (II) complex with calf thymus DNA (CT-DNA)
has been investigated by using absorption and emission spectra. The absorption spectra
of the Nickel (II) complex 9 in the absence and presence of CT-DNA are given in
(Fig.14). The extent of the hyper-chromism in the charge transfer band is generally
consistent with the strength of interaction and the binding constant Kb for the Nickel (II)
complex 9 was estimated to be 1.65 × 10⁵ M-1 (R = 0.99135 for four points) indicating in
terms of groove binding.
a b
Fig.14. Electronic spectra titration of (a) complex 9 and (b) Plot of [DNA]/( a-f) vs.
[DNA] for the absorption titration of CT-DNA with the Nickel(II) complex 9 in
Tris–HCl buffer.
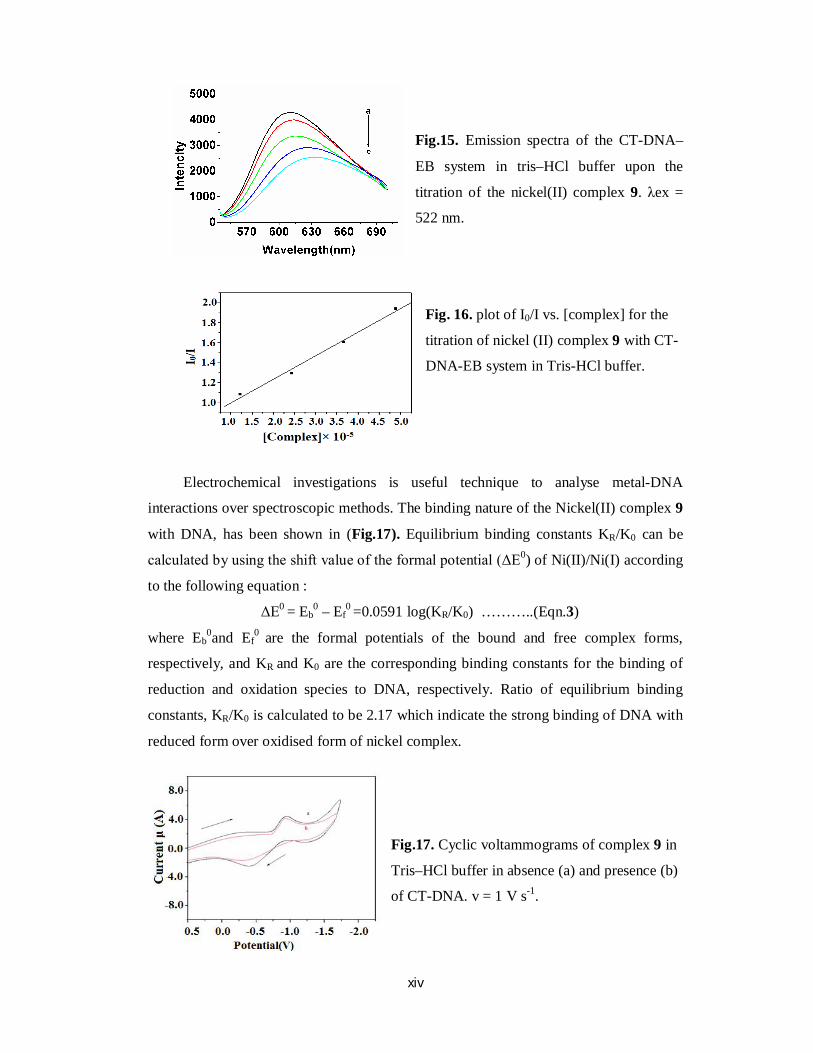
The fluorescence intensity of EB bound to CT-DNA shows a decreasing trend with
the increasing concentration of the complex 9 (Fig.15). The quenching of EB bound to
DNA by the complex 9 is in agreement with the help of Eqn.1.
The Ksv value calculated from the plot (Fig.16) of I0/I versus [complex] for the
complex 9 is 3.12× 10⁴ (R = 0.99529 for four points), suggesting a strong affinity of 9 to
CT-DNA in terms of groove binding.
xiv
Fig.15. Emission spectra of the CT-DNA–
EB system in tris–HCl buffer upon the
titration of the nickel(II) complex 9. λex =
522 nm.
Fig. 16. plot of I0/I vs. [complex] for the
titration of nickel (II) complex 9 with CT-
DNA-EB system in Tris-HCl buffer.
Electrochemical investigations is useful technique to analyse metal-DNA
interactions over spectroscopic methods. The binding nature of the Nickel(II) complex 9
with DNA, has been shown in (Fig.17). Equilibrium binding constants KR/K0 can be
calculated by using the shift value of the formal potential (ΔE0) of Ni(II)/Ni(I) according
to the following equation :
ΔE0 = Eb0 – Ef
0 =0.0591 log(KR/K0) ………..(Eqn.3)
where Eb0and Ef
0 are the formal potentials of the bound and free complex forms,
respectively, and KR and K0 are the corresponding binding constants for the binding of
reduction and oxidation species to DNA, respectively. Ratio of equilibrium binding
constants, KR/K0 is calculated to be 2.17 which indicate the strong binding of DNA with
reduced form over oxidised form of nickel complex.
Fig.17. Cyclic voltammograms of complex 9 in
Tris–HCl buffer in absence (a) and presence (b)
of CT-DNA. v = 1 V s-1.
xv
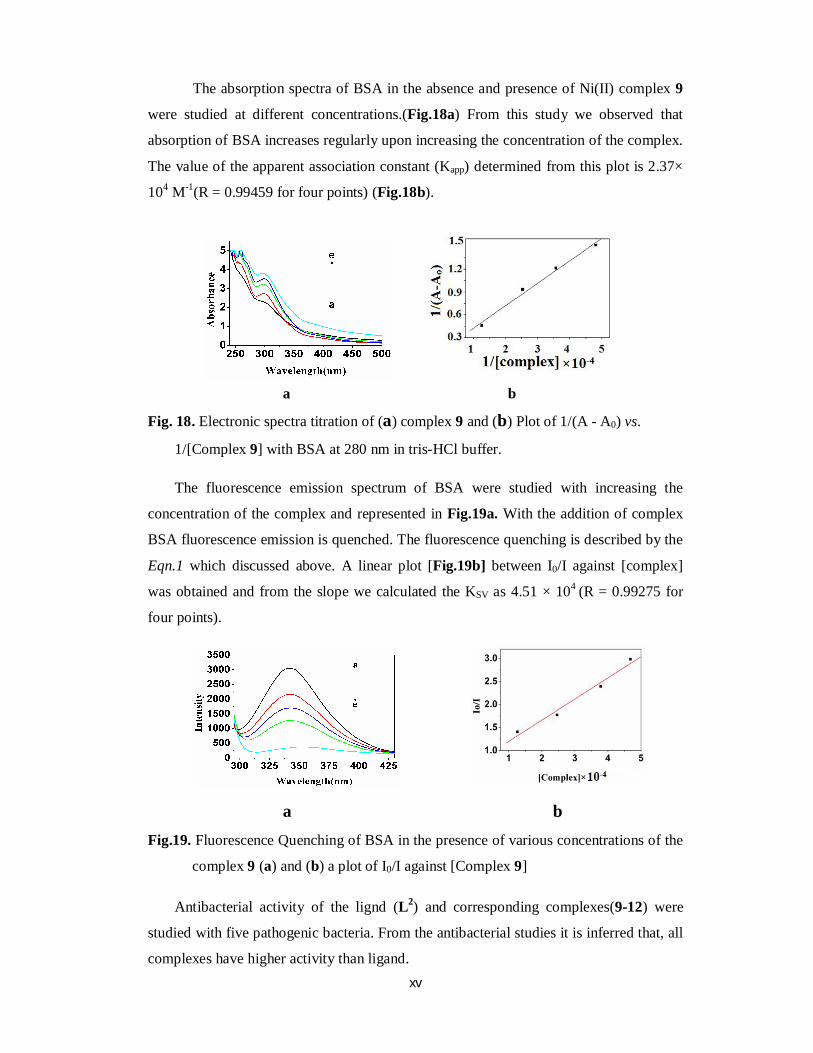
The absorption spectra of BSA in the absence and presence of Ni(II) complex 9
were studied at different concentrations.(Fig.18a) From this study we observed that
absorption of BSA increases regularly upon increasing the concentration of the complex.
The value of the apparent association constant (Kapp) determined from this plot is 2.37×
104 M-1(R = 0.99459 for four points) (Fig.18b).
a b
Fig. 18. Electronic spectra titration of (a) complex 9 and (b) Plot of 1/(A - A0) vs.
1/[Complex 9] with BSA at 280 nm in tris-HCl buffer.
The fluorescence emission spectrum of BSA were studied with increasing the
concentration of the complex and represented in Fig.19a. With the addition of complex
BSA fluorescence emission is quenched. The fluorescence quenching is described by the
Eqn.1 which discussed above. A linear plot [Fig.19b] between I0/I against [complex]
was obtained and from the slope we calculated the KSV as 4.51 × 10⁴ (R = 0.99275 for
four points).
a b
Fig.19. Fluorescence Quenching of BSA in the presence of various concentrations of the
complex 9 (a) and (b) a plot of I0/I against [Complex 9]
Antibacterial activity of the lignd (L2) and corresponding complexes(9-12) were
studied with five pathogenic bacteria. From the antibacterial studies it is inferred that, all
complexes have higher activity than ligand.
xvi
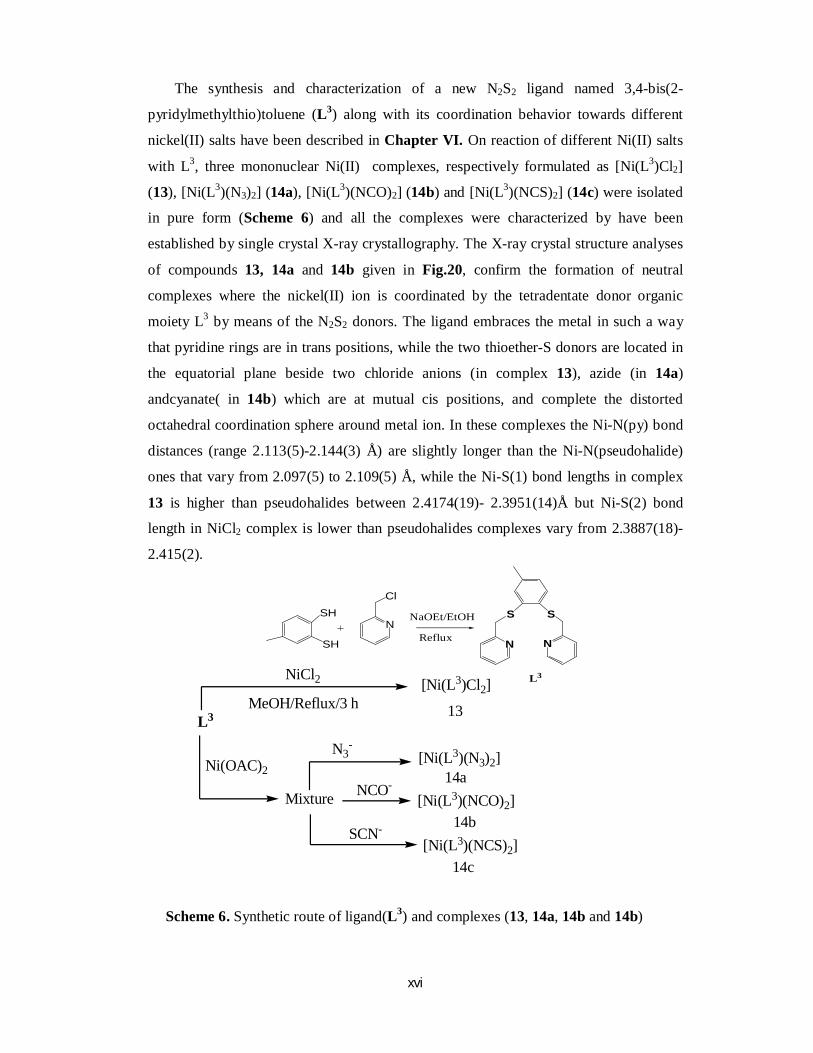
The synthesis and characterization of a new N2S2 ligand named 3,4-bis(2-
pyridylmethylthio)toluene (L3) along with its coordination behavior towards different
nickel(II) salts have been described in Chapter VI. On reaction of different Ni(II) salts
with L3, three mononuclear Ni(II) complexes, respectively formulated as [Ni(L3)Cl2]
(13), [Ni(L3)(N3)2] (14a), [Ni(L3)(NCO)2] (14b) and [Ni(L3)(NCS)2] (14c) were isolated
in pure form (Scheme 6) and all the complexes were characterized by have been
established by single crystal X-ray crystallography. The X-ray crystal structure analyses
of compounds 13, 14a and 14b given in Fig.20, confirm the formation of neutral
complexes where the nickel(II) ion is coordinated by the tetradentate donor organic
moiety L3 by means of the N2S2 donors. The ligand embraces the metal in such a way
that pyridine rings are in trans positions, while the two thioether-S donors are located in
the equatorial plane beside two chloride anions (in complex 13), azide (in 14a)
andcyanate( in 14b) which are at mutual cis positions, and complete the distorted
octahedral coordination sphere around metal ion. In these complexes the Ni-N(py) bond
distances (range 2.113(5)-2.144(3) Å) are slightly longer than the Ni-N(pseudohalide)
ones that vary from 2.097(5) to 2.109(5) Å, while the Ni-S(1) bond lengths in complex
13 is higher than pseudohalides between 2.4174(19)- 2.3951(14)Å but Ni-S(2) bond
length in NiCl2 complex is lower than pseudohalides complexes vary from 2.3887(18)-
2.415(2).
Scheme 6. Synthetic route of ligand(L3) and complexes (13, 14a, 14b and 14b)
SH
SH
N
Cl
NaOEt/EtOH
Reflux
S S
N N
L3
L3
Mixture
NiCl2MeOH/Reflux/3 h
N3-
NCO-
SCN-
[Ni(L3)(N3)2]
[Ni(L3)(NCO)2]
[Ni(L3)(NCS)2]
[Ni(L3)Cl2]
Ni(OAC)2
13
14a
14b
14c
xvii
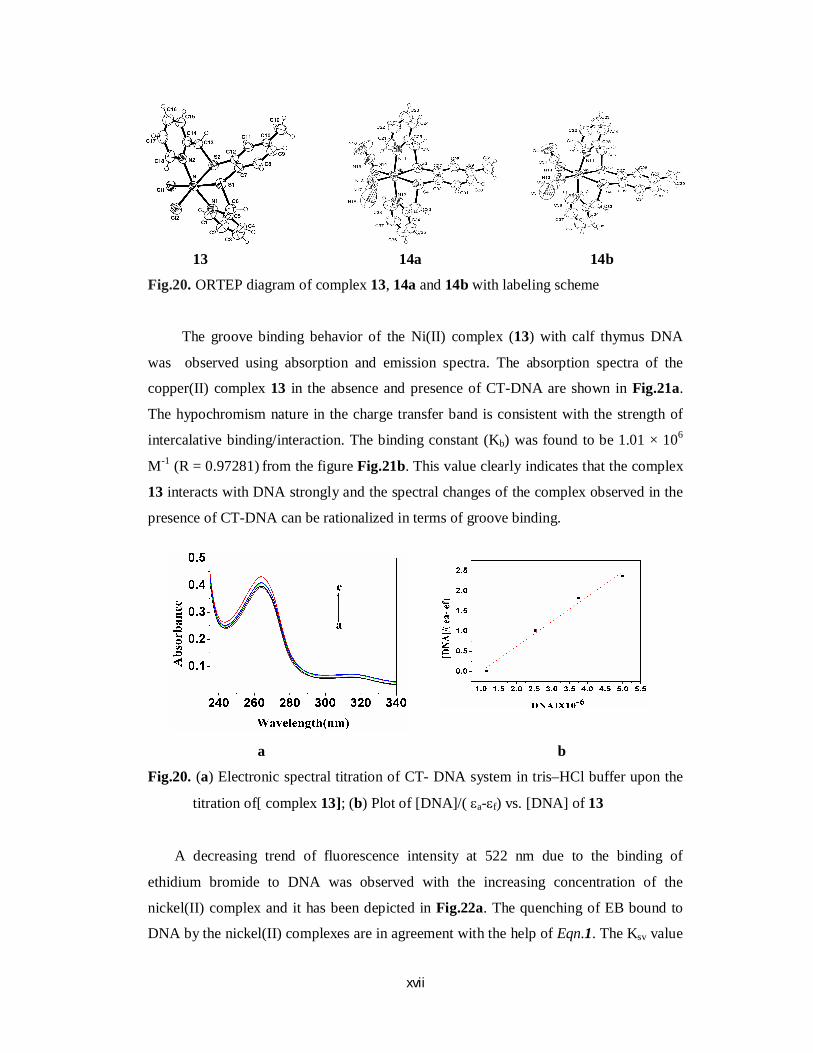
13 14a 14b
Fig.20. ORTEP diagram of complex 13, 14a and 14b with labeling scheme
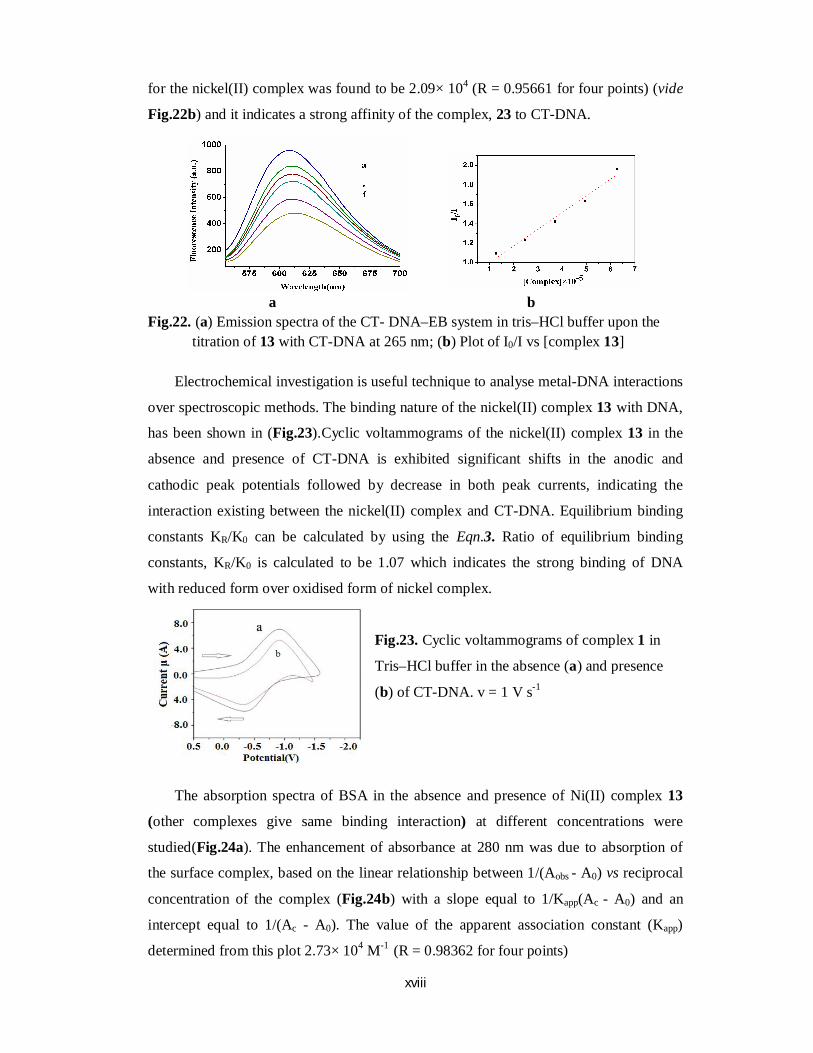
The groove binding behavior of the Ni(II) complex (13) with calf thymus DNA
was observed using absorption and emission spectra. The absorption spectra of the
copper(II) complex 13 in the absence and presence of CT-DNA are shown in Fig.21a.
The hypochromism nature in the charge transfer band is consistent with the strength of
intercalative binding/interaction. The binding constant (Kb) was found to be 1.01 × 10⁶
M-1 (R = 0.97281) from the figure Fig.21b. This value clearly indicates that the complex
13 interacts with DNA strongly and the spectral changes of the complex observed in the
presence of CT-DNA can be rationalized in terms of groove binding.
a b
Fig.20. (a) Electronic spectral titration of CT- DNA system in tris–HCl buffer upon the
titration of[ complex 13]; (b) Plot of [DNA]/( a-f) vs. [DNA] of 13
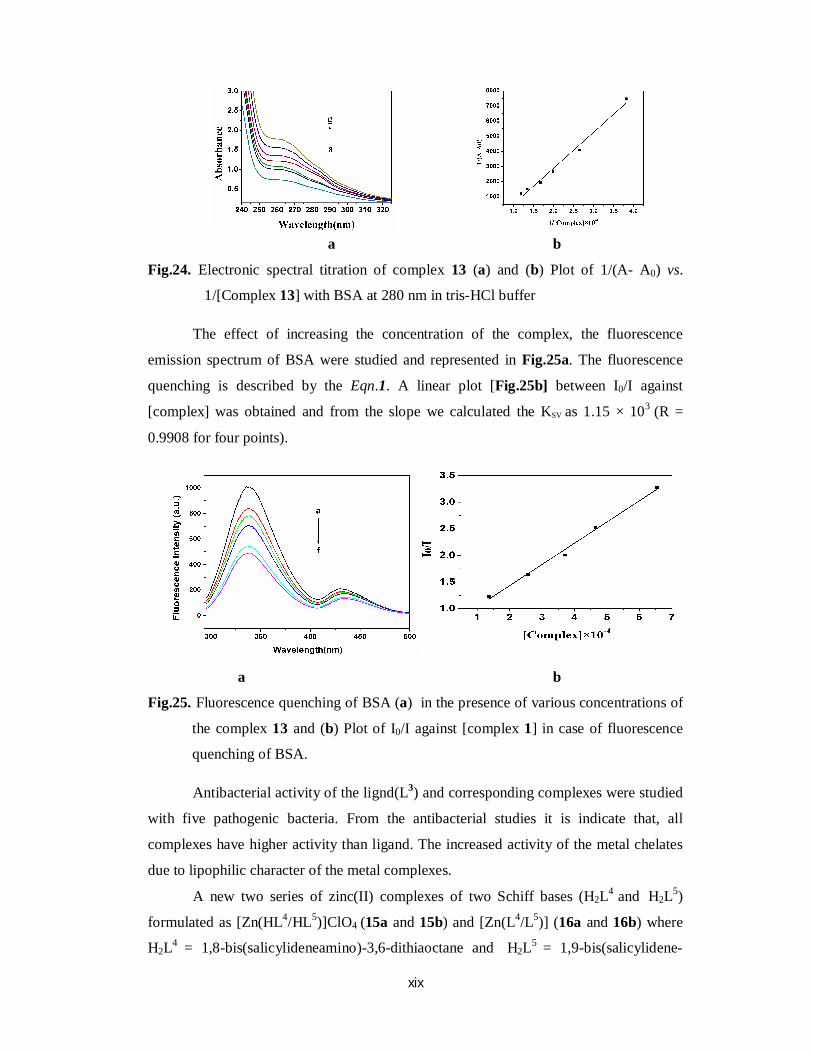
A decreasing trend of fluorescence intensity at 522 nm due to the binding of
ethidium bromide to DNA was observed with the increasing concentration of the
nickel(II) complex and it has been depicted in Fig.22a. The quenching of EB bound to
DNA by the nickel(II) complexes are in agreement with the help of Eqn.1. The Ksv value
xviii
for the nickel(II) complex was found to be 2.09× 10⁴ (R = 0.95661 for four points) (vide
Fig.22b) and it indicates a strong affinity of the complex, 23 to CT-DNA.
a b Fig.22. (a) Emission spectra of the CT- DNA–EB system in tris–HCl buffer upon the
titration of 13 with CT-DNA at 265 nm; (b) Plot of I0/I vs [complex 13]
Electrochemical investigation is useful technique to analyse metal-DNA interactions
over spectroscopic methods. The binding nature of the nickel(II) complex 13 with DNA,
has been shown in (Fig.23).Cyclic voltammograms of the nickel(II) complex 13 in the
absence and presence of CT-DNA is exhibited significant shifts in the anodic and
cathodic peak potentials followed by decrease in both peak currents, indicating the
interaction existing between the nickel(II) complex and CT-DNA. Equilibrium binding
constants KR/K0 can be calculated by using the Eqn.3. Ratio of equilibrium binding
constants, KR/K0 is calculated to be 1.07 which indicates the strong binding of DNA
with reduced form over oxidised form of nickel complex.
Fig.23. Cyclic voltammograms of complex 1 in
Tris–HCl buffer in the absence (a) and presence
(b) of CT-DNA. v = 1 V s-1
The absorption spectra of BSA in the absence and presence of Ni(II) complex 13
(other complexes give same binding interaction) at different concentrations were
studied(Fig.24a). The enhancement of absorbance at 280 nm was due to absorption of
the surface complex, based on the linear relationship between 1/(Aobs - A0) vs reciprocal
concentration of the complex (Fig.24b) with a slope equal to 1/Kapp(Ac - A0) and an
intercept equal to 1/(Ac - A0). The value of the apparent association constant (Kapp)
determined from this plot 2.73× 10⁴ M-1 (R = 0.98362 for four points)
xix
a b
Fig.24. Electronic spectral titration of complex 13 (a) and (b) Plot of 1/(A- A0) vs.
1/[Complex 13] with BSA at 280 nm in tris-HCl buffer
The effect of increasing the concentration of the complex, the fluorescence
emission spectrum of BSA were studied and represented in Fig.25a. The fluorescence
quenching is described by the Eqn.1. A linear plot [Fig.25b] between I0/I against
[complex] was obtained and from the slope we calculated the KSV as 1.15 × 10³ (R =
0.9908 for four points).
a b
Fig.25. Fluorescence quenching of BSA (a) in the presence of various concentrations of
the complex 13 and (b) Plot of I0/I against [complex 1] in case of fluorescence
quenching of BSA.
Antibacterial activity of the lignd(L3) and corresponding complexes were studied
with five pathogenic bacteria. From the antibacterial studies it is indicate that, all
complexes have higher activity than ligand. The increased activity of the metal chelates
due to lipophilic character of the metal complexes.
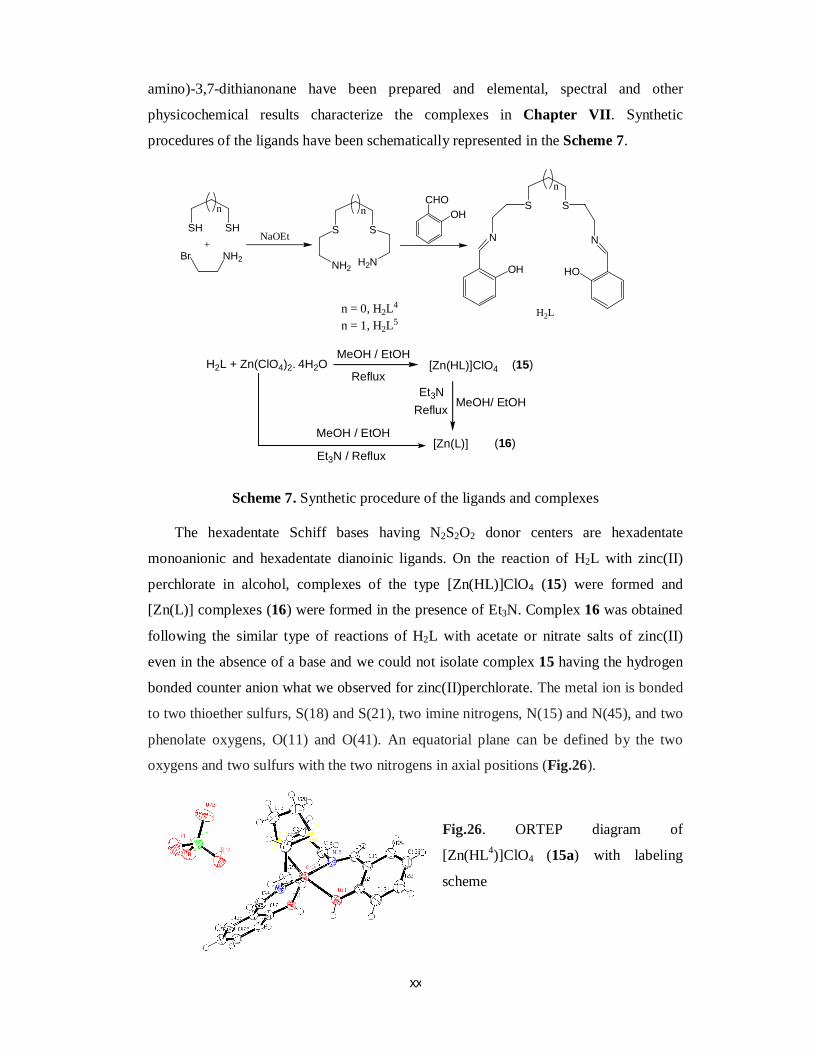
A new two series of zinc(II) complexes of two Schiff bases (H2L4 and H2L5)
formulated as [Zn(HL4/HL5)]ClO4 (15a and 15b) and [Zn(L4/L5)] (16a and 16b) where
H2L4 = 1,8-bis(salicylideneamino)-3,6-dithiaoctane and H2L5 = 1,9-bis(salicylidene-
xx
amino)-3,7-dithianonane have been prepared and elemental, spectral and other
physicochemical results characterize the complexes in Chapter VII. Synthetic
procedures of the ligands have been schematically represented in the Scheme 7.
Scheme 7. Synthetic procedure of the ligands and complexes
The hexadentate Schiff bases having N2S2O2 donor centers are hexadentate
monoanionic and hexadentate dianoinic ligands. On the reaction of H2L with zinc(II)
perchlorate in alcohol, complexes of the type [Zn(HL)]ClO4 (15) were formed and
[Zn(L)] complexes (16) were formed in the presence of Et3N. Complex 16 was obtained
following the similar type of reactions of H2L with acetate or nitrate salts of zinc(II)
even in the absence of a base and we could not isolate complex 15 having the hydrogen
bonded counter anion what we observed for zinc(II)perchlorate. The metal ion is bonded
to two thioether sulfurs, S(18) and S(21), two imine nitrogens, N(15) and N(45), and two
phenolate oxygens, O(11) and O(41). An equatorial plane can be defined by the two
oxygens and two sulfurs with the two nitrogens in axial positions (Fig.26).
Fig.26. ORTEP diagram of
[Zn(HL4)]ClO4 (15a) with labeling
scheme
SH SH+
Br NH2 NH2H2N
NaOEt N
OH
N
HO
CHOOHn
S S
n S S
n
n = 0, H2L4
n = 1, H2L5H2L
H2L + Zn(ClO4)2. 4H2OMeOH / EtOH
Reflux[Zn(HL)]ClO4 (15)
Et3N / Reflux
MeOH / EtOH[Zn(L)] (16)
Reflux MeOH/ EtOHEt3N
xxi
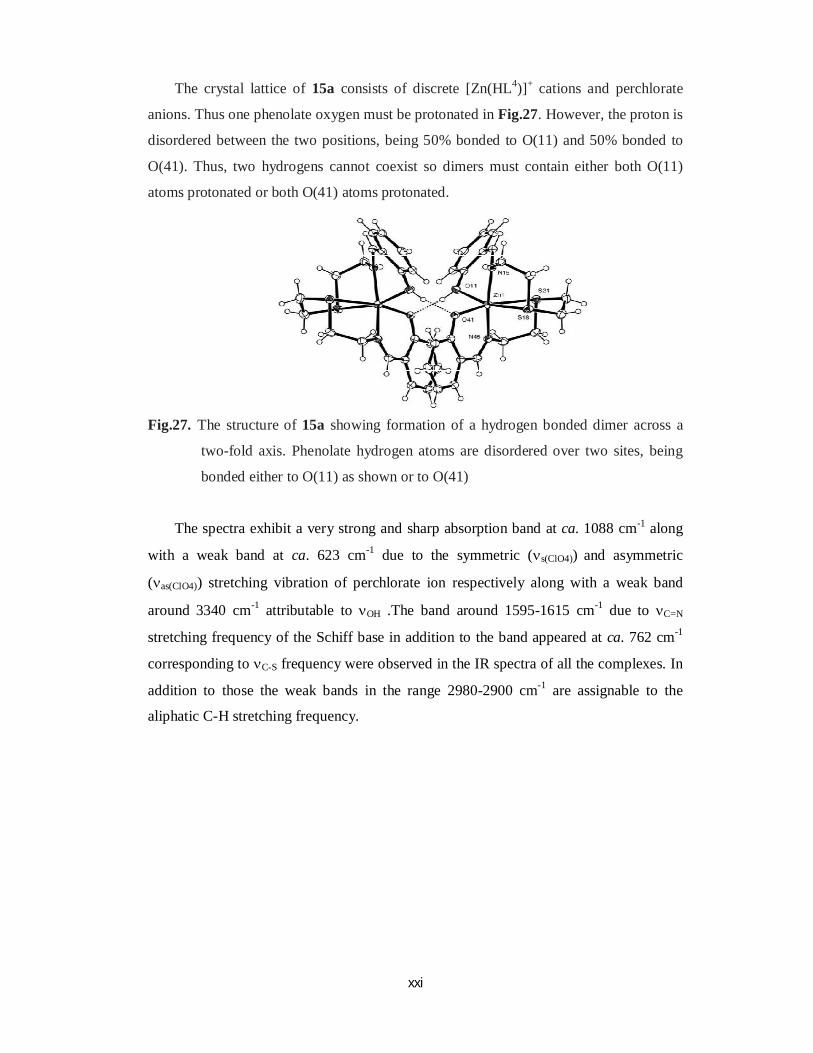
The crystal lattice of 15a consists of discrete [Zn(HL4)]+ cations and perchlorate
anions. Thus one phenolate oxygen must be protonated in Fig.27. However, the proton is
disordered between the two positions, being 50% bonded to O(11) and 50% bonded to
O(41). Thus, two hydrogens cannot coexist so dimers must contain either both O(11)
atoms protonated or both O(41) atoms protonated.
Fig.27. The structure of 15a showing formation of a hydrogen bonded dimer across a
two-fold axis. Phenolate hydrogen atoms are disordered over two sites, being
bonded either to O(11) as shown or to O(41)
The spectra exhibit a very strong and sharp absorption band at ca. 1088 cm-1 along
with a weak band at ca. 623 cm-1 due to the symmetric (s(ClO4)) and asymmetric
(as(ClO4)) stretching vibration of perchlorate ion respectively along with a weak band
around 3340 cm-1 attributable to OH .The band around 1595-1615 cm-1 due to C=N
stretching frequency of the Schiff base in addition to the band appeared at ca. 762 cm-1
corresponding to C-S frequency were observed in the IR spectra of all the complexes. In
addition to those the weak bands in the range 2980-2900 cm-1 are assignable to the
aliphatic C-H stretching frequency.


![Nickel(II) complexes of 3,4-bis(2-pyridylmethylthio ...shodhganga.inflibnet.ac.in/bitstream/10603/21608/6/chapter-vi.pdf · chemistry [2], medicine [3], catalysis [4] and great variety](https://img.pdfslide.us/doc/110x75/5f0d14897e708231d43894a3/nickelii-complexes-of-34-bis2-pyridylmethylthio-chemistry-2-medicine.jpg)