Embed Size (px)
Citation preview
This paper is included in the Proceedings of the 11th International Conference on Autonomic Computing (ICAC ’14).
June 18–20, 2014 • Philadelphia, PA
ISBN 978-1-931971-11-9
Open access to the Proceedings of the 11th International Conference on Autonomic Computing (ICAC ’14)
is sponsored by USENIX.
Coordinating Liquid and Free Air Cooling with Workload Allocation for Data Center
Power MinimizationLi Li, Wenli Zheng, Xiaodong Wang, and Xiaorui Wang, The Ohio State University
https://www.usenix.org/conference/icac14/technical-sessions/presentation/li_li
USENIX Association 11th International Conference on Autonomic Computing 249
Coordinating Liquid and Free Air Cooling with Workload Allocation forData Center Power Minimization
Li Li, Wenli Zheng, Xiaodong Wang, and Xiaorui WangPower-Aware Computer System (PACS) Laboratory
Department of Electrical and Computer EngineeringThe Ohio State University, Columbus, OH 43210
{li.2251, zheng.691, wang.3570, wang.3596}@osu.edu
AbstractData centers are seeking more efficient cooling tech-niques to reduce their operating expenses, because cool-ing can account for 30-40% of the power consumptionof a data center. Recently, liquid cooling has emergedas a promising alternative to traditional air cooling, be-cause it can help eliminate undesired air recirculation.Another emerging technology is free air cooling, whichsaves chiller power by utilizing outside cold air for cool-ing. Some existing data centers have already startedto adopt both liquid and free air cooling techniques forsignificantly improved cooling efficiency and more datacenters are expected to follow.
In this paper, we propose SmartCool, a power op-timization scheme that effectively coordinates differ-ent cooling techniques and dynamically manages work-load allocation for jointly optimized cooling and serverpower. In sharp contrast to the existing work that ad-dresses different cooling techniques in an isolated man-ner, SmartCool systematically formulates the integrationof different cooling systems as a constrained optimiza-tion problem. Furthermore, since geo-distributed datacenters have different ambient temperatures, SmartCooldynamically dispatches the incoming requests among anetwork of data centers with heterogeneous cooling sys-tems to best leverage the high efficiency of free cool-ing. A light-weight heuristic algorithm is proposed toachieve a near-optimal solution with a low run-time over-head. We evaluate SmartCool both in simulation and on ahardware testbed. The results show that SmartCool out-performs two state-of-the-art baselines by having a 38%more power savings.
1 Introduction
In recent years, high power consumption has becomea serious concern in operating large-scale data centers.For example, a report from Environmental Protection
Agency (EPA) estimated that the total energy consump-tion from data centers in the US was over 100 billionkWh in 2011. Among the total power consumed bya data center, cooling power can account for 30-40%[14][2]. As new high-density servers (e.g., blade servers)are increasingly being deployed in data centers, it is im-portant for the cooling systems to more effectively re-move the heat. However, with the high-density serversbeing installed, the traditional computer room air con-ditioner (CRAC) system might not be efficient enough,as its Power Usage Effectiveness (PUE) is around 2.0 orhigher. PUE is defined as the ratio of the total energyconsumption of a data center over energy consumed bythe IT equipment such as servers. With a high PUE, thecooling power consumption of a data center can growtremendously as high-density servers being deployed,which not only increases the operating cost, but alsocauses negative environmental impact. Therefore, datacenters are in an urgent need to find higher-efficient cool-ing techniques to reduce PUE.
Two new cooling techniques have recently been pro-posed to increase the cooling efficiency and lower thePUE of a data center. The first one is liquid cooling,which conducts coolant through pipes to some heat ex-change devices that are attached to the IT equipments,such that the generated heat can be directly taken awayby the coolant. The second one, which is referred to asfree air cooling [7], exploits the relatively cold air out-side the data center for cooling and thus saves the powerof chilling the hot air returned from the IT equipment.Although both of the two cooling techniques highly in-crease the cooling efficiency of data centers, each tech-nique has its own limitations. The liquid cooling ap-proach requires additional ancillary facilities (e.g., thevalves and pipes) and maintenance, which can increasethe capital investment when being deployed in a largescale. The free air cooling technique requires a low out-side air temperature, which might not be available all thetime in a year. In order to mitigate the problems, hy-
250 11th International Conference on Autonomic Computing USENIX Association
brid cooling system, which is composed with the liquidcooling, the free air cooling and the traditional CRACair cooling, can be used to lower the cooling cost andensure the cooling availability. Several hybrid-cooleddata centers have been put into production. For exam-ple, the CERN data center located in Europe adopts ahybrid cooling system with both liquid-cooling and tra-ditional CRAC cooling systems, in which about 9% ofthe servers are liquid-cooled [4].
However, efficiently operating such a hybrid cool-ing system is not a trivial task. Currently, existingdata centers that adopt multiple cooling techniques com-monly use some preset outside temperature thresholdsto switch between different cooling systems, regardlessof the time-varying workload. Such a simplistic solu-tion can often lead to unnecessarily low cooling efficien-cies. Although some previous studies [11][35] have pro-posed to intelligently distribute the workload across theservers and manage the cooling system according to thereal-time workload to avoid over-cooling, they addressonly one certain cooling technology and thus the resultedworkload distribution might not be optimal for the hybridcooling system. To the best of our knowledge, no priorresearch has been done for efficiently coordinating multi-ple cooling techniques in a hybrid-cooled data center. Inaddition, for a network of data centers that are geographi-cally distributed, there exist some works focusing on bal-ancing the workload or reducing the server power cost[16][27], but none of them minimize the cooling powerconsumption, especially when the data centers have het-erogeneous cooling systems. In order to minimize thepower consumption of a hybrid-cooled data center, weneed to face several new challenges. First, the differ-ent characteristics of these three cooling systems (liquidcooling, free air cooling and the traditional CRAC aircooling) demand for a systematic approach to coordinatethem effectively. Second, workload distribution in sucha hybrid-cooled data center needs to be carefully plannedin order to jointly minimize the cooling and server powerconsumption. Third, due to the different local temper-atures, a novel workload distribution and cooling man-agement approach is needed for data centers that are ge-ographically distributed at different locations, in order tobetter utilize free air cooling in the hybrid cooling systemmore efficiently.
In this paper, we propose SmartCool, a power opti-mization scheme to optimize the total power consump-tion of a hybrid-cooled data center by intelligently man-aging the hybrid cooling system and distributing theworkload. We first formulate the power optimizationproblem for a single data center, which can then besolved with a widely adopted optimization technique.We then extend the power optimization scheme to fit anetwork of geo-distributed data centers. To reduce the
computational overhead, we propose a light-weight al-gorithm to solve the optimization problem for the geo-distributed data centers. Specifically, this paper has thefollowing major contributions:
• More and more data centers are on their way toadopt high-efficient cooling techniques, but manydata centers heavily rely on simplistic solutions toseparately manage their cooling systems, which of-ten lead to an unnecessarily low cooling efficiency.In this paper, we propose to address an increas-ingly important problem: Intelligent coordinationof cooling systems for jointly minimized coolingand server power in a data center.
• We formulate the cooling management in a hybrid-cooled data center with liquid cooling, free air cool-ing, and traditional CRAC air cooling, as a con-strained power optimization problem to minimizethe total power consumption. SmartCool featuresa novel air recirculation model developed based oncomputational fluid dynamics (CFD).
• To best leverage the high efficiency of free coolingin geo-distributed data centers that have differentambient temperatures, we extend our optimizationformulation to dynamically dispatch the incomingrequests among a network of data centers with het-erogeneous cooling systems. A light-weight heuris-tic algorithm is proposed to achieve a near-optimalsolution with a low run-time overhead.
• We evaluate SmartCool both in simulation and ona hardware testbed with real-world workload andtemperature traces. The results show that Smart-Cool outperforms two state-of-the-art baselines bysaving 38% more power consumption.
The rest of the paper is organized as follows. We re-view the related work in Section 2, and introduce thebackground of different cooling technologies in Section3. Section 4 formulates power optimization problem fora single hybrid-cooled data center, which is extended forgeo-distributed data centers in Section 5 with a light-weight algorithm. We present our simulation results inSection 6 and the hardware experiment results in Section7. Finally, Section 8 concludes the paper.
2 Related Work
Minimizing the power consumption of data centers hasrecently received much attention, such as [27, 11, 18,29, 31, 32, 13, 28, 17]. In particular, a lot of work hasbeen done to optimize the traditional CRAC air coolingin data centers. For example, Anto et al. [22] construct
2
USENIX Association 11th International Conference on Autonomic Computing 251
a model of a single CRAC unit which offers flexible se-lection in different heat exchangers and coolants. Zhouet al. [23] propose a computationally efficient multi-variable model to capture the effects of CRAC fan speedand supplied air temperature on the rack inlet tempera-tures. Tang et al. [20] propose a workload schedulingscheme to make the inlet temperatures of all servers aseven as possible. A holistic approach is proposed byChen et al. [30] that integrates the management of IT,power and cooling infrastructures to improve the datacenter efficiency. In our work, we adopt the modelingprocess of traditional CRAC cooling system, but coor-dinate its work with the liquid cooling and free coolingsystems as a hybrid-cooling system for the improvementof data center cooling efficiency.
Free air cooling and liquid cooling have also attractedwide research attentions. Christy et al. [9] study two pri-mary free cooling systems, the air economizer and thewater economizer. Gebrehiwot et al. [3] study the ther-mal performance of an air economizer for a modular datacenter using computational fluid dynamics. Coskun et al.[1] provide a 3D thermal model for liquid cooling, withvariable fluid injection rates. Hwang et al. [8] developan energy model for liquid-cooled data centers based onthe thermo-fluid first principles. Differently, our workfocuses on the power optimization of hybrid-cooled datacenters, by managing the cooling modes and workloaddistribution.
For geo-distributed data centers, Adnan et al. [16] savethe cost of load balancing by utilizing the flexibility ofthe Service Level Agreements. Related algorithms aredeveloped in [33][34][12] to minimize the total cost ofgeo-distributed data centers and the environmental im-pact. Our global workload dispatching strategy mini-mizes the total power consumption of all the distributeddata center, by leveraging the temperature differencesamong different locations and maximizing the usage offree air cooling.
3 Different Cooling Technologies
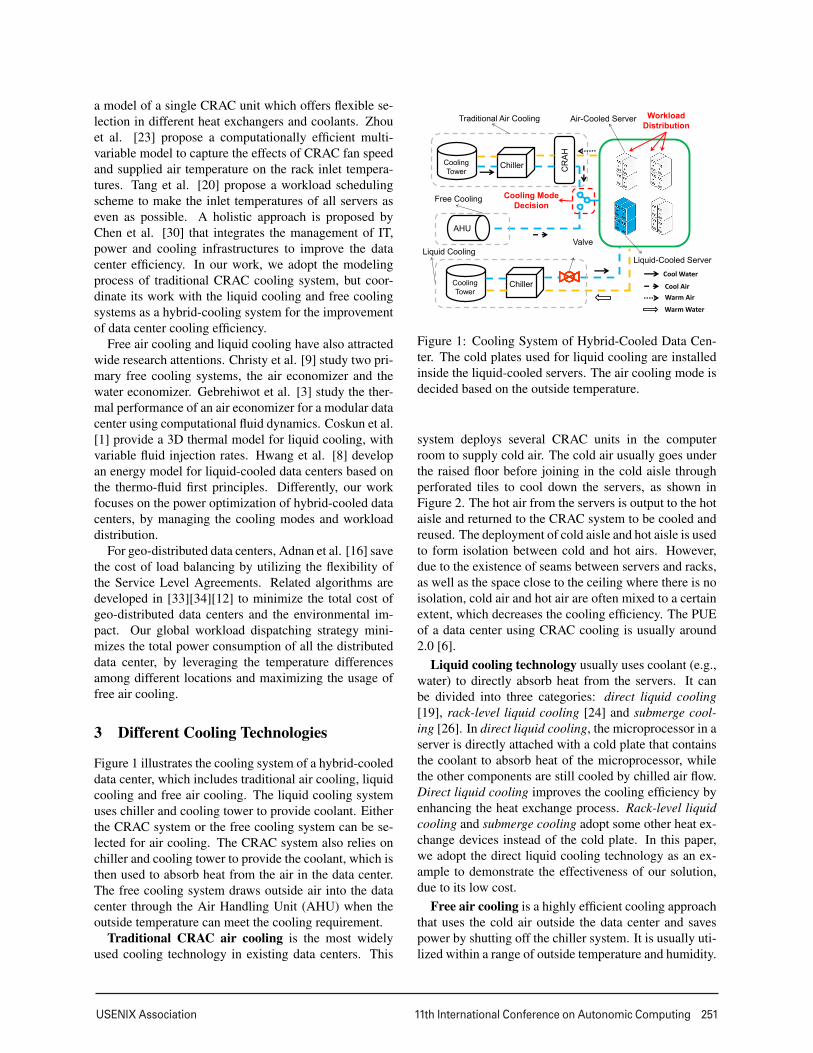
Figure 1 illustrates the cooling system of a hybrid-cooleddata center, which includes traditional air cooling, liquidcooling and free air cooling. The liquid cooling systemuses chiller and cooling tower to provide coolant. Eitherthe CRAC system or the free cooling system can be se-lected for air cooling. The CRAC system also relies onchiller and cooling tower to provide the coolant, which isthen used to absorb heat from the air in the data center.The free cooling system draws outside air into the datacenter through the Air Handling Unit (AHU) when theoutside temperature can meet the cooling requirement.
Traditional CRAC air cooling is the most widelyused cooling technology in existing data centers. This
Cooling Tower
Chiller CR
AH
AHU
Cooling Tower
Chiller
Traditional Air Cooling Air-Cooled Server
Cooling Mode Decision
Free Cooling
Liquid Cooling
Workload Distribution
Liquid-Cooled Server Cool Water
Cool Air Warm Air
Warm Water
Valve
Figure 1: Cooling System of Hybrid-Cooled Data Cen-ter. The cold plates used for liquid cooling are installedinside the liquid-cooled servers. The air cooling mode isdecided based on the outside temperature.
system deploys several CRAC units in the computerroom to supply cold air. The cold air usually goes underthe raised floor before joining in the cold aisle throughperforated tiles to cool down the servers, as shown inFigure 2. The hot air from the servers is output to the hotaisle and returned to the CRAC system to be cooled andreused. The deployment of cold aisle and hot aisle is usedto form isolation between cold and hot airs. However,due to the existence of seams between servers and racks,as well as the space close to the ceiling where there is noisolation, cold air and hot air are often mixed to a certainextent, which decreases the cooling efficiency. The PUEof a data center using CRAC cooling is usually around2.0 [6].
Liquid cooling technology usually uses coolant (e.g.,water) to directly absorb heat from the servers. It canbe divided into three categories: direct liquid cooling[19], rack-level liquid cooling [24] and submerge cool-ing [26]. In direct liquid cooling, the microprocessor in aserver is directly attached with a cold plate that containsthe coolant to absorb heat of the microprocessor, whilethe other components are still cooled by chilled air flow.Direct liquid cooling improves the cooling efficiency byenhancing the heat exchange process. Rack-level liquidcooling and submerge cooling adopt some other heat ex-change devices instead of the cold plate. In this paper,we adopt the direct liquid cooling technology as an ex-ample to demonstrate the effectiveness of our solution,due to its low cost.
Free air cooling is a highly efficient cooling approachthat uses the cold air outside the data center and savespower by shutting off the chiller system. It is usually uti-lized within a range of outside temperature and humidity.
3

252 11th International Conference on Autonomic Computing USENIX Association
Within this range, the outside air can be used for coolingvia an air handler fan. The traditional CRAC system isemployed by these data centers as the backup coolingsystem.
4 Power Optimization for a Local Hybrid-cooled Data Center
In this section, we introduce the power models and for-mulate the total power optimization problem for a lo-cal hybrid-cooled data center. We then present how wesolve the problem by using computational fluid dynamics(CFD) modeling and optimization techniques.
4.1 Power Models of a Hybrid-cooled DataCenter
We use the following models to calculate the server andcooling power consumption in the data center.
• Server Power Consumption Model
For a server i, we adopt a widely accepted serverpower consumption model [11] as:
Pserveri =Wi ×Pcompute
i +Pidlei (1)
where Wi is the workload handled by server i, in termsof CPU utilization. Pcompute
i is the maximum computingpower when the workload is 100%. Pidle
i represents thestatic idle power consumed by the server. If the workloadis 0, the server can be shut down to save power and thusthe power consumption is 0. Therefore, the total serverpower consumption of a data center with N server is
Pserver =N
∑i=1
Pserveri (2)
• Air Cooling Power Model
In a hybrid-cooled data center, the components of aliquid-cooled server except for the microprocessor, therest server components, such as disk and memory, arecooled by the air cooling system, which contributes tothe hot air coming out of the server. To characterize thisrelationship, we assume that in a liquid-cooled server, αpercent of the power is consumed by the microprocessor.Therefore, assuming the first M servers among the totalN servers are liquid-cooled, we can calculate the totalpower consumption of all the servers and componentsthat are cooled by the air cooling as:
Pserverair =
N
∑i=M+1
Pserveri +
M
∑i=1
(1−α)∗Pserveri (3)
The power consumption of the traditional CRAC aircooling system depends on the heat generation (i.e.,Pserver
air ) and the efficiency of the CRAC system:
Server
Server
Server
Server
Server
Server
Server
Server
CRAC
or
AHU
Hot A
isle
Recirculated Air
Hot
Ais
le
Cold
Ais
le
Returned Air
Supplied Air
Figure 2: Air circulation in an air-cooled data center.Some hot air can be recirculated to the inlet and mixedwith the cold air, degrading the cooling efficiency.
PairCRAC =
Pserverair
COPCRAC (4)
According to [11], the COP (coefficient of perfor-mance, characterizing the cooling efficiency) of a CRACsystem can be calculated according to the supplied airtemperature Tsup:
COPair = 0.0068∗T 2sup +0.0008∗Tsup +0.458 (5)
To avoid overheating the servers, the inlet air temper-ature of an air-cooled server needs to be bounded by athreshold. Based on a temperature model from [21], weuse Equation 6 to first calculate the outlet air tempera-ture, and then get the inlet air temperature with Equation7:
KiT iout =
N
∑j=1
hi jKjTj
out +(Ki −N
∑j=1
hi jKj)Tsup +Pairi (6)
T iin =
N
∑j=1
h ji ∗ (T jout −Tsup)+Tsup (7)
Ki represents a multiplicative item, ρ fiCp, where Cpis the specific heat of air. ρ represents the air density,and fi is the air flow rate to server i. h describes the airrecirculation. In Equation 6, the first term characterizesthe impact of the air recirculation from server j to serveri and the second term models the cooling effect of thesupplied air. The third term is the power consumptionof server i that heats up the passing cold air. Equation 7shows that inlet server temperature is determined by thesupplied air temperature and the recirculation heat. Weexplain how to derive h using CFD in Section 4.3.
When the free air cooling method is chosen for thehybrid-cooled data center, the air cooling power is calcu-lated in a different way, according to [7]
Pairf ree = (PUE f ree −1)∗Pserver
air (8)
In our experiment, the free cooling PUE is modeled tobe proportional to the ambient air temperature according
4

USENIX Association 11th International Conference on Autonomic Computing 253
to [10]. This is because when the outside air temperatureis relatively high, more air is needed to take away theheat generated by the servers, and the fan speed of AHUneeds to be higher to draw more air.
In our paper, we assume that only one of the two aircooling systems can run at one time in a hybrid-cooleddata center. Thus the total air cooling power consump-tion can be expressed as:
Pair = βPairCRAC +(1−β )Pair
f ree (9)
where β is a binary variable indicating which air coolingsystem is activated.
• Liquid Cooling Power Model
With M liquid-cooled servers and the microprocessorconsuming α percent of the server power, we have theliquid cooling power consumption as
Pliquid =∑M
i=1 αPserveri
COPliquid (10)
where COPliquid is the COP of the chiller used in theliquid cooling system. Due to the high cooling capac-ity of liquid medium, the changes of the liquid temper-ature and the flow rate hardly affect the COP value, andthus COPliquid can be viewed as a constant. To derivea COP that can provide cooling guarantee for all theliquid-cooled servers, we run simple experiments withthe worst-case setup by putting all servers to 100% uti-lization, and adjust the chiller set point and flow rate ofthe cold plate to ensure the microprocessor temperatureis below the threshold. We then use the COP gained inthis situation as a constant.
4.2 Power MinimizationWe now formulate the power minimization problem ofthe hybrid-cooled data center. N servers are deployedin the data center and M of them are liquid-cooled. As-suming that the total workload is Wtotal , we minimize thetotal power consumption as:
min{Pserver +Pair +Pliquid} (11)
Subject to:N
∑i=1
Wi =Wtotal (12)
T mpi < T mp
th 1 ≤ i ≤ M (13)
T ini < T in
th M+1 ≤ i ≤ N (14)
Equation 12 guarantees that all the workload Wtotal ishandled by the servers. Equation 13 enforces that themicroprocessors’ temperatures of these M liquid-cooledservers are below the required threshold T mp
th . Equation14 enforces that the inlet temperatures of the (N −M)air-cooled servers are below the required threshold T in
th .
Figure 3: Data center model used in evaluation
4.3 CFD-based Recirculation Matrix andOptimization Solution
We now explain how to get the CFD-based recirculationmatrix H. In Equation 6, hi j is an element of the matrix H,indicating the percentage of heat flow recirculated fromserver i to server j. To simulate the thermal environmentof the data center, we use Fluent [5], which is a CFD soft-ware package. Figure 3 shows both the layout of the datacenter model used in this paper and an example of thethermal environment when all the servers are air-cooled.We set the CRAC supply temperature in CFD and use itto get the outlet temperature of each server, in differentworkload distribution scenarios. After getting the powerconsumption (Pair
i ), the outlet temperature of each server(T i
out ,Tj
out ) and the CRAC supply temperature (Tsup) in allthe scenarios, we use them to solve the linear equationshown in Equation 6 and get the recirculation matrix H.
To solve the optimization problems, we use LINGO[15], a comprehensive optimization tool. LINGO em-ploys branch-and-cut methods to break a non-linear pro-gramming model down into a list of sub problems to en-hance the computation efficiency. It is important to notethat our scheme performs offline optimization to deter-mine workload distribution, server on/off and the cool-ing mode of the data center at different outside temper-atures. To dynamically determine those configurations,our scheme can conduct the optimization for differentloading levels in an offline fashion and then apply the re-sults online based on the current loading and the currentoutside temperature.
5 Power Optimization for Geo-DistributedHybrid-cooled Data Centers
Some big IT companies may have multiple data centersaround the world. Although the power minimization fora single hybrid-cooled data center is helpful, it might notbe efficient enough for geo-distributed data centers. It isbecause data centers at different locations have differentoutside temperatures which lead to different cooling ef-ficiencies. Therefore, it is important to manage the geo-
5
254 11th International Conference on Autonomic Computing USENIX Association
Local Optimizer
Local Optimizer
Local Optimizer
Global Optimizer
CRAC or AHU
Hybrid Cooled Data Center Users
Workload Dispatcher
Workload
Data Center Power Model
Air Cooled Data Center
Liquid Cooled Data Center
Pipe Valves
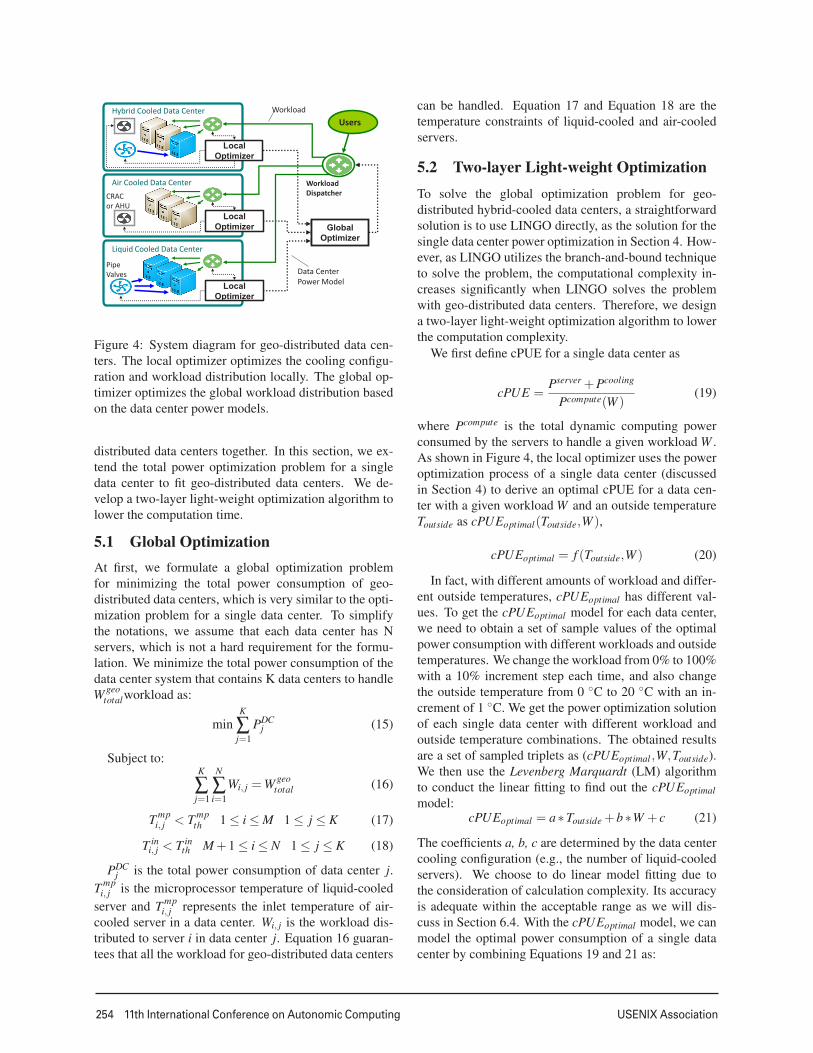
Figure 4: System diagram for geo-distributed data cen-ters. The local optimizer optimizes the cooling configu-ration and workload distribution locally. The global op-timizer optimizes the global workload distribution basedon the data center power models.
distributed data centers together. In this section, we ex-tend the total power optimization problem for a singledata center to fit geo-distributed data centers. We de-velop a two-layer light-weight optimization algorithm tolower the computation time.
5.1 Global OptimizationAt first, we formulate a global optimization problemfor minimizing the total power consumption of geo-distributed data centers, which is very similar to the opti-mization problem for a single data center. To simplifythe notations, we assume that each data center has Nservers, which is not a hard requirement for the formu-lation. We minimize the total power consumption of thedata center system that contains K data centers to handleW geo
totalworkload as:
minK
∑j=1
PDCj (15)
Subject to:K
∑j=1
N
∑i=1
Wi, j =W geototal (16)
T mpi, j < T mp
th 1 ≤ i ≤ M 1 ≤ j ≤ K (17)
T ini, j < T in
th M+1 ≤ i ≤ N 1 ≤ j ≤ K (18)
PDCj is the total power consumption of data center j.
T mpi, j is the microprocessor temperature of liquid-cooled
server and T mpi, j represents the inlet temperature of air-
cooled server in a data center. Wi, j is the workload dis-tributed to server i in data center j. Equation 16 guaran-tees that all the workload for geo-distributed data centers
can be handled. Equation 17 and Equation 18 are thetemperature constraints of liquid-cooled and air-cooledservers.
5.2 Two-layer Light-weight OptimizationTo solve the global optimization problem for geo-distributed hybrid-cooled data centers, a straightforwardsolution is to use LINGO directly, as the solution for thesingle data center power optimization in Section 4. How-ever, as LINGO utilizes the branch-and-bound techniqueto solve the problem, the computational complexity in-creases significantly when LINGO solves the problemwith geo-distributed data centers. Therefore, we designa two-layer light-weight optimization algorithm to lowerthe computation complexity.
We first define cPUE for a single data center as
cPUE =Pserver +Pcooling
Pcompute(W )(19)
where Pcompute is the total dynamic computing powerconsumed by the servers to handle a given workload W .As shown in Figure 4, the local optimizer uses the poweroptimization process of a single data center (discussedin Section 4) to derive an optimal cPUE for a data cen-ter with a given workload W and an outside temperatureToutside as cPUEoptimal(Toutside,W ),
cPUEoptimal = f (Toutside,W ) (20)
In fact, with different amounts of workload and differ-ent outside temperatures, cPUEoptimal has different val-ues. To get the cPUEoptimal model for each data center,we need to obtain a set of sample values of the optimalpower consumption with different workloads and outsidetemperatures. We change the workload from 0% to 100%with a 10% increment step each time, and also changethe outside temperature from 0 ◦C to 20 ◦C with an in-crement of 1 ◦C. We get the power optimization solutionof each single data center with different workload andoutside temperature combinations. The obtained resultsare a set of sampled triplets as (cPUEoptimal ,W,Toutside).We then use the Levenberg Marquardt (LM) algorithmto conduct the linear fitting to find out the cPUEoptimalmodel:
cPUEoptimal = a∗Toutside +b∗W + c (21)
The coefficients a, b, c are determined by the data centercooling configuration (e.g., the number of liquid-cooledservers). We choose to do linear model fitting due tothe consideration of calculation complexity. Its accuracyis adequate within the acceptable range as we will dis-cuss in Section 6.4. With the cPUEoptimal model, we canmodel the optimal power consumption of a single datacenter by combining Equations 19 and 21 as:
6
USENIX Association 11th International Conference on Autonomic Computing 255
0 5 10 15 20120
130
140
150
160
Outside Temperature (Celsius)
Tota
l Pow
er (k
W)
Load−UnawareLiquid−FirstSmartCool
(a) Total Power at 30% Loading
0 5 10 15 20200
220
240
260
280
300
320
Outside Temperature (Celsius)
Tota
l Pow
er (k
W)
Load−UnawareLiquid−FirstSmartCool
(b) Total Power at 50% Loading
0 5 10 15 20300
350
400
450
500
Outside Temperature (Celsius)
Tota
l Pow
er (k
W)
Load−UnawareLiquid−FirstSmartCool
(c) Total Power at 70% Loading
Figure 5: Total power consumption with Load-Unaware, Liquid-First and SmartCool at different loadings
a b c a b c a b c0
10
20
30
40
50
0 (Celsius) 10 (Celsius) 20 (Celsius)
Coo
ling
Pow
er (k
W)
Air FreeAir ChillerLiquid Cooling
(a) Power break at 30% Loading
a b c a b c a b c0
20
40
60
80
100
120
0 (Celsius) 10 (Celsius) 20 (Celsius)
Coo
ling
Pow
er (k
W)
Air FreeAir ChillerLiquid Cooling
(b) Power break at 50% Loading
a b c a b c a b c0
50
100
150
200
250
0 (Celsius) 10 (Celsius) 20 (Celsius)
Coo
ling
Pow
er (k
W)
Air FreeAir ChillerLiquid Cooling
(c) Power break at 70% Loading
Figure 6: Cooling power breakdown for different schemes (x-axis: a is Load-Unaware, b is Liquid-First, c is Smart-Cool)
PDC = Pcompute(W )∗ cPUEoptimal(Toutside,W ) (22)
Given a specific moment, the air temperature outsidea data center is a constant, and thus PDC only dependson W. As shown in Figure 4, the local optimizer sendsthe PDC(W ) model to the global optimizer, which opti-mizes the total power consumption by manipulating theworkload assigned to each data center. This optimizationproblem is also solved using LINGO.
Our algorithm successfully decouples the globalpower optimization problem to a global workload dis-tribution problem and a power optimization problem ofeach local data center, and thus reduces the optimizationoverhead significantly.
5.3 Maintaining Response Time
When the workload dispatching is managed by the globaloptimizer in Figure 4, the request response time needsto be maintained below a threshold. We consider twocomponents of response time: the queuing delay withinthe data center, and the network delay outside the datacenter.
A data center can be modeled as a GI/G/m queue [11].Using the Allen-Cullen approximation for the GI/G/mmodel, the queuing delay and the number of serversneeded to satisfy a given workload demand are relatedas follows:
R =1µ+
Pm
µ(1−ρ)(C2
A +C2B
2m) (23)
where R is the average queuing delay. 1µ is the aver-
age processing time of a request. ρ is the average serverutilization. m is the number of servers. Pm = ρ
m+12 for
ρ < 0.7. Pm = ρm+ρ2 for ρ > 0.7 and C2
A and C2B repre-
sent the squared coefficients of the variation of requestinter-arrival times and request sizes, respectively. Thenetwork delay di j between the source i and the data cen-ter j is taken to be proportional to the geographical dis-tances between them.
When dispatching workload among data centers, wehave the constraint that
W +di j < Ti j (24)
where Ti j is the response time threshold of the requestsdispatched from source i to data center j.
6 Simulation Results
In this section, we present our evaluation results from thesimulation.6.1 Evaluation SetupTo evaluate different power optimization schemes in asingle hybrid-cooled data center, we use a data centermodel that employs the standard configuration of alter-nating hot and cold aisles, which is consistent with thoseused in the previous studies [11]. Figure 3 shows boththe data center layout and a thermal environment exam-ple when all the servers are air-cooled. The data centerconsists of four rows of servers, where the first row iscomposed of liquid-cooled servers. Each row has eightracks, where each rack has 40 servers, adding up to 1,280
7
256 11th International Conference on Autonomic Computing USENIX Association
servers in the entire data center. The server in our datacenter model has a 100W idle power consumption anda 300W maximum power consumption when fully uti-lized. The volumetric flow rate of the intake air of eachserver is 0.0068m3/s. Each of the four CRAC units in thedata center pushes chilled air into a raised floor plenumat a rate of 9000 f t3/min [11]. There also exists a freecooling economizer system that uses outside air whensuitable to meet the cooling requirements.
For the liquid-cooled servers we use the rack CDU(coolant distribution unit), in which the CPU of everyserver is cooled by cold plate and the other componentsare cooled by the chilled air. We have two chiller sys-tems, of which one is to supply cold water for the coldplates and the other one is to supply the coolant to theCRAC units.
To evaluate different power optimization schemesamong different data centers, we consider about threedata centers with different cooling configuration, a air-cooled data center ( all the four rows of servers areair-cooled), a hybrid-cooled data center ( one row ofservers are liquid-cooled as discussed in the previousparagraphes ) and a liquid-cooled data center ( all theservers are liquid-cooled ). The only difference betweenthese three data centers are the number of liquid-cooledservers. Other settings of the data centers are the same.
6.2 Comparison of Cooling Schemes
In this section, we compare our SmartCool scheme withtwo baselines: Load-Unaware and Liquid-First.
Load-Unaware determines the cooling mode by com-paring the outside temperature to a fixed temperaturethreshold, which is equal to the highest CRAC supplytemperature that can safely cool the servers when theyare all fully utilized. When the outside temperature is be-low the threshold free air cooling is used, otherwise thetraditional air cooling system with chillers and pumps isselected. Load-Unaware prefers to distribute the work-load to the liquid-cooled servers. If they are fully uti-lized, the remaining workload is then distributed to theair-cooled servers. The servers in the middle of each rowand at the bottom of each rack are prior, as servers lo-cated at those places have less recirculation impact andlower inlet temperature [11].
In contrast, Liquid-First dynamically adjusts the tem-perature threshold for free air cooling, based on the real-time workload. It first distributes workload to the serversin the same way as Load-Unaware, and then uses thehighest CRAC supply temperature that can safely coolthe servers as the temperature threshold.
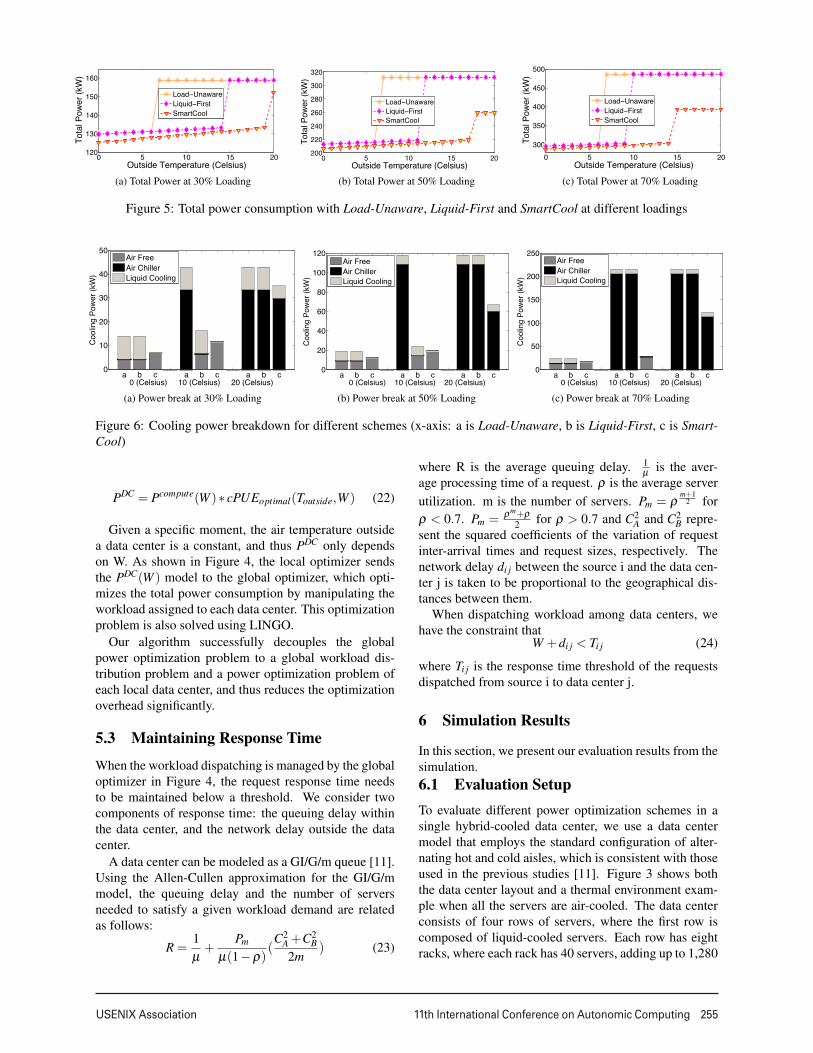
Figure 5 shows the total power consumption of thethree different schemes at different loadings with differ-ent outside temperature. We can see from the results that
30% 50% 70%0
100
200
300
Average Workload
Tot
al P
ower
(kW
) Global OptimalSmartCool
(a) Power Comparison
30% 50% 70%0
50
100
150
200
Average Workload
Tim
e R
equi
red
(S)
Global OptimalSmartCool
(b) Time Comparison
Figure 7: Power consumption and required time compar-ison between Global Optimal and SmartCool
all the three cooling schemes achieve a low power con-sumption when the outside temperature is low, becauseall of them can use free air cooling. Compared withLoad-Unaware and Liquid-First, SmartCool shows thelowest power consumption because it considers the heatrecirculation among air-cooled servers when distributingworkload.
When the outside temperature increases, we can seethat Load-Unaware is the first to have a jump in thepower consumption curve among the three schemes.This is because Load-Unaware uses a fixed temperaturethreshold to decide whether to use free air cooling ornot. The temperature threshold of Load-Unaware is de-termined with the data center running a 100% percentworkload. Therefore, it is unnecessarily low for lessworkload such as 30%. Liquid-First is the second one tohave a power consumption jump due to switching fromfree air cooling to CRAC cooling. It can use free air cool-ing more than Load-Unaware when the outside tempera-ture is higher, because its temperature threshold is deter-mined based on the real-time workload (e.g., 30%, 50%or 70%) rather than the maximum workload (100%).Hence Liquid-First saves power compared with Load-Unaware. SmartCool scheme is the last one to have thepower consumption jump, because SmartCool optimizesthe workload distribution among liquid-cooled and air-cooled servers, while the two baselines concentrate theworkload on a small number of air-cooled servers andresult in some hot spots when air cooling is necessary.Those hot spots require a lower temperature of the sup-plied air for cooling and thus increase the power con-sumption. Therefore, SmartCool is the most power effi-cient scheme.
6.3 Power Breakdown of Cooling SchemesIn Figure 6, we break the cooling power consumptionof the three schemes (including Load-Unaware,Liquid-First and SmartCool) into Air Free (free cooling powerconsumption), Air Chiller (traditional air cooling powerconsumption) and Liquid Cooling (liquid cooling power
8

USENIX Association 11th International Conference on Autonomic Computing 257
0 50 100 1505
10
15
20
25
30
Time Interval (1h per point)
Tem
pera
ture
(Cel
sius
)
GenevaHaminaChicago
(a) Temperature Trace
0 50 100 15035
40
45
50
Time Interval (1h per point)
Aver
age
CPU
Util
izat
ion
(b) IBM trace file
0 50 100 150500
600
700
800
900
1000
Time Interval (1 hour per point)
Tota
l Pow
er (k
W) SmartCool
Low−Temp−FirstLiquid−First
(c) Total Power Consumption Comparison
Figure 8: Total Power Consumption comparison of different workload dispatching schemes
consumption). We choose three outside temperaturepoints, 0 ◦C, 10 ◦C and 20 ◦C to discuss the impact ofoutside temperature.
Figure 6 (a) shows the cooling power under differ-ent outside temperatures at 30% loading. We can seethat when the outside temperature is 0 (Celsius), Load-Unaware and Liquid-First consume the same amount ofcooling power. SmartCool consumes less cooling powerthan the two baselines because it distributes all the work-load to the air-cooled servers, which are cooled by themore efficient free air, while the baselines prefer to useliquid-cooled servers.
When the outside temperature raises to 10 ◦C, Load-Unaware switches to the traditional air cooling mode,which starts to use the chiller system and leads to theincrease of the cooling power consumption. Differently,the other two schemes show similar results as those at 0◦C. When the outside temperature is 20 ◦C, all the threeschemes switch to traditional air cooling mode. How-ever, SmartCool still consumes less cooling power be-cause it considers the impact of air recirculation and op-timizes the workload distribution.
Figures 6 (b) and 6 (c) show the breakdown of coolingpower consumption when the data center is at 50% and70% loading. They show the same trends as 6 (a) thoughthe total cooling power increases due to the increase ofthe workload.
6.4 Comparison between SmartCool andGlobal Optimal Solution
In this section, we evaluate our two-layer power opti-mization algorithm in the geo-distributed data center set-tings and compare it with the global optimization schemein terms of optimization performance, including the op-timized total power consumption and the time overhead.The global optimal scheme solves the geo-distributedpower optimization problem as a whole including decid-ing the global and local workload distribution as wellas the cooling mode management of each data center.SmartCool uses a two-layer optimization algorithm asdiscussed in Section 5. Due to the long computationtime of the global optimization scheme, we use threesmaller scale data centers in this set of experiments. Eachdata center has two rows of racks. Each row contains 4racks and each rack contains four blocks. There exists 10
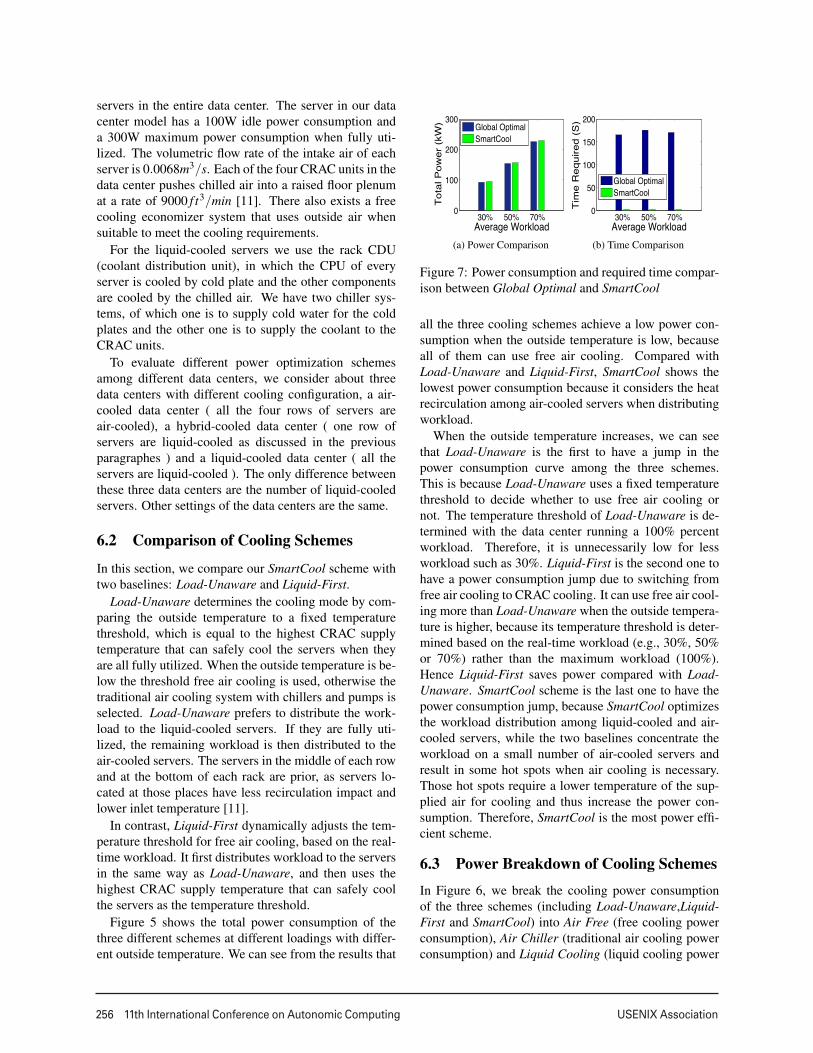
servers in each block.Figure 7(a) shows the total power consumption of
the two schemes at different loadings. We can seethat SmartCool has very close optimization result to theglobal optimal solution. The performance difference isdue to the model fitting error introduced from the cPUEmodeling process as discussed in Section 5. However,our SmartCool consumes much less time than the GlobalOptimal solution according to Figure 7(b).
6.5 Results with Real Workload and Tem-perature Traces
We now evaluate different power management schemeson three geo-distributed data centers with real workloadand temperature traces. Each data center contains 1,280servers. To show the diversity of different data centers,we configure them with different cooling system, whichare air cooling, liquid cooling and hybrid cooling, re-spectively. The outside temperatures are shown in Fig-ure 8 (a) which are one week temperature traces of threedifferent locations, Geneva, Hamina and Chicago [25].
We compare the total power consumption under threeworkload dispatching schemes: Liquid-First, Low-Temp-First and SmartCool. Liquid-First dispatches workloadto the three data centers according to their cooling effi-ciencies, which are ranked from high to low as the liquid-cooled data center, the hybrid-cooled data center and theair- cooled data center. Thus workload is first dispatchedto the liquid-cooled data center and if it can not handleall the workload, the rest part is dispatched to the hybrid-cooled data center and then the air-cooled data center.For Low-Temp-First, workload is first distributed to thedata center with the lowest outside temperature since ithas the highest possibility to use free cooling systemwhich will consume the least cooling power. For Smart-Cool, workload is distributed according to the approachdiscussed in Section 5.
Figure 8 (b) shows a one week trace of the averageCPU utilization from an IBM production data center[29]. We use this trace to generate the total workloadin our experiment. Figure 8 (c) shows the power con-sumption of the three different schemes. We can seethat our SmartCool consumes the least power becauseit considers the impacts of both the outside tempera-
9
258 11th International Conference on Autonomic Computing USENIX Association
a b c a b c a b c0
50
100
150
22°C 26°C 30°C
Pow
er (k
W)
Server PowerLiquid Cooling PowerAir Cooling Power
(a) Total power at 30% Loading
a b c a b c a b c0
50
100
150
200
22°C 26°C 30°C
Pow
er (k
W)
Server PowerLiquid Cooling PowerAir Cooling Power
(b) Total Power at 50% Loading
a b c a b c a b c0
100
200
300
22°C 26°C 30°C
Pow
er (k
W)
Server PowerLiquid Cooling PowerAir Cooling Power
(c) Total Power at 70% Loading
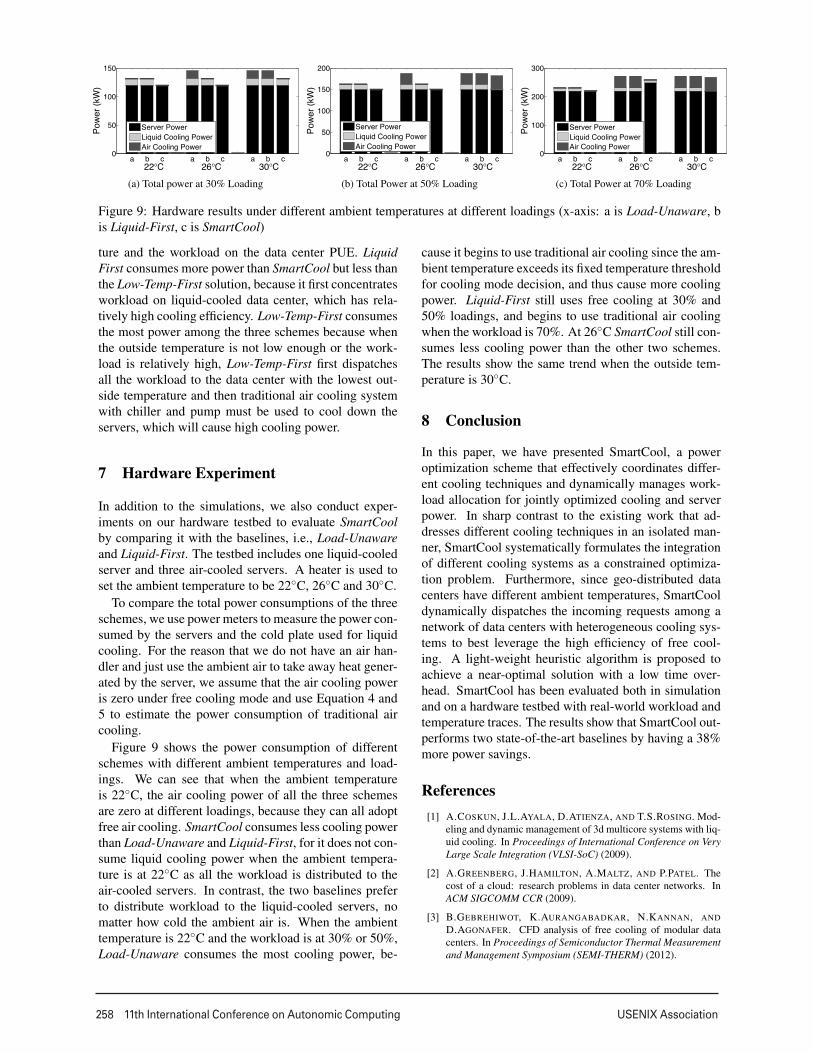
Figure 9: Hardware results under different ambient temperatures at different loadings (x-axis: a is Load-Unaware, bis Liquid-First, c is SmartCool)
ture and the workload on the data center PUE. LiquidFirst consumes more power than SmartCool but less thanthe Low-Temp-First solution, because it first concentratesworkload on liquid-cooled data center, which has rela-tively high cooling efficiency. Low-Temp-First consumesthe most power among the three schemes because whenthe outside temperature is not low enough or the work-load is relatively high, Low-Temp-First first dispatchesall the workload to the data center with the lowest out-side temperature and then traditional air cooling systemwith chiller and pump must be used to cool down theservers, which will cause high cooling power.
7 Hardware Experiment
In addition to the simulations, we also conduct exper-iments on our hardware testbed to evaluate SmartCoolby comparing it with the baselines, i.e., Load-Unawareand Liquid-First. The testbed includes one liquid-cooledserver and three air-cooled servers. A heater is used toset the ambient temperature to be 22◦C, 26◦C and 30◦C.
To compare the total power consumptions of the threeschemes, we use power meters to measure the power con-sumed by the servers and the cold plate used for liquidcooling. For the reason that we do not have an air han-dler and just use the ambient air to take away heat gener-ated by the server, we assume that the air cooling poweris zero under free cooling mode and use Equation 4 and5 to estimate the power consumption of traditional aircooling.
Figure 9 shows the power consumption of differentschemes with different ambient temperatures and load-ings. We can see that when the ambient temperatureis 22◦C, the air cooling power of all the three schemesare zero at different loadings, because they can all adoptfree air cooling. SmartCool consumes less cooling powerthan Load-Unaware and Liquid-First, for it does not con-sume liquid cooling power when the ambient tempera-ture is at 22◦C as all the workload is distributed to theair-cooled servers. In contrast, the two baselines preferto distribute workload to the liquid-cooled servers, nomatter how cold the ambient air is. When the ambienttemperature is 22◦C and the workload is at 30% or 50%,Load-Unaware consumes the most cooling power, be-
cause it begins to use traditional air cooling since the am-bient temperature exceeds its fixed temperature thresholdfor cooling mode decision, and thus cause more coolingpower. Liquid-First still uses free cooling at 30% and50% loadings, and begins to use traditional air coolingwhen the workload is 70%. At 26◦C SmartCool still con-sumes less cooling power than the other two schemes.The results show the same trend when the outside tem-perature is 30◦C.
8 Conclusion
In this paper, we have presented SmartCool, a poweroptimization scheme that effectively coordinates differ-ent cooling techniques and dynamically manages work-load allocation for jointly optimized cooling and serverpower. In sharp contrast to the existing work that ad-dresses different cooling techniques in an isolated man-ner, SmartCool systematically formulates the integrationof different cooling systems as a constrained optimiza-tion problem. Furthermore, since geo-distributed datacenters have different ambient temperatures, SmartCooldynamically dispatches the incoming requests among anetwork of data centers with heterogeneous cooling sys-tems to best leverage the high efficiency of free cool-ing. A light-weight heuristic algorithm is proposed toachieve a near-optimal solution with a low time over-head. SmartCool has been evaluated both in simulationand on a hardware testbed with real-world workload andtemperature traces. The results show that SmartCool out-performs two state-of-the-art baselines by having a 38%more power savings.
References[1] A.COSKUN, J.L.AYALA, D.ATIENZA, AND T.S.ROSING. Mod-
eling and dynamic management of 3d multicore systems with liq-uid cooling. In Proceedings of International Conference on VeryLarge Scale Integration (VLSI-SoC) (2009).
[2] A.GREENBERG, J.HAMILTON, A.MALTZ, AND P.PATEL. Thecost of a cloud: research problems in data center networks. InACM SIGCOMM CCR (2009).
[3] B.GEBREHIWOT, K.AURANGABADKAR, N.KANNAN, ANDD.AGONAFER. CFD analysis of free cooling of modular datacenters. In Proceedings of Semiconductor Thermal Measurementand Management Symposium (SEMI-THERM) (2012).
10

USENIX Association 11th International Conference on Autonomic Computing 259
[4] CERN . Data Centre. http://home.web.cern.ch/about/computing.
[5] COMPUTATIONAL FLUID DYNAMICS (CFD) SOFTWARE BYANSYS INC. . Fluent. http://www.caeai.com/cfd-software.php.
[6] D.CHEMICOFF. The uptime institute 2012 data center survey.http://symposium.uptimeinstitute.com.
[7] D.C.SUJATHA, AND S.ABIMANNAN. Energy efficient free cool-ing system for data centers. In Proceedings of IEEE Third Inter-national Conference on Could Computing Technology and Sci-ence (CloudCom) (2011).
[8] D.HWANG, V.P.MANNO, M.HODES, AND G.J.CHAN. Energysavings achievable through liquid cooling: A rack level casestudy. In Proceedings of Intersociety Conference on Thermal andThermomechanical Phenomena in Electronic Systems (ITherm)(2010).
[9] D.SUJATHA, AND S.ABIMANNAN. Energy efficient free coolingsystem for data centers. In Proceedings of International Confer-ence on Cloud Computing Technology and Science (CloudCom)(2011).
[10] EMERSON. Liebert DSE precision cooling system salesbrochure . http://www.emersonnetworkpower.com.
[11] F.AHMAD, AND T.N.VIJAYKUMAR. Joint optimization of idleand cooling power in data centers while maintaining responsetime. In Proceedings of International Conference on Architec-tural Support for Programming Languages and Operating Sys-tems (ASPLOS) (2010).
[12] I.GOIRI, W.KATSAK, K.LE, T.NGUYEN, AND R.BIANCHINI.Parasol and greenswitch: Managing datacenters powered by re-newable energy. In Proceedings of International Conference onArchitectural Support for Programming Languages and Operat-ing Systems (ASPLOS) (2013).
[13] K.ZHENG, X.WANG, L.LI, AND X.WANG. Joint power opti-mization of data center network and servers with correlation anal-ysis. In Proceedings of the 33rd IEEE International Conferenceon Computer Communications (INFOCOM) (2014).
[14] L.A.BARROSO, J.CLIDARAS, AND U.HOLZLE. The datacenteras a computer: An introduction to the design of warehouse-scalemachines. In Morgan and Claypool Publishers (2009).
[15] LINDO SYSTEMS INC. LINDO software products.http://www.lindo.com.
[16] M.A.ADNAN, R.SUGIHARA, AND R.GUPTA. Energy efficientgeographical load balancing via dynamic deferral of workload.In Proceedings of 5th IEEE conference on cloud computing(CLOUD) (2012).
[17] M.BROCANELLI, S.LI, X.WANG, AND W.ZHANG. Joint man-agement of data centers and electric vehicles for maximized reg-ulation profits. In Proceedings of the fourth IEEE InternationalGreeen Computing Conference (IGCC) (2013).
[18] M.IYENGAR, M.DAVID, P.PARIDA, AND V.KAMATH. Serverliquid cooling with chiller-less data center design to enable sig-nificant energy savings. In Proceedings of Semiconductor Ther-mal Measurement and Management Symposium (SEMI-THERM)(2012).
[19] M.IYENGAR, M.DAVID, P.PARIDA, AND V.KAMATH. Serverliquid cooling with chiller-less data center design to enable sig-nificant energy savings. In Proceedings of Semiconductor Ther-mal Measurement and Management Symposium (SEMI-THERM)(2012).
[20] Q.TANG, S.K.S.GUPTA, AND G.VARSAMOPOULOS. Thermal-aware task scheduling for data centers through minimizing heatrecirculation. In Proceedings of IEEE International Conferenceon Cluster Computing (2007).
[21] Q.TANG, T.MUKHERJEE, S.GUPTA, AND P.CAYTON. Sensor-based fast thermal evaluation model for energy efficient high-performance data centers. In Proceedings of International Con-ference on Intelligent Systems and Image Processing (ICISIP)(2006).
[22] R.ANTON, H.JONSSON, AND B.PALM. Modeling of air con-ditioning systems for cooling of data centers. In Proceedings ofIntersociety Conference on Thermal and Thermomechanical Phe-nomena in Electronic Systems (ITHERM) (2002).
[23] R.ZHOU, Z.WANG, C.E.BASH, AND A.MCREYNOLDS. Datacenter cooling management and analysis-a model based ap-proach. In Proceedings of Semiconductor Thermal Measurementand Management Symposium (SEMI-THERM) (2012).
[24] S.MOVOTNY. Data center rack level cooling utilizing water-cooled, passive rear door heat exchangers as a cost effective al-ternative to crash air cooling.
[25] TIMEANDDATE. Weather around the World.www.timeanddate.com.
[26] TREEHUGGER INC. . Data Center Cooling Energy ReductionThanks to Fluid Submerged Servers. http://www.treehugger.com.
[27] W.HUANG, M.ALLEN-WARE, J.B.CARTER, ANDE.ELNOZAHY. TAPO: Thermal-aware power optimizationtechniques for servers and data centers. In Proceedings of IEEEInternational Greeen Computing Conference (IGCC) (2011).
[28] W.ZHENG, K.MA, AND X.WANG. Exploiting thermal energystorage to reduce data center capital and operating expenses. InProceedings of the 20th International Symposium on High Per-formance Computer Architecture (HPCA) (2014).
[29] X.WANG, M.CHEN, C.LEFURGY, AND T.W.KELLER. SHIP:Scalable hierarchical power control for large-scale data centers.In Proceedings of International Conference on Parallel and Dis-tributed Systems (PACT) (2009).
[30] Y.CHEN, D.GMACH, C.HYSER, Z.WANG, C.BASH,C.HOOVER, AND S.SINGHAL. Integrated management ofapplication performance, power and cooling in data centers.In Proceedings of Network Operations and ManagementSymposium (NOMS) (2010).
[31] Y.ZHANG, Y.WANG, AND X.WANG. Electricity bill capping forcloud-scale data centers that impact the power markets. In Pro-ceedings of the International Conference on Parallel Processing(2012).
[32] Y.ZHANG, Y.WANG, AND X.WANG. TEStore: Exploiting ther-mal and energy storage to cut the electricity bill for datacentercooling. In Proceedings of the 8th International Conference onNetwork and Service Management (CNSM) (2012).
[33] Z.LIU, M.LIN, AND L.ANDREW. Greening geographical loadbalancing. In Proceedings of the ACM SIGMETRICS joint inter-national conference on Measurement and modeling of computersystems (2011).
[34] Z.LIU, Y.CHEN, C.BASH, A.WIERMAN, D.GMACH, Z.WANG,M.MARWAH, AND C.HYSER. Renewable and cooling awareworkload management for sustainable data centers. In Proceed-ings of the ACM SIGMETRICS joint international conference onMeasurement and modeling of computer systems (2012).
[35] Z.WANG, C.BASH, C.HOOVER, AND A.MCREYNOLDS. Inte-grated management of cooling resources in air-cooled data cen-ters. In Proceedings of IEEE Conference on Automation Scienceand Engineering (CASE) (2010).
11