Embed Size (px)
Citation preview

2020 Annual ReportCo-operators General Insurance Company
The Co-operators is valued by Canadians as…
• a champion of their prosperity and peace of mind• a trusted leader in the financial services industry,
distinct in its co-operative character• a catalyst for a sustainable society
At The Co-operators, we:
• act with integrity• treat our members and clients with respect• inspire and support our employees in their
achievement of excellence• give life to co-operative principles and values• balance our economic goals with concern for
the environment and the welfare of society
The Co-operators: financial security for Canadians and their communities.
Our mission
1. Voluntary and open membership2. Democratic member control3. Member economic participation4. Autonomy and independence5. Education, training and information6. Co-operation among co-operatives7. Concern for community
Our vision
Statement of values
Global co-operative principles
2 Co-operators General Insurance Company | 2020 Annual Report

Table of contents02 Mission, vision, statement of
values and co-operative principles
04 Company profile/Corporate governance/Annual statement
05 Management’s Discussion and Analysis
44 Glossary of terms
46 Responsibility for financial reporting
47 Independent auditor’s report
52 Appointed actuary’s report
53 Consolidated financial statements
58 Notes to the consolidated financial statements
108 Corporate directory
109 Board of Directors
110 Member organizations
Co-operators General Insurance Company is a member of The Co-operators group of companies. As such, we approach best practices in corporate governance from an enterprise perspective. We disclose our corporate governance practices in significant detail in the Annual Information Form we file on SEDAR (sedar.com) at the end of March each year, and in our Integrated Annual Report.
This Annual Report constitutes the Annual Statement of Co-operators General Insurance Company (CGIC), which CGIC is required to deliver to its shareholders in accordance with s.334(1) of the Insurance Companies Act (Canada).
The following list sets out the sections of this Annual Report, which are delivered to shareholders in accordance with s.334(1) of the Insurance Companies Act (Canada), and the page numbers on which such sections are located within the Annual Report:
• Responsibility for financial reporting 46• The report of CGIC’s auditor 47• The report of CGIC’s actuary 52• CGIC’s consolidated financial statements 53• A list of CGIC’s subsidiaries 58 (note 1)• CGIC’s percentage of the voting rights for each of its subsidiaries 58 (note 1)• The carrying amount of the shares of each of CGIC’s subsidiaries 106 (note 27)• The address of each of CGIC’s subsidiaries’ head office 108
Co-operators General Insurance Company (CGIC) is a leading Canadian-owned multi-product insurance and financial services organization with assets of more than $8.2 billion. CGIC has 4,346 employees and is supported by a multi-channel distribution model, which is primarily led by a dedicated Financial Advisor network with 2,303 licensed insurance representatives throughout Canada. Other distribution networks include independent brokers, in-house home and auto contact centres marketed through credit union relationships, and other third-party channels. Under its primary line of business, Property and Casualty insurance, CGIC protects 890,000 homes, 1.5 million vehicles, 41,000 farms and 265,000 businesses.
Company profile
Corporate governance
Annual statement
4 Co-operators General Insurance Company | 2020 Annual Report
Management’sDiscussion & Analysis For the year ended December 31, 2020
February 12, 2021
This Management’s Discussion and Analysis (MD&A) comments on Co-operators General Insurance Company’s operations and financial condition for the year ended December 31, 2020.
Unless otherwise stated or the context otherwise indicates, in this report, “Co-operators General”, “we”, “us” and “our” refers to the Consolidated Co-operators General Insurance Company including its wholly owned subsidiaries: The Sovereign General Insurance Company (Sovereign), COSECO Insurance Company (COSECO), CUMIS General Insurance Company (CUMIS General), Co-operators Investment Limited Partnership (CILP), Co-operators Strategic Growth Corporation (CSGC) and Co-operators Insurance Agencies Limited (CIAL). CGIC refers to the non-consolidated Co-operators General Insurance Company.
The information in this discussion should be read in conjunction with our consolidated financial statements and notes. References to “Note” refer to the Notes to the consolidated financial statements. All amounts are expressed in Canadian dollars, unless otherwise specified, and are based on consolidated financial statements prepared in accordance with International Financial Reporting Standards (IFRS) as issued by the International Accounting Standards Board (IASB). Additional information relating to Co-operators General, including our Annual Information Form, can be found on SEDAR at www.sedar.com.
We use certain financial performance measures which do not have any standardized meaning prescribed by IFRS and are therefore unlikely to be comparable to similar measures presented by other issuers. They should not be viewed as an alternative to measures of financial performance determined in accordance with IFRS. Such measures are defined in this document in the Key Financial Measures (Non-IFRS) section.
The information in this discussion contains forward-looking statements that involve risks and uncertainties. Our actual results could differ materially from these forward-looking statements as a result of various factors, including those discussed below or in our Annual Information Form. Please read the cautionary note which follows.
CAUTION REGARDING FORWARD-LOOKING STATEMENTS This MD&A may contain forward-looking statements and forward-looking information, including statements regarding the operations, objectives, strategies, financial situation and performance of Co-operators General. These statements, which appear in this MD&A (including the documents incorporated by reference herein), generally can be identified by the use of forward-looking words such as “may”, “will”, “expect”, “intend”, “estimate”, “anticipate”, “believe”, “plan”, “would”, “should”, “could”, “trend”, “predict”, “likely”, “potential” or “continue” or the negative thereof and similar variations. These statements are not guarantees of future performance and involve known and unknown risks, uncertainties and other factors that may cause actual results or events to differ materially from those anticipated in the forward-looking statements or information. In addition, this MD&A may contain forward-looking statements and information attributed to third party industry sources. By its nature, forward-looking information involves numerous assumptions, known and unknown risks and uncertainties, both general and specific, that contribute to the possibility that the predictions, forecasts, projections and other forward-looking statements will not occur. Such forward-looking statements and information in this MD&A speak only as of the date of this MD&A.
Forward-looking statements and information in this MD&A include, but are not limited to, statements with respect to: our growth expectations, including negative growth; the impact of changes in governmental regulation on our company; possible changes in our expense levels; changes in tax laws; anticipated benefits of acquisitions and dispositions; and the impact of the COVID-19 pandemic on our operations and financial position.
With respect to forward-looking statements and information contained in this MD&A, we have made assumptions regarding, among other things: growth rates including negative growth and inflation rates in the Canadian and global economies; the Canadian and U.S. housing markets; the Canadian and global capital markets; the strength of the Canadian dollar relative to the U.S. dollar; employment levels and consumer spending in the Canadian economy; impacts of regulation and tax laws by the Canadian and provincial governments or their agencies, and the occurrence of and response to public health crises including the COVID-19 pandemic and their impact on our investments, operations and claims. Some of the assumptions we have made are described in Outlook, Business Developments and Operating Environment.
Co-operators General Insurance Company | 2020 Annual Report 5
Management’s Discussion & Analysis
Although we believe that the expectations reflected in the forward-looking statements and information are reasonable, there can be no assurance that such expectations will prove to be correct. We cannot guarantee future results, levels of activity, performance or achievements. Consequently, we make no representation that actual results achieved will be the same in whole or in part as those set out in the forward-looking statements and information. Some of the risks and other factors, some of which are beyond our control, which could cause results to differ materially from those expressed in the forward-looking statements and information contained in this MD&A and the documents incorporated by reference herein include, but are not limited to: the impact of the COVID-19 pandemic on our investments, operations and claims affecting the results of our operations and financial position; our ability to implement our strategy or operate our business as we currently expect; our ability to accurately assess the risks associated with the insurance policies that we write; unfavourable capital market developments or other factors which may affect our investments; the cyclical nature of the property and casualty insurance industry; our ability to accurately predict future claims frequency; the frequency and severity of weather related events; climate change; government regulations; litigation and regulatory actions; periodic negative publicity regarding the insurance industry; intense competition; our reliance on advisors to sell our products; our ability to successfully pursue our acquisition strategy; actions to be taken in connection with the sale of L’Union Canadienne, Compagnie d’assurances to Roins Financial Services Limited; our participation in the Facility Association (a mandatory pooling arrangement among all industry participants); terrorist attacks and ensuing events; the occurrence of catastrophic events; our ability to maintain our financial strength ratings; our ability to alleviate risk through reinsurance; our ability to successfully manage credit risk (including credit risk related to the financial health of reinsurers); our reliance on information technology and telecommunications systems; impacts of new or changing technologies, including those impacting personal transportation; breaches or failure of information system security and privacy, including cyber terrorism; our dependence on key employees; and general economic, financial and political conditions.
Readers are cautioned that the foregoing list of factors is not exhaustive. The forward-looking statements and information contained in this MD&A are expressly qualified by this cautionary statement. We are not under any duty to update any of the forward-looking statements after the date of this MD&A to conform such statements to actual results or to changes in our expectations except as otherwise required by applicable legislation.
COVID-19 PANDEMIC An outbreak of a strain of coronavirus identified as “COVID-19” was declared a global pandemic by the World Health Organization (WHO) on March 11, 2020. In response, a variety of public health interventions were taken and continue to be taken, to combat the spread of the virus. These interventions include travel restrictions, business closures, physical distancing requirements and general lockdowns. To stabilize the resultant global economic shock, governments and central banks instituted unprecedented fiscal and monetary policies to stimulate economies and capital markets. The COVID-19 pandemic and the global response to it have caused significant disruption to the activities of many organizations. The magnitude and duration of these disruptions are highly uncertain while the pandemic remains a significant public health threat.
At the onset of the pandemic, Co-operators General activated its Business Continuity Plan which, among other management protocols, involved the suspension of all business travel and a mandatory work from home policy to implement physical distancing guidelines in accordance with federal and provincial public health agencies. To protect the health and safety of our employees, clients and communities, many of our employees continue to work remotely while some offices have reopened on a limited-scale, allowing employees to return to the office on a voluntary basis. However, due to a resurgence of the virus in the latter part of the fourth quarter, considerable uncertainty remains on how the pandemic will evolve in 2021, including impacts to our invested asset portfolio and claims development. Co-operators General has leveraged considerable resources to closely monitor the evolution of the pandemic and has considered its impacts on our operations and financial condition in this MD&A and related consolidated financial statements.
To assist our clients in these challenging times, Co-operators General introduced various support measures, including auto premium relief and flexible payment options. One of the many relief measures was the Reduced Driving Refund, where during the year, we set aside more than $35.0 million for clients to apply for a 15% refund on eligible auto premiums paid between April 1 to May 31, with sign-up ending on December 15. As at December 31, 2020, $20.3 million in direct relief was returned to eligible policyholders with the remainder of the unclaimed refund reinvested into communities across Canada through charitable organizations, prioritizing the support of vulnerable and marginalized Canadians experiencing increased financial and social challenges in these uncertain times.
6 Co-operators General Insurance Company | 2020 Annual Report
CORPORATE OVERVIEW ABOUT US
As a leading Canadian-owned multi-line insurer, Co-operators General plays a vital role in providing home, automobile, farm and commercial insurance products to individuals and businesses through a diverse distribution network. We are one of the largest providers of property and casualty (P&C) insurance in Canada with a national market share of approximately 6.1%1. Our multi-channel distribution model operates under our four main operating companies:
CGIC - Distributes both personal and commercial insurance products through a dedicated financial advisor network with 2,303 licensed insurance representatives throughout Canada. CGIC also distributes the life insurance and wealth management products of Co-operators Life Insurance Company (CLIC), an affiliated company. Customers may also obtain quotes for our suite of insurance products by visiting www.cooperators.ca.
Sovereign - Writes complex commercial and specialty risks for Canadian businesses.
COSECO - Provides home and auto insurance to employer, association and affinity groups across Canada.
CUMIS General - Provides personal and commercial insurance products for credit unions and their members.
Co-operators General’s parent company is Co-operators Financial Services Limited (CFSL) and its ultimate parent company is The Co-operators Group Limited (CGL), a Canadian-owned co-operative with 45 members. Significant associated companies under common control include CLIC, CUMIS Life Insurance Company, Addenda Capital Inc. (Addenda), Federated Agencies Limited, H.B. Group Insurance Management Ltd. (HB Group), Premier Managers Holdings Corporation, and The Edge Benefits Limited. “The Co-operators” refers to CGL and its direct and indirect subsidiaries. The majority of Co-operators General’s investment portfolio is managed by Addenda, an investment management firm. We also share many other corporate services with affiliated companies in order to maximize synergies amongst the group of companies.
CORPORATE STRATEGY
The year 2020 marks the 75th anniversary of the founding of The Co-operators. Our founders built a co-operative that would address the changing and unmet needs of Canadians. For 75 years, we have been committed to that purpose and we remain focused on it today. From day one, we have focused on protecting the safety and well-being of our clients, employees, and our communities. 2020 was a year disrupted by the COVID-19 pandemic, in which we took steps to keep our people and our communities healthy and safe, including enabling our employees and client-facing staff to work remotely. We mobilized our entire co-operative to continue meeting the fast-evolving needs of the people we serve, while protecting and preparing our clients for the future.
With our business poised to move forward, 2020 marks the half-way point of our 2019-2022 corporate strategy. Our corporate strategy contains five strategic focus areas: Client Engagement, Co-operative Identity, Competitiveness, Create the Future and Workforce Capability. This section highlights some of the advances that we have made toward executing our strategy.
Client Engagement: We will be the leader in client engagement within the financial services industry. We will ensure that the client is at the center of our decision-making and solution delivery and provide a consistent and seamless client experience across all interaction points. We will offer advice and solutions for holistic financial security, while continuously working to understand client needs and preferences.
A cornerstone of our strategy is a commitment to create a guided omni-channel experience for our clients. A guided omni-channel experience tailors our clients’ experience based on our understanding of each individual client and their needs. We can serve clients in the manner that works best and move seamlessly across the channels in accordance with their preferences. Client engagement will be enhanced through the expansion of our digital capabilities which supports our guided omni-channel approach.
As the pandemic arose, we rapidly shifted our employees and client-facing staff to work remotely. With the help of our technology and telecommunications partners, we upgraded our systems to deal with the new ways of working, given the increased volume of digital and telephone interactions. We were effectively set up to provide solutions and advice by email, phone, and for certain business operations, digitally, doing our part to keep our communities healthy, safe and to help flatten the curve.
1 As of December 31, 2019, the latest information available by M SA Research.
Co-operators General Insurance Company | 2020 Annual Report 7
Management’s Discussion & Analysis
During the pandemic, we offered many ways to help our clients. Since many of our clients were using their vehicles less, we offered refunds of premiums paid to eligible auto clients. The offer was available to assist clients who may no longer be commuting, as well as essential service workers who continue to use their vehicles regularly. We offered payment relief options to clients who may have been under increased financial pressure, and who may have required more time to pay their premiums. With those clients we discussed flexible payment options, including deferring a payment, extending payment grace periods, and waiving NSF fees. Many small and medium-sized businesses were looking for ways to reduce their operating expenses. We encouraged our business insurance clients to call us for a comprehensive risk assessment to ensure their financial security was protected in the short and long term.
Co-operative Identity: As a subsidiary of CGL, co-operative principles are core to our identity and our business. We will continue to be invaluable to the co-operative system. We will deliver relevant, compelling solutions to our member organizations and champion the advancement of the co-operative system. We will lead with initiatives to address Canadians’ unmet economic, social and environmental needs, and build their resilience. We will integrate co-operative and sustainability principles in all areas of our business.
Established in 1995, Co operators Community Funds (CCF) reinforce our commitment to the co-operative principle of concern for our Canadian communities and underscore our co-operative identity. CCF provides grants to charities, non-profit organizations, social enterprises and co-operatives whose programs offer employability training and employment opportunities for marginalized youth and individuals with mental health challenges. In addition to grant-making, the CCF (Charity) investment portfolio is helping address social, economic and environmental challenges, while generating positive financial returns, through impact investments and smaller-scale community impact investments. In total, the funds had net assets of approximately $22.3 million at the end of 2020.
In 2020, CCF launched Pathways to Employability (P2E), a $2.0 million initiative dedicated to supporting the employability of Canadian youth who have lost jobs or educational opportunities due to COVID-19. To support the Canadian co-operative sector during these unprecedented times, CCF also launched the Co-op Impact Program, providing low interest loans between $40,000 to $100,000 to individual co-operatives whose new or existing project-based initiatives are supporting their efforts to thrive in the COVID-19 environment.
Assessing the impacts of climate change has long been part of our business activities. This year, we published our inaugural stand-alone summary of efforts to implement the Task Force on Climate-related Financial Disclosures (TCFD) recommendations as issued by the Financial Stability Board. These disclosures provide an overview of our approach to identifying and managing climate-related risks and opportunities. Improving our TCFD practices is a multi-year progression, and we continue to work towards full implementation of the TCFD recommendations. In the current year, we achieved our milestone target of becoming carbon neutral equivalent by 2020. Refer to Climate-Related Financial Disclosures for more information on our TCFD implementation and climate-risk management strategy.
Competitiveness: We will relentlessly pursue operational excellence, which will allow us to grow profitably and capture market share. We will modernize products and services to align with changing client needs, while focusing on collaboration and operational efficiency. We will invest in our core capabilities, including the use of data and analytics, and partner with like-minded organizations to provide competitive, holistic offerings to a diversity of clients.
Our financial holding company, CFSL, announced in May that it had agreed to the private placement of $300.0 million in unsecured debentures. The proceeds of the offering will be used by CFSL for general corporate purposes and to provide additional capital to its subsidiaries as required. The private placement was a sign of institutional investors’ confidence in our long-term stability and an acknowledgement of our strong capital position.
In 2020 we updated and expanded digital features across Canada. Expansion of our Online Services (OLS) included self-serve options for changing auto coverage, as well as expanding our claims functionality so that clients can follow along with each step of their claims process. These updated contactless OLS features improve our internal efficiency, increase our ability to service clients through a digital channel, and allow our client facing staff the flexibility to focus on growing life, wealth and commercial lines of business in support of our 2019-2022 Strategic Plan.
Create the Future: The business landscape is changing, and we need to be ready. We will explore and invest in far-reaching new business models and capabilities to secure future success. We will prepare the organization for industry transformation, by developing and experimenting to create innovative solutions and new business models that address changing client needs.
The Co-operators has a unique strategic business unit completely distinct from business-as-usual operations known as our Emerging Business Models (EBM) team. In support of the Create the Future pillar of our corporate strategy, the EBM team is empowered to aggressively explore new business models and ways to address risks, trends, and opportunities on the horizon. We have formed a partnership with Slice Labs to address unmet insurance needs created by the ever-changing digital economy. Our Duuo insurtech was named first runner up in the People’s Choice Award category at the Insurance-Canada.ca Technology Awards on February 25, 2020. Duuo, alongside Slice Labs, designed and launched a "gig insurance" product to begin meeting the needs of the almost 1.7 million Canadians participating in the gig economy. The product was launched on Canadian home-improvement app HeyBryan (now known as Fast Task) in May.
8 Co-operators General Insurance Company | 2020 Annual Report
Workforce Capability: Our people are the core source of our competitive advantage in a rapidly changing environment. We will empower an adaptable workforce by identifying and removing barriers to achieving a diverse, inclusive workplace. We will develop, attract, and retain the brightest and best people, while strengthening our culture of innovation.
Our Diversity and Inclusion (D&I) strategy is well underway. Building on the work begun in the last quarter of 2019, our investigation into diversity and inclusion at The Co-operators continued, despite the unexpected circumstance presented by the pandemic. The Black Lives Matter protests and conversations that began in the United States, and have grown here in Canada and around the world, are an important reminder to continue investing in a strong D&I strategy.
As the pandemic developed, virtually all our employees were sent to work remotely. The Co-operators deployed technology and processes to ensure that all employees would be able to work productively and stay healthy. We provided guides on working from home, as well as support on wellness and coaching for leaders on how to lead teams remotely.
To gather employee perspective to help the organization better understand personal experiences related to the impacts of COVID-19, we launched a series of employee pulse surveys. The results of the surveys highlight our employee resiliency, with positive sentiment around our ability to adapt and remain fully productive.
SUMMARY OF KEY FINANCIAL DATA AND RESULTS OVERVIEW
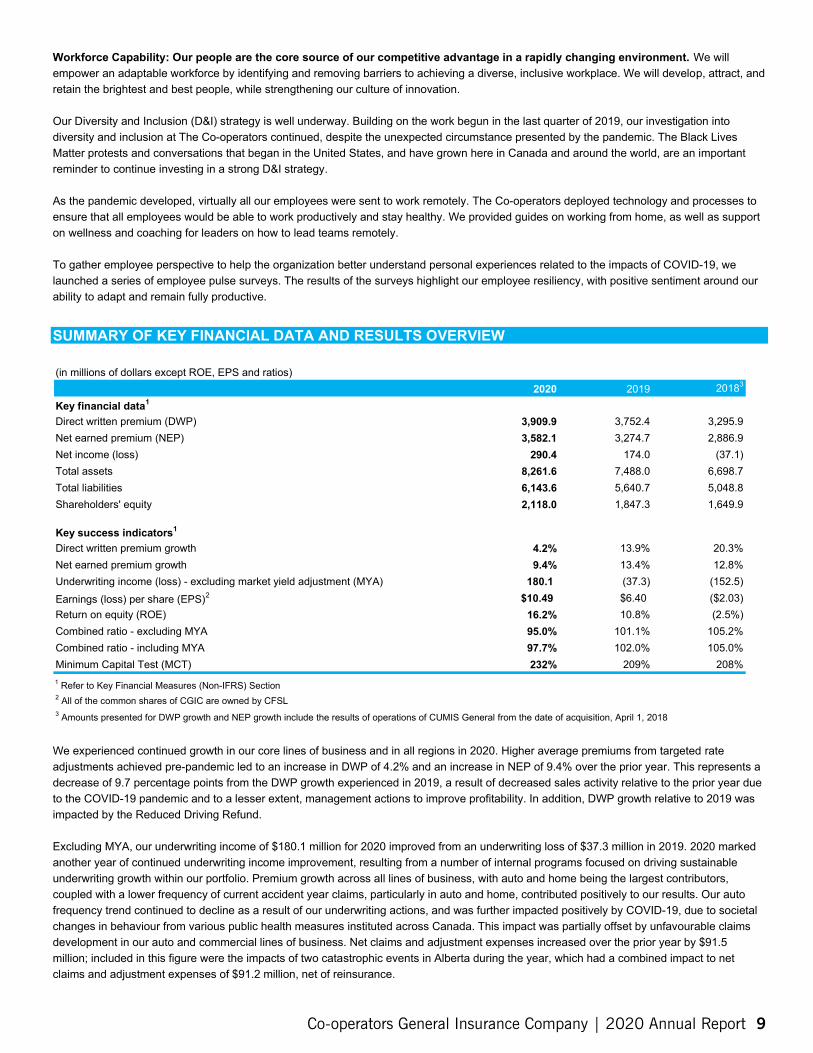
(in millions of dollars except ROE, EPS and ratios) 2020 2019 20183
Key financial data 1
Direct written premium (DWP) 3,909.9 3,752.4 3,295.9 Net earned premium (NEP) 3,582.1 3,274.7 2,886.9 Net income (loss) 290.4 174.0 (37.1) Total assets 8,261.6 7,488.0 6,698.7 Total liabilities 6,143.6 5,640.7 5,048.8 Shareholders' equity 2,118.0 1,847.3 1,649.9
Key success indicators1
Direct written premium growth 4.2% 13.9% 20.3% Net earned premium growth 9.4% 13.4% 12.8% Underwriting income (loss) - excluding market yield adjustment (MYA) 180.1 (37.3) (152.5) Earnings (loss) per share (EPS) 2 $10.49 $6.40 ($2.03) Return on equity (ROE) 16.2% 10.8% (2.5%) Combined ratio - excluding MYA 95.0% 101.1% 105.2% Combined ratio - including MYA 97.7% 102.0% 105.0% Minimum Capital Test (MCT) 232% 209% 208% 1 Refer to Key Financial Measures (Non-IFRS) Section 2 All of the common shares of CGIC are owned by CFSL 3 Amounts presented for DWP growth and NEP growth include the results of operations of CUMIS General from the date of acquisition, April 1, 2018
We experienced continued growth in our core lines of business and in all regions in 2020. Higher average premiums from targeted rate adjustments achieved pre-pandemic led to an increase in DWP of 4.2% and an increase in NEP of 9.4% over the prior year. This represents a decrease of 9.7 percentage points from the DWP growth experienced in 2019, a result of decreased sales activity relative to the prior year due to the COVID-19 pandemic and to a lesser extent, management actions to improve profitability. In addition, DWP growth relative to 2019 was impacted by the Reduced Driving Refund.
Excluding MYA, our underwriting income of $180.1 million for 2020 improved from an underwriting loss of $37.3 million in 2019. 2020 marked another year of continued underwriting income improvement, resulting from a number of internal programs focused on driving sustainable underwriting growth within our portfolio. Premium growth across all lines of business, with auto and home being the largest contributors, coupled with a lower frequency of current accident year claims, particularly in auto and home, contributed positively to our results. Our auto frequency trend continued to decline as a result of our underwriting actions, and was further impacted positively by COVID-19, due to societal changes in behaviour from various public health measures instituted across Canada. This impact was partially offset by unfavourable claims development in our auto and commercial lines of business. Net claims and adjustment expenses increased over the prior year by $91.5 million; included in this figure were the impacts of two catastrophic events in Alberta during the year, which had a combined impact to net claims and adjustment expenses of $91.2 million, net of reinsurance.
Co-operators General Insurance Company | 2020 Annual Report 9
174.0
Management’s Discussion & Analysis
Our net investment income and gains of $289.0 million increased by $16.9 million compared to the prior year. This was mainly attributable to higher realized gains. Realized common share gains were due to a strategic shift in our invested assets to reduce our exposure to common shares. The realized gains on bonds were a result of accommodative fiscal and monetary stimulus measures introduced earlier in the year, to ease volatility in global financial markets due to the COVID-19 pandemic.
FINANCIAL PERFORMANCE REVIEW NET RESULTS
2020 2019 2018 Net income (loss) ($ millions) 290.4 (37.1) ROE 16.2% 10.8% (2.5%)
We earned net income of $290.4 million for the year, an increase of $116.4 million from the prior year’s net income of $174.0 million. The increase in our net results improves our ROE to 16.2% as compared to 10.8% in 2019. The improvement in our 2020 results were primarily driven by improved underwriting results in auto, and to a lesser extent, home and speciality commercial lines of business, and an increase in investment returns resulting from realized gains and declining interest rates.
DIRECT WRITTEN PREMIUM AND NET EARNED PREMIUM
$ millions 2020 2019 % change 2018 3,909.9 3,752.4 4.2% 3,295.9
NEP DWP
3,582.1 3,274.7 9.4% 2,886.9
During 2020, DWP increased by 4.2% or $157.5 million over the prior year. The increase in DWP was primarily attributable to higher average premiums from targeted rate adjustments achieved pre-pandemic, particularly in the auto and home lines of business. NEP growth of 9.4% or $307.4 million over the prior year is also seen across all our lines of business and across all regions due to earlier rate adjustments being earned.
Refer to Note 22 of the consolidated financial statements for a reconciliation of DWP to NEP.
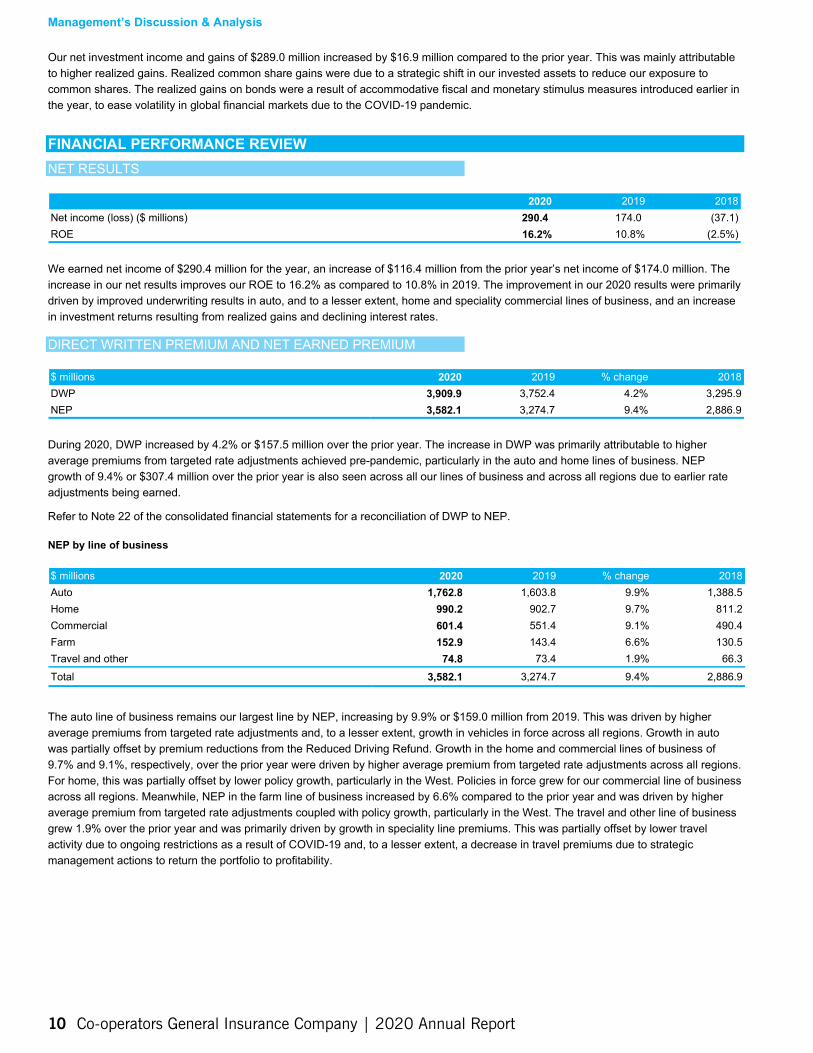
NEP by line of business
$ millions 2020 2019 % change 2018 Auto 1,762.8 1,603.8 9.9% 1,388.5 Home 990.2 902.7 9.7% 811.2 Commercial 601.4 551.4 9.1% 490.4 Farm 152.9 143.4 6.6% 130.5 Travel and other 74.8 73.4 1.9% 66.3 Total 3,582.1 3,274.7 9.4% 2,886.9
The auto line of business remains our largest line by NEP, increasing by 9.9% or $159.0 million from 2019. This was driven by higher average premiums from targeted rate adjustments and, to a lesser extent, growth in vehicles in force across all regions. Growth in auto was partially offset by premium reductions from the Reduced Driving Refund. Growth in the home and commercial lines of business of 9.7% and 9.1%, respectively, over the prior year were driven by higher average premium from targeted rate adjustments across all regions. For home, this was partially offset by lower policy growth, particularly in the West. Policies in force grew for our commercial line of business across all regions. Meanwhile, NEP in the farm line of business increased by 6.6% compared to the prior year and was driven by higher average premium from targeted rate adjustments coupled with policy growth, particularly in the West. The travel and other line of business grew 1.9% over the prior year and was primarily driven by growth in speciality line premiums. This was partially offset by lower travel activity due to ongoing restrictions as a result of COVID-19 and, to a lesser extent, a decrease in travel premiums due to strategic management actions to return the portfolio to profitability.
10 Co-operators General Insurance Company | 2020 Annual Report
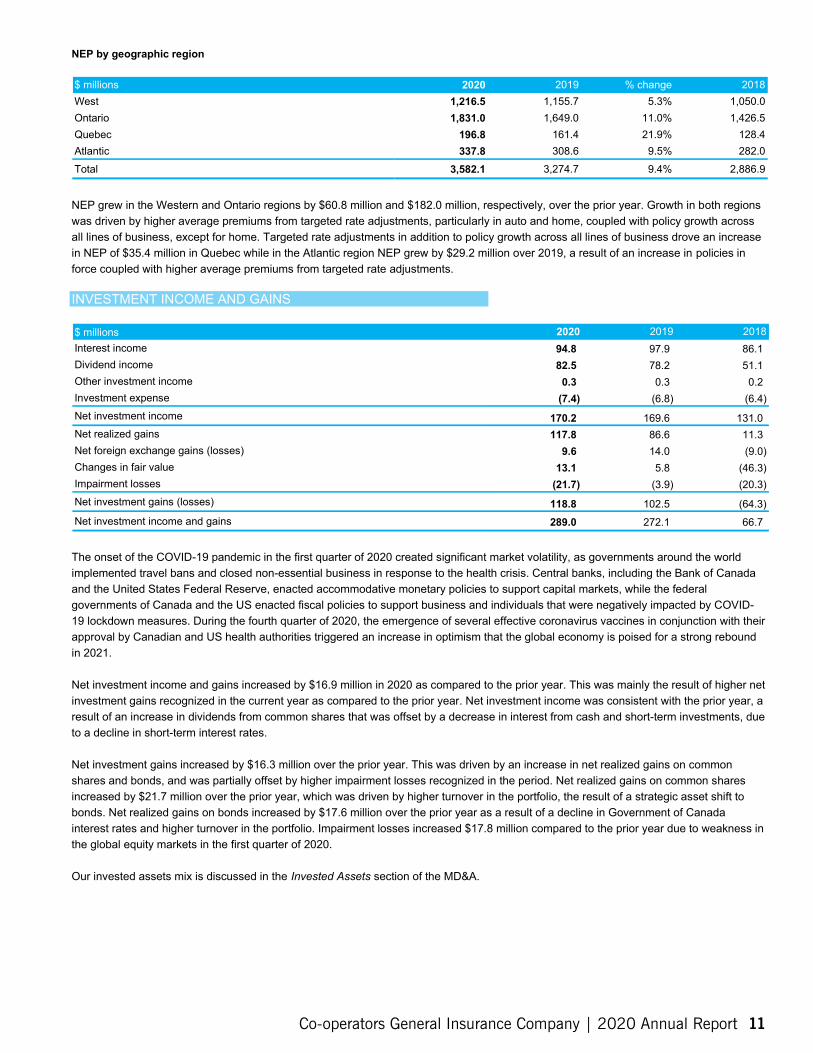
NEP by geographic region
$ millions 2020 2019 % change 2018 West 1,216.5 1,155.7 5.3% 1,050.0 Ontario 1,831.0 1,649.0 11.0% 1,426.5 Quebec 196.8 161.4 21.9% 128.4 Atlantic 337.8 308.6 9.5% 282.0 Total 3,582.1 3,274.7 9.4% 2,886.9
NEP grew in the Western and Ontario regions by $60.8 million and $182.0 million, respectively, over the prior year. Growth in both regions was driven by higher average premiums from targeted rate adjustments, particularly in auto and home, coupled with policy growth across all lines of business, except for home. Targeted rate adjustments in addition to policy growth across all lines of business drove an increase in NEP of $35.4 million in Quebec while in the Atlantic region NEP grew by $29.2 million over 2019, a result of an increase in policies in force coupled with higher average premiums from targeted rate adjustments.
INVESTMENT INCOME AND GAINS
$ millions 2020 2019 2018 Interest income 94.8 97.9 86.1 Dividend income 82.5 78.2 51.1 Other investment income 0.3 0.3 0.2 Investment expense (7.4) (6.8) (6.4) Net investment income 170.2 169.6 131.0 Net realized gains 117.8 86.6 11.3 Net foreign exchange gains (losses) 9.6 14.0 (9.0) Changes in fair value 13.1 5.8 (46.3) Impairment losses (21.7) (3.9) (20.3) Net investment gains (losses) 118.8 102.5 (64.3) Net investment income and gains 289.0 272.1 66.7
The onset of the COVID-19 pandemic in the first quarter of 2020 created significant market volatility, as governments around the world implemented travel bans and closed non-essential business in response to the health crisis. Central banks, including the Bank of Canada and the United States Federal Reserve, enacted accommodative monetary policies to support capital markets, while the federal governments of Canada and the US enacted fiscal policies to support business and individuals that were negatively impacted by COVID-19 lockdown measures. During the fourth quarter of 2020, the emergence of several effective coronavirus vaccines in conjunction with their approval by Canadian and US health authorities triggered an increase in optimism that the global economy is poised for a strong rebound in 2021.
Net investment income and gains increased by $16.9 million in 2020 as compared to the prior year. This was mainly the result of higher net investment gains recognized in the current year as compared to the prior year. Net investment income was consistent with the prior year, a result of an increase in dividends from common shares that was offset by a decrease in interest from cash and short-term investments, due to a decline in short-term interest rates.
Net investment gains increased by $16.3 million over the prior year. This was driven by an increase in net realized gains on common shares and bonds, and was partially offset by higher impairment losses recognized in the period. Net realized gains on common shares increased by $21.7 million over the prior year, which was driven by higher turnover in the portfolio, the result of a strategic asset shift to bonds. Net realized gains on bonds increased by $17.6 million over the prior year as a result of a decline in Government of Canada interest rates and higher turnover in the portfolio. Impairment losses increased $17.8 million compared to the prior year due to weakness in the global equity markets in the first quarter of 2020.
Our invested assets mix is discussed in the Invested Assets section of the MD&A.
Co-operators General Insurance Company | 2020 Annual Report 11
OTHER COMPREHENSIVE INCOME
(5.2) pts (3.4) pts
Management’s Discussion & Analysis
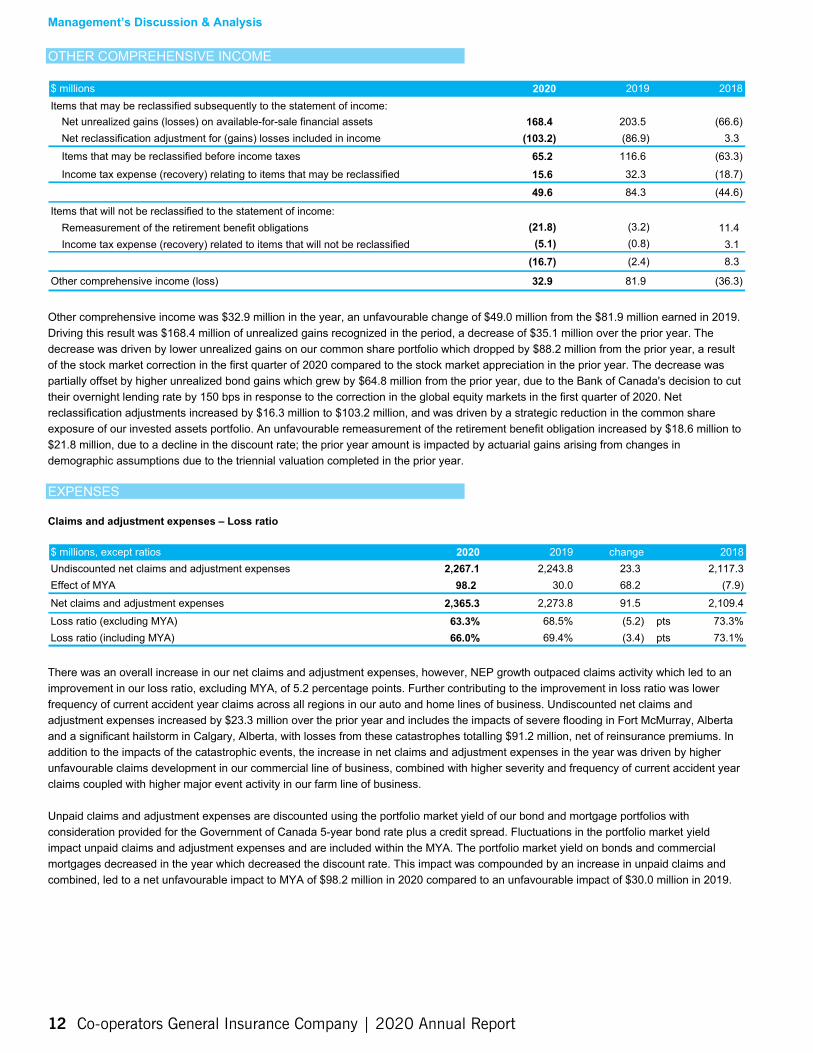
$ millions 2020 2019 2018 Items that may be reclassified subsequently to the statement of income:
Net unrealized gains (losses) on available-for-sale financial assets 168.4 203.5 (66.6) Net reclassification adjustment for (gains) losses included in income (103.2) (86.9) 3.3 Items that may be reclassified before income taxes 65.2 116.6 (63.3) Income tax expense (recovery) relating to items that may be reclassified 15.6 32.3 (18.7)
49.6 84.3 (44.6)
Items that will not be reclassified to the statement of income: Remeasurement of the retirement benefit obligations (21.8) (3.2) 11.4 Income tax expense (recovery) related to items that will not be reclassified (5.1) (0.8) 3.1
(16.7) (2.4) 8.3
Other comprehensive income (loss) 32.9 81.9 (36.3)
Other comprehensive income was $32.9 million in the year, an unfavourable change of $49.0 million from the $81.9 million earned in 2019. Driving this result was $168.4 million of unrealized gains recognized in the period, a decrease of $35.1 million over the prior year. The decrease was driven by lower unrealized gains on our common share portfolio which dropped by $88.2 million from the prior year, a result of the stock market correction in the first quarter of 2020 compared to the stock market appreciation in the prior year. The decrease was partially offset by higher unrealized bond gains which grew by $64.8 million from the prior year, due to the Bank of Canada's decision to cut their overnight lending rate by 150 bps in response to the correction in the global equity markets in the first quarter of 2020. Net reclassification adjustments increased by $16.3 million to $103.2 million, and was driven by a strategic reduction in the common share exposure of our invested assets portfolio. An unfavourable remeasurement of the retirement benefit obligation increased by $18.6 million to $21.8 million, due to a decline in the discount rate; the prior year amount is impacted by actuarial gains arising from changes in demographic assumptions due to the triennial valuation completed in the prior year.
Claims and adjustment expenses – Loss ratio
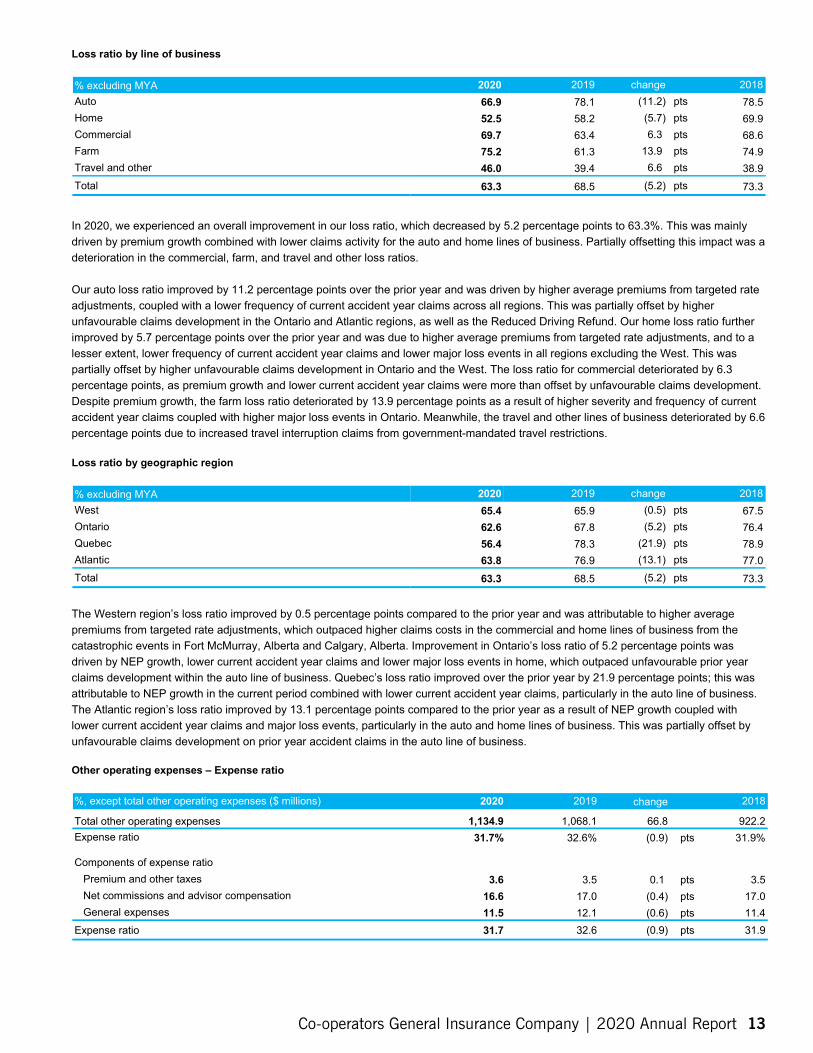
$ millions, except ratios 2020 2019 change 2018 Undiscounted net claims and adjustment expenses 2,267.1 2,243.8 23.3 2,117.3 Effect of MYA 98.2 30.0 68.2 (7.9) Net claims and adjustment expenses 2,273.8 91.5 2,109.4 Loss ratio (excluding MYA) 63.3%
2,365.3 68.5% 73.3%
Loss ratio (including MYA) 66.0% 69.4% 73.1%
There was an overall increase in our net claims and adjustment expenses, however, NEP growth outpaced claims activity which led to an improvement in our loss ratio, excluding MYA, of 5.2 percentage points. Further contributing to the improvement in loss ratio was lower frequency of current accident year claims across all regions in our auto and home lines of business. Undiscounted net claims and adjustment expenses increased by $23.3 million over the prior year and includes the impacts of severe flooding in Fort McMurray, Alberta and a significant hailstorm in Calgary, Alberta, with losses from these catastrophes totalling $91.2 million, net of reinsurance premiums. In addition to the impacts of the catastrophic events, the increase in net claims and adjustment expenses in the year was driven by higher unfavourable claims development in our commercial line of business, combined with higher severity and frequency of current accident year claims coupled with higher major event activity in our farm line of business.
Unpaid claims and adjustment expenses are discounted using the portfolio market yield of our bond and mortgage portfolios with consideration provided for the Government of Canada 5-year bond rate plus a credit spread. Fluctuations in the portfolio market yield impact unpaid claims and adjustment expenses and are included within the MYA. The portfolio market yield on bonds and commercial mortgages decreased in the year which decreased the discount rate. This impact was compounded by an increase in unpaid claims and combined, led to a net unfavourable impact to MYA of $98.2 million in 2020 compared to an unfavourable impact of $30.0 million in 2019.
12 Co-operators General Insurance Company | 2020 Annual Report
EXPENSES
(11.2) pts (5.7) pts 6.3 pts
13.9 pts 6.6 pts
(5.2) pts 73.3
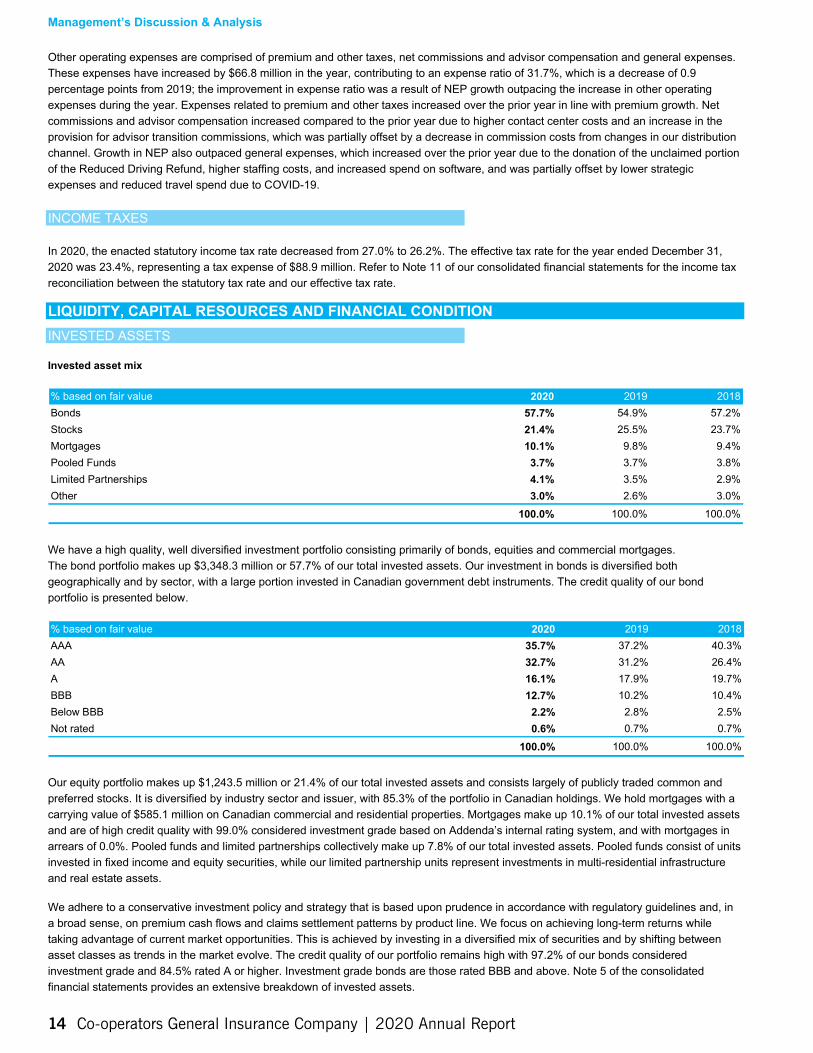
Loss ratio by line of business
% excluding MYA 2020 2019 change 2018 Auto 66.9 78.1 78.5 Home 52.5 58.2 69.9 Commercial 69.7 63.4 68.6 Farm 75.2 61.3 74.9 Travel and other 46.0 39.4 38.9 Total 63.3 68.5
In 2020, we experienced an overall improvement in our loss ratio, which decreased by 5.2 percentage points to 63.3%. This was mainly driven by premium growth combined with lower claims activity for the auto and home lines of business. Partially offsetting this impact was a deterioration in the commercial, farm, and travel and other loss ratios.
Our auto loss ratio improved by 11.2 percentage points over the prior year and was driven by higher average premiums from targeted rate adjustments, coupled with a lower frequency of current accident year claims across all regions. This was partially offset by higher unfavourable claims development in the Ontario and Atlantic regions, as well as the Reduced Driving Refund. Our home loss ratio further improved by 5.7 percentage points over the prior year and was due to higher average premiums from targeted rate adjustments, and to a lesser extent, lower frequency of current accident year claims and lower major loss events in all regions excluding the West. This was partially offset by higher unfavourable claims development in Ontario and the West. The loss ratio for commercial deteriorated by 6.3 percentage points, as premium growth and lower current accident year claims were more than offset by unfavourable claims development. Despite premium growth, the farm loss ratio deteriorated by 13.9 percentage points as a result of higher severity and frequency of current accident year claims coupled with higher major loss events in Ontario. Meanwhile, the travel and other lines of business deteriorated by 6.6 percentage points due to increased travel interruption claims from government-mandated travel restrictions.
Loss ratio by geographic region
% excluding MYA 2020 2019 change 2018 West 65.4 65.9 (0.5) pts 67.5 Ontario 62.6 67.8 (5.2) pts 76.4 Quebec 56.4 78.3 (21.9) pts 78.9 Atlantic 63.8 76.9 (13.1) pts 77.0 Total 63.3 68.5 (5.2) pts 73.3
The Western region’s loss ratio improved by 0.5 percentage points compared to the prior year and was attributable to higher average premiums from targeted rate adjustments, which outpaced higher claims costs in the commercial and home lines of business from the catastrophic events in Fort McMurray, Alberta and Calgary, Alberta. Improvement in Ontario’s loss ratio of 5.2 percentage points was driven by NEP growth, lower current accident year claims and lower major loss events in home, which outpaced unfavourable prior year claims development within the auto line of business. Quebec’s loss ratio improved over the prior year by 21.9 percentage points; this was attributable to NEP growth in the current period combined with lower current accident year claims, particularly in the auto line of business. The Atlantic region’s loss ratio improved by 13.1 percentage points compared to the prior year as a result of NEP growth coupled with lower current accident year claims and major loss events, particularly in the auto and home lines of business. This was partially offset by unfavourable claims development on prior year accident claims in the auto line of business.
Other operating expenses – Expense ratio
%, except total other operating expenses ($ millions) 2020 2019 change 2018
Total other operating expenses 1,134.9 1,068.1 66.8 922.2 Expense ratio 31.7% 32.6% (0.9) pts 31.9%
Components of expense ratio Premium and other taxes 3.6 3.5 0.1 pts 3.5 Net commissions and advisor compensation 16.6 17.0 (0.4) pts 17.0 General expenses 11.5 12.1 (0.6) pts 11.4
Expense ratio 31.7 32.6 (0.9) pts 31.9
Co-operators General Insurance Company | 2020 Annual Report 13
Management’s Discussion & Analysis
Other operating expenses are comprised of premium and other taxes, net commissions and advisor compensation and general expenses. These expenses have increased by $66.8 million in the year, contributing to an expense ratio of 31.7%, which is a decrease of 0.9 percentage points from 2019; the improvement in expense ratio was a result of NEP growth outpacing the increase in other operating expenses during the year. Expenses related to premium and other taxes increased over the prior year in line with premium growth. Net commissions and advisor compensation increased compared to the prior year due to higher contact center costs and an increase in the provision for advisor transition commissions, which was partially offset by a decrease in commission costs from changes in our distribution channel. Growth in NEP also outpaced general expenses, which increased over the prior year due to the donation of the unclaimed portion of the Reduced Driving Refund, higher staffing costs, and increased spend on software, and was partially offset by lower strategic expenses and reduced travel spend due to COVID-19.
INCOME TAXES
In 2020, the enacted statutory income tax rate decreased from 27.0% to 26.2%. The effective tax rate for the year ended December 31, 2020 was 23.4%, representing a tax expense of $88.9 million. Refer to Note 11 of our consolidated financial statements for the income tax reconciliation between the statutory tax rate and our effective tax rate.
LIQUIDITY, CAPITAL RESOURCES AND FINANCIAL CONDITION INVESTED ASSETS
Invested asset mix
% based on fair value 2020 2019 2018 Bonds 57.7% 54.9% 57.2% Stocks 21.4% 25.5% 23.7% Mortgages 10.1% 9.8% 9.4% Pooled Funds 3.7% 3.7% 3.8% Limited Partnerships 4.1% 3.5% 2.9% Other 3.0% 2.6% 3.0%
100.0% 100.0% 100.0%
We have a high quality, well diversified investment portfolio consisting primarily of bonds, equities and commercial mortgages. The bond portfolio makes up $3,348.3 million or 57.7% of our total invested assets. Our investment in bonds is diversified both geographically and by sector, with a large portion invested in Canadian government debt instruments. The credit quality of our bond portfolio is presented below.
% based on fair value 2020 2019 2018 AAA 35.7% 37.2% 40.3% AA 32.7% 31.2% 26.4% A 16.1% 17.9% 19.7% BBB 12.7% 10.2% 10.4% Below BBB 2.2% 2.8% 2.5% Not rated 0.6% 0.7% 0.7%
100.0% 100.0% 100.0%
Our equity portfolio makes up $1,243.5 million or 21.4% of our total invested assets and consists largely of publicly traded common and preferred stocks. It is diversified by industry sector and issuer, with 85.3% of the portfolio in Canadian holdings. We hold mortgages with a carrying value of $585.1 million on Canadian commercial and residential properties. Mortgages make up 10.1% of our total invested assets and are of high credit quality with 99.0% considered investment grade based on Addenda’s internal rating system, and with mortgages in arrears of 0.0%. Pooled funds and limited partnerships collectively make up 7.8% of our total invested assets. Pooled funds consist of units invested in fixed income and equity securities, while our limited partnership units represent investments in multi-residential infrastructure and real estate assets.
We adhere to a conservative investment policy and strategy that is based upon prudence in accordance with regulatory guidelines and, in a broad sense, on premium cash flows and claims settlement patterns by product line. We focus on achieving long-term returns while taking advantage of current market opportunities. This is achieved by investing in a diversified mix of securities and by shifting between asset classes as trends in the market evolve. The credit quality of our portfolio remains high with 97.2% of our bonds considered investment grade and 84.5% rated A or higher. Investment grade bonds are those rated BBB and above. Note 5 of the consolidated financial statements provides an extensive breakdown of invested assets.
14 Co-operators General Insurance Company | 2020 Annual Report
2,613.6
103.3
The Risk Management section and Note 6 of the consolidated financial statements provide information on related credit and interest rate risks.
UNPAID CLAIMS AND ADJUSTMENT EXPENSES
Our underwriting objectives are to write business on a prudent and diversified basis and to achieve profitable underwriting results. We underwrite automobile business after a review of the client’s driving record and claims experience. We underwrite property lines based on physical condition, property replacement values, claims experience and other factors affecting risk of loss. Advisors and brokers are compensated, in part, based on the claims experience of their portfolio.
Our unpaid claims and adjustment expenses liability is management’s best estimate of the amount required to settle all outstanding and unreported claims incurred. The estimate is determined using accepted actuarial practices. Our approach in calculating our unpaid claims liability is to establish adequate provisions at the original valuation date in a sufficient amount such that the risk of the liability being inadequate in any one year is low.
The initial estimate of unpaid claims and adjustment expenses is made on an undiscounted basis. This process is described in Significant Accounting Judgments, Estimates and Assumptions. The discount rate applied to measure the value of unpaid claims and adjustment expenses is based upon the portfolio market yield of assets supporting the claims liabilities as well as considerations for the timing of the relative cash flows of the assets and liabilities.
Net unpaid claims liability
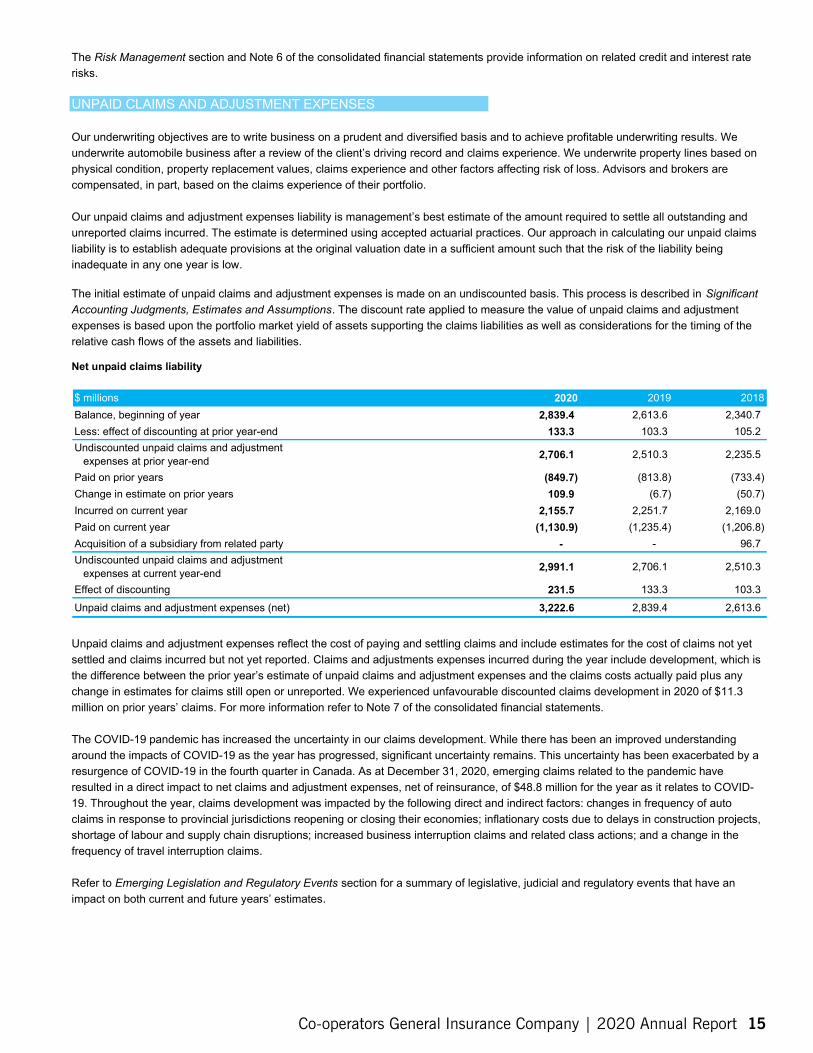
$ millions Balance, beginning of year Less: effect of discounting at prior year-end
2020 2,839.4
133.3
2019 2018 2,340.7
105.2 Undiscounted unpaid claims and adjustment
expenses at prior year-end 2,706.1 2,510.3 2,235.5
Paid on prior years (849.7) (813.8) (733.4) Change in estimate on prior years 109.9 (6.7) (50.7) Incurred on current year 2,155.7 2,251.7 2,169.0 Paid on current year (1,130.9) (1,235.4) (1,206.8) Acquisition of a subsidiary from related party - - 96.7 Undiscounted unpaid claims and adjustment
expenses at current year-end 2,991.1 2,706.1 2,510.3
Effect of discounting 231.5 133.3 103.3
Unpaid claims and adjustment expenses (net) 3,222.6 2,839.4 2,613.6
Unpaid claims and adjustment expenses reflect the cost of paying and settling claims and include estimates for the cost of claims not yet settled and claims incurred but not yet reported. Claims and adjustments expenses incurred during the year include development, which is the difference between the prior year’s estimate of unpaid claims and adjustment expenses and the claims costs actually paid plus any change in estimates for claims still open or unreported. We experienced unfavourable discounted claims development in 2020 of $11.3 million on prior years’ claims. For more information refer to Note 7 of the consolidated financial statements.
The COVID-19 pandemic has increased the uncertainty in our claims development. While there has been an improved understanding around the impacts of COVID-19 as the year has progressed, significant uncertainty remains. This uncertainty has been exacerbated by a resurgence of COVID-19 in the fourth quarter in Canada. As at December 31, 2020, emerging claims related to the pandemic have resulted in a direct impact to net claims and adjustment expenses, net of reinsurance, of $48.8 million for the year as it relates to COVID-19. Throughout the year, claims development was impacted by the following direct and indirect factors: changes in frequency of auto claims in response to provincial jurisdictions reopening or closing their economies; inflationary costs due to delays in construction projects, shortage of labour and supply chain disruptions; increased business interruption claims and related class actions; and a change in the frequency of travel interruption claims.
Refer to Emerging Legislation and Regulatory Events section for a summary of legislative, judicial and regulatory events that have an impact on both current and future years’ estimates.
Co-operators General Insurance Company | 2020 Annual Report 15
Management’s Discussion & Analysis
SHAREHOLDERS’ EQUITY
$ millions 2020 2019 2018 Common shares 359.8 359.8 229.8 Preferred shares
Public issue 100.0 100.0 100.0 Private issue 90.9 85.0 83.7
Contributed capital 100.9 100.9 100.9 Retained earnings 1,261.2 1,029.4 1,045.1 Accumulated other comprehensive income 205.2 172.3 90.4 Total 2,118.0 1,847.4 1,649.9
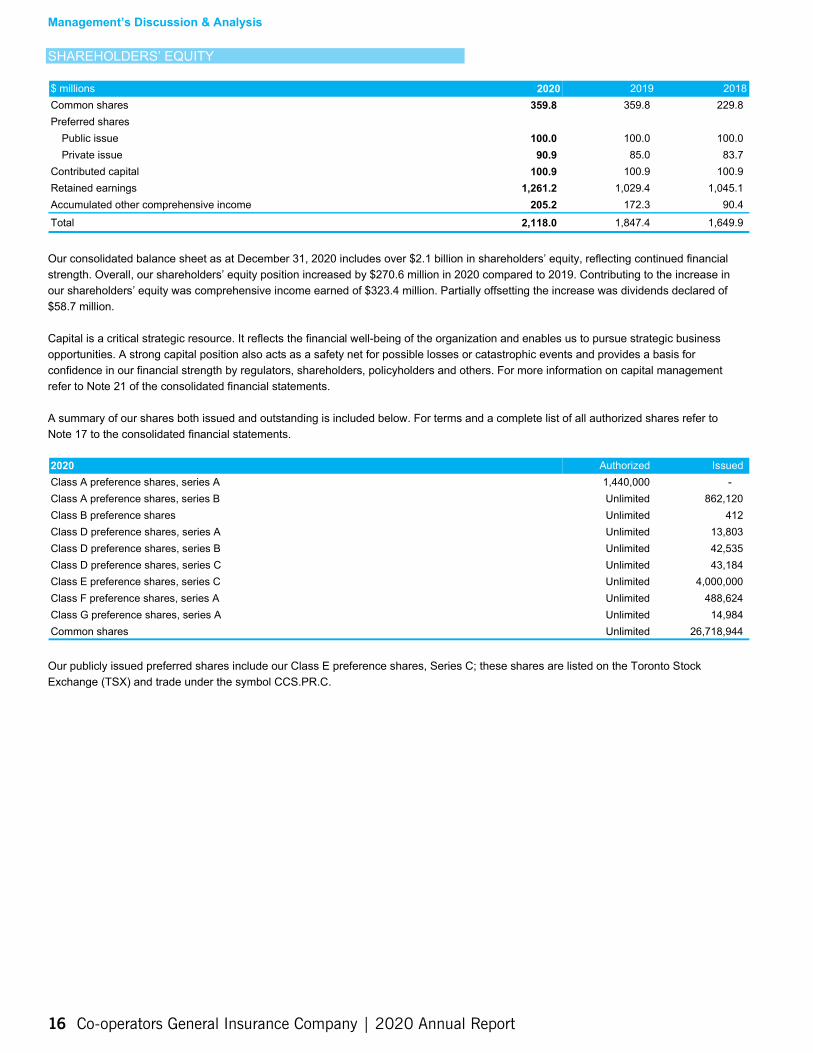
Our consolidated balance sheet as at December 31, 2020 includes over $2.1 billion in shareholders’ equity, reflecting continued financial strength. Overall, our shareholders’ equity position increased by $270.6 million in 2020 compared to 2019. Contributing to the increase in our shareholders’ equity was comprehensive income earned of $323.4 million. Partially offsetting the increase was dividends declared of $58.7 million.
Capital is a critical strategic resource. It reflects the financial well-being of the organization and enables us to pursue strategic business opportunities. A strong capital position also acts as a safety net for possible losses or catastrophic events and provides a basis for confidence in our financial strength by regulators, shareholders, policyholders and others. For more information on capital management refer to Note 21 of the consolidated financial statements.
A summary of our shares both issued and outstanding is included below. For terms and a complete list of all authorized shares refer to Note 17 to the consolidated financial statements.
2020 Authorized Issued Class A preference shares, series A 1,440,000 -Class A preference shares, series B Unlimited 862,120 Class B preference shares Unlimited 412 Class D preference shares, series A Unlimited 13,803 Class D preference shares, series B Unlimited 42,535 Class D preference shares, series C Unlimited 43,184 Class E preference shares, series C Unlimited 4,000,000 Class F preference shares, series A Unlimited 488,624 Class G preference shares, series A Unlimited 14,984 Common shares Unlimited 26,718,944
Our publicly issued preferred shares include our Class E preference shares, Series C; these shares are listed on the Toronto Stock Exchange (TSX) and trade under the symbol CCS.PR.C.
16 Co-operators General Insurance Company | 2020 Annual Report
DIVIDENDS AND EARNINGS PER SHARE (EPS)
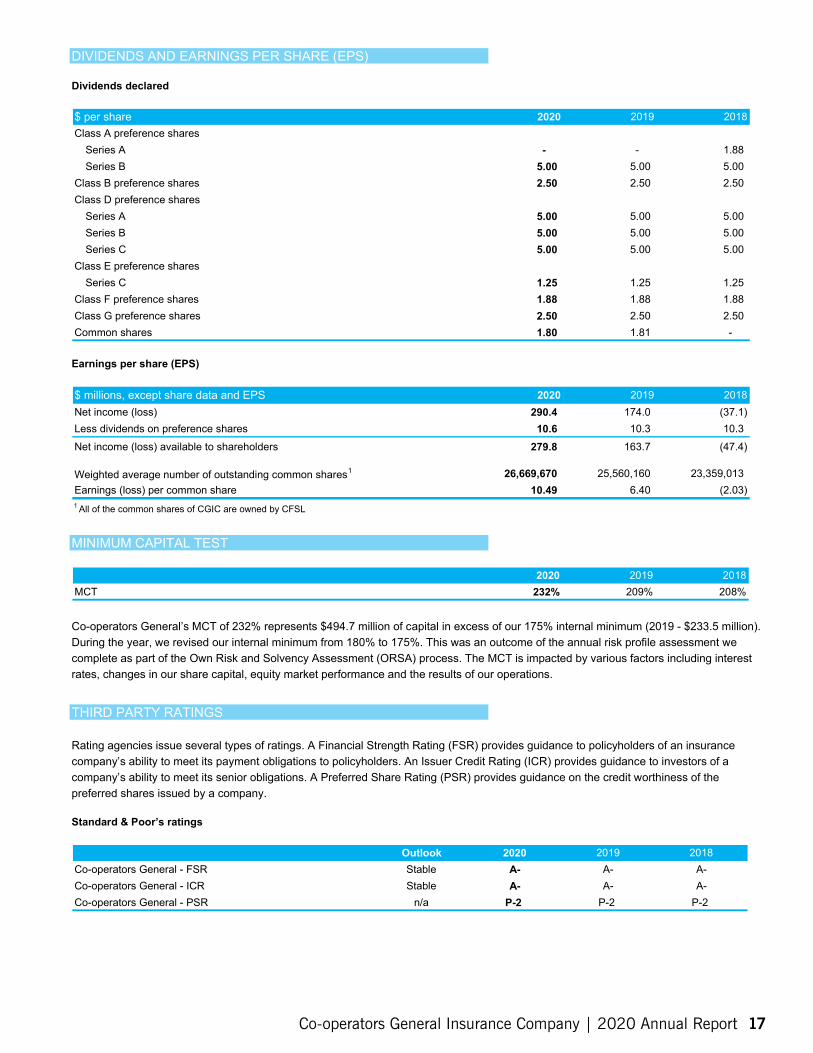
Dividends declared
$ per share 2020 2019 2018 Class A preference shares
Series A - - 1.88 Series B 5.00 5.00 5.00
Class B preference shares 2.50 2.50 2.50 Class D preference shares
Series A 5.00 5.00 5.00 Series B 5.00 5.00 5.00 Series C 5.00 5.00 5.00
Class E preference shares Series C 1.25 1.25 1.25
Class F preference shares 1.88 1.88 1.88 Class G preference shares 2.50 2.50 2.50 Common shares 1.80 1.81 -
Earnings per share (EPS)
$ millions, except share data and EPS 2020 2019 2018 Net income (loss) 290.4 174.0 (37.1) Less dividends on preference shares 10.6 10.3 10.3 Net income (loss) available to shareholders 279.8 163.7 (47.4)
Weighted average number of outstanding common shares1 26,669,670 25,560,160 23,359,013 Earnings (loss) per common share 10.49 6.40 (2.03) 1 All of the common shares of CGIC are owned by CFSL
MINIMUM CAPITAL TEST
2020 2019 2018 MCT 232% 209% 208%
Co-operators General’s MCT of 232% represents $494.7 million of capital in excess of our 175% internal minimum (2019 - $233.5 million). During the year, we revised our internal minimum from 180% to 175%. This was an outcome of the annual risk profile assessment we complete as part of the Own Risk and Solvency Assessment (ORSA) process. The MCT is impacted by various factors including interest rates, changes in our share capital, equity market performance and the results of our operations.
THIRD PARTY RATINGS
Rating agencies issue several types of ratings. A Financial Strength Rating (FSR) provides guidance to policyholders of an insurance company’s ability to meet its payment obligations to policyholders. An Issuer Credit Rating (ICR) provides guidance to investors of a company’s ability to meet its senior obligations. A Preferred Share Rating (PSR) provides guidance on the credit worthiness of the preferred shares issued by a company.
Standard & Poor’s ratings
Outlook 2020 2019 2018 Co-operators General - FSR Stable A- A- A-Co-operators General - ICR Stable A- A- A-Co-operators General - PSR n/a P-2 P-2 P-2
Co-operators General Insurance Company | 2020 Annual Report 17
Management’s Discussion & Analysis
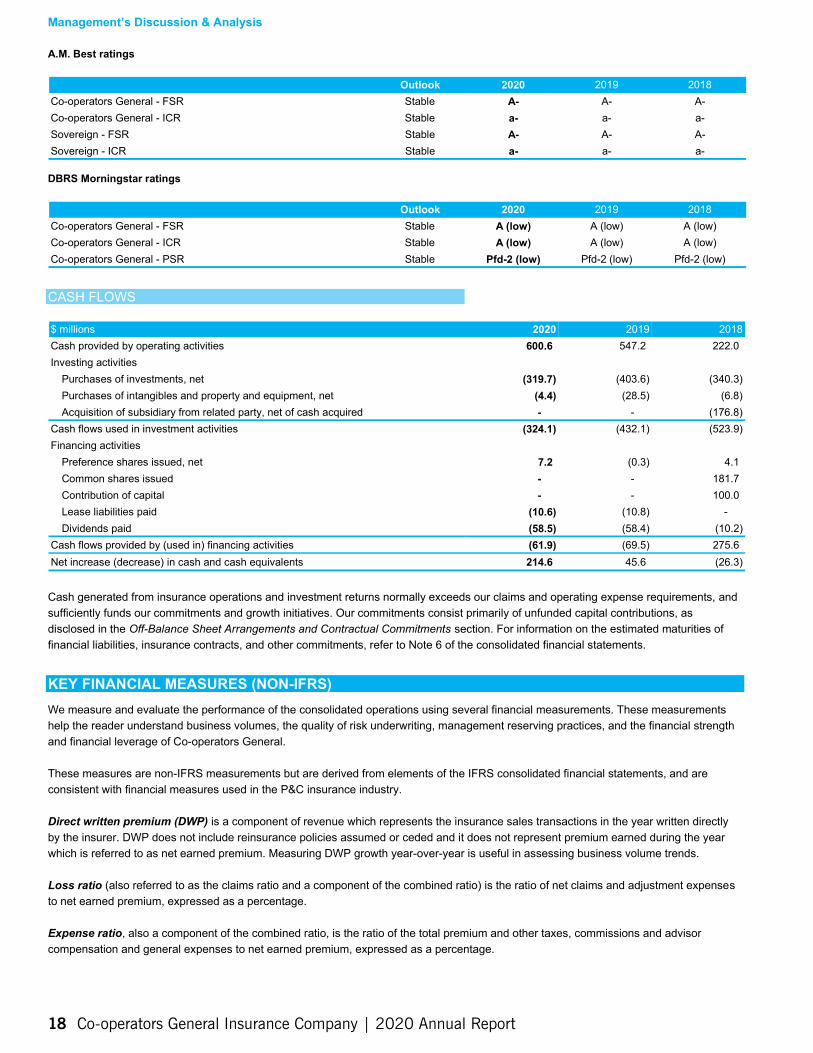
A.M. Best ratings
Outlook 2020 2019 2018 Co-operators General - FSR Stable A- A- A-Co-operators General - ICR Stable a- a- a-Sovereign - FSR Stable A- A- A-Sovereign - ICR Stable a- a- a-
DBRS Morningstar ratings
Outlook 2020 2019 2018 Co-operators General - FSR Stable A (low) A (low) A (low) Co-operators General - ICR Stable A (low) A (low) A (low) Co-operators General - PSR Stable Pfd-2 (low) Pfd-2 (low) Pfd-2 (low)
CASH FLOWS
$ millions 2020 2019 2018 Cash provided by operating activities 600.6 547.2 222.0 Investing activities
Purchases of investments, net (319.7) (403.6) (340.3) Purchases of intangibles and property and equipment, net (4.4) (28.5) (6.8) Acquisition of subsidiary from related party, net of cash acquired - - (176.8)
Cash flows used in investment activities (324.1) (432.1) (523.9) Financing activities
Preference shares issued, net 7.2 (0.3) 4.1 Common shares issued - - 181.7 Contribution of capital - - 100.0 Lease liabilities paid (10.6) (10.8) -Dividends paid (58.5) (58.4) (10.2)
Cash flows provided by (used in) financing activities (61.9) (69.5) 275.6 Net increase (decrease) in cash and cash equivalents 214.6 45.6 (26.3)
Cash generated from insurance operations and investment returns normally exceeds our claims and operating expense requirements, and sufficiently funds our commitments and growth initiatives. Our commitments consist primarily of unfunded capital contributions, as disclosed in the Off-Balance Sheet Arrangements and Contractual Commitments section. For information on the estimated maturities of financial liabilities, insurance contracts, and other commitments, refer to Note 6 of the consolidated financial statements.
KEY FINANCIAL MEASURES (NON-IFRS) We measure and evaluate the performance of the consolidated operations using several financial measurements. These measurements help the reader understand business volumes, the quality of risk underwriting, management reserving practices, and the financial strength and financial leverage of Co-operators General.
These measures are non-IFRS measurements but are derived from elements of the IFRS consolidated financial statements, and are consistent with financial measures used in the P&C insurance industry.
Direct written premium (DWP) is a component of revenue which represents the insurance sales transactions in the year written directly by the insurer. DWP does not include reinsurance policies assumed or ceded and it does not represent premium earned during the year which is referred to as net earned premium. Measuring DWP growth year-over-year is useful in assessing business volume trends.
Loss ratio (also referred to as the claims ratio and a component of the combined ratio) is the ratio of net claims and adjustment expenses to net earned premium, expressed as a percentage.
Expense ratio, also a component of the combined ratio, is the ratio of the total premium and other taxes, commissions and advisor compensation and general expenses to net earned premium, expressed as a percentage.
18 Co-operators General Insurance Company | 2020 Annual Report
(0.4)
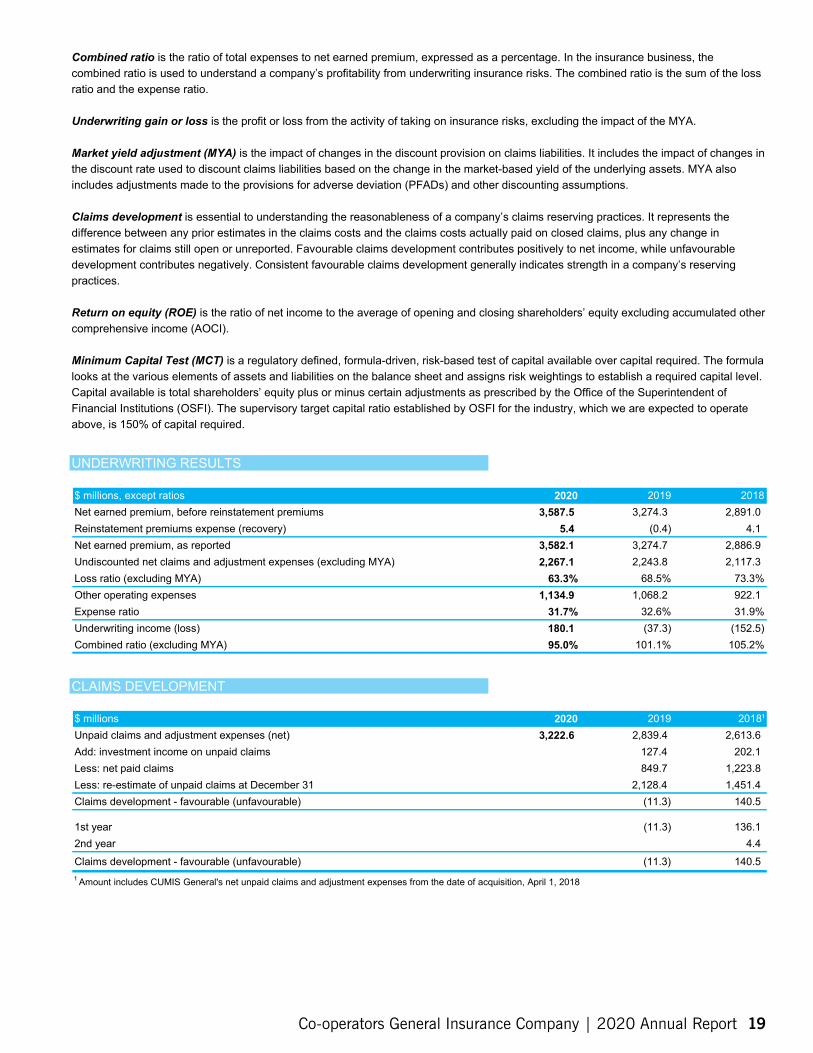
Combined ratio is the ratio of total expenses to net earned premium, expressed as a percentage. In the insurance business, the combined ratio is used to understand a company’s profitability from underwriting insurance risks. The combined ratio is the sum of the loss ratio and the expense ratio.
Underwriting gain or loss is the profit or loss from the activity of taking on insurance risks, excluding the impact of the MYA.
Market yield adjustment (MYA) is the impact of changes in the discount provision on claims liabilities. It includes the impact of changes in the discount rate used to discount claims liabilities based on the change in the market-based yield of the underlying assets. MYA also includes adjustments made to the provisions for adverse deviation (PFADs) and other discounting assumptions.
Claims development is essential to understanding the reasonableness of a company’s claims reserving practices. It represents the difference between any prior estimates in the claims costs and the claims costs actually paid on closed claims, plus any change in estimates for claims still open or unreported. Favourable claims development contributes positively to net income, while unfavourable development contributes negatively. Consistent favourable claims development generally indicates strength in a company’s reserving practices.
Return on equity (ROE) is the ratio of net income to the average of opening and closing shareholders’ equity excluding accumulated other comprehensive income (AOCI).
Minimum Capital Test (MCT) is a regulatory defined, formula-driven, risk-based test of capital available over capital required. The formula looks at the various elements of assets and liabilities on the balance sheet and assigns risk weightings to establish a required capital level. Capital available is total shareholders’ equity plus or minus certain adjustments as prescribed by the Office of the Superintendent of Financial Institutions (OSFI). The supervisory target capital ratio established by OSFI for the industry, which we are expected to operate above, is 150% of capital required.
UNDERWRITING RESULTS
$ millions, except ratios 2020 2019 2018 Net earned premium, before reinstatement premiums Reinstatement p remiums e xpense ( recovery)
3,587.5 5.4
3,274.3 2,891.0 4.1
Net earned premium, as reported 3,582.1 3,274.7 2,886.9 Undiscounted net claims and adjustment expenses (excluding MYA) 2,267.1 2,243.8 2,117.3 Loss ratio (excluding MYA) 63.3% 68.5% 73.3% Other operating expenses 1,134.9 1,068.2 922.1 Expense ratio 31.7% 32.6% 31.9% Underwriting income (loss) Combined ratio (excluding MYA)
180.1 95.0%
(37.3) 101.1%
(152.5) 105.2%
CLAIMS DEVELOPMENT
$ millions 2020 2019 2018¹ Unpaid claims and adjustment expenses (net) 3,222.6 2,839.4 2,613.6 Add: investment income on unpaid claims 127.4 202.1 Less: net paid claims 849.7 1,223.8 Less: re-estimate of unpaid claims at December 31 2,128.4 1,451.4 Claims development - favourable (unfavourable) (11.3) 140.5
1st year (11.3) 136.1 2nd year 4.4 Claims development - favourable (unfavourable) (11.3) 140.5 1 Amount includes CUMIS General's net unpaid claims and adjustment expenses from the date of acquisition, April 1, 2018
Co-operators General Insurance Company | 2020 Annual Report 19

Management’s Discussion & Analysis
RETURN ON EQUITY (ROE)
$ millions, except ratios 2020 2019 20181
Net income (loss) 290.4 174.0 (37.1) Average shareholders' equity excluding accumulated other comprehensive
income 1,794.0 1,617.3 1,483.5
Return on equity (ROE) 16.2% 10.8% (2.5%) 1 Amounts presented include the results of operations and balance sheet of CUMIS General from the date of acquisition, April 1, 2018
QUARTERLY RESULTS The quarterly results reflect the seasonality of our business. Premiums are generally written in annual renewal cycles, most often in the second quarter. Despite the two catastrophic weather events in Alberta in the second quarter, extreme weather conditions historically impact the loss ratio in the first and third quarters.
The timing of claims can be difficult to predict due to uncontrollable factors, such as governmental regulatory actions, weather, or changes in estimates related to investment provisions. Results are also affected by more predictable factors such as the timing of major expenditures, changes in estimates related to claims reserves, and purchase and sale decisions made with respect to our investment portfolio.
(in millions of dollars except EPS and ratios) 2020 1st Qtr 2nd Qtr 3rd Qtr 4th Qtr Annual Direct written premium 829.2 1,016.3 1,076.3 988.1 3,909.9 Net earned premium 872.5 836.9 922.2 950.5 3,582.1 Net income (loss) (48.9) 47.9 152.3 139.1 290.4 Other comprehensive income (loss) (49.2) 88.0 (11.3) 5.4 32.9 Key statistics
Earnings (loss) per share (EPS) ($1.88) $1.65 $5.67 $5.05 $10.49 Loss ratio (excluding MYA) 63.2% 71.5% 61.6% 57.8% 63.3% Expense ratio 31.1% 32.5% 30.0% 33.1% 31.7% Combined ratio (excluding MYA) 94.3% 104.0% 91.6% 90.9% 95.0%
2019 1st Qtr 2nd Qtr 3rd Qtr 4th Qtr Annual Direct written premium 757.6 1,049.8 999.7 945.3 3,752.4 Net earned premium 763.0 804.6 840.6 866.5 3,274.7 Net income 21.8 79.1 12.4 60.7 174.0 Other comprehensive income (loss) 95.3 (3.0) 14.7 (25.1) 81.9 Key statistics
Earnings per share (EPS) $0.84 $2.84 $0.42 $2.30 $6.40 Loss ratio (excluding MYA) 71.9% 62.3% 70.8% 64.5% 68.5% Expense ratio 32.5% 33.1% 32.2% 32.7% 32.6% Combined ratio (excluding MYA) 104.4% 95.4% 103.0% 97.3% 101.1%
In 2020, our quarterly DWP results followed a consistent pattern with 2019 results, with the third and second quarter representing the largest quarters. In the first quarter of 2020, we saw an 8.7 percentage point improvement in the loss ratio compared to the same quarter in 2019. This was the primarily the result of premium growth and favourable claims development during the period. The second quarter loss ratio deteriorated by 9.2 percentage points due to the two catastrophic weather events that occurred in Alberta during the period. The third quarter loss ratio improved by 9.2 percentage points and was driven primarily by premium growth combined with lower major loss events and claims activity; this impact was partially offset by unfavourable claims development in the auto and commercial lines of business.
Review of fourth quarter 2020 results
Net income for the quarter amounted to $139.1 million compared to $60.7 million in the same quarter of last year. This produced an earnings per common share in the quarter of $5.05 compared to $2.30 in 2019. The increase was largely attributable to strong NEP growth which grew by 9.7% or $84.0 million from the prior quarter, driven by strong performance in the auto and home lines of business. In particular, growth in the auto line of business was driven by higher average premiums from targeted rate adjustments achieved pre-pandemic, coupled with policy growth in Ontario and to a lesser extent, the reversal of the unclaimed portion of the Reduced Driving Refund, which was donated to charitable organizations in December. Partially offsetting the increase in NEP was an increase in general expenses due to the donation of the unclaimed portion of the Reduced Driving Refund, and higher operating expenses due to personnel and commissions expenses.
20 Co-operators General Insurance Company | 2020 Annual Report
Fourth quarter DWP increased 4.5% over the same period of 2019 to $988.1 million while NEP grew by 9.7% compared to the fourth quarter of prior year to $950.5 million. DWP and NEP growth compared to the comparative quarter was attributable to higher average premiums from targeted rate adjustments achieved pre-pandemic in the auto line of business. In addition, DWP and NEP was impacted by a partial reversal of the Reduced Driving Refund initially recognized in the second quarter of 2020, increasing DWP and NEP respectively by $15.2 million in the fourth quarter. The partial reversal reflected the unclaimed portion of the Reduced Driving Refund, with the unclaimed refund donated to charitable organizations in December.
The loss ratio for the quarter, excluding MYA, was 57.8% compared to 64.5% from the same period of 2019, an improvement of 6.7 percentage points. This was a result of NEP growth combined with lower major event losses and lower current accident year claims, particularly in the commercial and auto lines of business, partially offset by unfavourable claims development in auto and commercial.
Fourth quarter general expenses increased by $12.7 million over the same quarter of last year, the result of the donation of the unclaimed portion of the Reduced Driving Refund, coupled with higher commissions and advisor compensation attributed to premium growth and movements in the provision for advisor transition commissions. This was partially offset by reduced strategic spend due to COVID-19.
The fourth quarter of 2020 saw strong performance from our investments, recording net investment income and gains of $108.2 million, representing a $33.5 million favourable change from the same quarter of last year. This result was mainly driven by unrealized preferred share gains of $26.7 million and realized bond gains of $13.2 million in the current quarter, compared to gains of $8.6 million and $0.6 million, respectively, recognized in the same quarter of last year.
We recognized other comprehensive income for the quarter of $5.4 million, an improvement of $30.5 million compared to the comparative quarter in 2019. This was mainly attributable to unrealized gains on common shares of $35.2 million and unrealized losses on bonds of $11.2, an improvement of $22.1 million and $19.0 million, respectively, compared to the prior quarter. This was partially offset by $13.2 million in reclassification adjustments to the consolidated statement of income, an increase of $7.5 million from the prior period. In addition, adverse changes in the discount rate and other financial assumptions resulted in an actuarial loss of $7.6 million in our retired benefit obligation, an unfavourable change of $5.3 million from the same quarter in 2019.
OFF BALANCE SHEET ARRANGEMENTS AND CONTRACTUAL COMMITMENTS
Securities lending
We lend securities in our investment portfolio to other institutions for short periods to generate additional fee income. We receive securities of superior credit quality and value as collateral for securities loaned. As at December 31, 2020, the value of the securities on loan consisted of $42.0 million in stocks and $801.4 million in bonds. Securities with a fair value of $904.8 million were received as collateral. The collateral received has not been recorded in Co-operators General’s consolidated balance sheet.
Investment commitments
We have entered into commitments with private equity funds to invest additional funds of $81.7 million and US$183.5 million into limited partnership structures. The timing and the amount of capital contributions that are called is determined by the General Partner. As at December 31, 2020, we had provided capital contributions of $207.2 million towards these commitments.
Structured settlements
In the normal course of claims adjudication, we settle certain obligations to claimants through the purchase of annuities from third party life insurance companies under structured settlement arrangements. This business is placed with several licensed Canadian insurance companies. Our net risk is the credit risk related to the life insurance companies the annuities are purchased from. To manage this risk, we enter into structured settlements with life insurance companies with a credit rating of A or higher. This risk is further reduced to the extent of coverage provided by Assuris, the life insurance compensation plan that funds most policy liabilities of an insolvent Canadian life insurer. As at December 31, 2020, we have guaranteed the life insurers’ obligations under these annuities, totaling $815.4 million, based on the net present value of the projected future cash flow of these guarantees. No default has occurred, and we consider the possibility of default to be remote.
CONTINGENCIES We are subject to litigation arising in the normal course of conducting our insurance business. As a result of COVID-19, emerging litigation has arisen pertaining to coverage interpretation, resulting in certain class actions to which Co-operators General is a defendant. We are of the opinion that this litigation will not have a significant effect on the financial position, results of operations or cash flows of Co-operators General. Note 28 of the consolidated financial statements provides additional information on contingencies.
Co-operators General Insurance Company | 2020 Annual Report 21
Management’s Discussion & Analysis
RELATED PARTY TRANSACTIONS In the normal course of business, we obtain services from our ultimate and immediate parent companies as well as from related companies that are under the common ownership of our ultimate parent company. Note 25 of the consolidated financial statements provides additional information on related party transactions.
Services we receive:
Corporate services from Co-operators Financial Services Limited (2020 - $175.8 million, 2019 - $151.6 million)
Corporate services are provided by the parent company, CFSL. CFSL recovers the cost for services including corporate procurement, human resources, costs related to the Board of Directors, annual meeting, senior executives, general counsel, compliance, enterprise risk management, corporate actuarial, corporate reinsurance, strategic planning, enterprise project portfolio office, corporate finance, financial accounting services, tax, audit, marketing and corporate communications, enterprise information technology and workplace services. The management fee charges are set on a cost-recovery basis and are shared amongst the various subsidiaries of the parent company based on estimated usage of services provided. This contract renews annually.
Executive services from The Co-operators Group Limited (2020 - $1.9 million, 2019 - $8.7 million)
Executive services are provided by certain senior executives of the ultimate parent company, CGL. The executive fee charges are allocated to the various subsidiaries of the parent company based on the compensation costs incurred by CGL related to these employees. This contract renews annually.
Product distribution from HB Group Insurance Management Ltd. (2020 - $42.8 million, 2019 - $73.3 million)
HB Group is the primary distribution channel for COSECO. HB Group charges a commission for its distribution services of which the contract renews annually. In 2020, distribution expenses decreased due to HB Group ending its contract with CUMIS General and with the move of COSECO group business to CGIC.
Product distribution from Premier Managers Holdings Corporation (2020 - $26.6 million, 2019 - $23.9 million)
Premier is one of the distribution channels for Sovereign. Premier charges a commission for its distribution services. This contract is set at terms and conditions similar to those of other third-party contracts. This contract renews annually.
Reinsurance from Co-operators Life Insurance Company (premiums: 2020 - $37.0 million, 2019 - $68.3 million; commissions: 2020 - $22.3 million, 2019 - $36.9 million)
CUMIS General cedes a portion of the accident and sickness premium and the related commission expense within the travel line of business to CLIC. The reinsurance contract is set at terms and conditions similar to those of other third-party reinsurance contracts.
Employee and retiree benefits administration from Co-operators Life Insurance Company (2020 - $9.8 million, 2019 - $9.1 million)
Employee life and long-term disability benefits are insured and medical and dental benefits are provided for under an administrative services only contract. These contracts are set at terms and conditions similar to those CLIC establishes for its third-party client base. This contract renews annually.
Investment management services from Addenda Capital Inc. (2020 - $5.5 million, 2019 - $5.1 million)
Addenda provides investment management services for our portfolio of invested assets. The fees are charged in a manner that is consistent with Addenda’s external clients. This contract renews annually.
Members and members of members service agreement with Federated Agencies Limited (2020 - $2.1 million, 2019 - $2.3 million)
Federated Agencies Limited holds applicable licenses to provide products and services to CGL’s members and members of CGL’s members. A commission is charged for broker and underwriting services. This contract renews annually.
22 Co-operators General Insurance Company | 2020 Annual Report
Services we provide:
We provide product distribution services (2020 - $41.2 million, 2019 - $44.0 million) and marketing services (2020 - $6.7 million, 2019 -$8.8 million) to CLIC for insurance and wealth management products. We compensate the advisors directly and receive payments based on the production level from CLIC. The compensation rate is negotiated on a fair and equitable basis by using industry comparatives. We also charge CLIC for the portion of the marketing program deemed to benefit the life insurance business. This contract is periodically renegotiated.
CUMIS General assumes a portion of the accident and sickness business premium (2020 - $1.1 million, 2019 - $3.8 million) and the related commission expense (2020 - $0.7 million, 2019 - $2.2 million) within the travel line of business from CLIC. The reinsurance contract is set at terms and conditions similar to those of other third-party reinsurance contracts.
OUTLOOK, BUSINESS DEVELOPMENTS AND OPERATING ENVIRONMENT GENERAL BUSINESS AND ECONOMIC CONDITIONS
The declaration of the COVID-19 pandemic by the WHO brought the end of the longest economic cycle in more than 150 years. Economic output contracted steeply as governments ordered widespread public health interventions such as lockdowns earlier in the year. Although for most countries the recession was short lived, the damage to output was such that it resulted in a full-fledged recession. In Canada, GDP contracted by 13% during the first two quarters of the year before rebounding by 8.9% in the third quarter, leaving economic activity 5.3% short of pre-pandemic levels. The story was similar in the United States, where GDP dropped 10.1% and rebounded 7.5%, a 3.4% short fall to pre-pandemic economic activity. The labour market was significantly impacted by government responses to curb the spread of the virus. Employment declined by approximately 3 million jobs in Canada while in the U.S this figure was in the range of 25 million jobs, with a portion of these jobs permanent losses to the labour market. The rebound in employment was not as swift as for output: at year-end, 75% of jobs lost had been recovered in Canada while the figure was 65% in the United States.
To mitigate the impact of the restrictions on the economy, governments quickly enacted policies to support businesses and individuals navigate the economic turbulence. The result of the various fiscal stimulus policies was a steep increase in government deficits. In addition, central banks, including the Bank of Canada and the United States Federal Reserve, played a key role in the economic recovery program by extending quantitative easing measures, such as purchasing more government bonds to ensure the liquidity of the financial and capital markets. The result of these interventions by central banks prevented bond yields from increasing in the wake of significant bond issuance. Policy rates were maintained at close to 0%, with the Bank of Canada and the United States Federal Reserve keeping their target rates at 0.25% and 0.125%, respectively.
While the pandemic continues in light of recent local and regional resurgences, provincial and federal governments will continue to implement a variety of measures to mitigate the impact of further strains on public health systems and to help stabilize economies. As a result, it is difficult to foresee with much clarity how economic activity will fare in 2021 and looking beyond. Economic recovery will be dictated by the effectiveness of vaccination programs and continued public sector support. Whether the economy can rebound back to pre-pandemic levels remains to be seen and will be driven by myriad of factors.
PROPERTY AND CASUALTY INDUSTRY
The P&C industry emerged from the pandemic year of 2020 in a strong position. The pandemic accelerated several trends that were already underway, while new uncertainties arose.
Increasing digital adoption by consumers was a trend already underway which was hastened as the pandemic took hold. The adoption of digital channels by consumers was seen across virtually all areas of retail, and insurance was no exception. This trend is expected to continue to accelerate, as enhanced digital offerings increasingly become the norm. Our guided omni-channel distribution model for our clients gives them the flexibility to choose when, where and how they interact with us.
Investment in digital capabilities for both manufacturers and distributors is increasing in importance. While there is an understandable focus on serving clients, insurers have also been focusing on automating and digitizing non-customer-facing processes. Automation of back-end systems promises greater speed and efficiency. The use of artificial intelligence (AI) and machine learning (ML) is helping insurers make increasingly sophisticated predictions based on data and learned experiences. We are investing heavily in our digital capabilities. We have implemented robotic process automation (RPA) to streamline our processes. We have partnered with top universities in Canada to develop our leading-edge AI and ML capabilities, and we are using those capabilities to transform the way our underwriting and claims are done.
Co-operators General Insurance Company | 2020 Annual Report 23

Management’s Discussion & Analysis
Climate change and severe weather events continue to be an ongoing challenge to the P&C industry. Insurers have continued to experience a marked increase in extreme weather-related payouts. The year 2020 was no exception, as weather events in Canada cost the industry an estimated $2.5 billion in insured losses. Wildfires across the globe, particularly in Australia and the United States further showed the effect of climate change. The effects of climate change do not stop at national borders: although Canada’s fire season was relatively mild, smoke from vast wildfires in the U.S. Pacific Northwest drifted into southern British Columbia, resulting in Victoria and Vancouver having 80 percent more smoky hours in September than they did in the province’s extreme fire season in 2018.
Addressing these extreme weather trends has brought about a better understanding of how changing weather patterns impact the risks we face, along with innovative solutions to help everyone deal with them (from both a risk mitigation and indemnification perspective). We have been proactive in segmenting our policy base to provide our clients with the coverage they need and priced at a level to ensure competitiveness and profitability.
Severe weather events can often result in flooding, leaving our cities and homes increasingly vulnerable to uninsured risks. The existing government policy places too much emphasis on recovery at the expense of mitigation. We are dedicated to finding sustainable solutions that better protect our communities and our economy. We will continue to support efforts to engage governments and other stakeholders to help identify solutions to manage, mitigate, and transfer risks associated with overland flooding.
A renewed focus on rigorous underwriting processes are a continuation and acceleration of a market shift that started to take hold in 2019. Although some of the implementation of these underwriting approaches was delayed during the COVID-19 crisis, this trend is re-emerging across both retail and commercial P&C lines. Pricing increases, tightened terms, and reducing capacity in some lines are emerging as insurers take a much more disciplined approach to underwriting beyond merely looking at price adequacy. Especially in commercial markets, carriers are selectively reducing limits, exiting certain industry segments, reducing coverage, and looking for increased retentions. We have placed significant effort on achieving underwriting profitability through initiatives in both our retail and commercial business. We remain committed to our mission of providing financial security for Canadians and their communities, while ensuring we remain focused on profitability throughout our four-year strategy.
Cyber attacks and data breaches are among the top emerging risks. The mass data breach that occurred at a large Canadian financial institution announced in June of 2019 continued to resonate across the insurance industry. The incident highlighted the need for cyber security measures, both for clients and for insurers. With many employees working from home, the risk of cyber attacks increased. The cyber insurance market is still relatively small, and 2020 saw a spike in cyber claims. Insurers will have to invest in their own infrastructure and processes to establish proper safeguards in place to protect their information. We have invested significantly in our policies, procedures, and systems to ensure our own information has a high level of protection, with access controls and data segregation. In addition, we continue to adjust our approach to cyber insurance. For instance, we have invested in our claims infrastructure to handle cyber claims, with an emphasis on helping clients address the fall-out from a cyber attack or breach. Indeed, research has shown that how cyber insurers handle their clients’ claims service and claims processing plays a large role in the severity of the resulting claims.
EMERGING LEGISLATION AND REGULATORY EVENTS
Legislative, judicial and regulatory events have an impact on our claims reserving practices. Changes to legislation that occurred in previous periods will likely have an ongoing impact in our business in future periods. Legislative and regulatory changes, both current and future, are discussed below.
Auto insurance emergency relief measures
In response to the COVID-19 pandemic, we have worked with regulatory bodies in all jurisdictions to introduce auto relief measures for our clients including payment relief, client-initiated premium relief, and our Reduced Driving Refund. Our Reduced Driving Refund is 15% and has been applied to April and May monthly premiums for private passenger and light commercial vehicles for all eligible auto clients. To maximize premium relief payouts to our clients, we contacted unregistered clients, either through email or mail, and extended the sign-up deadline to December 15. Unclaimed amounts were reinvested into communities across Canada through charitable organizations.
Ontario auto
Auto insurance is heavily regulated by the Financial Services Regulatory Authority of Ontario (FSRA). FSRA administers the Insurance Act and approves any auto rate changes. We actively monitor legislative developments and seek to engage with the government and its agencies on important issues. An update on several current issues is as follows:
24 Co-operators General Insurance Company | 2020 Annual Report

Financial Services Regulatory Authority
2020 marks the first full calendar year of FSRA’s operation, and we have engaged with them closely on matters related to rate regulation, including rate approvals and their shift toward principles-based guidance. We continue to participate on several advisory committees related to property and casualty insurance.
Auto insurance reform
In the 2019-20 budget, the Ontario government released its Putting Drivers First blueprint, a framework for auto insurance reform focused on affordability and accessibility. An update to the Putting Drivers First blueprint was included in the 2020 budget, with the next phase set to include enhanced electronic communication, action on fraud and more approved coverage options. Accompanying legislation and regulation has not yet been introduced. The budget also announced that credit unions will be permitted to sell insurance in their branches and online through a subsidiary or partnership.
Following sustained advocacy, the government is conducting a legislative review of the Consumer Protection Act with regards to tow and storage services, and has launched a provincial tow truck task force to improve oversight of the sector. Co-operators General has met with the task force and provided recommendations on reform to the legislative and regulatory framework for towing and storage.
Ontario commercial
In response to the impacts of COVID-19, the government has called for insurers to improve commercial insurance accessibility and affordability. As part of an industry-led initiative, Co-operators General is participating in the Business Insurance Action Team to support small businesses in the hospitality sector. Initially focused on Ontario, a risk manager and a committee of insurers will work with brokers and business owners to determine the level of coverage and premium that can be offered. A business would not be obliged to accept the coverage offered through the BIAT.
Alberta auto
Auto insurance is heavily regulated by the Office of the Superintendent and the Automobile Insurance Rate Board (AIRB). The former administers the Insurance Act and its regulations, while the AIRB approves all auto rate changes. However, these responsibilities are shifting as discussed in the following subsection. Alberta’s market has presented challenges, and we have actively engaged with the government and regulators in an effort to address these issues.
Auto insurance reform
Over the last year, we have been actively engaged on provincial auto insurance reform, working directly with the government-appointed auto insurance advisory committee, regulators and the government to share our recommendations on product and regulatory reform.
At the end of October, the auto insurance advisory committee released its report, recommending a pure no-fault auto insurance system. This was accompanied by the introduction of legislation, which has subsequently received royal assent, that will introduce direct compensation for property damage, limit prejudgment interest, restrict the number of experts that can be used in auto injury litigation and expand the authority of the AIRB. Regulatory amendments have also been introduced to update automobile accident insurance benefits, diagnostic and treatment protocols and the minor injury regulation. These amendments took effect on November 1, 2020.
Rate regulation
Simplified Filing guidelines for Usage Based Insurance (UBI) programs were introduced by the AIRB, effective January 1, 2021, as a means to introduce new UBI programs or modify existing programs to follow a more streamlined approach. In addition, insurers have the ability to expand their UBI programs beyond simply offering a UBI-based discount. In light of the increased authority of the AIRB and their willingness to make changes quickly, such as the UBI expansion, we continue to provide recommendations to the AIRB and to actively participate in all consultations and requests for feedback.
British Columbia home
The government and the BC Financial Services Authority (BCFSA) have undertaken significant work on reforming strata legislation and regulation, including a focus on insurance. As a provider of property insurance for strata unit owners, Co-operators General is participating in these reform efforts, and has met with the BCFSA and provided recommendations on further legislative and regulatory action with the government.
Co-operators General Insurance Company | 2020 Annual Report 25
Management’s Discussion & Analysis
Effective January 1, 2021, Best Terms Pricing became prohibited when constructing strata insurance policies for strata properties. As our portfolio does not include subscription strata policies, this will not impact Co-operators General.
New Brunswick auto
Over the last year, we have engaged with the Financial and Consumer Services Commission (FCNB) on its ongoing project to modernize the Insurance Act. We have also participated in consultations on the anticipated development and introduction of diagnostic and treatment protocols.
Newfoundland and Labrador auto
Reform measures originally announced in legislation last year, including the introduction of direct compensation for property damage, have been brought into effect. The development of diagnostic treatment protocols is underway, and we have provided feedback as part of this process.
RISK MANAGEMENT COVID-19 PANDEMIC
Global and local infection, economic uncertainty, and financial market volatility caused by the COVID-19 pandemic had significant and varied impacts on our organization, as well as on our members, clients and communities. Immediate threats to physical health, increased hospitalizations, government-mandated lockdowns, business interruptions, financial insecurity, and lingering mental health impacts were challenges that defined the year in review. Many of the pandemic-induced risk issues felt by our organization are highlighted throughout this section.
The Co-operators’ Enterprise Risk Management (ERM) team led the Business Continuity response to the pandemic ensuring strong oversight and co-ordination with senior leaders throughout the organization. To ensure the organization was prepared for the range of possible epidemiological and economic market outcomes, both in the short-term and over the planning horizon, we quickly mobilized internal modelling and planning teams to understand, anticipate and prepare for the enterprise-wide risks and impacts through a variety of recovery scenarios. As conditions evolved, multiple rounds of stress testing scenarios were developed and refined, including modelling a worse-case scenario. An agile approach was applied in preparing an overall framework with action plans and protocols.
Each scenario included immediate next steps with detailed accountabilities and the required pace of execution. Scenario planning details included epidemiological description (e.g., likelihood of vaccination, provincial health protocols, government shutdowns), economic conditions (e.g., depth of market correction, duration or time to GDP stabilization, level of government financial intervention), client impacts (e.g., changing behaviours, debt/wealth, spending) and organizational impacts (e.g., productivity, new business, claims, service levels, capital, and expense management initiatives). A list of ongoing uncertainties was recognized and integrated into the planning process (e.g., change in virus properties, the role of asymptomatic individuals, true infection rates and immunity, reactions of clients, public policy responses). This framework was used to support senior management in actioning next steps.
This work effort, including sensitivity and ad-hoc testing, has been ongoing since March. It has been the result of extensive collaboration, review and assessment across our group of entities. Management continues to closely monitor pandemic developments and their impact to the business, operations and capital resources.
Effective risk management is vital to making and executing sound business decisions, both strategically and operationally. It involves identifying and understanding the risks the organization is exposed to, making an assessment as to its materiality and taking measures to manage the risks within acceptable tolerances. We recognize the importance of a strong risk management culture where the efficient and effective assessment of material risks forms the basis of all decision-making and strategic planning.
The Co-operators has an enterprise-wide approach to the identification, assessment, quantification, monitoring, reporting and mitigation of risks across the organization which also applies to Co-operators General. The Board of Directors, directly or through the Risk and Compensation Committee (R&CC) of the Board, ensures senior management has put appropriate risk management policies in place and that risk management processes are effective. Regular reports on our risk profile relative to our Board-approved risk appetite are provided to the R&CC and senior management by our Chief Risk Officer (CRO).
We have identified and considered a variety of risk issues when engaging in our organizational activities. We also monitor emerging risks that are evolving in uncertain ways, have been forgotten in their dormancy, or are new. We continuously assess our risk environment and the potential impact on our corporate strategy, business plan, competitive position, operational results, reputation and financial condition. The risks identified within our risk universe are not presumed to be exhaustive and previously unidentified risks or material changes in the exposure to a known risk may occur resulting in a re-assessment of their relative effect on Co-operators General.
26 Co-operators General Insurance Company | 2020 Annual Report
At least annually we conduct an ORSA. ORSA is a tool used to enhance our understanding of the interrelationships between our risk profile and capital needs. It is designed to be congruent with our business strategy and operational business plan. As part of the ORSA process, we consider all reasonably foreseeable and relevant material risks. ORSA incorporates stress testing over the business planning period in order to be forward-looking and reflect the dynamic nature of our business and operating environment. As an output of the assessment, we determine the level of capital needed to cover our risks, including those risks covered in the regulatory capital guidelines.
RISK MANAGEMENT STRUCTURE
Board of Directors: Most of the ERM Board oversight is delegated to the R&CC of the CGL Board. However, the full Board maintains responsibility for approving the ERM Framework and the Risk Appetite Framework after reviewing the R&CC’s recommendations. The Board also reviews and approves the results of the ORSA annually and approves CGIC’s minimum internal capital target.
Risk and Compensation Committee of the Board: The R&CC is comprised of a subset of members of the CGL Board of Directors. R&CC’s mandate includes setting the “tone at the top” for a strong ERM culture, and oversight of our ERM Framework. The R&CC monitors ERM processes to ensure their effectiveness by approving risk limits for significant risks, reviewing regular reporting on our risk profile relative to our Board-approved risk appetite, and understanding action taken by management in response to identified issues. In addition, the R&CC oversees the strategy for the use of risk and capital modelling methods and tools as well as our stress testing program. The R&CC is also responsible for determining risk impacts of climate change within ORSA and stress testing.
Management Risk Committee (MRC): The MRC includes all members of the Co-operators Management Group (CMG, which includes the Chief Executive Officer and his direct reports), the CRO, the Chief Compliance Officer, and the VP Strategic Planning. The MRC meets at least quarterly and is a strategic decision-making body responsible for planning, directing and controlling the impact of all significant risks faced by the organization. The MRC also helps to set the tone for a strong ERM culture, supports the ERM vision across the organization and acts as the authoritative escalation body for risk-related issues.
Management Capital Committee (MCC): The MCC is a subcommittee that monitors, evaluates, and recommends capital allocation and strategy decisions to CMG. The MCC ensures capital management practices align with all regulatory expectations and requirements. Its responsibilities include understanding the impact of stress events on capital and ensuring adequate capital contingency plans are in place to deal with remote but plausible stress scenarios.
Management Investment Committee (MIC): The MIC is a subcommittee that reviews and advises management on the lending and investment programs. MIC develops and recommends adoption of the lending and investment risk management policies and provides risk measurement, assessment, monitoring and reporting of investment policies.
Reinsurance & Insurance Counterparty Standards Committee (RICS): The RICS is a subcommittee that sets and communicates standards to be applied in assessing counterparties with whom we currently, or may in the future, engage in financial business relationships. The RICS is also accountable for monitoring counterparties' credit and default risk against these standards.
Functional and Business Unit Risk Management: Functions that operate across the group of companies and business units that operate within their respective companies are responsible for managing the risks related to their own operations. While these risks may be specific to their function or business unit, the ERM framework provides a common language and common tools to identify, assess, quantify and manage these risks.
Oversight Functions: Areas with independent oversight accountabilities reside in functions such as ERM, Compliance, Corporate Governance, Financial Controllership, Legal, Human Resources, Tax, Information Technology, Corporate Actuarial and other areas within control and group functions. They are not actively involved in the management of the business. They provide oversight of risks, provide guidance in their area of expertise, and help to build and monitor risk controls.
Audit Services: Audit Services performs periodic risk-based reviews to ensure adherence to risk policies and practices thereby providing independent assurance that risk controls are in place and are operating effectively.
Early in the pandemic we put in place streamlined governance committees and processes to enable us to effectively adapt to and manage within the ongoing COVID-19 operating environment.
Co-operators General Insurance Company | 2020 Annual Report 27
• • •
•
• •
•
•
•
•
•
Management’s Discussion & Analysis
RISK APPETITE
Continuously and effectively balancing the risk-reward trade-off while demonstrating our co-operative vision and values preserves our ability to operate within our company’s overall appetite for risk.
Our purpose in setting our risk appetite is to define the types and amount of risk we are willing and able to responsibly accept in the pursuit of earning an appropriate return and fulfilling our strategic goals. Our risk appetite statements describe, at a broad level, the risks we will avoid, the risks we are prepared to assume and the limits we will place on those risks.
Our risk appetite is informed by these principles:
We cannot be in business without taking risks; The risks we take must further our mission and be consistent with our vision and values; We view capital as a scarce and strategic resource. To develop and sustain our business, we must earn a reasonable return on the capital we have; We must manage risk in a way that balances short and long-term objectives in order to allow us to compete in the marketplace and ensure our sustainability; We desire to both evaluate opportunities for appropriate risk-taking and prevent excessive risk-taking; and The risks we face are multiple, complex and often inter-related. Some are readily measurable, others are not. While models provide a useful means for understanding our risks, and controls provide valuable mitigation in the management of risks, they do not eliminate the need for the application of informed judgment and common sense.
The development and establishment of our risk appetite is a dynamic and iterative process that requires ongoing dialogue throughout our organization. Our risk appetite may change over time in line with our changing capabilities for managing risk. Our actual risk profile relative to our desired risk appetite is monitored and reported quarterly to senior management, the R&CC and the Board.
Our risk appetite shapes our organization’s risk profile, influences the development and implementation of our strategy, and determines the risks we undertake in relation to our organization’s risk capacity.
RISK UNIVERSE
The global pandemic significantly impacted the risk appetite of our industry and of our organization, exacerbating and re-shaping many of the risks we manage in our risk universe.
We categorize our risks using a common taxonomy referred to as our risk universe:
Investment Risk – The risk of loss resulting from the quality of invested assets, movements in the capital markets, and/or the relationship between insurance assets and liabilities. It includes credit, liquidity, market and real estate risk. Insurance Risk – The risk of potential financial loss that may arise where the amount, timing and/or frequency of benefit and/or premium payments under insurance or reinsurance contracts is different than what was expected at the time of pricing and/or reserving for the insurance contract. Insurance risk is distinct from investment, operational, strategic or reputation risk where those risks are ancillary to or accompany the risk transfer. Operational Risk – The risk of direct or indirect loss resulting from inadequate or failed internal processes, people and systems or from external events. It includes legal and regulatory risk but excludes strategic and reputation risk. External events include global issues such as climate change risk. Strategic Risk – The risk arising from our inability to adopt and execute effective business plans and tactics, to allocate resources appropriately, and to adapt to changes in our business environment. We research and consider the implications of emerging strategic trends in our strategic planning processes and build our plans accordingly. Reputation Risk – The risk of loss resulting from an activity of CGL or its representatives that impairs our image in the community, or public confidence. This may result in loss of business, legal action, an increased cost of capital, and/or additional regulatory oversight. We conscientiously influence our reputation by being authentic to who we are, by assuming responsibility for our actions, and by proactively communicating and conducting our business activities in an ethical, fair, honest and transparent manner.
The sections that follow highlight some of the risks that fall within these categories.
28 Co-operators General Insurance Company | 2020 Annual Report
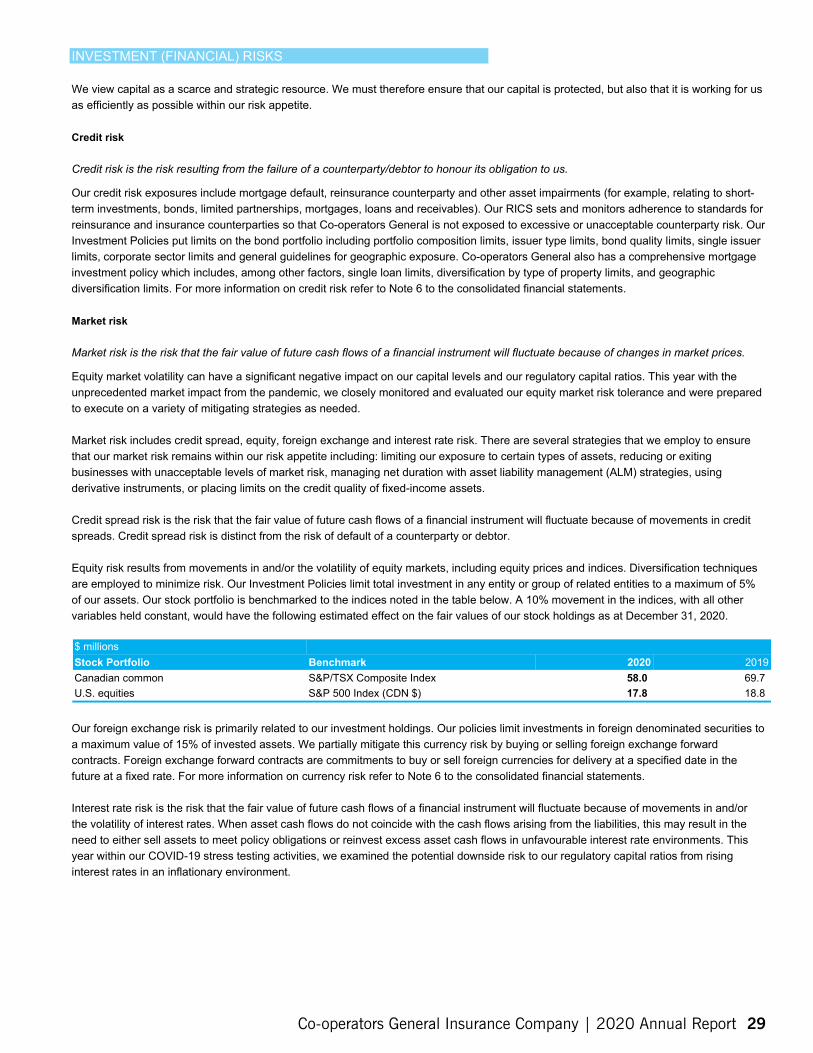
INVESTMENT (FINANCIAL) RISKS
We view capital as a scarce and strategic resource. We must therefore ensure that our capital is protected, but also that it is working for us as efficiently as possible within our risk appetite.
Credit risk
Credit risk is the risk resulting from the failure of a counterparty/debtor to honour its obligation to us.
Our credit risk exposures include mortgage default, reinsurance counterparty and other asset impairments (for example, relating to short-term investments, bonds, limited partnerships, mortgages, loans and receivables). Our RICS sets and monitors adherence to standards for reinsurance and insurance counterparties so that Co-operators General is not exposed to excessive or unacceptable counterparty risk. Our Investment Policies put limits on the bond portfolio including portfolio composition limits, issuer type limits, bond quality limits, single issuer limits, corporate sector limits and general guidelines for geographic exposure. Co-operators General also has a comprehensive mortgage investment policy which includes, among other factors, single loan limits, diversification by type of property limits, and geographic diversification limits. For more information on credit risk refer to Note 6 to the consolidated financial statements.
Market risk
Market risk is the risk that the fair value of future cash flows of a financial instrument will fluctuate because of changes in market prices.
Equity market volatility can have a significant negative impact on our capital levels and our regulatory capital ratios. This year with the unprecedented market impact from the pandemic, we closely monitored and evaluated our equity market risk tolerance and were prepared to execute on a variety of mitigating strategies as needed.
Market risk includes credit spread, equity, foreign exchange and interest rate risk. There are several strategies that we employ to ensure that our market risk remains within our risk appetite including: limiting our exposure to certain types of assets, reducing or exiting businesses with unacceptable levels of market risk, managing net duration with asset liability management (ALM) strategies, using derivative instruments, or placing limits on the credit quality of fixed-income assets.
Credit spread risk is the risk that the fair value of future cash flows of a financial instrument will fluctuate because of movements in credit spreads. Credit spread risk is distinct from the risk of default of a counterparty or debtor.
Equity risk results from movements in and/or the volatility of equity markets, including equity prices and indices. Diversification techniques are employed to minimize risk. Our Investment Policies limit total investment in any entity or group of related entities to a maximum of 5% of our assets. Our stock portfolio is benchmarked to the indices noted in the table below. A 10% movement in the indices, with all other variables held constant, would have the following estimated effect on the fair values of our stock holdings as at December 31, 2020.
$ millions Stock Portfolio Benchmark 2020 2019 Canadian common S&P/TSX Composite Index 58.0 69.7 U.S. equities S&P 500 Index (CDN $) 17.8 18.8
Our foreign exchange risk is primarily related to our investment holdings. Our policies limit investments in foreign denominated securities to a maximum value of 15% of invested assets. We partially mitigate this currency risk by buying or selling foreign exchange forward contracts. Foreign exchange forward contracts are commitments to buy or sell foreign currencies for delivery at a specified date in the future at a fixed rate. For more information on currency risk refer to Note 6 to the consolidated financial statements.
Interest rate risk is the risk that the fair value of future cash flows of a financial instrument will fluctuate because of movements in and/or the volatility of interest rates. When asset cash flows do not coincide with the cash flows arising from the liabilities, this may result in the need to either sell assets to meet policy obligations or reinvest excess asset cash flows in unfavourable interest rate environments. This year within our COVID-19 stress testing activities, we examined the potential downside risk to our regulatory capital ratios from rising interest rates in an inflationary environment.
Co-operators General Insurance Company | 2020 Annual Report 29
Management’s Discussion & Analysis
Historical data and current information are used to profile the ultimate claims settlement pattern by class of insurance, which is then used to develop an Investment Policy and strategy. To mitigate a portion of our interest rate risk, Co-operators General deploys an ALM strategy. A portion of the assets backing our unpaid claims and adjustment expenses are designated as fair value through profit or loss (FVTPL) under the fair value option with the objective of offsetting a targeted portion of the financial impact of interest rate changes and avoiding an accounting mismatch. While interest rate increases tend to have a positive effect on our net income, they tend to weaken our overall financial position due to the impact on bond values. A 1% movement in the interest rate, with all other variables held constant, would have the following estimated effect on the fair values of our holdings as at December 31, 2020:
$ millions December 31, 2020 AFS FVTPL
December 31, 2019 AFS FVTPL
Bonds 160.6 7.4 131.9 7.1 Canadian preferred stocks - 13.7 - 16.9 Pooled funds 20.6 - 17.7 -
Liquidity risk
Liquidity risk refers to the risk resulting from holding inadequate liquid assets to meet our obligations as they come due. It includes operational and strategic liquidity.
As a result of the global pandemic declaration by the WHO, market liquidity presented some trading challenges in March (particularly with respect to corporate bonds) although conditions improved by the end of April. During this time, senior management received a weekly liquidity report detailing cash, money market, and federal bond balances. All liquidity ratios continue to remain within our risk appetite.
Liquidity risk can arise from adverse conditions in financial markets that could negatively affect our ability to convert invested assets into cash in a timely and cost-effective manner, or policyholder behavior in the form of cash demands as a result of claims, contractual commitments, or other outflows. Claims payments are funded by current revenue cash flow which normally exceeds cash requirements. Refer to the Off Balance Sheet Arrangements and Contractual Commitments section of the MD&A for a discussion of our commitments.
We do not have other material liabilities that can be called unexpectedly at the demand of a lender or client. We do not have material commitments for capital expenditures, and there is no need for such expenditures in the normal course of business. In addition, we measure our liquidity needs under both normal and stressed conditions ensuring that we have a sufficient level of liquid invested assets at all times. The frequency of this monitoring is increased during times of increased market uncertainty, such as the early stages of the COVID-19 pandemic. We have $19.0 million in available credit facilities as well as access to financial support from our parent company. As at December 31, 2020, we have utilized $nil of the available credit facilities. For more information on liquidity risk refer to Note 6 to the consolidated financial statements.
INSURANCE RISKS
For P&C insurers, this represents the risk that policyholders will experience a higher frequency and/or severity of auto, home, commercial business and/or travel related losses. This results in higher than expected claims payments for bodily injury, liability coverages and/or coverages related to the damage to, or loss of, a physical asset. This includes catastrophe, claims, product design and pricing, reinsurance, reserve valuation, and underwriting risks. For more information on insurance risk refer to Note 7 to the consolidated financial statements.
Catastrophe risk
Catastrophe risk is the risk that a catastrophic event severely impairs our financial position.
P&C insurers are subject to catastrophes which are a series of property and automobile physical damage claims arising from a single event. Catastrophes are caused by various perils such as earthquake, tornado, wind, hail, winter storm, flood or fire. Catastrophes can have a significant effect on our operating results and financial condition. The incidence and severity of catastrophes are inherently unpredictable. To limit our potential impact, we purchase reinsurance which will reimburse us for claims related to a single occurrence event, up to a maximum of $1.45 billion. The deductible and maximum limit for catastrophe reinsurance applies to all P&C operations on a group-wide basis. After the application of the catastrophe program, Co-operators General retention is $70.0 million in incurred claims, which represents approximately 3.7% of our capital. For the purpose of capital management, we define capital as shareholders’ equity excluding AOCI.
30 Co-operators General Insurance Company | 2020 Annual Report
The increasing incidence and severity of extreme weather-related events is a growing challenge faced by the insurance industry. This challenge is intensified by aging municipal infrastructures that are unable to cope with intense storms, greater concentrations of people living in vulnerable areas and higher property values at risk. As an organization whose mission is to provide financial security for Canadians and their communities, it is our duty to continue to enhance our understanding of the potential impacts of climate change and its associated risks, while striving to develop and promote solutions that offer protection to our clients and enhance their financial resiliency. While many of the impacts associated with climate change are beyond our direct control, we have an opportunity to incentivize sustainable behaviour amongst our clients, mitigate risks through pricing and product development, and promote sustainable decision-making in our communities through various advocacy efforts. Refer to the Climate-related financial disclosures section of the MD&A for additional information on this topic.
We write business that is broadly diversified in terms of lines of business and geographic location. There is no guarantee that a catastrophe would not result in claims in excess of our maximum reinsurance coverage; however, based on our catastrophic loss models our protection is in excess of regulatory guidelines and at a level that management considers prudent and in line with our risk appetite.
Reinsurance risk
Reinsurance risk is the risk that the organization’s reinsurance program (ceded and/or assumed) does not operate as intended.
Reinsurance is purchased to limit our exposure to an individual risk, category of risk or geographic risk area. We review our reinsurance limit and scope of cover requirements annually. After these requirements have been determined, we carefully negotiate reinsurance contract terms with selected entities. The availability and cost of this reinsurance is subject to prevailing market conditions. In managing reinsurance risk, we also assess and monitor the financial strength of our reinsurers on a regular basis. There have been no material defaults with reinsurers in the past ten years. Refer to Note 9 of the consolidated financial statements for further information regarding reinsurance.
Product Design and Pricing risk
Product design and pricing risk is the risk resulting from the pricing or features of our products, where revenues and/or costs experienced differ from those expected at the time of pricing.
We price our products taking into account numerous factors including historical claims frequency and severity trends, product line expense ratios, cashflow payment patterns, special risk factors, the capital required to support the product line, and the investment income earned on that capital. Our pricing process is designed to ensure an appropriate return on equity while also providing long-term rate stability. These factors are reviewed and adjusted periodically to ensure they reflect the current environment.
We strive to ensure our pricing will produce an appropriate return on invested capital; however, various external factors like market realities or regulations can have an impact on our ability to do so. For example, in provinces that mandate pricing for automobile insurance, pricing must be submitted to each provincial government regulator. It is possible that, in spite of our best efforts, regulatory decisions may impede automobile rate increases or other actions that we may wish to undertake. Also, during periods of intense competition for any product line, our competitors may price their products below the rates we consider acceptable, which would have an impact on our ability to maintain our rates where we want them. Additionally, changes in our natural environment exacerbated by climate change are making it more difficult to rely on historical claims frequency and severity as a predictor of future claims patterns. In order to continue to develop and offer products that meet the needs of Canadians and their communities, we have invested in the development of internal business intelligence and predictive models to provide us with further insight into hazard-prone areas. We have also observed notable impacts to claims frequency and severity across multiple products as a result of the COVID-19 pandemic.
Underwriting risk
Underwriting risk is the risk resulting from the selection and approval of risks to be insured.
Our underwriting objective is to develop business with sufficient scale within our target market on a prudent and diversified basis and to achieve profitable underwriting results. We underwrite automobile business based on annual reviews of the client’s driving record and claims experience. We underwrite property lines based on location, physical condition, property replacement values, claims experience and other relevant factors. Highly trained and experienced underwriters manually underwrite complex risks using comprehensive underwriting manuals which detail the practices and procedures used in the determination of the insurance risk and the decision of whether to offer coverage. We also leverage our business intelligence system which gives us the tools to better segment and underwrite. All employees in the underwriting area are trained and their work is audited on a regular basis. Advisors and brokers are compensated, in part, based on the profitability of their portfolio.
Co-operators General Insurance Company | 2020 Annual Report 31
Management’s Discussion & Analysis
Claims risk
Claims risk is the risk that the level of actual ultimate claims paid on settlement is different from what was expected.
We employ more than 1,300 claims personnel across Canada, with the majority of claims being handled internally and the remainder handled through independent adjusters. Each employee has an authority limit, which is based on related education, skills and work experience. They are supported by training and comprehensive reference materials which have been compiled to identify investigations and information required before a claim can be paid. Our claims handling approach results in an appropriate control of claims costs.
Reserve Valuation risk
Reserve valuation risk is the risk of misestimating reserve liabilities, where actual cashflows experienced differ from those expected at the time of reserve valuation. It is dependent on the actuarial reserve valuation, as well as claims reserving practices.
We maintain provisions for unpaid claims and adjustment expenses to cover our estimated ultimate liability for claims. There is the potential for significant variability in the amount of ultimate settlement from the current amounts recorded. Impacts to frequency and severity of claims resulting from the COVID-19 pandemic have been considered in the estimated ultimate liability for claims. Because of the pandemic, there is a heightened level of uncertainty around the estimate relative to prior valuations. Our practice is to maintain an adequate margin to ensure future years’ earnings are not negatively affected by prior years’ claims development and other variable factors, such as inflation. We also monitor fluctuations in reserve adequacy on an ongoing basis, and periodically seek an external peer review of reserve levels. We are subject to some exposure in the fluctuation of long-term portfolio yield rates in the valuation of our discounted unpaid claims. Our claims development table and sensitivity analysis are in Note 7 to the consolidated financial statements.
OPERATIONAL RISKS
The COVID-19 pandemic was a test of our organization’s ability to respond and adapt to a rapidly changing environment. Working through our established business continuity plans, teams across the group of companies quickly implemented the Infectious Disease Plan to move our entire workforce to a work-from-home environment to protect our employees, communities, and businesses.
Once our employees, advisors and client-facing staff were safe and set up to work virtually, we adjusted our management structure and developed an Operational Optimization Committee to optimize our operations and deliver on our strategy. We quickly reinforced our technological capabilities to ensure the entire organization could be online and productive while working virtually, and to enable a larger proportion of our clients to be supported online.
To support the foundation of our strategy – our people – we developed new policies and guidelines to enable employees to adapt their work agreement to their personal circumstances, supporting work-life balance and maintaining productivity in challenging times. For those who need/want to work from the office, selected offices have been opened at reduced capacity, and safety guidelines are in place in accordance with federal, provincial and local public health agencies.
Business Continuity and Resilience risk
Business continuity and resilience risk is the risk of a prolonged interruption in the business operations or the ability to restore operations after a disruption.
There are many events that could result in the interruption of our business operations. These can range from sudden catastrophes, such as power outages, cyber-attacks, earthquakes, floods and hurricanes, as well as pandemics. We have plans and actions in place to maintain resilience and maintain service standards to our clients as much as possible. We have building evacuation procedures in place that are evaluated and tested on a regular basis, as well as inclement weather guidelines, telework guidelines, crisis communications procedures and a staff emergency line. Business Continuity and Infectious Disease Plans are created, maintained and tested to a set of established standards, and the approach is in accordance with federal, provincial, and local public health agencies. Compliance with these standards is monitored and reported to Senior Management and the Board of Directors at least annually.
Global Issues risk
Global issues risk is the risk of global trends and external issues that impact our clients and their communities, affect the nature of the insurance industry overall and/or affect our ability to remain relevant to our member organizations and clients. It includes the natural, political, legal, regulatory and social environment, as well as systemic risks.
32 Co-operators General Insurance Company | 2020 Annual Report
We consider the implications of potential changes to our natural, political, legal and regulatory, economic and social environment in our strategic planning processes to understand the impacts and adjust our plans if necessary. Risks present in our natural environment as a result of changing climate patterns have long-term implications in our operating environment. Consistent with our vision of The Co-operators as a catalyst for a sustainable society, we aspire to provide insurance and investment management solutions for individuals and businesses who wish to exert a positive influence on the social or natural environment. We advocate for sustainable behaviour and strive to incorporate sustainable practices within our own organization through impact investments and carbon emissions reduction. Refer to the Climate-related financial disclosures section of the MD&A for a discussion of our commitment to manage this risk.
Regulatory Compliance risk
Regulatory compliance risk is the risk of failing to comply with applicable laws and regulations, including bribery, business conduct, consumer protection, employment practices, market conduct, privacy and tax.
P&C insurance companies are subject to significant regulation by governments. We monitor our compliance with all relevant regulations for the jurisdictions in which we operate. As in any regulated industry, it is possible that future regulatory changes or developments may prevent us from raising rates or taking other action to enhance our operating results. As well, future regulatory changes, novel or unexpected judicial interpretations or political developments could fundamentally change the business environment in which we operate. We actively participate in discussions with regulators, governments, and industry groups to ensure we are well-informed of contemplated changes and that our concerns are understood.
For regulatory changes expected to impact our business, refer to Emerging Legislation and Regulatory Events section of the MD&A above.
Information Technology risk
Information technology risk is the risk that we cannot secure, develop, adopt, operate and support the technology required to meet current and future business objectives and client expectations. It includes risks related to access security, computer operations, resolution management, and IT system changes.
To support a working-from-home posture, we have deployed additional technologies to strengthen cyber security and operational resiliency, enabling us to operate virtually for the foreseeable future.
The cyber threat landscape is continually evolving and new vulnerabilities are being identified across all aspects of the technology spectrum. As a member of the financial services industry, our organization is exposed to threat agents looking for technical weaknesses and exploitable vulnerabilities. A cyber-incident has the potential to result in material consequences for our organization and our clients including loss of system availability, loss of data or data integrity, breaches or distribution of confidential information, as well as impacts to our overall reputation and brand. Our goal is to maintain strong control processes and a resilient technological environment that can safeguard our systems and client information.
To mitigate and manage our exposure to a cyber breach, our organization has a security risk management function with both governance and operational components, including training and awareness at all levels. Our internal technology governance has been designed to meet both regulatory requirements and industry best practices. This function is designed to protect systems with consideration of confidentiality, integrity, and availability of information. Key activities include monitoring our systems for events to detect and prevent system intrusions, as well as conducting scans of the internal and external environments to identify and remediate vulnerabilities. We test our controls and processes on an ongoing periodic basis through technical and executive cyber simulations, penetration testing, and security testing by a trusted external party to simulate threat actors. Along with an extensive business continuity management program, we continually assess our cyber security program to ensure we continue to be well-positioned to meet the needs of our business and clients.
Third-Party and Outsourcing risk
Third-party and outsourcing risk is the risk of failure to effectively manage service providers (third-party or intra-group).
We recognize that these relationships present both risk and opportunity. Through our third-party relationships and outsourced arrangements, the nature of the risk of a potential failure in processes or controls (e.g. cyber breaches, business continuity issues) is changing. Through our Vendor Risk Management Program, we assess third parties and the quality of their risk controls. We also deliberately engage third parties for their subject matter expertise and/or superior controls, to mitigate other risks that we are exposed to and to meet the needs and preferences of our clients.
Co-operators General Insurance Company | 2020 Annual Report 33
Management’s Discussion & Analysis
STRATEGIC RISKS
Client Preferences and Behaviours Risk: The risk of not understanding and adapting to our clients’ needs and expectations.
Competition Risk: The risk of the organization’s relative market position being impacted by our strategic choices and those of our competitors in the same markets. Competition risk can arise within or outside the financial or insurance sector, and from traditional or non-traditional competitors. This risk includes diseconomies of scale and inefficiencies that threaten our ability to provide cost-effective, quality products and services in a timely and efficient manner.
Business Landscape Risk: The risk of not understanding and adapting to fundamental changes in the financial services operating environment, e.g., the emergence of autonomous vehicles and the ensuing transformation of the transportation service platform.
We research and consider the implications of emerging strategic trends in our strategic planning processes and build our plans accordingly.
REPUTATION RISKS
The evolving nature of sophisticated cyberattacks globally puts us at increased risk if we do not stay current in addressing system and network vulnerabilities. Data privacy breaches result in disruption to our clients and can materially impact the company in terms of financial losses and reputational impacts.
A significant investment has been made in recent years to modernize our technology platforms and protect against cyber vulnerabilities, while at the same time leveraging new technologies to provide a much higher level of service, product adaptability, and affordability to our clients.
We recognize the criticality of protecting customer data and have partnered with leading cyber security firms giving us real-time access to cyber threat intelligence blogs, feeds and access to regular dialogues to discuss threat actors and activity. Our Center for Security Operations integrates this intelligence into our incident and activity monitoring tool for prevention, early detection, and for strengthening our mitigating response strategies.
CLIMATE-RELATED FINANCIAL DISCLOSURES
Canadian communities and businesses are increasingly impacted by climate change. As risk experts, we have a critical role to play in helping our members, clients and their communities understand and adapt to the impacts of climate change. 2020 has been an unprecedented year for all of us. Never in recent history has the resilience of our clients and their communities been more tested than by the COVID-19 pandemic. The pandemic has impacted us in many far-reaching ways; in the space of a year, ideas that were completely foreign to us have now become common place. While much of the focus of 2020 has been on our pandemic response mechanisms, we remain committed to our strategic goals of which climate remains a top focus. Indeed, despite the resource constraints borne from COVID-19, many of our climate initiatives have continued throughout the year.
We are committed to building resilient communities, in line with our mission of protecting the financial security and peace of mind of current and future generations. If we are to succeed in our mission, we must address the interconnected economic, social, and environmental issues that put their security at risk. We recognize that today’s challenges will be greater and more complex than the challenges of the past, and that they will require holistic, collaborative, and imaginative solutions. Issues such as climate change compel us to take a longer-term view of success – indeed, the well being of our communities and planet, depends on it.
There has been a stark increase in catastrophic losses in recent decades, fuelled by increasing extreme weather events and natural disasters. While these developments have material impacts on our clients, their communities and our business, we know that we cannot address the issues on our own. As a result, a key strategy in our Climate Commitment is to provide leadership in related advocacy and collaborative initiatives. Co-operators General actively participates and provides leadership in industry-wide initiatives and groups to raise awareness and contribute toward advancing sustainable practices across the industry. For example, flooding is Canada’s most common and costly hazard, yet most Canadians are unaware of its tremendous impact on our economy and well-being. We recognize that we can bring a credible voice to support the many Canadians asking governments to prioritize flood-risk reduction. We have the opportunity to convene communities and partners to build a motivated constituency that is empowered to address this key risk, as well as the many other risks posed by climate change.
34 Co-operators General Insurance Company | 2020 Annual Report
GOVERNANCE
At The Co-operators, climate change is a shared area of concern with our members and accordingly, our active engagement of the Board of Directors (Board) on this topic has been well supported.
Board Level
At Co-operators General, the Board of Co-operators General’s ultimate parent, CGL, oversees Co-operators General’s management of climate-related risks and strategy. This is executed through both the Sustainability and Citizenship Committee (S&CC) and the Risk and Compensation Committee (R&CC). Annually, the S&CC and R&CC hold a joint meeting to review our status on climate-related risks and initiatives, including progress on the TCFD recommendations. In 2020, this meeting was cancelled due to COVID-19.
S&CC
The S&CC is the highest governing body for sustainability-related issues. Meeting quarterly, it is comprised of four members of the Board and is responsible for fostering best practices in sustainability governance, steering the corporate responsibility agenda, and providing oversight of the sustainability performance of The Co-operators group of companies, including Co-operators General. It advises the Board on the sustainability impact of key decisions and emerging sustainability issues, with a key focus towards climate-related issues, risks, and opportunities. Furthermore, it is responsible for ensuring the alignment of the sustainability agenda with our business operations and oversees the integration of climate and sustainability practices into all our core business functions.
The S&CC is constituted as an advisor to the Board of The Co-operators, informing and involving the Board on relevant topics at least annually. Additionally, it reviews and provides recommendations for decisions made by the Board.
R&CC
Meeting quarterly, the R&CC is comprised of four members of the Board and is responsible for overseeing The Co-operators group of companies ERM program, including Co-operators General’s identification of key risks, risk appetite, risk management policies, and risk monitoring and reporting. The R&CC provides oversight over our CRO, offers guidance and advice to senior management on strategic issues linked to our top risk issues, including climate-related risk while also provides oversight over our impact investment strategy which is managed by the MIC.
Management Level
Our Sustainability and Citizenship department, headed by the VP Sustainability and Citizenship, helps Co-operators General be a catalyst for a sustainable, co-operative society. The team is tasked with the integration of our sustainability principles into our investment and insurance related functions throughout the organization. Sustainability and Citizenship regularly provides management support to the S&CC and attends all its meetings. The MIC oversees the implementation of our investment strategies and provides regular updates to the R&CC, ensuring that climate and sustainability impacts are a key focus area. The execution of our investment strategies is performed through our asset manager, Addenda.
STRATEGY
Co-operators General has a long-term 2030 strategy which was developed through the lens of sustainability. As a subsidiary of CGL, we are committed to honouring that strategy which reflects our commitment to integrate sustainability into our thinking and strategy. The strategy expresses the outcomes that we aim to realize by 2030 which include supporting the United Nations Sustainable Development Goals (SDGs) as appropriate. Co-operators General endorses all 17 SDGs, with a focus on 9 SDGs, including Climate Action, among others. Dedicated resources towards the Climate Action SDG will allow us to:
•
•
•
Continue to integrate climate change impacts into our governance and risk management framework – Our parent, CGL, released The Co-operators Climate Commitment in 2018, which outlines our pledge to address climate-related risks and issues in our governance, products and services, operations and investments.
Develop and set clear company-wide climate objectives addressing key parts of our organization that reflect our future goals – Our 2019-2022 corporate strategy weaves climate and sustainability into our co-operative identity. Through the S&CC, we continually monitor company-wide climate objectives and ensure these are cascaded down to our operations.
Strengthen our investment policies by explicitly including the consideration of climate-related risks and opportunities – In collaboration with Addenda, we employ an impact investing strategy which is regularly reviewed and use company disclosures and third-party research to assess our investments’ exposure to climate-related risks and opportunities.
Co-operators General Insurance Company | 2020 Annual Report 35
•
•
•
•
•
Management’s Discussion & Analysis
•
•
Help our clients understand and manage their climate-related risks – We will continue to expand our efforts to inform and equip Canadians with the tools they need to adapt to a changing climate. This includes using our distribution channels, including public documents such as CGL’s Integrated Annual Report as well as social media, to highlight the economic and social impacts of a changing climate. We also partner with not-for-profit organizations and contribute funding to communities across the country to build resiliency.
Be strong and effective stewards and advocates of climate change – As a subsidiary of CGL, we use our collaborative role as a co-operative organization to bring communities, businesses, academia and governments together on our journey toward a more sustainable, low-carbon economy. In leadership and convening roles on various initiatives and panels, we work across sectors to catalyze industry, government, and community action toward a common theme of sustainability.
At Co-operators General, we believe that the acceleration in our changing climate will materially affect economies and as such, our core business. Emerging risks and opportunities can already be seen and felt and will increase in the medium to long-term time horizon. For instance, we expect significant physical impacts on properties and/or human health due to extreme weather events, rising sea levels, intensifying heatwaves and droughts; or as we have seen in 2020 with COVID-19, changes in vectors of infectious diseases. Jurisdictions transitioning to a lower-carbon economy have given rise to their own risks and opportunities. These include changes in technology, climate-policy (or lack thereof) and rising litigations from coverage interpretations. These transition issues affect our operations in our capacity as an insurer, asset manager and advocate, and we must be diligent to have the appropriate strategies in place to face these challenges on the horizon.
As the frequency and severity of extreme weather events and climate-related natural disasters increase, we are using technology, modelling and analytics to better quantify the risks and build the personal resilience of our clients. For example:
We developed FireWatch, a wildfire tracking program, which enables us to more precisely identify geographic areas where we will not be able to write new business during a wildfire event. We use data from the National Alert Aggregation & Dissemination System (NAADS), which helps us better target where to send advance no tice eAlerts to our clients in the eve nt of severe weather activity such as wind storms, ice storms and wildfires. Through our Climate Adaption initiative and academic partnerships, we aim to quantify the long-term impact of climate change on our business and prove our resilience in the face of the rising challenge of climate change. We use monitoring tools which allow us to more accurately tra ck our risk accumulation and exposure to various catastrophic risks. We actively participate in industry initiatives such as the United Nations Environment Programme Finance Initiative (UNEP-FI) via the Principles for Sustainable Insurance (PSI). Co-operators General and Addenda Capital are involved in two separate UNEP-FI pilots of global insurers and asset managers respectively, working to develop tools that will inform climate strategies. As an outcome of our participation, we have advanced the development and deployment of analytical approaches used to identify and solution approaches to flood risk exposure.
36 Co-operators General Insurance Company | 2020 Annual Report
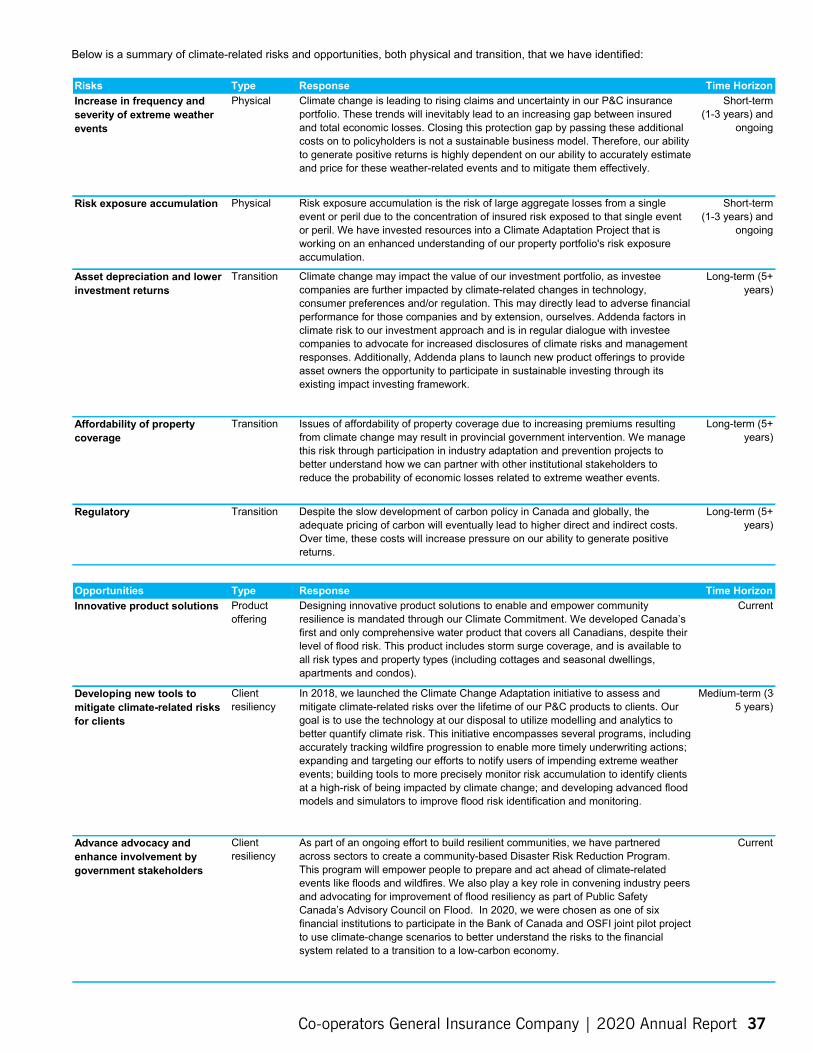
Below is a summary of climate-related risks and opportunities, both physical and transition, that we have identified:
Risks Type Response Time Horizon Increase in frequency and severity of extreme weather events
Physical Climate change is leading to rising claims and uncertainty in our P&C insurance portfolio. These trends will inevitably lead to an increasing gap between insured and total economic losses. Closing this protection gap by passing these additional costs on to policyholders is not a sustainable business model. Therefore, our ability to generate positive returns is highly dependent on our ability to accurately estimate and price for these weather-related events and to mitigate them effectively.
Short-term (1-3 years) and
ongoing
Risk exposure accumulation
Asset depreciation and lower investment returns
Physical
Transition
Risk exposure accumulation is the risk of large aggregate losses from a single event or peril due to the concentration of insured risk exposed to that single event or peril. We have invested resources into a Climate Adaptation Project that is working on an enhanced understanding of our property portfolio's risk exposure accumulation.
Climate change ma y impact t he value o f o ur investment p ortfolio, as investee companies are further impacted by climate-related changes in technology, consumer preferences and/or regulation. This may directly lead to adverse financial performance for those companies and by extension, ourselves. Addenda factors in climate r isk t o our i nvestment a pproach a nd is in regular d ialogue w ith investee companies to advocate for increased disclosures of climate risks and management responses. Additionally, Addenda plans to launch new product offerings to provide asset owners the opportunity to participate in sustainable investing through its existing impact investing framework.
Short-term (1-3 years) and
ongoing
Long-term (5+ years)
Affordability of property coverage
Transition Issues of affordability of property coverage due to increasing premiums resulting from climate change may result in provincial government intervention. We manage this risk through participation in industry adaptation and prevention projects to better understand how we can partner with other institutional stakeholders to reduce the probability of economic losses related to extreme weather events.
Long-term (5+ years)
Regulatory Transition Despite the slow development of carbon policy in Canada and globally, the adequate pricing of carbon will eventually lead to higher direct and indirect costs. Over time, these costs will increase pressure on our ability to generate positive returns.
Long-term (5+ years)
Opportunities Type Response Time Horizon Innovative product solutions Product
offering Designing innovative product solutions to enable and empower community resilience is mandated through our Climate Commitment. We developed Canada’s
Current
first and only comprehensive water product that covers all Canadians, despite their level of flood risk. This product includes storm surge coverage, and is available to all risk types and property types (including cottages and seasonal dwellings, apartments and condos).
Developing new tools to mitigate climate-related risks for clients
Client resiliency
In 2018, we launched the Climate Change Adaptation initiative to assess and mitigate climate-related risks over the lifetime of our P&C products to clients. Our goal is to use the technology at our disposal to utilize modelling and analytics to
Medium-term (3-5 years)
better quantify climate risk. This initiative encompasses several programs, including accurately tracking wildfire progression to enable more timely underwriting actions; expanding and targeting our efforts to notify users of impending extreme weather events; building tools to more precisely monitor risk accumulation to identify clients at a high-risk of being impacted by climate change; and developing advanced flood models and simulators to improve flood risk identification and monitoring.
Advance advocacy and enhance involvement by government stakeholders
Client resiliency
As part of an ongoing effort to build resilient communities, we have partnered across sectors to create a community-based Disaster Risk Reduction Program. This program will empower people to prepare and act ahead of climate-related events like floods and wildfires. We also play a key role in convening industry peers and advocating for improvement of flood resiliency as part of Public Safety
Current
Canada’s Advisory Council on Flood. In 2020, we were chosen as one of six financial institutions to participate in the Bank of Canada and OSFI joint pilot project to use climate-change scenarios to better understand the risks to the financial system related to a transition to a low-carbon economy.
Co-operators General Insurance Company | 2020 Annual Report 37
• • •
Management’s Discussion & Analysis
Resilience, stress testing and climate scenario analysis
One of the key pillars of the TCFD recommendations is describing the resilience of an organization’s strategy, taking into consideration different climate-related scenarios including a 2°C or lower scenario. We are pleased to report that in 2020, we developed the first iteration of a climate scenario tool to stress test our financial resiliency. Under these circumstances, a scenario was considered that involved four catastrophic events. The overall severity was calibrated using various techniques from internal and external models that simulates multiple types of perils, including floods. The four events consisted of: the reoccurrence of the 2013 Toronto flood, the 2013 Alberta flood, a 10-year occurrence severe convective storm, and a 20-year occurrence hurricane. The Alberta and Toronto flood impacts were inflated compared to 2013 costs to reflect an increase in exposure within the region, while the Actuaries Climate Index was used to adjust the severity of all four events to include the impact of climate change trends. The results of the stress testing of the climate-related scenario indicate that Co-operators General remained solvent and able to honour our financial obligations over the forecast period.
RISK MANAGEMENT
Climate-related issues have large-scale and broad implications across the financial services industry and permeate the insurance, investment, strategic, reputation and operational risks that influence our risk profile. We view climate change as a complex risk issue but one that is also an opportunity to achieve our mission of providing financial security for Canadians and their communities, today and in the future.
The ability to articulate what our risks are and how they are measured and managed is important for internal and external stakeholder understanding, as well as to ensure an accurate and consistent view of our risks through a variety of reporting and disclosure mechanisms. Our risk management practices are influenced by our co-operative identity; we apply a consultative and community-based approach that takes a comprehensive longer-term view of our business which seeks to incorporate sustainability principles as mandated by our S&CC and R&CC.
Successful application of our ERM Framework results in alignment between our articulated risk appetite, capital plans, and business strategies and operating plans. As risks and strategies evolve, our continuous cycle of risk identification, risk assessment, risk quantification and risk reporting ensures that we flex and adapt to the changes within our company and our operating environment. A comprehensive set of risk controls supports our overall ERM approach. ERM integration ensures that our ERM activities do not occur in isolation of business activities and are embedded in our risk culture.
To support our climate commitment, we have an integrated climate change strategy that focuses activity across three key areas:
Portfolio evaluation – testing the resilience of our insurance and investment portfolios and strategy. Mitigation – reducing the risks presented by climate change impacts. Adaptation – building the resilience of our operations, communities and ecosystems to climate change impacts.
Portfolio Evaluation
For our investment portfolio and assets under management through Addenda, all invested assets, as applicable, are guided by our Sustainable Investment Policy. This approach considers environmental, social and governance (ESG) matters in investment activities with the objective of enhancing long-term investment performance and is consistent with the framework provided by the United Nations Principles for Responsible Investment (UN-PRI).
We utilize company disclosures and third-party research to assess portfolio companies’ exposure to climate-related risks and risk management ability. If disclosures are lacking detail to make an adequate assessment, we engage to encourage further disclosure. Material climate-related risks and opportunities are incorporated into investment decisions, considering companies’ exposure to climate-related risks and how those risks are being managed.
Mitigation
The insurance industry will be impacted by climate change in ways that are complex and difficult to predict. We continue to dedicate resources to anticipate and prepare for the many impacts of climate change using various approaches. First, we preserve our capital while managing costs through reinsurance risk transfer mechanisms. Reinsurance protections are designed to cover for catastrophes within given exposure limits, thereby protecting our insurance entities from excessive losses from significant catastrophes. We note that Co-operators General is responsible for controlling its exposure to individual catastrophes and defining its reinsurance requirements based on our overarching risk appetite and capital positions. In addition, we minimize our credit risk exposure by spreading our program across many trusted partners and setting robust financial standards for eligibility. Furthermore, we have designed a robust and resilient capital management framework which allows us to maintain the strength of our balance sheet by ensuring climate-related impacts are accounted for.
38 Co-operators General Insurance Company | 2020 Annual Report
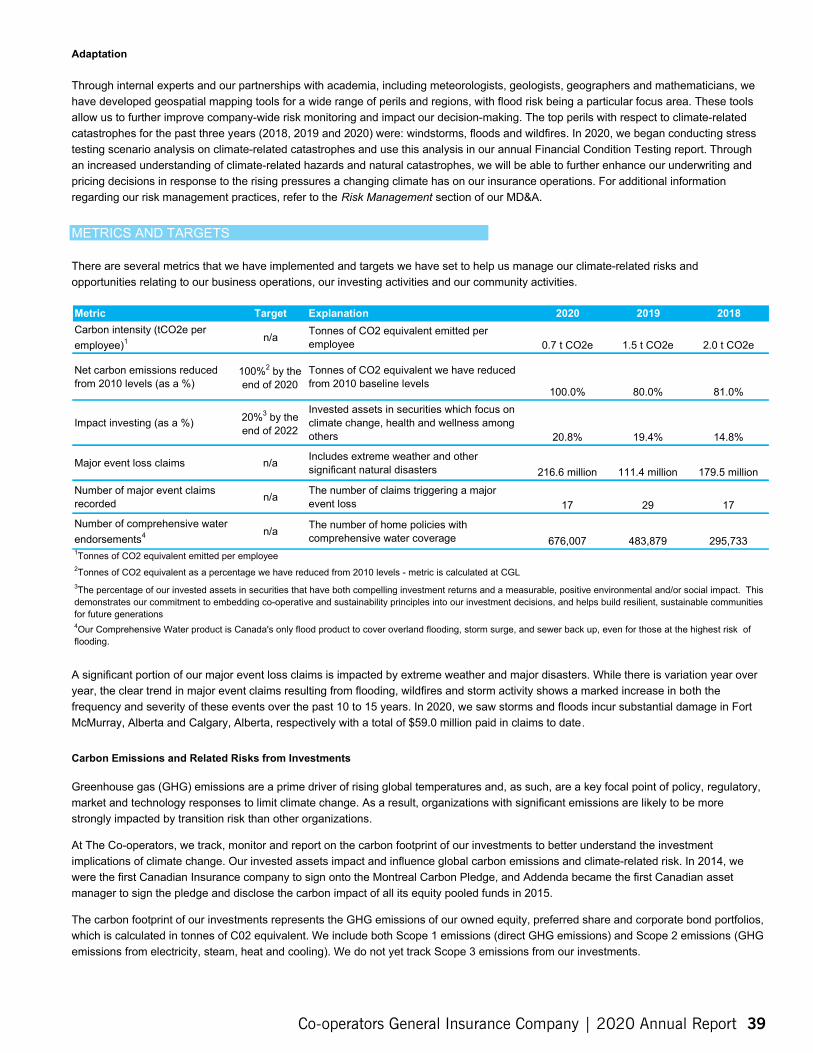
Adaptation
Through internal experts and our partnerships with academia, including meteorologists, geologists, geographers and mathematicians, we have developed geospatial mapping tools for a wide range of perils and regions, with flood risk being a particular focus area. These tools allow us to further improve company-wide risk monitoring and impact our decision-making. The top perils with respect to climate-related catastrophes for the past three years (2018, 2019 and 2020) were: windstorms, floods and wildfires. In 2020, we began conducting stress testing scenario analysis on climate-related catastrophes and use this analysis in our annual Financial Condition Testing report. Through an increased understanding of climate-related hazards and natural catastrophes, we will be able to further enhance our underwriting and pricing decisions in response to the rising pressures a changing climate has on our insurance operations. For additional information regarding our risk management practices, refer to the Risk Management section of our MD&A.
METRICS AND TARGETS
There are several metrics that we have implemented and targets we have set to help us manage our climate-related risks and opportunities relating to our business operations, our investing activities and our community activities.
Metric Target Explanation 2020 2019 2018 Carbon intensity (tCO2e per employee)1 n/a Tonnes of CO2 equivalent emitted per
employee 0.7 t CO2e 1.5 t CO2e 2.0 t CO2e
Net carbon emissions reduced from 2010 levels (as a %)
100%2 by the Tonnes of CO2 equivalent we have reduced from 201 0 baseline levels end of 2020
100.0% 80.0% 81.0%
Impact investing (as a %) 20% by the end of 2022
3 Invested assets in securities which focus on climate change, health and wellness among others 20.8% 19.4% 14.8%
Major event loss claims n/a Includes extreme weather and other significant natural disasters 216.6 million 111.4 million 179.5 million
Number of major event claims recorded n/a The number of claims triggering a major
event loss 17 29 17
Number of comprehensive water The number of home policies with n/a endorsements4 comprehensive water coverage 676,007 483,879 295,733 1Tonnes of CO2 equivalent emitted per employee 2Tonnes of CO2 equivalent as a percentage we have reduced from 2010 levels - metric is calculated at CGL 3The percentage of our invested assets in securities that have both compelling investment returns and a measurable, positive environmental and/or social impact. This demonstrates our commitment to embedding co-operative and sustainability principles into our investment decisions, and helps build resilient, sustainable communities for future generations 4Our Comprehensive Water product is Canada's only flood product to cover overland flooding, storm surge, and sewer back up, even for those at the highest risk of flooding.
A significant portion of our major event loss claims is impacted by extreme weather and major disasters. While there is variation year over year, the clear trend in major event claims resulting from flooding, wildfires and storm activity shows a marked increase in both the frequency and severity of these events over the past 10 to 15 years. In 2020, we saw storms and floods incur substantial damage in Fort McMurray, Alberta and Calgary, Alberta, respectively with a total of $59.0 million paid in claims to date.
Carbon Emissions and Related Risks from Investments
Greenhouse gas (GHG) emissions are a prime driver of rising global temperatures and, as such, are a key focal point of policy, regulatory, market and technology responses to limit climate change. As a result, organizations with significant emissions are likely to be more strongly impacted by transition risk than other organizations.
At The Co-operators, we track, monitor and report on the carbon footprint of our investments to better understand the investment implications of climate change. Our invested assets impact and influence global carbon emissions and climate-related risk. In 2014, we were the first Canadian Insurance company to sign onto the Montreal Carbon Pledge, and Addenda became the first Canadian asset manager to sign the pledge and disclose the carbon impact of all its equity pooled funds in 2015.
The carbon footprint of our investments represents the GHG emissions of our owned equity, preferred share and corporate bond portfolios, which is calculated in tonnes of C02 equivalent. We include both Scope 1 emissions (direct GHG emissions) and Scope 2 emissions (GHG emissions from electricity, steam, heat and cooling). We do not yet track Scope 3 emissions from our investments.
Co-operators General Insurance Company | 2020 Annual Report 39
Management’s Discussion & Analysis
In 2020, the Partnership for Carbon Accounting Financials (PCAF) released updated standards for GHG accounting and reporting for financial services companies. We used the PCAF methodology to calculate our financed emissions for 2020, and to recalculate our financed emissions for 2019 and 2018. Our Scope 1 and Scope 2 financed GHG emissions were 483,234 t C02e in 2020 (2019 – 404,548 t C02e; 2018 – 432,438 t C02e).
CONTROLS AND PROCEDURES
Disclosure controls and procedures
Management is responsible for designing and maintaining adequate disclosure controls and procedures to provide reasonable assurance that all relevant information is gathered and reported to senior management, including the President and CEO and the Executive Vice-President, Finance and CFO, on a timely basis so that appropriate decisions can be made regarding public disclosure.
Internal control over financial reporting
Management is responsible for designing and maintaining adequate internal control over financial reporting to provide reasonable assurance regarding the reliability of financial reporting and the preparation of financial statements for external purposes, in accordance with IFRS. However, due to inherent limitations, these controls may not prevent or detect all material misstatements on a timely basis. Projections of any control effectiveness evaluation to future periods are subject to the risk that the controls may become inadequate due to potential changes in conditions or possible deteriorations in the degree of compliance with policies or procedures.
A material change in internal control over financial reporting occurred during the third quarter of 2020. An upgrade to our finance system that supports our financial statement process was implemented with the participation and supervision of management. It is expected that our finance system controls will be further enhanced by this upgrade.
No other changes were made to our internal control over financial reporting during the first, second and fourth quarter of 2020 that have materially affected, or are reasonably likely to materially affect, our internal control over financial reporting.
As at December 31, 2020, an evaluation of the effectiveness of our disclosure controls and procedures and our internal control over financial reporting, as defined under National Instrument 52-109, was carried out with management’s participation and under the supervision of the CEO and CFO. Based on that evaluation, the CEO and CFO concluded that the design and operation of our disclosure controls and procedures and our internal control over financial reporting were effective.
ACCOUNTING MATTERS
SIGNIFICANT ACCOUNTING JUDGMENTS, ESTIMATES AND ASSUMPTIONS
The preparation of financial statements in accordance with IFRS requires management to make estimates and assumptions that affect the reported amounts of assets and liabilities and the disclosure of contingent assets and liabilities at the date of the financial statements and the reported amounts of revenues and expenses during the year. The following accounting estimates are considered particularly significant to understanding our financial performance. We have established detailed policies and control procedures that are intended to ensure these judgments are controlled, independently reviewed and consistently applied. Actual results could differ from these estimates and changes in estimates are recorded in the accounting period in which they are determined.
Use of estimates and judgements
Unpaid claims and adjustment expenses
We make estimates for the amount of unpaid claims and the timing of future claims payments based on assumptions that reflect the expected set of economic conditions and planned courses of action. Uncertainty exists on reported claims in that all information may not be available at the reporting date. In addition, claims may not be reported to us immediately, therefore estimates are made as to the value of claims incurred but not yet reported, a value which may take years to finally determine. In establishing the provision for unpaid claims, we also take into account estimated recoveries relating to salvage and subrogation. We acknowledge there is heightened uncertainty in the assumptions and estimates discussed above as they related to the ongoing COVID-19 pandemic.
We have included in our valuation of insurance contract liabilities the risks and data available on individual claims that have been impacted by COVID-19 and have updated the estimates and assumptions that are expected to be impacted by COVID-19. We continue to closely monitor and actively manage our insurance risk management policies as well as financial risk management policies as outlined in the Insurance Risks and Investment (Financial) Risks sections.
40 Co-operators General Insurance Company | 2020 Annual Report

The initial actuarial estimate of unpaid claims and adjustment expenses is an undiscounted amount. In order to determine the undiscounted liability, assumptions are developed considering the characteristics of the class of business, historical trends, the amount of data available on individual claims and any other pertinent factors. This estimate is then discounted to recognize the time value of money.
The interest rate used to discount the liabilities for CGIC, Sovereign and COSECO is 1.40% (2019 - 2.49%) and for CUMIS General is 1.20% (2019 – 2.33%) based on our projected rate of return on the investment portfolios supporting these liabilities. The discount rate is adjusted on a regular basis based on changes in the projected rate of return. If the discount rate increases, the result would be a reduction in total unpaid claims and adjustment expenses, which would have a positive impact on our underwriting income, with all else being equal. A decrease in the discount rate would have the opposite effect. A 1.0% increase in the discount rate would have an approximate impact on after-tax net income of $49.5 million (2019 - $41.7 million).
The discounted unpaid claims and adjustment expenses incorporates assumptions concerning future investment income, projected cash flows, and appropriate PFADs. As the estimates for unpaid claims are subject to measurement uncertainty and the variability could be material in the near term, we include PFADs in our assumptions for claims development, reinsurance recoveries and future investment income. The incorporation of PFADs is in accordance with accepted actuarial practice in order to ensure that the actuarial liabilities are adequate to pay future benefits. The selected PFADs are within the ranges recommended by the Canadian Institute of Actuaries.
In 2020, our discounted claims development experience was $11.3 million unfavourable, indicating that actual losses in the year were higher than anticipated based on the unpaid claims reserves. For more information refer to the Key Financial Measures (Non-IFRS) section of this document and also Note 7 of the consolidated financial statements for our claims development table and sensitivity analysis.
Advisor transition commissions
Co-operators General’s advisors are eligible for a transition commission payout upon a qualifying termination. The transition commission is based upon the number of years of service as an advisor and the average trailing commission volume of their book of business. Payments to terminated advisors are funded in part from reduced commission payments which are made to new advisors acquiring the book of business during the first 3 years of their agency relationship. Our accounting policy is to recognize the cost of transition commissions payable to active advisors over their estimated working lives and to recognize the benefit of reduced commissions payable to new advisors at the time when reduced commissions are paid. The obligation to active advisors is determined by accruing for the benefits earned to date on a present value basis assuming the cash flows associated with the earned benefits are paid out at the expected termination date. Significant assumptions used in the calculation of advisor transition commissions are the discount rate of 1.67% (2019 – 2.80%) and an average termination age of 56 (2019 - 56). A 1.0% decrease in the discount rate would increase the provision for advisor transition commissions by $11.3 million (2019 - $9.0 million) and decrease net income by $8.4 million (2019 - $6.5 million). A two-year decrease in the average termination age would increase the provision for advisor transition commissions by $3.0 million (2019 - $4.1 million) and decrease net income by $2.2 million (2019 - $3.0 million). Larger discount rate and termination age changes would have a corresponding impact to net income.
Retirement benefit obligations
Measurement uncertainty exists in valuing the components of retirement benefit obligations. Each assumption is determined by management, based on current market conditions and experiential information available at the time. Due to the long-term nature of the plans, the calculation of benefit expenses and obligations depends on various assumptions such as discount rates, medical and dental care cost trend rates, retirement age and mortality and termination rates. Actual experience that differs from the actuarial assumptions will affect the amounts recorded for the accrued benefit obligation and benefit expense. Assumed medical and dental care cost trend rates have a significant effect on the amount reported for the medical and dental benefit plans. A 1.0% increase in assumed medical and dental benefit cost trend rates would increase the accrued benefit obligation for 2020 by $31.3 million (2019 - $25.7 million). A 1.0% decrease in the discount rate would have the approximate effect of increasing the accrued benefit obligation for 2020 by $35.6 million (2019 - $29.1 million). Significant assumptions used in the calculation of employee future benefits are presented in Note 16 to the consolidated financial statements.
Co-operators General Insurance Company | 2020 Annual Report 41
Management’s Discussion & Analysis
Significant judgments
Impairment of investments
At a minimum, we review investments at the end of each quarter to identify and evaluate investments that show indication of possible impairment. An investment is considered impaired if there is objective evidence of impairment. Objective evidence of impairment includes a significant or prolonged decline in the fair value or net asset value below cost, or when a loss event that has a reliably estimable impact on future cash flows of the financial instrument has occurred. Such impairments are recorded as a charge to earnings in the period that the determination is made. The determination of what is significant or prolonged requires judgment. In making this judgment, we evaluate factors including, but not limited to: a decline in current financial position, defaults on debt obligations, failure to meet debt covenants, significant downgrades of credit status, and severity and/or duration of the decline in value. Previously impaired investments continue to be reviewed quarterly.
ACCOUNTING POLICIES
The consolidated financial statements have been prepared in accordance with IFRS. Co-operators General and certain of its subsidiaries are insurance companies and must also comply with the accounting and reporting requirements of regulators. The significant accounting policies used in the preparation of the consolidated financial statements are described in Note 2 of the consolidated financial statements. The accounting policies used are consistent with those applied in our audited consolidated financial statements for the year ended December 31, 2019.
There were no new accounting standards which had a significant impact on our consolidated financial statements for the year ended December 31, 2020. For a complete listing of new and amended accounting standards, refer to Note 3 of our consolidated financial statements.
FUTURE ACCOUNTING CHANGES
The IASB has continued to issue a number of amendments and new accounting pronouncements that will be applicable to Co-operators General. Included below are the details of select accounting standards issued but not yet applied. For a complete listing as well as their estimated impacted, refer to Note 4 of our consolidated financial statements.
IFRS 7 "Financial Instruments: Disclosures"
In December 2011, IFRS 7 was amended to require additional financial instrument disclosures upon transition from IAS 39 to IFRS 9. The amendments are effective upon adoption of IFRS 9, which is effective for annual periods beginning on or after January 1, 2018. However, in September 2016, IFRS 4 was amended to provide an option of a temporary exemption from applying IFRS 9 for entities whose predominant activity is issuing insurance contracts within the scope of IFRS 4. Therefore, qualifying entities will have the option to adopt IFRS 9 upon the adoption of IFRS 17. Co-operators General qualifies for a temporary exemption; thus, IFRS 7 is effective for annual periods beginning on or after January 1, 2023. We are currently evaluating the impact that this standard will have on our consolidated financial statements.
IFRS 9 "Financial Instruments"
IFRS 9 was issued in July 2014 and is intended to replace IAS 39 “Financial Instruments: Recognition and Measurement”. IFRS 9 is a three-part standard aimed at reducing complexity in reporting financial instruments. The project has been divided into three phases: Phase 1 Classification and measurement, Phase 2 Impairment and Phase 3 Hedge accounting. Phase 1 was issued in November 2009 and amended in October 2010. It requires financial assets to be recorded at amortized cost or fair value depending on the entity’s business model for managing the assets and their associated cash flow characteristics. All financial assets are to be measured at fair value on the balance sheet if they are not measured at amortized cost. At initial recognition, an entity may irrevocably designate a financial asset as measured at FVTPL or fair value through other comprehensive income if doing so eliminates or significantly reduces a measurement or recognition inconsistency that would otherwise arise from measuring assets or liabilities or recognizing the gains and losses on them on different bases. Phase 2 was completed in July 2014 and introduced a new expected loss impairment methodology that will result in more timely recognition of impairment losses. Phase 3 was completed in November 2013. This phase replaces the rule-based hedge accounting requirements in IAS 39 to more closely align the accounting with risk management activities.
The standard is effective for annual periods beginning on or after January 1, 2018. However, in September 2016, IFRS 4 was amended to provide an option of a temporary exemption from applying IFRS 9 for entities whose predominant activity is issuing insurance contracts within the scope of IFRS 4. Therefore, qualifying entities will have the option to adopt IFRS 9 upon the adoption of IFRS 17. Co-operators General qualifies for temporary exemption; thus, IFRS 9 is expected effective for annual periods beginning on or after January 1, 2023. We are currently evaluating the impact that this standard will have on our consolidated financial statements.
42 Co-operators General Insurance Company | 2020 Annual Report
IFRS 17 "Insurance Contracts"
IFRS 17 was issued in May 2017 and will replace IFRS 4 “Insurance Contracts”. The intent of the standard is to establish consistent recognition, measurement, presentation and disclosure principles to provide relevant and comparable reporting of insurance contracts across jurisdictions.
The standard requires entities to measure insurance contract liabilities as the risk-adjusted present value of the cash flows plus the contractual service margin, which represents the unearned profit the entity will recognize as future service is provided. This is referred to as the general model. Expedients are specified, provided the insurance contracts meet certain conditions. If, at initial recognition or subsequently, the contractual service margin becomes negative, the contract is considered onerous and the excess is recognized immediately in the consolidated statements of income. The standard also includes significant changes to the presentation and disclosure of insurance contracts within entities’ financial statements.
In June 2020, the IASB issued amendments to IFRS 17 which were designed to simplify certain requirements in the standard, make financial performance easier to explain and confirm the two-year deferral of the effective date of the standard including the temporary exemption of IFRS 9 for insurers; thus, IFRS 17 will be effective for annual reporting periods beginning on or after January 1, 2023. We are currently evaluating the impact that this standard will have on our consolidated financial statements.
IAS 1 “Presentation of Financial Statements”
Narrow-scope amendments to IAS 1 were issued in January 2020 to provide clarification over the classification of debt and other liabilities as current or non-current. The amendments aim to promote consistency in the application of the classification requirements of the standard by entities. Further, the amendments affect only the presentation of liabilities in the balance sheets; not the amount or timing of recognition of any asset, liability, income or expenses, or the information that entities disclose about those items. In July 2020, the IASB issued an amendment to defer the effective date to January 1, 2023. We are currently evaluating the impact that these amendments will have on our consolidated financial statements.
IAS 37 “Provisions, Contingent Liabilities and Contingent Assets”
In May 2020, the IASB issued an amendment to IAS 37 which clarifies which costs a company should include as the cost of fulfilling a contract when assessing whether a contract is onerous. The application date of the amendment is on or after the beginning of the first annual reporting period beginning on or after January 1, 2022, but early application is permitted. We are currently evaluating the impact that these amendments will have on our consolidated financial statements.
2018-2020 Annual Improvements Cycle
Annual Improvements 2018–2020 Cycle was issued in May 2020 by the IASB and included minor amendments to IFRS 9 "Financial Instruments" and IFRS 16 "Leases". The annual improvements process is used to make necessary but non-urgent changes to IFRS that are not included in other projects. The amendments issued are all effective for annual periods beginning on or after January 1, 2022. We are currently evaluating the impact that these amendments will have on our consolidated financial statements.
Co-operators General Insurance Company | 2020 Annual Report 43
Management’s Discussion & Analysis
GLOSSARY OF TERMS Certain terms used in this MD&A have the meanings set forth below that tend to be specific to the Canadian insurance industry or to Co-operators General.
Advisor - an insurance advisor who sells insurance products exclusively for CGIC.
Assume - reinsurance term to describe an insurer taking on a risk, for a premium, from the primary insurer, to cover all or part of a risk insured by the primary insurer who has then ceded the risk.
Broker - an intermediary who negotiates policies of insurance or reinsurance with insurers on behalf of the insured or reinsured, receiving a c ommission from the insurer or the reinsurer for placement and other services rendered.
Catastrophe reinsurance - a form of insurance, which subject to specified limits, indemnifies the ceding company for the amount of loss in excess of a specified retention amount with respect to an accumulation of losses resulting from a catastrophic event.
Cede - reinsurance term to describe a primary insurer purchasing insurance from a reinsurer who assumes the ri sk, to cover all or part of a risk insured by th e primary insurer.
Claim - the amount owed by an insurer or reinsurer pursuant to a policy of insurance or reinsurance arising from the loss relating to an insured event.
Claims development - a non-IFRS measure representing t he change in reserve balance on u npaid c laims through the process of adjudication from the initial estimate to the ultimate amount paid.
Claims experience - the realized claims loss record for a defined block of business.
Claims incurred - the aggregate monetary amount of all claims paid during an accounting period adjusted by the change in the provision for unpaid claims fo r that accounting period together with the related loss adjustment expenses, net of recoveries from reinsurers.
Combined ratio - a non-IFRS measure representing the percentage the claims and adjustment expenses plus the acquisition expenses and the administrative expenses are to net earned premium.
Direct written premium (DWP) - a non-IFRS measure representing the total amount of premiums for new and renewal policies written during a specified period.
Expense ratio - a non-IFRS measure representing the acquisition expenses plus administrative expenses to net earned premium, expressed as a percentage.
Frequency of claims - the ratio of the number of claims files opened in a perio d to the total number of policies in force.
General insurance - all types of insurance excluding life insurance and governmental insurance. Also known as property and casualty insurance.
Government automobile insurers - automobile insurers owned or controlled by the governments of the provinces of Quebec, Manitoba, Saskatchewan and British Columbia.
Incurred but not reported (IBNR) - the estimate of claims incurred but not yet reported by policyholders.
Industry pools - consist of the “residual market” as well as mandatory risk-sharing pools (RSP) in Alberta, Ontario, Quebec, New Brunswick and Nova Scotia. These pools, managed by the Facility Association (FA), except for the Quebec RSP, provide automobile insurance to individuals who are otherwise unable to purchase such coverage from private insurers acting voluntarily. All insurance companies share in the results of the pool according to their market share.
Liability insurance - insurance that serves to protect the insured from the financial consequences of damages claimed by third parties.
Line of business - the major product groupings offered to the public. Co-operators General’s major lines of business are: automobile, home, commercial, and farm.
Loss ratio - a non-IFRS measure representing the percentage incurred losses plus loss-adjustment expenses are to net earned premium; may be referred to as claims ratio.
Market yield adjustment (MYA) - a non-IFRS measure representing the impact of changes in the discount provision on claims liabilities, the provision for adverse deviation (PFADs) and other discounting assumptions based on the change in the market-based yield of the underlying assets.
Minimum Capital Test (MCT) - a non-IFRS measure representing t he minimum and supervisory target capital standards established by OSFI for property and casualty insurance c ompanies.
Net earned premium (NEP) - the net written premium during the period, plus the unearned premiums reserve at the beginning of the period, less the unearned premiums reserve at the end of the period, net of any reinsurance.
44 Co-operators General Insurance Company | 2020 Annual Report
OSFI - Office of the Superintendent of Financial Institutions (Canada), the government body responsible for the regulation and supervision of financial institutions and private pension plans subject to federal oversight.
Property and casualty (P&C) insurance - all types of insurance excluding life insurance and governmental insurance. Also known as general insurance.
Provision for adverse deviation (PFAD) - margins that are added to loss reserves to provide for adverse deviation from claims reserve estimates; this includes provisions covering claims development variability and risks associated with interest rate and reinsurance recoveries.
Unpaid claims and adjustment expenses - the amount provided as a liability to cover the estimated ultimate cost of settling claims, including claims incurred but not reported arising out of events, which have occurred by the end of an accounting period, less amounts paid with respect to those claims; also referred to as ‘provision for unpaid claims’ or ‘claims reserves.’
Reinstatement premium - the premium paid to restore the original reinsurance policy limit as a result of a reinsurance loss payment under a catastrophe cover. Reinstatement premiums are reported as a reduction in net earned premium.
Reinsurer - an insurer who assumes all or part of a risk originally assumed by a primary insurer.
Retention - has two meanings: (1) in respect of reinsurance, the amount of risk not ceded to reinsurers; (2) in respect to policies in force, the number of policyholders who renew for a subsequent term.
Return on equity (ROE) - a non-IFRS measure representing net income as a percentage of average opening and closing shareholders’ equity excluding AOCI.
Severity of claims - the average cost of each claim, based on the total claims cost and number of claims opened in a period.
Salvage and subrogation recoverable - Salvage recoverable is the estimated value of damaged property that may be retrieved, reconditioned, and sold to reduce the amount of an insured loss. Subrogation recoverable is the estimate of the amount the insurer will collect from a negligent third party or their insurer after assuming the insured’s legal right to collect damages.
Underwriting - the selection and assumption of risk for designated loss or damage arising from specified events by issuing a policy of insurance in respect thereof.
Underwriting gain or loss - a non-IFRS measure calculating the profit or loss from the activity of taking on insurance risks, excluding the impact of the MYA.
Co-operators General Insurance Company | 2020 Annual Report 45
RESPONSIBILITY FOR FINANCIAL REPORTING
Management and the appointed actuary
Management is responsible for the preparation of the accompanying consolidated financial statements and the accuracy, integri ty and objectivity of the information they contain. These consolidated financial statements have been prepared in accordance with International Financial Reporting Standards and the requirements of Canadian insurance regulators. The financial information presented elsewhere in the annual report is consistent with the consolidated financial statements. These consolidated financial statements, which necessarily include some amounts that are based on management’s best estimates and the opinion of the appointed actuary, have been prepared using careful judgment.
To assist management in the discharge of these responsibilities, Co-operators General Insurance Company and its wholly owned subsidiaries, collectively known as “the Company”, maintain a system of internal controls designed to provide reasonable assurance that assets are safeguarded; that only valid and authorized transactions are executed; and that accurate, timely and comprehensive financial information is prepared. These controls are supported by policies and procedures and the careful selection and training of qualified staff. Further, management has a process in place to evaluate disclosure controls and procedures and internal controls over financial reporting.
The appointed actuary, who is a member of management, is appointed by the Board of Directors pursuant to the Insurance Companies Act (Canada). Among the appointed actuary’s responsibilities is the requirement to carry out an annual valuation of the Company’s insurance contract liabilities in accordance with accepted actuarial practice and regulatory requirements for the purpose of reporting to shareholders and the Office of the Superintendent of Financial Institutions, Canada. Management is responsible for providing the appointed actuary the information necessary for completion of the annual valuations. The appointed actuary’s report follows.
Audit Committee of the Board of Directors
The Audit Committee of the Board of Directors, consisting entirely of non-executive, independent directors, is responsible for reviewing the accounting principles and practices employed by the Company and reviewing the Company’s annual consolidated financial statements prior to their submission to the Board of Directors for final approval. The Audit Committee meets no less than quarterly with the internal and external auditors, and management to review and discuss accounting, reporting and internal control matters. Both the internal and external auditors, and the appointed actuary have full and unrestricted access to the Audit Committee, with and without the presence of management. The Audit Committee is responsible for recommending to the Board of Directors the appointment of the Company’s external auditors, the approval of their remuneration and the terms of their engagement.
The consolidated financial statements have been examined independently by PricewaterhouseCoopers LLP, on behalf of the Company’s shareholders. The Independent Auditor’s Report is presented below and outlines the scope of their examination and expresses their opinion on the consolidated financial statements of the Company.
(Signed) (Signed)
Robert Wesseling Karen Higgins President and Chief Executive Officer Executive Vice-President, Finance
and Chief Financial Officer
February 12, 2021
46 Co-operators General Insurance Company | 2020 Annual Report
Independent auditor’s report
To the Shareholders of Co-operators General Insurance Company
Our opinion
In our opinion, the accompanying consolidated financial statements present fairly, in all material respects, the financial position of Co-operators General Insurance Company and its subsidiaries (together, the Company) as at December 31, 2020 and 2019, and its financial performance and its cash flows for the years then ended in accordance with International Financial Reporting Standards (IFRS).
What we have audited The Company’s consolidated financial statements comprise:
the consolidated balance sheets as at December 31, 2020 and 2019;
the consolidated statements of changes in shareholders’ equity for the years then ended;
the consolidated statements of income for the years then ended;
the consolidated statements of comprehensive income for the years then ended;
the consolidated statements of cash flows for the years then ended; and
the notes to the consolidated financial statements, which include significant accounting policies and other explanatory information.
Basis for opinion
We conducted our audit in accordance with Canadian generally accepted auditing standards. Our responsibilities under those standards are further described in the Auditor’s responsibilities for the audit of the consolidated financial statements section of our report.
We believe that the audit evidence we have obtained is sufficient and appropriate to provide a basis for our opinion.
Independence We are independent of the Company in accordance with the ethical requirements that are relevant to our audit of the consolidated financial statements in Canada. We have fulfilled our other ethical responsibilities in accordance with these requirements.
Key audit matters
Key audit matters are those matters that, in our professional judgment, were of most significance in our audit of the consolidated financial statements for the year ended December 31, 2020. These matters were
PricewaterhouseCoopers LLP PwC Tower, 18 York Street, Suite 2600, Toronto, Ontario, Canada M5J 0B2 T: +1 416 863 1133, F: +1 416 365 8215
“PwC” refers to PricewaterhouseCoopers LLP, an Ontario limited liability partnership.
Co-operators General Insurance Company | 2020 Annual Report 47
addressed in the context of our audit of the consolidated financial statements as a whole, and in forming our opinion thereon, and we do not provide a separate opinion on these matters.
Key audit matter How our audit addressed the key audit matter
Valuation of the incurred but not yet reported Our approach to addressing the matter involved the (IBNR) claims provision following procedures, amongst others:
Refer to note 2 – Summary of significant accounting ● Tested the operating effectiveness of internal policies, note 7 – Insurance risk management and controls over the accuracy and completeness of note 8 – Insurance contracts liabilities to the data. consolidated financial statements
● Tested the completeness and accuracy of management’s data used in actuarial claims projections techniques.
Insurance contract liabilities of $5,417,237 as of December 31, 2020 includes an IBNR claims provision, which is intended to cover future development on reported unpaid claims and account for claims that have occurred but are not yet reported. The IBNR claims provision is estimated by management’s actuarial specialists using a range of accepted actuarial claims projection techniques. These projection techniques require management to develop significant assumptions for expected loss ratios, loss development patterns, claims frequency and severity trends, exposure, expected reinsurance recoveries and trends. There is an increased level of uncertainty related to future development on reported and not yet reported claims as all information may not be available at the valuation date. Claims that have occurred may not be reported to the Company immediately; therefore, estimates are made as to t heir value, an amount which may take years to finally determine.
● For selected lines of business, professionals with specialized skill and knowledge assisted us in assessing significant assumptions related to IBNR for reasonableness and independently developed an estimate of the provision. Developing this independent estimate involved:
o Selecting accepted actuarial claims projection techniques.
o Selecting assumptions using management’s data.
● For the remaining lines of business, professionals with specialized skill and knowledge assisted us in:
o Evaluating the appropriateness of the actuarial claims projection techniques.
o Evaluating the reasonableness of significant assumptions related to IBNR.
We considered this a key audit matter due to the significant judgment made by management in developing their estimate. This in turn led to a high degree of auditor judgment and effort in evaluating audit evidence relating to the actuarial claims projection techniques and significant assumptions. Professionals with specialized skill and knowledge assisted us in performing our procedures.
48 Co-operators General Insurance Company | 2020 Annual Report
Other information
Management is responsible for the other information. The other information comprises the Management’s Discussion and Analysis and the information, other than the consolidated financial statements and our auditor’s report thereon, included in the Annual Report.
Our opinion on the consolidated financial statements does not cover the other information and we do not express any form of assurance conclusion thereon.
In connection with our audit of the consolidated financial statements, our responsibility is to read the other information identified above and, in doing so, consider whether the other information is materially inconsistent with the consolidated financial statements or our knowledge obtained in the audit, or otherwise appears to be materially misstated.
If, based on the work we have performed, we conclude that there is a material misstatement of this other information, we are required to report that fact. We have nothing to report in this regard.
Responsibilities of management and those charged with governance for the consolidated financial statements
Management is responsible for the preparation and fair presentation of the consolidated financial statements in accordance with IFRS, and for such internal control as management determines is necessary to enable the preparation of consolidated financial statements that are free from material misstatement, whether due to fraud or error.
In preparing the consolidated financial statements, management is responsible for assessing the Company’s ability to continue as a going concern, disclosing, as applicable, matters related to going concern and using the going concern basis of accounting unless management either intends to liquidate the Company or to cease operations, or has no realistic alternative but to do so.
Those charged with governance are responsible for overseeing the Company’s financial reporting process.
Auditor’s responsibilities for the audit of the consolidated financial statements
Our objectives are to obtain reasonable assurance about whether the consolidated financial statements as a whole are free from material misstatement, whether due to fraud or error, and to issue an auditor’s report that includes our opinion. Reasonable assurance is a high level of assurance, but is not a guarantee that an audit conducted in accordance with Canadian generally accepted auditing standards will always detect a material misstatement when it exists. Misstatements can arise from fraud or error and are considered material if, individually or in the aggregate, they could reasonably be expected to influence the economic decisions of users taken on the basis of these consolidated financial statements.
Co-operators General Insurance Company | 2020 Annual Report 49
As part of an audit in accordance with Canadian generally accepted auditing standards, we exercise professional judgment and maintain professional skepticism throughout the audit. We also:
Identify and assess the risks of material misstatement of the consolidated financial statements, whether due to fraud or error, design and perform audit procedures responsive to those risks, and obtain audit evidence that is sufficient and appropriate to provide a basis for our opinion. The risk of not detecting a material misstatement resulting from fraud is higher than for one resulting from error, as fraud may involve collusion, forgery, intentional omissions, misrepresentations, or the override of internal control.
Obtain an understanding of internal control relevant to the audit in order to design audit procedures that are appropriate in the circumstances, but not for the purpose of expressing an opinion on the effectiveness of the Company’s internal control.
Evaluate the appropriateness of accounting policies used and the reasonableness of accounting estimates and related disclosures made by management.
Conclude on the appropriateness of management’s use of the going concern basis of accounting and, based on the audit evidence obtained, whether a material uncertainty exists related to events or conditions that may cast significant doubt on the Company’s ability to continue as a going concern. If we conclude that a material uncertainty exists, we are required to draw attention in our auditor’s report to the related disclosures in the consolidated financial statements or, if such disclosures are inadequate, to modify our opinion. Our conclusions are based on the audit evidence obtained up to the date of our auditor’s report. However, future events or conditions may cause the Company to cease to continue as a going concern.
Evaluate the overall presentation, structure and content of the consolidated financial statements, including the disclosures, and whether the consolidated financial statements represent the underlying transactions and events in a manner that achieves fair presentation.
Obtain sufficient appropriate audit evidence regarding the financial information of the entities or business activities within the Company to express an opinion on the consolidated financial statements. We are responsible for the direction, supervision and performance of the group audit. We remain solely responsible for our audit opinion.
We communicate with those charged with governance regarding, among other matters, the planned scope and timing of the audit and significant audit findings, including any significant deficiencies in internal control that we identify during our audit.
We also provide those charged with governance with a statement that we have complied with relevant ethical requirements regarding independence, and to communicate with them all relationships and other matters that may reasonably be thought to bear on our independence, and where applicable, related safeguards.
50 Co-operators General Insurance Company | 2020 Annual Report
From the matters communicated with those charged with governance, we determine those matters that were of most significance in the audit of the consolidated financial statements of the current period and are therefore the key audit matters. We describe these matters in our auditor’s report unless law or regulation precludes public disclosure about the matter or when, in extremely rare circumstances, we determine that a matter should not be communicated in our report because the adverse consequences of doing so would reasonably be expected to outweigh the public interest benefits of such communication.
The engagement partner on the audit resulting in this independent auditor’s report is Akif Siddiqui.
/s/PricewaterhouseCoopers LLP
Chartered Professional Accountants, Licensed Public Accountants
Toronto, Ontario February 12, 2021
Co-operators General Insurance Company | 2020 Annual Report 51
APPOINTED ACTUARY’S REPORT
To the Directors and Shareholders of Co-operators General Insurance Company:
I have valued the policy liabilities of Co-operators General Insurance Company for its consolidated balance sheet as at December 31, 2020 and their change in the consolidated statement of income for the year then ended in accordance with accepted actuarial practice in Canada, including selection of appropriate assumptions and methods.
In my opinion, the amount of policy liabilities makes appropriate provision for all policy obligations and the financial statements fairly present the results of the valuation.
(Signed)
Apundeep Lamba Fellow, Canadian Institute of Actuaries
Guelph, Ontario February 12, 2021
52 Co-operators General Insurance Company | 2020 Annual Report
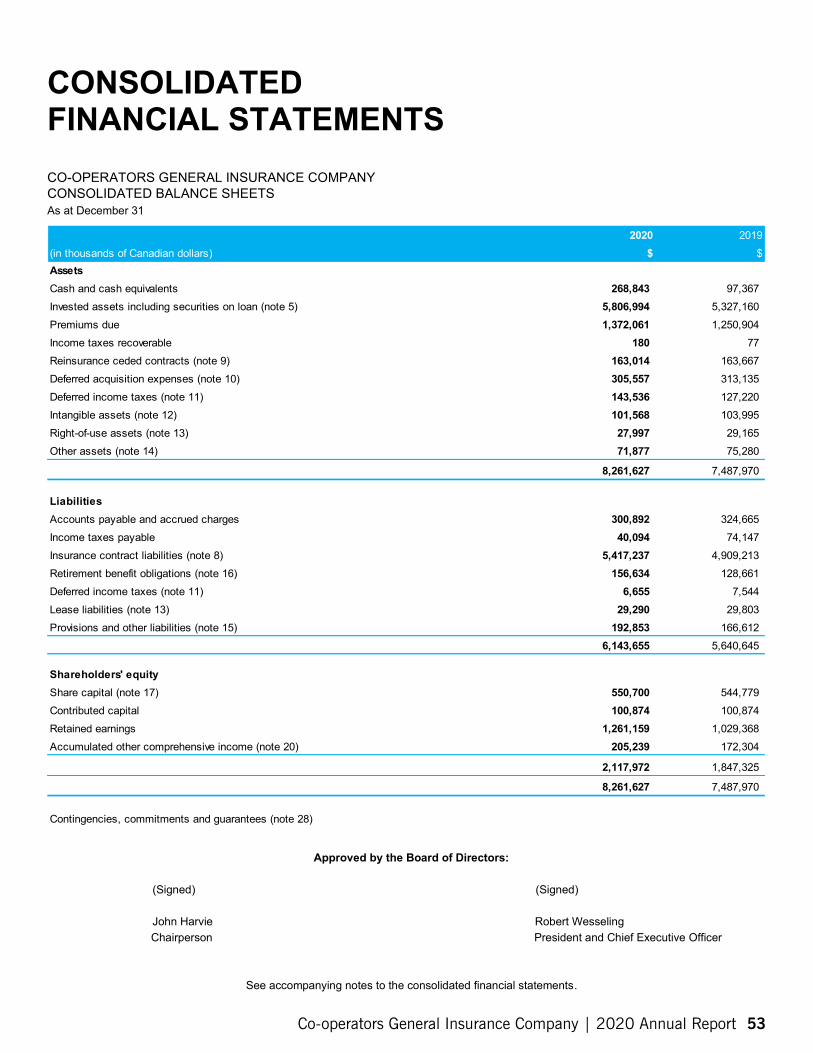
Chairperson President and Chief Executive Officer
CONSOLIDATED FINANCIAL STATEMENTS CO-OPERATORS GENERAL INSURANCE COMPANY CONSOLIDATED BALANCE SHEETS As at December 31
2020 2019 (in thousands of Canadian dollars) $ $ Assets Cash and cash equivalents 268,843 97,367 Invested assets including securities on loan (note 5) 5,806,994 5,327,160 Premiums due 1,372,061 1,250,904 Income taxes recoverable 180 77 Reinsurance ceded contracts (note 9) 163,014 163,667 Deferred acquisition expenses (note 10) 305,557 313,135 Deferred income taxes (note 11) 143,536 127,220 Intangible assets (note 12) 101,568 103,995 Right-of-use assets (note 13) 27,997 29,165 Other assets (note 14) 71,877 75,280
8,261,627 7,487,970
Liabilities Accounts payable and accrued charges 300,892 324,665 Income taxes payable 40,094 74,147 Insurance contract liabilities (note 8) 5,417,237 4,909,213 Retirement benefit obligations (note 16) 156,634 128,661 Deferred income taxes (note 11) 6,655 7,544 Lease liabilities (note 13) 29,290 29,803 Provisions and other liabilities (note 15) 192,853 166,612
6,143,655 5,640,645
Shareholders' equity Share capital (note 17) 550,700 544,779 Contributed capital 100,874 100,874 Retained earnings 1,261,159 1,029,368 Accumulated other comprehensive income (note 20) 205,239 172,304
2,117,972 1,847,325
8,261,627 7,487,970
Contingencies, commitments and guarantees (note 28)
Approved by the Board of Directors:
(Signed) (Signed)
John Harvie Robert Wesseling
See accompanying notes to the consolidated financial statements.
Co-operators General Insurance Company | 2020 Annual Report 53
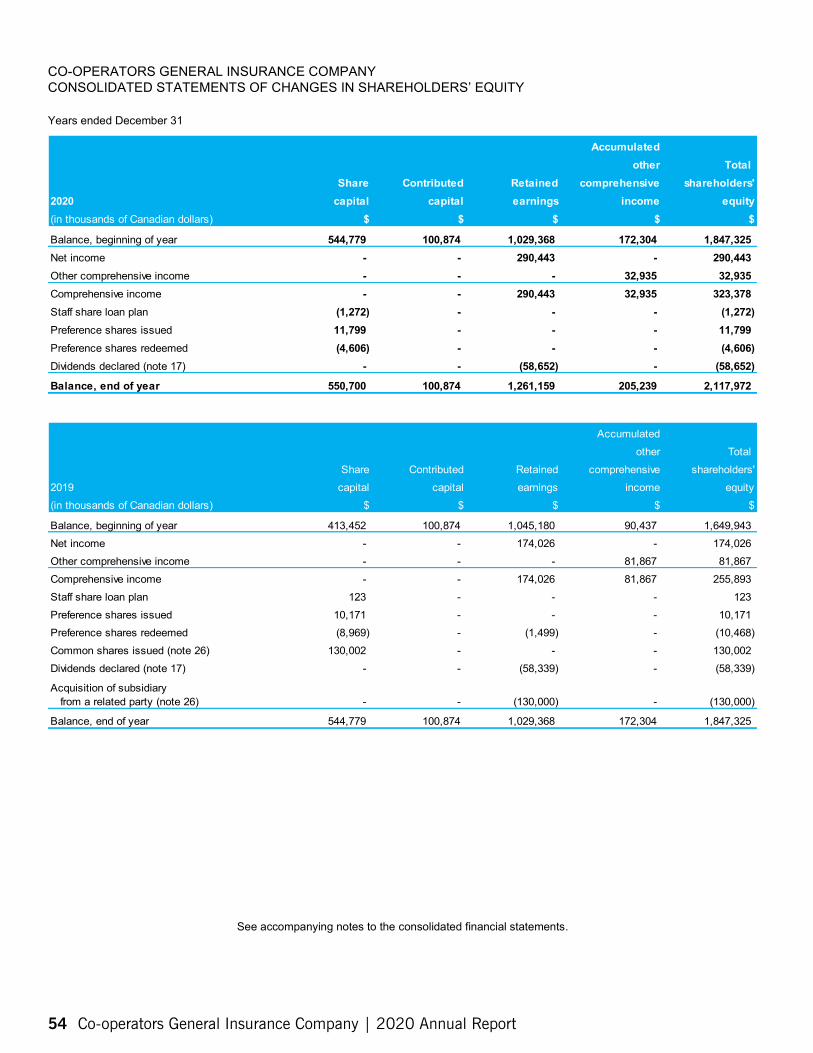
CO-OPERATORS GENERAL INSURANCE COMPANY CONSOLIDATED STATEMENTS OF CHANGES IN SHAREHOLDERS’ EQUITY
Years ended December 31
Accumulated other Total
Share Contributed Retained comprehensive shareholders' 2020 capital capital earnings income equity (in thousands of Canadian dollars) $ $ $ $ $
Balance, beginning of year 544,779 100,874 1,029,368 172,304 1,847,325 Net income - - 290,443 - 290,443 Other comprehensive income - - - 32,935 32,935 Comprehensive income - - 290,443 32,935 323,378 Staff share loan plan (1,272) - - - (1,272) Preference shares issued 11,799 - - - 11,799 Preference shares redeemed (4,606) - - - (4,606) Dividends declared (note 17) - - (58,652) - (58,652)
Balance, end of year 550,700 100,874 1,261,159 205,239 2,117,972
Accumulated other Total
Share Contributed Retained comprehensive shareholders' 2019 capital capital earnings income equity (in thousands of Canadian dollars) $ $ $ $ $
Balance, beginning of year 413,452 100,874 1,045,180 90,437 1,649,943 Net income - - 174,026 - 174,026 Other comprehensive income - - - 81,867 81,867 Comprehensive income - - 174,026 81,867 255,893 Staff share loan plan 123 - - - 123 Preference shares issued 10,171 - - - 10,171 Preference shares redeemed (8,969) - (1,499) - (10,468) Common shares issued (note 26) 130,002 - - - 130,002 Dividends declared (note 17) - - (58,339) - (58,339)
Acquisition of subsidiary from a related party (note 26) - - (130,000) - (130,000)
Balance, end of year 544,779 100,874 1,029,368 172,304 1,847,325
See accompanying notes to the consolidated financial statements.
54 Co-operators General Insurance Company | 2020 Annual Report
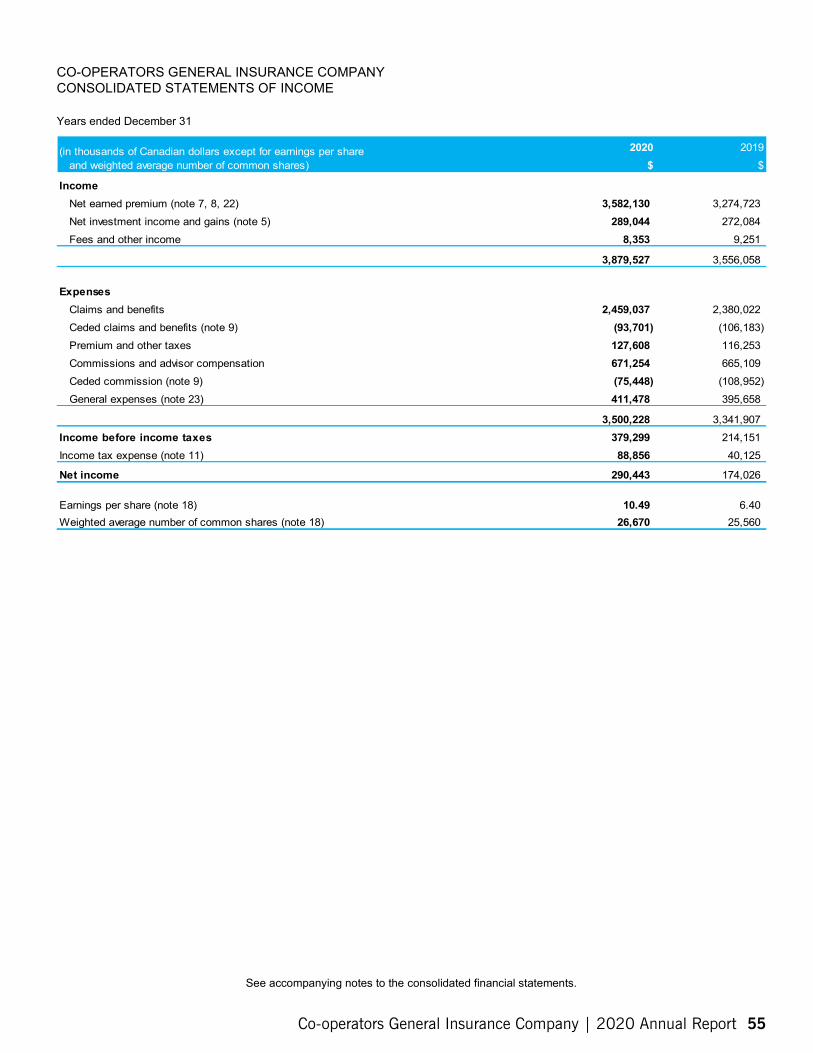
CO-OPERATORS GENERAL INSURANCE COMPANY CONSOLIDATED STATEMENTS OF INCOME
Years ended December 31
(in thousands of Canadian dollars except for earnings per share 2020 2019 and weighted average number of common shares) $ $
Income Net earned premium (note 7, 8, 22) 3,582,130 3,274,723 Net investment income and gains (note 5) 289,044 272,084 Fees and other income 8,353 9,251
3,879,527 3,556,058
Expenses Claims and benefits 2,459,037 2,380,022 Ceded claims and benefits (note 9) (93,701) (106,183) Premium and other taxes 127,608 116,253 Commissions and advisor compensation 671,254 665,109 Ceded commission (note 9) (75,448) (108,952) General expenses (note 23) 411,478 395,658
3,500,228 3,341,907 Income before income taxes 379,299 214,151 Income tax expense (note 11) 88,856 40,125
Net income 290,443 174,026
Earnings per share (note 18) 10.49 6.40 Weighted average number of common shares (note 18) 26,670 25,560
See accompanying notes to the consolidated financial statements.
Co-operators General Insurance Company | 2020 Annual Report 55
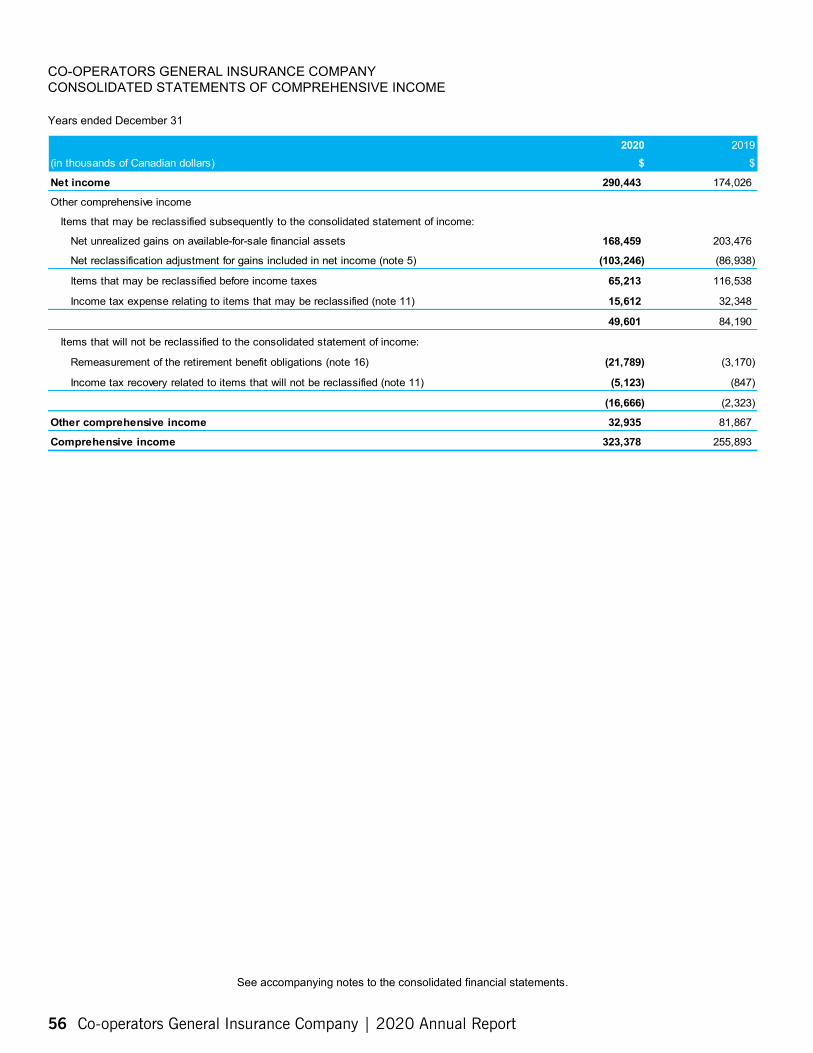
CO-OPERATORS GENERAL INSURANCE COMPANY CONSOLIDATED STATEMENTS OF COMPREHENSIVE INCOME
Years ended December 31
2020 $
2019 $ (in thousands of Canadian dollars)
Net income 290,443 174,026
Other comprehensive income
Items that may be reclassified subsequently to the consolidated statement of income:
Net unrealized gains on available-for-sale financial assets 168,459 203,476
Net reclassification adjustment for gains included in net income (note 5) (103,246) (86,938)
Items that may be reclassified before income taxes 65,213 116,538
Income tax expense relating to items that may be reclassified (note 11) 15,612 32,348
49,601 84,190
Items that will not be reclassified to the consolidated statement of income:
Remeasurement of the retirement benefit obligations (note 16) (21,789) (3,170)
Income tax recovery related to items that will not be reclassified (note 11) (5,123) (847)
(16,666) (2,323)
Other comprehensive income 32,935 81,867
Comprehensive income 323,378 255,893
See accompanying notes to the consolidated financial statements.
56 Co-operators General Insurance Company | 2020 Annual Report
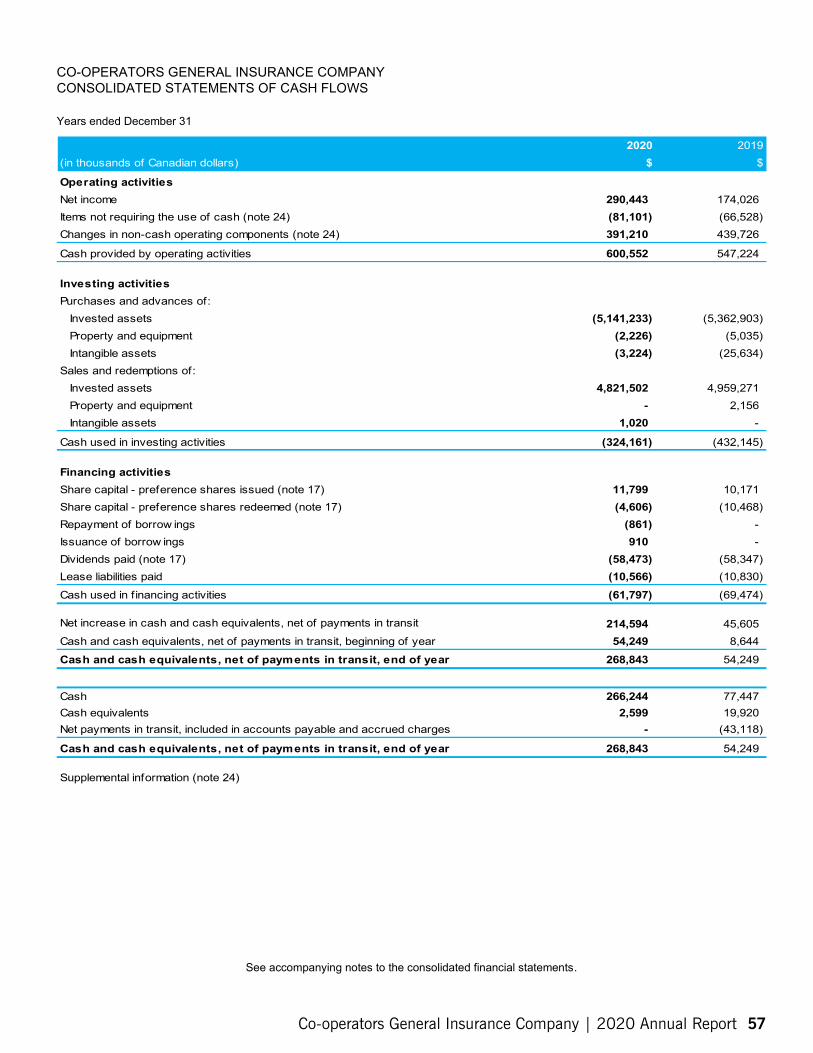
CO-OPERATORS GENERAL INSURANCE COMPANY CONSOLIDATED STATEMENTS OF CASH FLOWS
Years ended December 31
2020 $
2019 $ (in thousands of Canadian dollars)
Operating activities Net income 290,443 174,026 Items not requiring the use of cash (note 24) (81,101) (66,528) Changes in non-cash operating components (note 24) 391,210 439,726
Cash provided by operating activities 600,552 547,224
Investing activities Purchases and advances of:
Invested assets (5,141,233) (5,362,903) Property and equipment (2,226) (5,035) Intangible assets (3,224) (25,634)
Sales and redemptions of: Invested assets 4,821,502 4,959,271 Property and equipment - 2,156 Intangible assets 1,020 -
Cash used in investing activities (324,161) (432,145)
Financing activities Share capital - preference shares issued (note 17) 11,799 10,171 Share capital - preference shares redeemed (note 17) (4,606) (10,468) Repayment of borrow ings (861) -Issuance of borrow ings 910 -Dividends paid (note 17) (58,473) (58,347) Lease liabilities paid (10,566) (10,830)
Cash used in f inancing activities (61,797) (69,474)
Net increase in cash and cash equivalents, net of payments in transit 214,594 45,605 Cash and cash equivalents, net of payments in transit, beginning of year 54,249 8,644
Cash and cash equivalents, net of payments in transit, end of year 268,843 54,249
Cash 266,244 77,447 Cash equivalents 2,599 19,920 Net payments in transit, included in accounts payable and accrued charges - (43,118)
Cash and cash equivalents, net of payments in transit, end of year 268,843 54,249
Supplemental information (note 24)
See accompanying notes to the consolidated financial statements.
Co-operators General Insurance Company | 2020 Annual Report 57
(Amounts in thousands of Canadian dollars, except for per share amounts and where otherwise noted)
NOTES TO THE CONSOLIDATED FINANCIAL STATEMENTS
1. Nature of operations and significant changes in the current reporting period
Unless noted or the context indicates otherwise, in these notes “Company” refers to the Consolidated Co-operators General Insurance Company. CGIC refers to the Non-Consolidated Co-operators General Insurance Company.
The Company is comprised of CGIC and its wholly owned subsidiaries: The Sovereign General Insurance Company (Sovereign), COSECO Insurance Company (COSECO), CUMIS General Insurance Company (CUMIS General), Co-operators Investment Limited Partnership (CILP), Co-operators Strategic Growth Corporation (CSGC) and Co-operators Insurance Agencies Limited (CIAL). 100% of the voting rights attached to all the outstanding voting shares or partnership interests of each of Sovereign, COSECO, CUMIS General, CILP, CSGC and CIAL are held by CGIC.
The registered office of the Company is 130 Macdonell Street, Guelph, Ontario. The Company is domiciled in Canada and is incorporated under the Insurance Companies Act (Canada). These consolidated financial statements of the Company for the year ended December 31, 2020 were authorized for issue by the Board of Directors on February 12, 2021.
CGIC and certain of its subsidiaries are licensed to write insurance in all provinces and territories in Canada. With the exception of CUMIS General, CGIC and certain of its subsidiaries are licensed to write all classes of insurance, other than life. CUMIS General is licensed to write property and casualty as well as accident and sickness insurance. AZGA Service Canada Inc. (AZGA Canada), an associate of Co-operators Life Insurance Company (CLIC), a company under common control, acts as Managing General Underwriter (MGU) with respect to the travel insurance underwritten by CUMIS General. CGIC and certain of its subsidiaries are regulated by the federal Insurance Companies Act and the various provincial insurance acts. The Company must comply with the accounting and reporting requirements of its regulator the Office of the Superintendent of Financial Institutions, Canada (OSFI).
The Company’s common shares are 100% owned by Co-operators Financial Services Limited (CFSL), which in turn is owned 100% by The Co-operators Group Limited (CGL). The Class E preference shares, Series C are traded on the Toronto Stock Exchange under the symbol CCS.PR.C.
An outbreak of a novel strain of coronavirus, identified as “COVID-19”, was declared a global pandemic by the World Health Organization on March 11, 2020. In response, many countries have required entities to limit or suspend business operations and implemented travel restrictions and quarantine measures. These measures have disrupted the activities of many entities and has led to significant volatility in the global markets. The Company has provided additional disclosures in the notes to these consolidated financial statements where the impact of COVID-19 on the amounts presented is significant. While the Company’s operations are considered to be an essential service under the laws of the provinces in which it operates, the Company continues to monitor and actively manage the developing impacts from COVID-19, including but not limited to, the potential future effects on its invested asset portfolio and its insurance contract liabilities, and will continue to assess impacts to its operations, going concern assumption, and the value of assets and liabilities reported in these statements.
2. Summary of significant accounting policies
Basis of preparation and statement of compliance
These consolidated financial statements have been prepared in accordance with International Financial Reporting Standards (IFRS). References to IFRS are based on Canadian Generally Accepted Accounting Principles for publicly accountable enterprises as set out in Part 1 of the Chartered Professional Accountants of Canada (CPA) Handbook - Accounting. Part 1 of the CPA Handbook incorporates IFRS and International Accounting Standards (IAS) as issued by the International Accounting Standards Board (IASB).
The consolidated balance sheet is presented on a non-classified basis. Assets expected to be realized and liabilities expected to be settled within the Company’s normal operating cycle of one year are typically considered to be current. Certain balances are comprised of both current and non-current amounts. The current and non-current portions of such balances are disclosed, where applicable, throughout the notes to the consolidated financial statements.
58 Co-operators General Insurance Company | 2020 Annual Report
(Amounts in thousands of Canadian dollars, except for per share amounts and where otherwise noted)
Basis of measurement
These consolidated financial statements have been prepared under the historical cost convention excluding certain financial instruments and insurance contract liabilities whose basis of measurement is disclosed in the following accounting policies.
Insurance contracts
Product classification
Insurance contracts are those contracts that transfer significant insurance risk at the inception of the contract. Insurance risk is transferred when the Company agrees to compensate a policyholder if a specified uncertain future event, other than a change in a financial variable, adversely affects the policyholder. Any contracts, including reinsurance contracts that do not meet the definition of an insurance contract under IFRS are classified as investment contracts, or service contracts, as appropriate. Once a contract has been classified as an insurance contract, it remains an insurance contract for the remainder of its lifetime until all rights and obligations are extinguished or expire. The Company does not have investment contracts.
Revenue recognition
Premiums written for property and casualty insurance contracts are deferred as unearned premiums and recognized in the consolidated statements of income over the terms of the underlying policies. Premiums written are gross of any premium taxes and commissions.
Fees and other income include commission revenue from the sale of insurance policies.
Insurance contract liabilities
Unearned premiums represent the portion of the premiums written relating to the period of insurance coverage subsequent to the consolidated balance sheet date.
The unpaid claims and adjustment expenses provision presented on a gross basis represents the estimated amount required to settle all reported claims and the estimated amount to settle all incurred but not reported (IBNR) claims to the end of the year. The estimated amount of IBNR claims is intended to cover future development on reported claims as well as claims that have occurred but are yet to be reported. These estimates are determined using the best information available for claims settlement patterns, inflation, expenses, changes in the legal and regulatory environment and other matters. The provision reflects the time value of money and is discounted based on the projected market yield of the assets backing the claims liability.
Anticipated recoveries of amounts relating to reported and unreported claims for salvage and subrogation, net of any required provision for impairment, are included as an allowance in the measurement of the claims provision. Estimation of the amount of these recoveries is based on principles consistent with the Company’s method for establishing the related liability.
Differences between the estimated cost and subsequent settlement of claims are recognized in the consolidated statements of income in the period in which they are settled or in which the provisions for claims outstanding are re-estimated.
In the normal course of claims adjudication, the Company settles certain obligations to claimants through the purchase of annuities from third party life insurance companies under structured settlement arrangements (structured settlements). In accordance with OSFI Guideline D-5, these contracts are categorized as either Type 1 or Type 2 based on the characteristics of the claim settlement. When the Company does not retain a reversionary interest under the contractual arrangement to any current or future benefits of the annuity, and the Company has obtained a legal release of the obligation from the claimant, it will be classified as a Type 1 structured settlement. For such contracts, any gain or loss arising on the purchase of an annuity is recognized in the consolidated statements of income at the date of purchase and the related claims liabilities are derecognized. All other structured settlements that do not meet these criteria are classified as Type 2, with the Company recognizing the annuity contract in other investments within invested assets. A corresponding liability representing the outstanding obligation to the claimant is recognized in insurance contract liabilities.
The Company operates an experienced rated refund pool as part of its fidelity program. This program provides a mechanism for the accumulation and redistribution of funds if favourable experience exists within the program over a period of years. Refunds are determined based on the adequacy of the pool and the results of the fidelity operation.
Co-operators General Insurance Company | 2020 Annual Report 59
(Amounts in thousands of Canadian dollars, except for per share amounts and where otherwise noted)
Liability adequacy test
At each consolidated balance sheet date, an assessment is made of whether the insurance contract liabilities are adequate, using current estimates of future cash flows. If that assessment shows that the carrying amount of the liabilities is insufficient in light of the estimated future cash flows, the premium deficiency is recognized in the consolidated statements of income. An additional liability is set-up if a reduction in deferred acquisition expenses is insufficient.
Premiums due
Premiums due represent receivables that are recognized when owed pursuant to the terms of the related insurance contract. Premiums due are measured on initial recognition at the fair value of the consideration receivable and are recorded on the consolidated balance sheets net of any impairment losses. Premiums due are classified as loans and receivables.
Acquisition expenses
Acquisition expenses are comprised of commissions and premium taxes, which relate directly to the acquisition of premiums. These expenses are deferred and amortized over the terms of the related policies to the extent that they are considered to be recoverable from unearned premiums, after considering the anticipated claims, expenses and investment income related to the unearned premiums. If a premium deficiency arises, any deferred acquisition expenses would be written off first, then a liability would be recorded on the consolidated balance sheets for any remainder.
Reinsurance
Premiums payable in respect of reinsurance ceded are recognized over the period in which the reinsurance contract is entered into and are based on the underlying insurance contracts to which they relate. Ceded premiums are expensed in the consolidated statements of income on a pro-rata basis over the term of the reinsurance contract.
Reinsurance ceded assets and liabilities are recognized and together reflect the net amount estimated to be recoverable under the Company’s reinsurance contracts in respect of outstanding claims reported within insurance contract liabilities. The amount recoverable is initially valued on the same basis as the underlying insurance contract. The amount recoverable is reduced when events or conditions arise after the initial recognition of the asset that provide objective evidence that the Company may not receive all amounts due under the contract.
Reinsurance commissions are recognized in the consolidated statements of income over the term of the reinsurance contract using principles consistent with the Company’s method of recording acquisition expenses. The Company has in place certain reinsurance contracts in which the commission has a floor and a ceiling based on the loss experience on the business ceded under the contract. Commissions are estimated based on the experience of these contracts.
The Company also assumes reinsurance risk in the normal course of business. Premiums and claims on assumed reinsurance are recognized as revenue or expenses in the same manner as they would be if the reinsurance contract was considered direct business. Liabilities arising under these contracts are estimated in a manner consistent with the related insurance contract and are included as components of insurance contract liabilities.
Financial instrument contracts
Classification and designation
Financial assets are classified as fair value through profit or loss (FVTPL), available-for-sale (AFS), held-to-maturity (HTM), or loans and receivables based on their characteristics and purpose of their acquisition. Certain financial assets may be designated as FVTPL at the Company’s option. Financial liabilities are required to be classified as FVTPL or other financial liabilities.
The Company has classified its investment in stocks, bonds, pooled funds and derivatives as either AFS or FVTPL with the exception of private debt bonds which are classified as HTM. Investments in limited partnerships are classified as AFS. Certain bonds backing unpaid claims and adjustment expenses have been designated as FVTPL. Certain shares that contain embedded derivatives are designated as FVTPL. The fair value option may be used when such a designation eliminates or significantly reduces an accounting mismatch caused by measuring assets and liabilities on different bases or when instruments are measured and managed on a fair value basis in accordance with a documented risk management strategy. If a contract contains embedded derivatives, the entire combined hybrid contract may be designated as FVTPL. The Company’s FVTPL designations comply with these requirements.
60 Co-operators General Insurance Company | 2020 Annual Report
(Amounts in thousands of Canadian dollars, except for per share amounts and where otherwise noted)
Mortgages and other investments are classified as loans and receivables. Short-term investments, which include money market instruments with a maturity of greater than three months from the date of acquisition, are classified as AFS and HTM. Currency derivatives and cash and cash equivalents are classified as FVTPL. Accounts payable and accrued charges, as well as borrowings are classified as other financial liabilities with interest expense, if any, recorded in general expenses.
Presentation
Financial assets and liabilities are offset and the net amount reported in the consolidated balance sheets when there is a legally enforceable right to offset the recognized amounts and there is the ability and intention to settle on a net basis, or to realize the asset and settle the liability simultaneously.
Recognition and measurement
Purchases and sales of invested assets classified as FVTPL, AFS, HTM or loans and receivables are recorded on a trade date basis, the date on which the Company commits to purchase or sell the investment.
Financial assets are measured at fair value, with the exception of HTM assets and loans and receivables. Assets classified as HTM or loans and receivables are initially recognized at fair value and subsequently measured at amortized cost using the effective interest method, less provision for impairment losses, if any. Any premium or discount on the acquisition of bonds is included in the calculation of the effective interest rate. Financial liabilities are measured at fair value when they are classified as FVTPL. Other financial liabilities are initially recognized at fair value and subsequently measured at amortized cost using the effective interest method.
Changes in the fair value of FVTPL financial assets and financial liabilities are recognized in net income for the year, while changes in the fair value of AFS financial assets are reported within other comprehensive income (OCI), until the related instrument is disposed of or becomes impaired. Net foreign exchange gains and losses for FVTPL and AFS financial instruments are recognized in net income.
Accumulated other comprehensive income (AOCI) is included in the consolidated balance sheets as a separate component of shareholders’ equity (net of income taxes) and includes unrealized gains and losses on AFS financial assets. The cumulative gains or losses in the fair values of investments previously recognized in AOCI are reclassified to net income when they are realized or impaired.
Financial assets are derecognized when the rights to receive cash flows from them have expired or when the Company has transferred substantially all of the risks and rewards of ownership.
Fair value
Fair value is the price that would be received to sell an asset, or paid to transfer a liability, in an orderly transaction between market participants at the measurement date. Fair value measurements for invested assets are categorized into levels within a fair value hierarchy based on the nature of valuation inputs (Level 1, 2 or 3).
The fair value of other financial assets and financial liabilities is considered to be the carrying value when they are of short duration or when the instrument’s interest rate approximates current observable market rates. Where other financial assets and financial liab ilities are of longer duration, fair value is determined using the discounted cash flow method using discount rates based on adjusted observable market rates.
Impairment of financial assets
The Company reviews its AFS investment portfolio on a quarterly basis, at a minimum, for any declines in fair value below cost, and recognizes any losses in net income where there is objective evidence of impairment.
The Company assesses whether there is potential impairment of an AFS financial asset by assessing whether there is a significant or prolonged decline in fair value below cost. For equity instruments, the Company considers a decline of 20% to be significant and a period of twelve months to be prolonged. When assessing whether there is potential impairment of instruments other than equity instruments, factors that are considered include, but are not limited to: a decline in current financial position; defaults on debt obligations; failure to meet debt covenants; significant downgrades of credit status, and severity and/or duration of the decline in value. An impairment loss is recorded through a reclassification adjustment to the consolidated statements of income.
Impairments of AFS equity instruments cannot be reversed through the consolidated statements of income until the instrument is disposed of. Impairments of AFS debt instruments are only reversed if, in a subsequent period, the fair value increases and the increase can be objectively related to an event occurring after the impairment loss was recognized in the consolidated statements of income.
Co-operators General Insurance Company | 2020 Annual Report 61
(Amounts in thousands of Canadian dollars, except for per share amounts and where otherwise noted)
Financial assets include mortgages and other investments classified as loans and receivables that are also evaluated for impairment. These financial assets are considered impaired when there is objective evidence of deterioration in credit quality that indicates the Company no longer has reasonable assurance that the full amount of principal and interest will be collected. The Company then establishes specific provisions for losses and balances are subsequently measured at their net realizable amount based on discounting the cash flows at the original effective interest rate inherent in the loan or the fair value of the underlying security. If the Company determines that no objective evidence of impairment exists for an individually assessed financial asset, whether significant or not, it collectively assesses the assets for impairment. Assets that are individually assessed for impairment, and for which an impairment loss is or continues to be recognized, are not included in a collective assessment of impairment. Changes in present value of estimated future cash flows of impaired loans are recognized in net investment income and gains as a credit or charge to impairment losses.
Derivative financial instruments
Derivatives are classified as FVTPL and transactions are recorded on a trade date basis. There are no derivatives designated as a hedge for accounting purposes. Derivatives are recognized at fair value in the consolidated balance sheets. The gains and losses arising from remeasuring the derivatives at fair value are recognized in the consolidated statements of income in net investment income and gains. Positive fair values are reported in invested assets as foreign currency forward contracts, and negative fair values are reported in provisions and other liabilities.
Investments under securities lending program
Securities lending transactions are entered into on a collateralized basis. The securities lent are not derecognized on the Company ’s consolidated balance sheets given that the risks and rewards of ownership are not transferred from the Company to the counterparties in the course of such transactions. Securities received from counterparties as collateral are not recorded on the Company’s consolidated balance sheets given that the risks and rewards of ownership are not transferred from the counterparties to the Company in the course of such transactions.
Revenue and expense recognition
Included within net investment income and gains are dividend and interest income. Dividend income is recorded on the ex-dividend date and interest income, which includes amortization of premiums or discounts, is recognized using the effective interest method. Realized gains and losses on the sale of investments are computed using the average cost of investments, net of any impairment charges, and are recognized in net investment income and gains on the date of sale.
Transaction costs for AFS financial assets and loans and receivables are recorded as part of the purchase cost of the asset. Transaction costs for financial liabilities classified as other than FVTPL are included in the value of the instrument at issue. Transaction costs for FVTPL financial instruments are expensed as incurred in the consolidated statements of income.
Other significant accounting policies
Cash and cash equivalents
Cash and cash equivalents include short-term investments with a maturity of three months or less from the date of acquisition.
Property and equipment
Computer equipment, furniture and equipment, and leasehold improvements are carried at cost less accumulated amortization and accumulated impairment losses. Subsequent costs are included in the asset’s carrying value when it is probable that future economic benefits associated with the item will flow to the Company and the cost of the item can be reliably measured. All repairs and maintenance costs are charged to the consolidated statements of income during the year in which they occur.
Property and equipment balances are amortized on a straight-line basis over their estimated useful lives as follows:
Term Computer equipment 3 years Furniture and equipment 10 years Leasehold improvements Lesser of 5 years and terms of related lease
Leasehold projects in progress are carried at cost and amortization commences upon completion of the project.
62 Co-operators General Insurance Company | 2020 Annual Report
(Amounts in thousands of Canadian dollars, except for per share amounts and where otherwise noted)
Impairment reviews are performed when there are indicators that the carrying value of an asset may exceed its recoverable amount. The recoverable amount is the higher of an asset's fair value less costs to sell and its value in use. Impairment losses are recognized in the consolidated statements of income as an expense. In the event that the value of a previously impaired asset recovers, the previously recognized impairment loss is recovered in the consolidated statements of income at that time.
Property and equipment are derecognized upon disposal or when no further future economic benefits are expected from its use or disposal. Gains and losses on disposal are determined by comparing the proceeds with the net carrying value and are recorded in the consolidated statements of income. Fully depreciated property and equipment are retained in cost and accumulated amortization accounts until such assets are removed from service.
Useful lives, amortization rates and residual values are reviewed annually and are taken into consideration when determining the depreciable amounts of the property and equipment.
Leases
At the inception of a contract, the Company determines whether a contract is, or contains, a lease. A contract is, or contains, a lease if the contract conveys the right to control the use of an identified asset for a period of time in exchange for consideration. To determine whether a contract conveys the right to control the use of an identified asset for a period of time, the Company determines whether it has the right to obtain substantially all the economic benefits from the use of the identified asset and has the right to direct the use of the identified asset. An identified asset is physically distinct and can be specified explicitly or implicitly.
At the commencement of a lease, the Company recognizes a right-of-use asset and a lease liability. The right-of-use asset is initially measured at cost. Cost includes the initial amount of the lease liability adjusted for any lease payments made at or before the commencement date, plus any initial direct costs incurred and an estimate of costs to dismantle or restore the underlying asset, less any lease incentives received.
The right-of-use asset is depreciated using the straight-line method from the commencement date to the end of the lease term. The lease term includes the non-cancellable period of the lease including extension and termination options if the Company is reasonably certain to exercise the option. The right-of-use asset is adjusted for certain remeasurements of the lease liability and impairment losses.
The lease liability is initially measured at the present value of the lease payments for the remainder of the lease term, discounted using the interest rate implicit in the lease if known or, if that rate is not readily determinable, the Company’s incremental borrowing rate. Payments that are variable in nature and do not represent in-substance fixed payments have been excluded from the lease payments and are included in the consolidated statements of income under general expenses.
In determining the lease term, management considers all facts and circumstances that create an economic incentive to exercise an extension option, or not to exercise a termination option. The lease term includes the non-cancellable period of the lease including extension and termination options if the Company is reasonably certain to exercise the option.
The lease liability is amortized using the interest rate implicit in the lease if known, or if that rate is not readily determinable, the Company’s incremental borrowing rate. It is remeasured when there is a change in the Company’s estimate of whether it will exercise an extension or termination option. If the lease liability is remeasured, a corresponding adjustment is made to the right-of-use asset.
Business acquisitions and consolidation
The Company measures goodwill as the fair value of the consideration transferred, including the recognized amount of any non-controlling interest in the acquiree, less the net recognized amount (generally fair value) of the identifiable assets acquired and liabi lities assumed, all measured as of the acquisition date. When the excess is negative, a bargain purchase gain is recognized immediately in net income.
The Company elects, on a transaction-by-transaction basis, whether to measure non-controlling interest at its fair value, or at its proportionate share of the recognized amount of the identifiable net assets, at the acquisition date. Transaction costs that the Company incurs in connection with a business combination, other than those associated with the issue of debt or equity securities, are expensed as incurred.
IFRS 3 “Business Combinations” excludes from its scope the combination of entities or businesses under common control. Therefore, in accordance with IAS 8 “Accounting policies, changes in accounting estimates and errors”, the Company has considered various other sources of guidance and has elected to record the acquisition of businesses under common control using the pre-acquisition date book values for their assets and liabilities and will not apply the measurement principles of IFRS 3; the difference between fair value and book value will be recorded through equity. Consistent with IFRS 3, the results of the Company prior to the acquisition date will not be restated.
Co-operators General Insurance Company | 2020 Annual Report 63
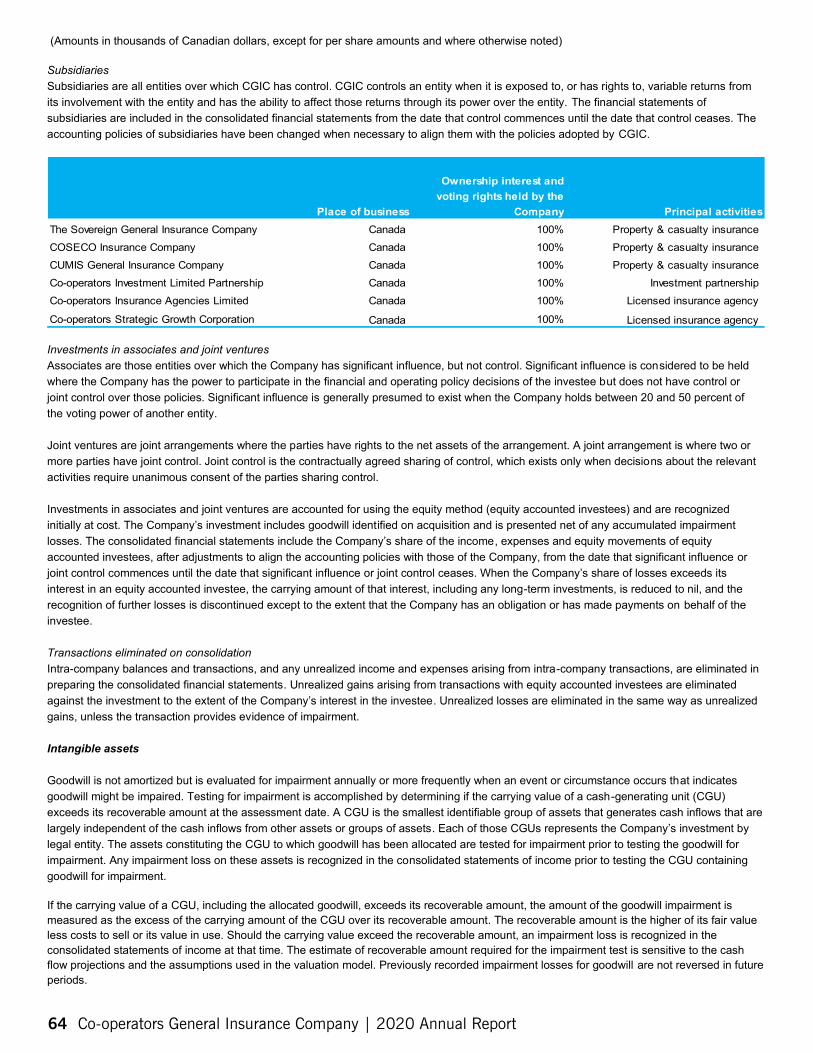
(Amounts in thousands of Canadian dollars, except for per share amounts and where otherwise noted)
Subsidiaries Subsidiaries are all entities over which CGIC has control. CGIC controls an entity when it is exposed to, or has rights to, variable returns from its involvement with the entity and has the ability to affect those returns through its power over the entity. The financial statements of subsidiaries are included in the consolidated financial statements from the date that control commences until the date that control ceases. The accounting policies of subsidiaries have been changed when necessary to align them with the policies adopted by CGIC.
Ownership interest and voting rights held by the
Company Place of business Principal activities The Sovereign General Insurance Company Canada 100% Property & casualty insurance COSECO Insurance Company Canada 100% Property & casualty insurance CUMIS General Insurance Company Canada 100% Property & casualty insurance Co-operators Investment Limited Partnership Canada 100% Investment partnership Co-operators Insurance Agencies Limited Canada 100% Licensed insurance agency
Co-operators Strategic Growth Corporation Canada 100% Licensed insurance agency
Investments in associates and joint ventures Associates are those entities over which the Company has significant influence, but not control. Significant influence is considered to be held where the Company has the power to participate in the financial and operating policy decisions of the investee but does not have control or joint control over those policies. Significant influence is generally presumed to exist when the Company holds between 20 and 50 percent of the voting power of another entity.
Joint ventures are joint arrangements where the parties have rights to the net assets of the arrangement. A joint arrangement is where two or more parties have joint control. Joint control is the contractually agreed sharing of control, which exists only when decisions about the relevant activities require unanimous consent of the parties sharing control.
Investments in associates and joint ventures are accounted for using the equity method (equity accounted investees) and are recognized initially at cost. The Company’s investment includes goodwill identified on acquisition and is presented net of any accumulated impairment losses. The consolidated financial statements include the Company’s share of the income, expenses and equity movements of equity accounted investees, after adjustments to align the accounting policies with those of the Company, from the date that significant influence or joint control commences until the date that significant influence or joint control ceases. When the Company’s share of losses exceeds its interest in an equity accounted investee, the carrying amount of that interest, including any long-term investments, is reduced to nil, and the recognition of further losses is discontinued except to the extent that the Company has an obligation or has made payments on behalf of the investee.
Transactions eliminated on consolidation Intra-company balances and transactions, and any unrealized income and expenses arising from intra-company transactions, are eliminated in preparing the consolidated financial statements. Unrealized gains arising from transactions with equity accounted investees are eliminated against the investment to the extent of the Company’s interest in the investee. Unrealized losses are eliminated in the same way as unrealized gains, unless the transaction provides evidence of impairment.
Intangible assets
Goodwill is not amortized but is evaluated for impairment annually or more frequently when an event or circumstance occurs that indicates goodwill might be impaired. Testing for impairment is accomplished by determining if the carrying value of a cash-generating unit (CGU) exceeds its recoverable amount at the assessment date. A CGU is the smallest identifiable group of assets that generates cash inflows that are largely independent of the cash inflows from other assets or groups of assets. Each of those CGUs represents the Company’s investment by legal entity. The assets constituting the CGU to which goodwill has been allocated are tested for impairment prior to testing the goodwill for impairment. Any impairment loss on these assets is recognized in the consolidated statements of income prior to testing the CGU containing goodwill for impairment.
If the carrying value of a CGU, including the allocated goodwill, exceeds its recoverable amount, the amount of the goodwill impairment is measured as the excess of the carrying amount of the CGU over its recoverable amount. The recoverable amount is the higher of its fair value less costs to sell or its value in use. Should the carrying value exceed the recoverable amount, an impairment loss is recognized in the consolidated statements of income at that time. The estimate of recoverable amount required for the impairment test is sensitive to the cash flow projections and the assumptions used in the valuation model. Previously recorded impairment losses for goodwill are not reversed in future periods.
64 Co-operators General Insurance Company | 2020 Annual Report
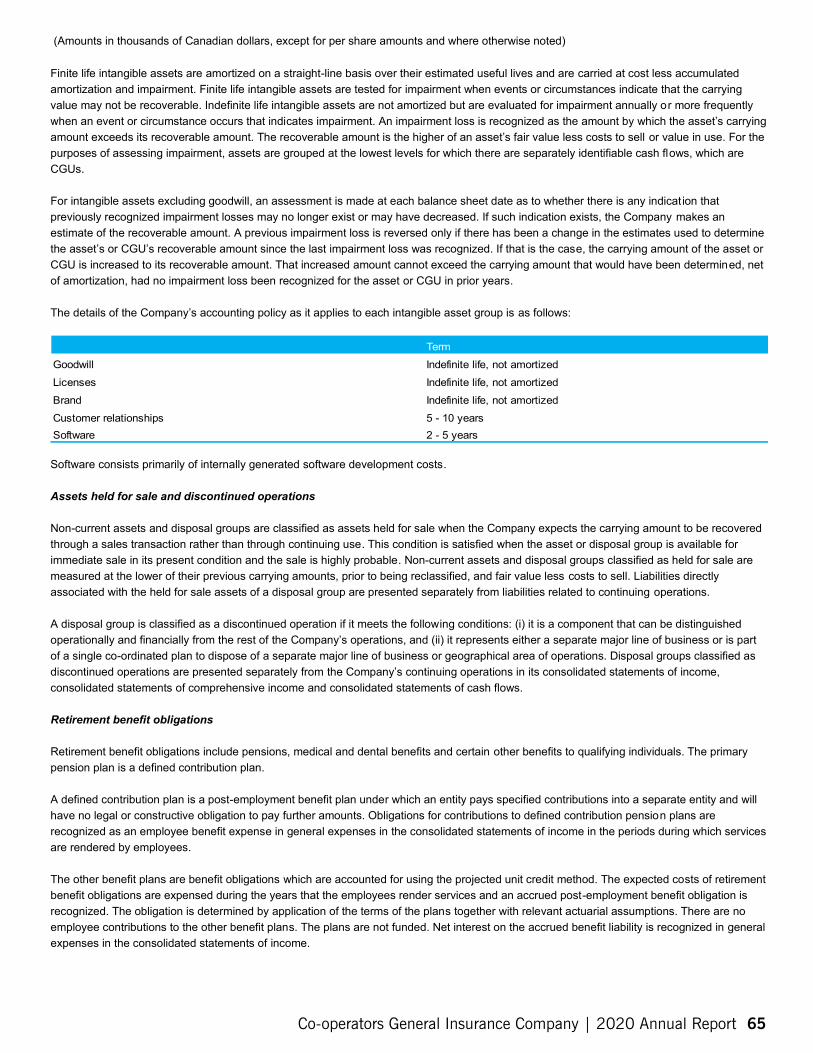
(Amounts in thousands of Canadian dollars, except for per share amounts and where otherwise noted)
Finite life intangible assets are amortized on a straight-line basis over their estimated useful lives and are carried at cost less accumulated amortization and impairment. Finite life intangible assets are tested for impairment when events or circumstances indicate that the carrying value may not be recoverable. Indefinite life intangible assets are not amortized but are evaluated for impairment annually or more frequently when an event or circumstance occurs that indicates impairment. An impairment loss is recognized as the amount by which the asset’s carrying amount exceeds its recoverable amount. The recoverable amount is the higher of an asset’s fair value less costs to sell or value in use. For the purposes of assessing impairment, assets are grouped at the lowest levels for which there are separately identifiable cash flows, which are CGUs.
For intangible assets excluding goodwill, an assessment is made at each balance sheet date as to whether there is any indication that previously recognized impairment losses may no longer exist or may have decreased. If such indication exists, the Company makes an estimate of the recoverable amount. A previous impairment loss is reversed only if there has been a change in the estimates used to determine the asset’s or CGU’s recoverable amount since the last impairment loss was recognized. If that is the case, the carrying amount of the asset or CGU is increased to its recoverable amount. That increased amount cannot exceed the carrying amount that would have been determined, net of amortization, had no impairment loss been recognized for the asset or CGU in prior years.
The details of the Company’s accounting policy as it applies to each intangible asset group is as follows:
Term Goodwill Indefinite life, not amortized Licenses Indefinite life, not amortized Brand Indefinite life, not amortized Customer relationships 5 - 10 years Software 2 - 5 years
Software consists primarily of internally generated software development costs.
Assets held for sale and discontinued operations
Non-current assets and disposal groups are classified as assets held for sale when the Company expects the carrying amount to be recovered through a sales transaction rather than through continuing use. This condition is satisfied when the asset or disposal group is available for immediate sale in its present condition and the sale is highly probable. Non-current assets and disposal groups classified as held for sale are measured at the lower of their previous carrying amounts, prior to being reclassified, and fair value less costs to sell. Liabilities directly associated with the held for sale assets of a disposal group are presented separately from liabilities related to continuing operations.
A disposal group is classified as a discontinued operation if it meets the following conditions: (i) it is a component that can be distinguished operationally and financially from the rest of the Company’s operations, and (ii) it represents either a separate major line of business or is part of a single co-ordinated plan to dispose of a separate major line of business or geographical area of operations. Disposal groups classified as discontinued operations are presented separately from the Company’s continuing operations in its consolidated statements of income, consolidated statements of comprehensive income and consolidated statements of cash flows.
Retirement benefit obligations
Retirement benefit obligations include pensions, medical and dental benefits and certain other benefits to qualifying individuals. The primary pension plan is a defined contribution plan.
A defined contribution plan is a post-employment benefit plan under which an entity pays specified contributions into a separate entity and will have no legal or constructive obligation to pay further amounts. Obligations for contributions to defined contribution pension plans are recognized as an employee benefit expense in general expenses in the consolidated statements of income in the periods during which services are rendered by employees.
The other benefit plans are benefit obligations which are accounted for using the projected unit credit method. The expected costs of retirement benefit obligations are expensed during the years that the employees render services and an accrued post-employment benefit obligation is recognized. The obligation is determined by application of the terms of the plans together with relevant actuarial assumptions. There are no employee contributions to the other benefit plans. The plans are not funded. Net interest on the accrued benefit liability is recognized in general expenses in the consolidated statements of income.
Co-operators General Insurance Company | 2020 Annual Report 65
(Amounts in thousands of Canadian dollars, except for per share amounts and where otherwise noted)
The effects of remeasurement of retirement benefit obligations, including differences between the actual return on plan assets and the interest income on plan assets, and actuarial gain and loss, are recognized permanently in OCI. Past service costs are recognized in the consolidated statements of income at the earlier of when the amendment or curtailment occurs or when the Company recognizes related restructuring or termination benefits, where applicable.
Borrowings
Borrowings are initially recognized at fair value, net of any transaction costs incurred. Subsequently, borrowings are carried at amortized cost. Debt issuance transaction costs are amortized over the term of the related debt using the effective interest method.
Provisions
Provisions are recognized when: (i) the Company has a present legal or constructive obligation as a result of past events, (ii) it is more likely than not that an outflow of resources will be required to settle the obligation, (iii) and the amount can be reliably estimated.
Provisions are measured at the present value of the expenditures expected to be required to settle the obligation using a pre-tax rate that reflects current market assessments of the time value of money and the risks specific to the obligation. The increase in the provision due to the passage of time is recognized as interest expense and classified as a general expense in the consolidated statements of income.
Provision for advisor transition commissions
The Company’s advisors are eligible for a transition commission payout on a qualifying termination. The transition commission liability is based on the number of years of service as an advisor and the advisor’s average trailing commission volume. Payments to terminated advisors are funded in part from reduced commission payments which are made to advisors assuming the rights to the book of business during the first three years of their agency relationship. The obligation to active advisors is determined by accruing for the benefits earned to date on a present value basis assuming the cash flows associated with the earned benefits are paid out at the expected termination date.
Foreign currency translation
Functional and presentation currency Items included in the financial statements of each of the Company’s entities are measured using the currency of the primary economic environment in which the entity operates (the functional currency). The consolidated financial statements are presented in Canadian dollars, which is the Company’s functional and presentation currency.
Transactions and balances The Company translates all foreign currency monetary assets and liabilities into Canadian dollars at year-end foreign exchange rates. Revenue and expenses are translated at the prevailing foreign exchange rate on the date of the transaction. Exchange gains and losses are recognized in the consolidated statements of income with the exception of unrealized gains and losses associated with non-monetary financial assets, such as equities classified as AFS, which are recorded in OCI.
Income taxes
The Company accounts for income taxes using the asset and liability method. Under this method, the provision for income taxes is calculated based on income tax laws and rates enacted and substantively enacted as at the consolidated balance sheet date. The income tax provision is comprised of current and deferred income taxes. Current income taxes are amounts expected to be payable or recoverable as a result of current year operations. Deferred income tax assets and liabilities arise from temporary differences between the accounting and tax basis of assets and liabilities. A deferred income tax asset is recognized to the extent that it is probable the benefit of losses and deductions will be available to be carried forward to future years for income tax purposes. Current and deferred income taxes are recorded in the consolidated statements of income, except for those items that are associated with components of OCI. In those cases, the applicable tax is also recorded in OCI.
Share capital
Shares are classified as equity when there is no obligation to transfer cash or other assets. Incremental costs directly attr ibutable to the issue of equity instruments are shown in shareholders’ equity as a deduction from the proceeds, net of tax.
66 Co-operators General Insurance Company | 2020 Annual Report
(Amounts in thousands of Canadian dollars, except for per share amounts and where otherwise noted)
Use of estimates and judgments
The preparation of the consolidated financial statements requires management to make estimates and assumptions that affect the reported amounts of assets, liabilities, the disclosure of contingent assets and liabilities at the consolidated balance sheet date and the reported amounts of revenues and expenses during the year. The preparation of the consolidated financial statements also requires management to exercise its judgment in the process of applying the Company’s accounting policies. The areas involving a higher degree of judgment or complexity, or areas where assumptions and estimates are significant to the consolidated financial statements, are disclosed in the notes for the respective account balances.
Significant estimates and assumptions include the following:
Valuation of insurance contract liabilities The Company makes certain assumptions, which include discount rates and the future development of claims. Note 7(b) discloses the revised estimate of prior year unpaid claims and adjustment expenses. The Company’s sensitivity of unpaid claims and after-tax net income to changes in best estimate assumptions are disclosed in note 7(f).
Provision for advisor transition commissions The provision for advisor transition commissions includes an obligation to active advisors determined by accruing for the benefits earned to date. The Company makes certain assumptions in determining the present value of the cash flows associated with the earned benefits. Note 15 discloses the significant assumptions used to estimate the provision, which include discount rate and average termination age.
Valuation of other benefit plans obligation The cost of the other benefit plans obligation is calculated by the Company’s independent actuaries using assumptions determined by management. The actuarial valuation involves making assumptions about discount rates, future inflation, mortality rates, and health and dental cost trends. If actuarial experience differs from the assumptions used, the expected obligation could increase or decrease in future years. Note 16 discloses the significant assumptions used to estimate the other benefit plans obligation.
Significant judgments include the following:
Impairment of financial instruments The Company assesses AFS financial instruments for objective evidence of impairment at each reporting date. Objective evidence of impairment includes a significant or prolonged decline in the fair value or net asset value below cost or when a loss event that has a reliably estimable impact on the future cash flows of the financial instrument has occurred. The determination of what is significant or prolonged requires judgment. In making this judgment, we evaluate factors including, but not limited to: a decline in current financial position; defaults on debt obligations; failure to meet debt covenants; significant downgrades of credit status, and severity and/or duration of the decline in value.
3. Adoption of new and amended accounting standards
Effective January 1, 2020, the Company adopted the following new and amended accounting standards:
IFRS 3 "Business Combinations"
IFRS 3 was amended in October 2018 to revise the definition of a business and provide a simplified assessment of whether an acquired set of activities and assets qualifies as a business. The amendment is effective for annual periods beginning on or after January 1, 2020. The Company has determined these amendments have no impact on its consolidated financial statements.
IFRS 16 “Leases”
In May 2020, the IASB published an amendment to IFRS 16 providing lessees with an exemption from assessing whether a COVID-19-related rent concession is a lease modification. This amendment was made to provide timely relief to lessees and to enable them to continue providing information about their leases that may be useful to investors. The amendment is effective for annual reporting periods beginning on or after June 1, 2020 and the amendment expires on June 30, 2021. The Company has determined these amendments have no impact on its consolidated financial statements.
IAS 1 "Presentation of Financial Statements" and IAS 8 "Accounting Policies, Changes in Accounting Estimates and Errors"
Amendments to IAS 1 and IAS 8 were issued in October 2018. The amendments are effective for annual periods beginning on or after January 1, 2020. The amendments update the definition of 'material' and the meaning of 'primary users of general purpose financial statements'. The Company has determined these amendments have no impact on its consolidated financial statements.
Co-operators General Insurance Company | 2020 Annual Report 67
(Amounts in thousands of Canadian dollars, except for per share amounts and where otherwise noted)
Conceptual Framework for Financial Reporting
In March 2018, the IASB revised its conceptual framework for financial reporting. The revised framework includes a new chapter on measurement, presentation and disclosure in the statement of income and comprehensive income, derecognition of assets and liabilities and the boundaries of reporting entities in financial statements. It also includes improved definitions, guidance, and clarifications on important topics (e.g., the roles of stewardship, prudence, measurement uncertainty in financial reporting and substance over form). The IASB has also issued amendments that update references to the framework in certain standards. The Company has determined these amendments have no impact on its consolidated financial statements.
4. Accounting standards issued but not yet applied
IFRS 7 "Financial Instruments: Disclosures"
In December 2011, IFRS 7 was amended to require additional financial instrument disclosures upon transition from IAS 39 to IFRS 9. The amendments are effective upon adoption of IFRS 9, which is effective for annual periods beginning on or after January 1, 2018. However, in September 2016, IFRS 4 was amended to provide an option of a temporary exemption from applying IFRS 9 for entities whose predominant activity is issuing insurance contracts within the scope of IFRS 4. Therefore, qualifying entities will have the option to adopt IFRS 9 upon the adoption of IFRS 17. The Company qualifies for a temporary exemption as disclosed in note 5(h); thus, IFRS 7 is effective for annual periods beginning on or after January 1, 2023. The Company is currently evaluating the impact that this standard will have on its consolidated financial statements.
IFRS 9 "Financial Instruments"
IFRS 9 was issued in July 2014 and is intended to replace IAS 39 “Financial Instruments: Recognition and Measurement”. IFRS 9 is a three-part standard aimed at reducing complexity in reporting financial instruments. The project has been divided into three phases: Phase 1 Classification and measurement, Phase 2 Impairment and Phase 3 Hedge accounting. Phase 1 was issued in November 2009 and amended in October 2010. It requires financial assets to be recorded at amortized cost or fair value depending on the entity’s business model for managing the assets and their associated cash flow characteristics. All financial assets are to be measured at fair value on the balance sheet if they are not measured at amortized cost. At initial recognition, an entity may irrevocably designate a financial asset as measured at FVTPL or fair value through other comprehensive income (FVOCI) if doing so eliminates or significantly reduces a measurement or recognition inconsistency that would otherwise arise from measuring assets or liabilities or recognizing the gains and losses on them on different bases. Phase 2 was completed in July 2014 and introduced a new expected loss impairment methodology that will result in more timely recognition of impairment losses. Phase 3 was completed in November 2013. This phase replaces the rule-based hedge accounting requirements in IAS 39 to more closely align the accounting with risk management activities.
The standard is effective for annual periods beginning on or after January 1, 2018. However, in September 2016, IFRS 4 was amended to provide an option of a temporary exemption from applying IFRS 9 for entities whose predominant activity is issuing insurance contracts within the scope of IFRS 4. Therefore, qualifying entities will have the option to adopt IFRS 9 upon the adoption of IFRS 17. The Company qualifies for temporary exemption as disclosed in note 5(h); thus, IFRS 9 is effective for annual periods beginning on or after January 1, 2023. The Company is currently evaluating the impact that this standard will have on its consolidated financial statements.
IFRS 17 "Insurance Contracts"
IFRS 17 was issued in May 2017 and will replace IFRS 4 “Insurance Contracts”. The intent of the standard is to establish cons istent recognition, measurement, presentation and disclosure principles to provide relevant and comparable reporting of insurance contracts across jurisdictions.
The standard requires entities to measure insurance contract liabilities as the risk-adjusted present value of the cash flows plus the contractual service margin, which represents the unearned profit the entity will recognize as future service is provided. This is referred to as the general model. Expedients are specified, provided the insurance contracts meet certain conditions. If, at initial recognition or subsequently, the contractual service margin becomes negative, the contract is considered onerous and the excess is recognized immediately in the consolidated statements of income. The standard also includes significant changes to the presentation and disclosure of insurance contracts within entities’ financial statements.
In June 2020, the IASB issued amendments to IFRS 17 which were designed to simplify certain requirements in the standard, make financial performance easier to explain and confirm the two-year deferral of the effective date of the standard including the temporary exemption of IFRS 9 for insurers as disclosed in note 5(h); thus, IFRS 17 will be effective for annual reporting periods beginning on or after January 1, 2023. The Company is currently evaluating the impact that this standard and its amendments will have on its consolidated financial statements.
68 Co-operators General Insurance Company | 2020 Annual Report
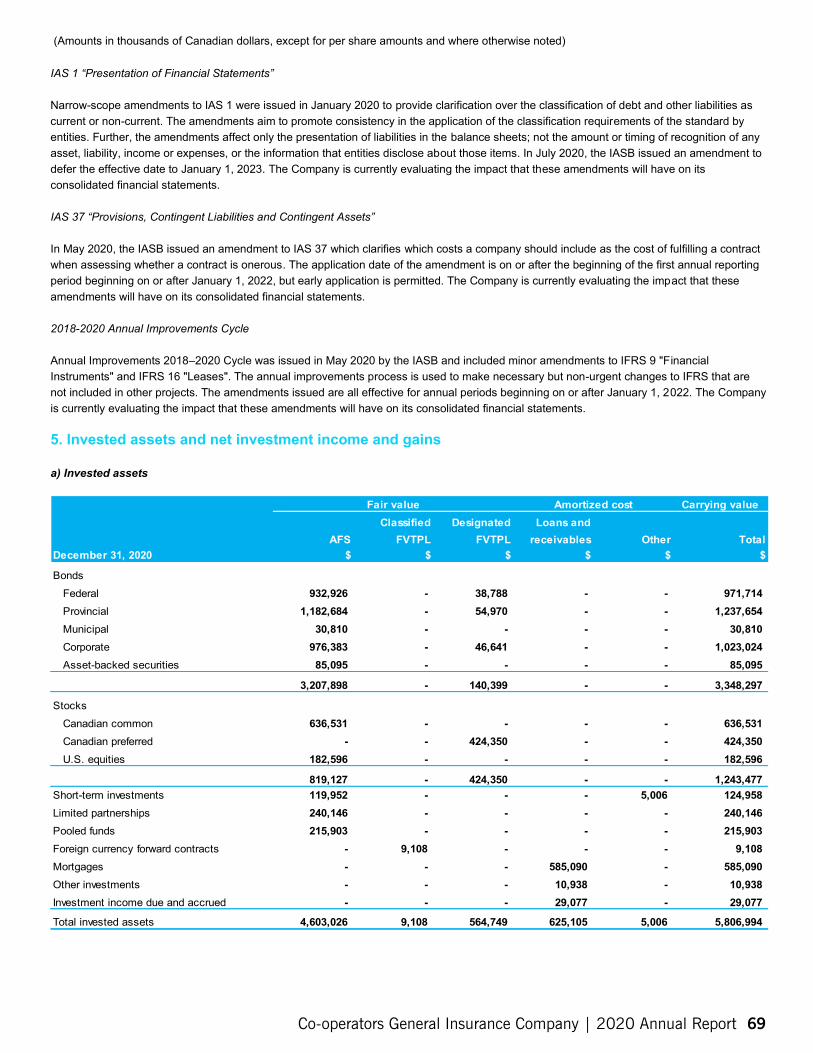
4, 603,026 9,108 564, 749 625, 105 5, 006 5, 806,994
(Amounts in thousands of Canadian dollars, except for per share amounts and where otherwise noted)
IAS 1 “Presentation of Financial Statements”
Narrow-scope amendments to IAS 1 were issued in January 2020 to provide clarification over the classification of debt and other liabilities as current or non-current. The amendments aim to promote consistency in the application of the classification requirements of the standard by entities. Further, the amendments affect only the presentation of liabilities in the balance sheets; not the amount or timing of recognition of any asset, liability, income or expenses, or the information that entities disclose about those items. In July 2020, the IASB issued an amendment to defer the effective date to January 1, 2023. The Company is currently evaluating the impact that these amendments will have on its consolidated financial statements.
IAS 37 “Provisions, Contingent Liabilities and Contingent Assets”
In May 2020, the IASB issued an amendment to IAS 37 which clarifies which costs a company should include as the cost of fulfilling a contract when assessing whether a contract is onerous. The application date of the amendment is on or after the beginning of the first annual reporting period beginning on or after January 1, 2022, but early application is permitted. The Company is currently evaluating the impact that these amendments will have on its consolidated financial statements.
2018-2020 Annual Improvements Cycle
Annual Improvements 2018–2020 Cycle was issued in May 2020 by the IASB and included minor amendments to IFRS 9 "Financial Instruments" and IFRS 16 "Leases". The annual improvements process is used to make necessary but non-urgent changes to IFRS that are not included in other projects. The amendments issued are all effective for annual periods beginning on or after January 1, 2022. The Company is currently evaluating the impact that these amendments will have on its consolidated financial statements.
5. Invested assets and net investment income and gains
a) Invested assets
Fair value Amortized cost Carrying value Classified
FVTPL $
Designated FVTPL
$
Loans and receivables
$ AFS
$ Other
$ Total
$ December 31, 2020
Bonds Federal 932,926 - 38,788 - - 971,714 Provincial 1,182,684 - 54,970 - - 1,237,654 Municipal 30,810 - - - - 30,810 Corporate 976,383 - 46,641 - - 1,023,024 Asset-backed securities 85,095 - - - - 85,095
3,207,898 - 140,399 - - 3,348,297
Stocks Canadian common 636,531 - - - - 636,531 Canadian preferred - - 424,350 - - 424,350 U.S. equities 182,596 - - - - 182,596
819,127 - 424,350 - - 1,243,477 Short-term investments 119,952 - - - 5,006 124,958 Limited partnerships 240,146 - - - - 240,146 Pooled funds 215,903 - - - - 215,903 Foreign currency forward contracts - 9,108 - - - 9,108 Mortgages - - - 585,090 - 585,090 Other investments - - - 10,938 - 10,938 Investment income due and accrued - - - 29,077 - 29,077
Total invested assets
Co-operators General Insurance Company | 2020 Annual Report 69
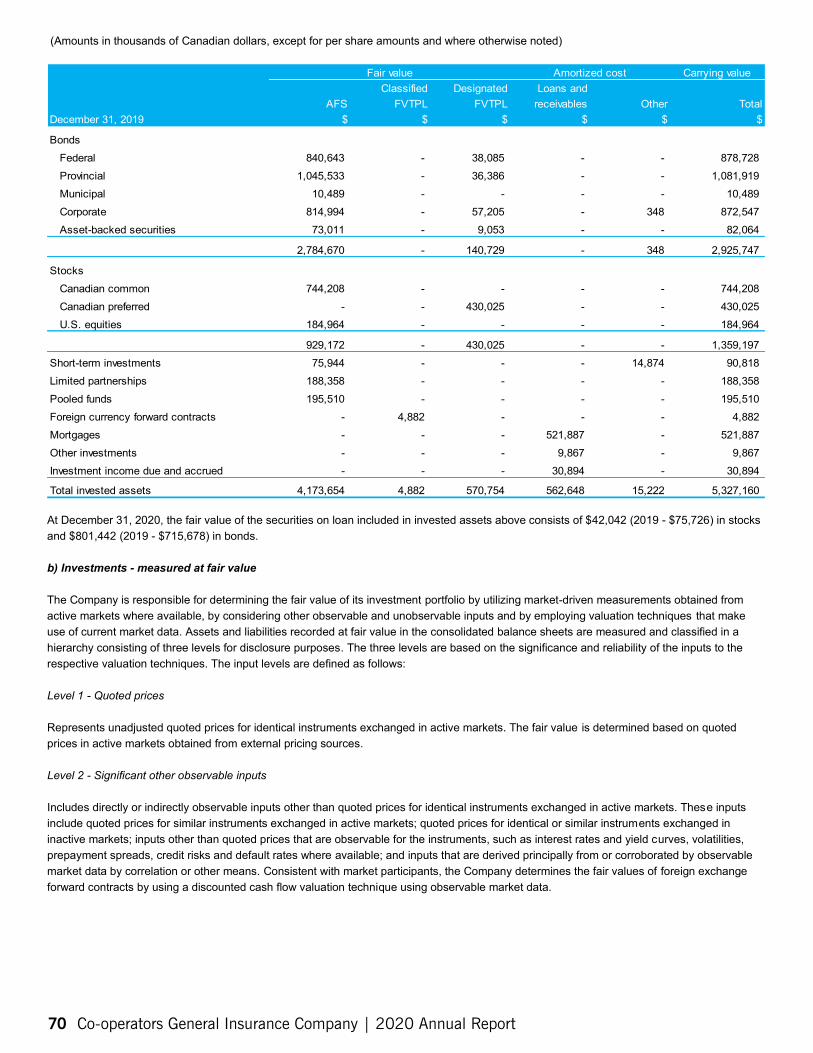
(Amounts in thousands of Canadian dollars, except for per share amounts and where otherwise noted)
Fair value Amortized cost Carrying value Classified Designated Loans and
AFS FVTPL FVTPL receivables Other Total December 31, 2019 $ $ $ $ $ $
Bonds Federal 840,643 - 38,085 - - 878,728 Provincial 1,045,533 - 36,386 - - 1,081,919 Municipal 10,489 - - - - 10,489 Corporate 814,994 - 57,205 - 348 872,547 Asset-backed securities 73,011 - 9,053 - - 82,064
2,784,670 - 140,729 - 348 2,925,747
Stocks Canadian common 744,208 - - - - 744,208 Canadian preferred - - 430,025 - - 430,025 U.S. equities 184,964 - - - - 184,964
929,172 - 430,025 - - 1,359,197 Short-term investments 75,944 - - - 14,874 90,818 Limited partnerships 188,358 - - - - 188,358 Pooled funds 195,510 - - - - 195,510 Foreign currency forward contracts - 4,882 - - - 4,882 Mortgages - - - 521,887 - 521,887 Other investments - - - 9,867 - 9,867 Investment income due and accrued - - - 30,894 - 30,894
Total invested assets 4,173,654 4,882 570,754 562,648 15,222 5,327,160
At December 31, 2020, the fair value of the securities on loan included in invested assets above consists of $42,042 (2019 - $75,726) in stocks and $801,442 (2019 - $715,678) in bonds.
b) Investments - measured at fair value
The Company is responsible for determining the fair value of its investment portfolio by utilizing market-driven measurements obtained from active markets where available, by considering other observable and unobservable inputs and by employing valuation techniques that make use of current market data. Assets and liabilities recorded at fair value in the consolidated balance sheets are measured and classified in a hierarchy consisting of three levels for disclosure purposes. The three levels are based on the significance and reliability of the inputs to the respective valuation techniques. The input levels are defined as follows:
Level 1 - Quoted prices
Represents unadjusted quoted prices for identical instruments exchanged in active markets. The fair value is determined based on quoted prices in active markets obtained from external pricing sources.
Level 2 - Significant other observable inputs
Includes directly or indirectly observable inputs other than quoted prices for identical instruments exchanged in active markets. These inputs include quoted prices for similar instruments exchanged in active markets; quoted prices for identical or similar instruments exchanged in inactive markets; inputs other than quoted prices that are observable for the instruments, such as interest rates and yield curves, volatilities, prepayment spreads, credit risks and default rates where available; and inputs that are derived principally from or corroborated by observable market data by correlation or other means. Consistent with market participants, the Company determines the fair values of foreign exchange forward contracts by using a discounted cash flow valuation technique using observable market data.
70 Co-operators General Insurance Company | 2020 Annual Report
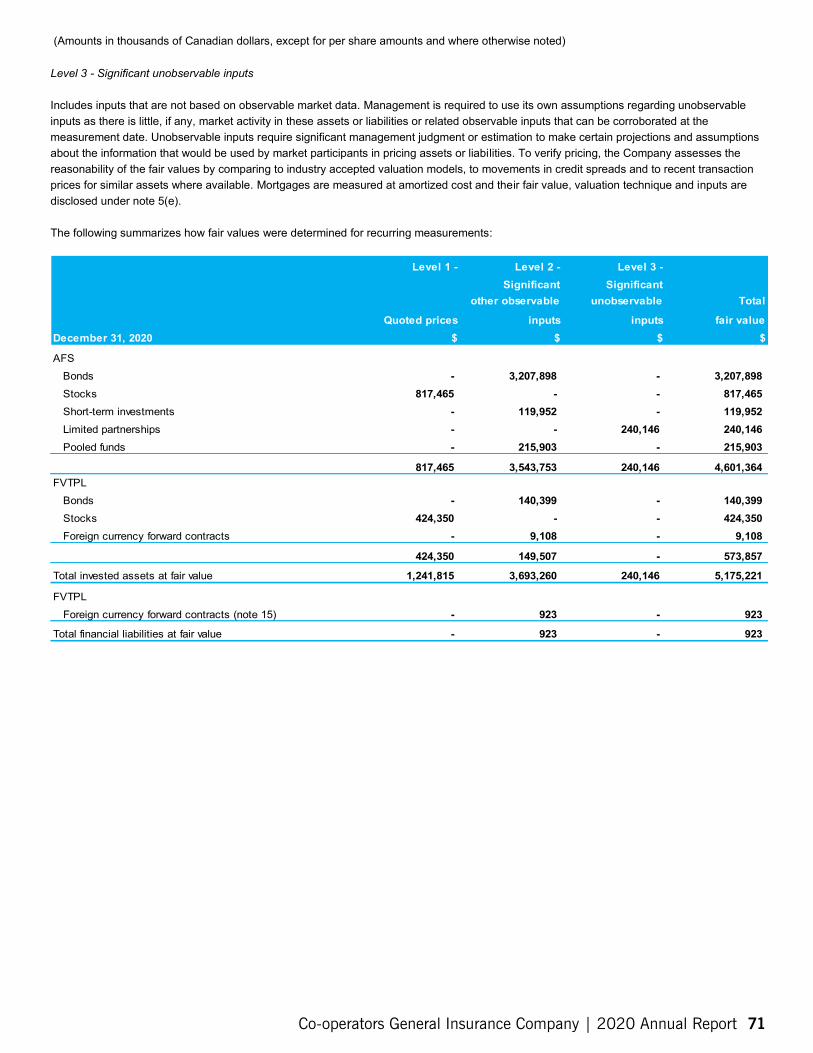
(Amounts in thousands of Canadian dollars, except for per share amounts and where otherwise noted)
Level 3 - Significant unobservable inputs
Includes inputs that are not based on observable market data. Management is required to use its own assumptions regarding unobservable inputs as there is little, if any, market activity in these assets or liabilities or related observable inputs that can be corroborated at the measurement date. Unobservable inputs require significant management judgment or estimation to make certain projections and assumptions about the information that would be used by market participants in pricing assets or liabilities. To verify pricing, the Company assesses the reasonability of the fair values by comparing to industry accepted valuation models, to movements in credit spreads and to recent transaction prices for similar assets where available. Mortgages are measured at amortized cost and their fair value, valuation technique and inputs are disclosed under note 5(e).
The following summarizes how fair values were determined for recurring measurements:
Level 1 - Level 2 - Level 3 -Significant Significant
other observable unobservable Total
Quoted prices inputs inputs fair value December 31, 2020 $ $ $ $
AFS Bonds - 3,207,898 - 3,207,898 Stocks 817,465 - - 817,465 Short-term investments - 119,952 - 119,952 Limited partnerships - - 240,146 240,146 Pooled funds - 215,903 - 215,903
817,465 3,543,753 240,146 4,601,364 FVTPL
Bonds - 140,399 - 140,399 Stocks 424,350 - - 424,350 Foreign currency forward contracts - 9,108 - 9,108
424,350 149,507 - 573,857
Total invested assets at fair value 1,241,815 3,693,260 240,146 5,175,221
FVTPL Foreign currency forward contracts (note 15) - 923 - 923
Total financial liabilities at fair value - 923 - 923
Co-operators General Insurance Company | 2020 Annual Report 71
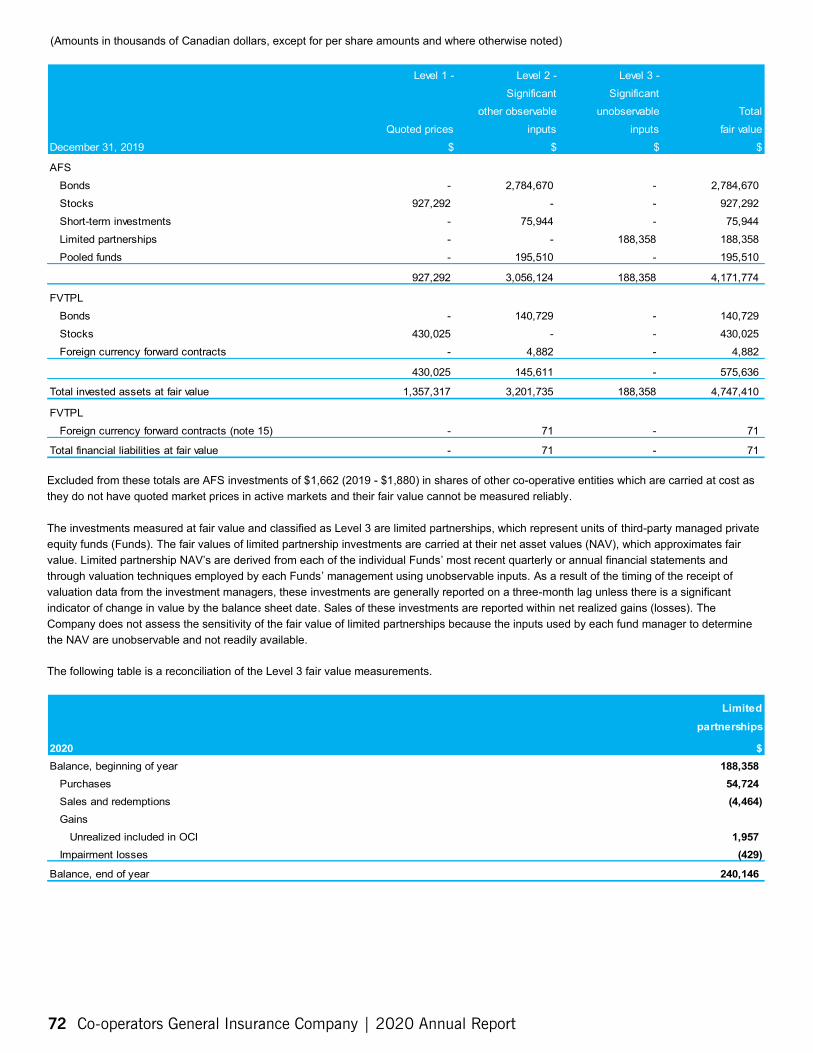
(Amounts in thousands of Canadian dollars, except for per share amounts and where otherwise noted)
Level 1 - Level 2 - Level 3 -Significant Significant
other observable unobservable Total Quoted prices inputs inputs fair value
December 31, 2019 $ $ $ $
AFS Bonds - 2,784,670 - 2,784,670 Stocks 927,292 - - 927,292 Short-term investments - 75,944 - 75,944 Limited partnerships - - 188,358 188,358 Pooled funds - 195,510 - 195,510
927,292 3,056,124 188,358 4,171,774
FVTPL Bonds - 140,729 - 140,729 Stocks 430,025 - - 430,025 Foreign currency forward contracts - 4,882 - 4,882
430,025 145,611 - 575,636
Total invested assets at fair value 1,357,317 3,201,735 188,358 4,747,410
FVTPL Foreign currency forward contracts (note 15) - 71 - 71
Total financial liabilities at fair value - 71 - 71
Excluded from these totals are AFS investments of $1,662 (2019 - $1,880) in shares of other co-operative entities which are carried at cost as they do not have quoted market prices in active markets and their fair value cannot be measured reliably.
The investments measured at fair value and classified as Level 3 are limited partnerships, which represent units of third-party managed private equity funds (Funds). The fair values of limited partnership investments are carried at their net asset values (NAV), which approximates fair value. Limited partnership NAV’s are derived from each of the individual Funds’ most recent quarterly or annual financial statements and through valuation techniques employed by each Funds’ management using unobservable inputs. As a result of the timing of the receipt of valuation data from the investment managers, these investments are generally reported on a three-month lag unless there is a significant indicator of change in value by the balance sheet date. Sales of these investments are reported within net realized gains (losses). The Company does not assess the sensitivity of the fair value of limited partnerships because the inputs used by each fund manager to determine the NAV are unobservable and not readily available.
The following table is a reconciliation of the Level 3 fair value measurements.
Limited partnerships
$ 2020 Balance, beginning of year 188,358
Purchases 54,724 Sales and redemptions (4,464) Gains
Unrealized included in OCI 1,957 Impairment losses (429)
Balance, end of year 240,146
72 Co-operators General Insurance Company | 2020 Annual Report
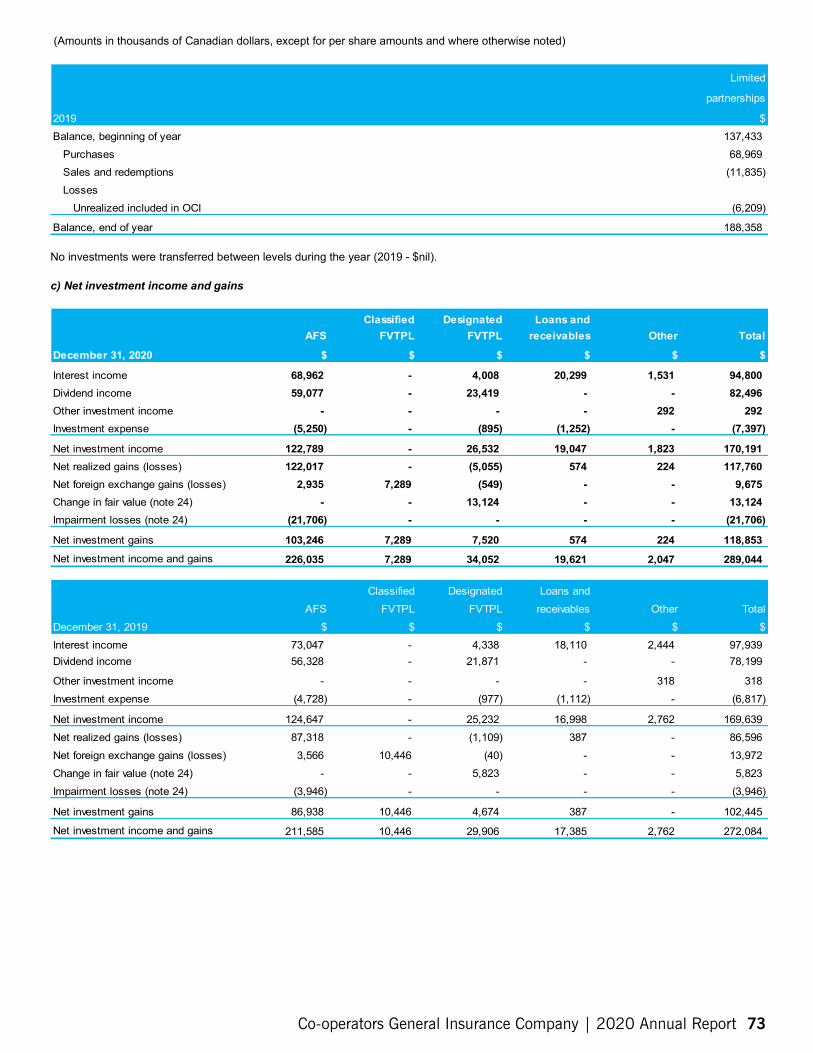
(6,209)
68, 969 ( 11,835)
188, 358
(Amounts in thousands of Canadian dollars, except for per share amounts and where otherwise noted)
Limited
partnerships
$ 2019 Balance, beginning of year
Purchases Sales and redemptions Losses
Unrealized included in OCI
Balance, end of year
137,433
No investments were transferred between levels during the year (2019 - $nil).
c) Net investment income and gains
Classified FVTPL
$
Designated FVTPL
$
Loans and receivables
$
AFS
$
Other
$
Total
$ December 31, 2020
Interest income 68,962 - 4,008 20,299 1,531 94,800 Dividend income 59,077 - 23,419 - - 82,496 Other investment income - - - - 292 292 Investment expense (5,250) - (895) (1,252) - (7,397)
Net investment income 122,789 - 26,532 19,047 1,823 170,191 Net realized gains (losses) 122,017 - (5,055) 574 224 117,760 Net foreign exchange gains (losses) 2,935 7,289 (549) - - 9,675 Change in fair value (note 24) - - 13,124 - - 13,124 Impairment losses (note 24) (21,706) - - - - (21,706)
Net investment gains 103,246 7,289 7,520 574 224 118,853 Net investment income and gains 226,035 7,289 34,052 19,621 2,047 289,044
Classified FVTPL
$
Designated FVTPL
$
Loans and receivables
$ AFS
$ Other
$ Total
$ December 31, 2019 Interest income 73,047 - 4,338 18,110 2,444 97,939 Dividend income 56,328 - 21,871 - - 78,199
Other investment income - - - - 318 318 Investment expense (4,728) - (977) (1,112) - (6,817)
Net investment income 124,647 - 25,232 16,998 2,762 169,639 Net realized gains (losses) 87,318 - (1,109) 387 - 86,596 Net foreign exchange gains (losses) 3,566 10,446 (40) - - 13,972 Change in fair value (note 24) - - 5,823 - - 5,823 Impairment losses (note 24) (3,946) - - - - (3,946)
Net investment gains 86,938 10,446 4,674 387 - 102,445
Net investment income and gains 211,585 10,446 29,906 17,385 2,762 272,084
Co-operators General Insurance Company | 2020 Annual Report 73
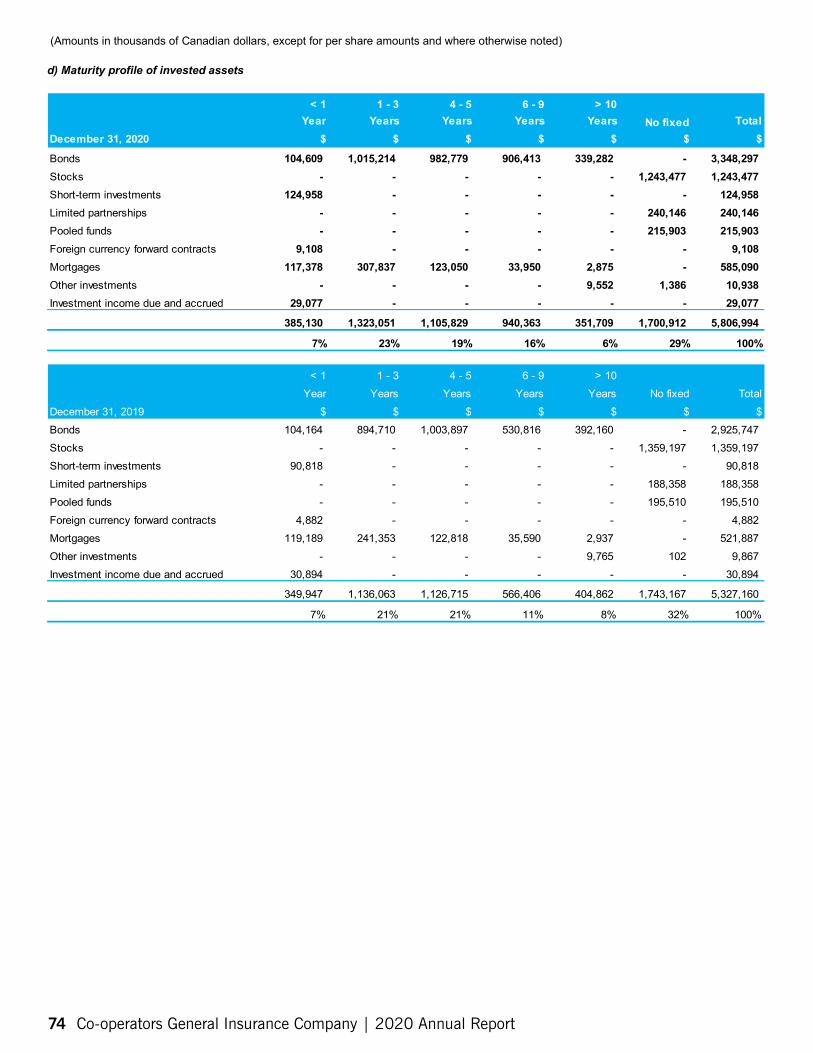
(Amounts in thousands of Canadian dollars, except for per share amounts and where otherwise noted)
d) Maturity profile of invested assets
< 1Year
$
1 - 3 Years
$
4 - 5 Years
$
6 - 9 Years
$
> 10 Years
$ Total
$ December 31, 2020 No fixed
$
Bonds 104,609 1,015,214 982,779 906,413 339,282 - 3,348,297 Stocks - - - - - 1,243,477 1,243,477 Short-term investments 124,958 - - - - - 124,958 Limited partnerships - - - - - 240,146 240,146 Pooled funds - - - - - 215,903 215,903 Foreign currency forward contracts 9,108 - - - - - 9,108 Mortgages 117,378 307,837 123,050 33,950 2,875 - 585,090 Other investments - - - - 9,552 1,386 10,938 Investment income due and accrued 29,077 - - - - - 29,077
385,130 1,323,051 1,105,829 940,363 351,709 1,700,912 5,806,994
7% 23% 19% 16% 6% 29% 100%
< 1Year
$
1 - 3 Years
$
4 - 5 Years
$
6 - 9 Years
$
> 10 Years
$ Total
$ December 31, 2019 No fixed
$ Bonds 104,164 894,710 1,003,897 530,816 392,160 - 2,925,747 Stocks - - - - - 1,359,197 1,359,197 Short-term investments 90,818 - - - - - 90,818 Limited partnerships - - - - - 188,358 188,358 Pooled funds - - - - - 195,510 195,510 Foreign currency forward contracts 4,882 - - - - - 4,882 Mortgages 119,189 241,353 122,818 35,590 2,937 - 521,887 Other investments - - - - 9,765 102 9,867 Investment income due and accrued 30,894 - - - - - 30,894
349,947 1,136,063 1,126,715 566,406 404,862 1,743,167 5,327,160
7% 21% 21% 11% 8% 32% 100%
74 Co-operators General Insurance Company | 2020 Annual Report
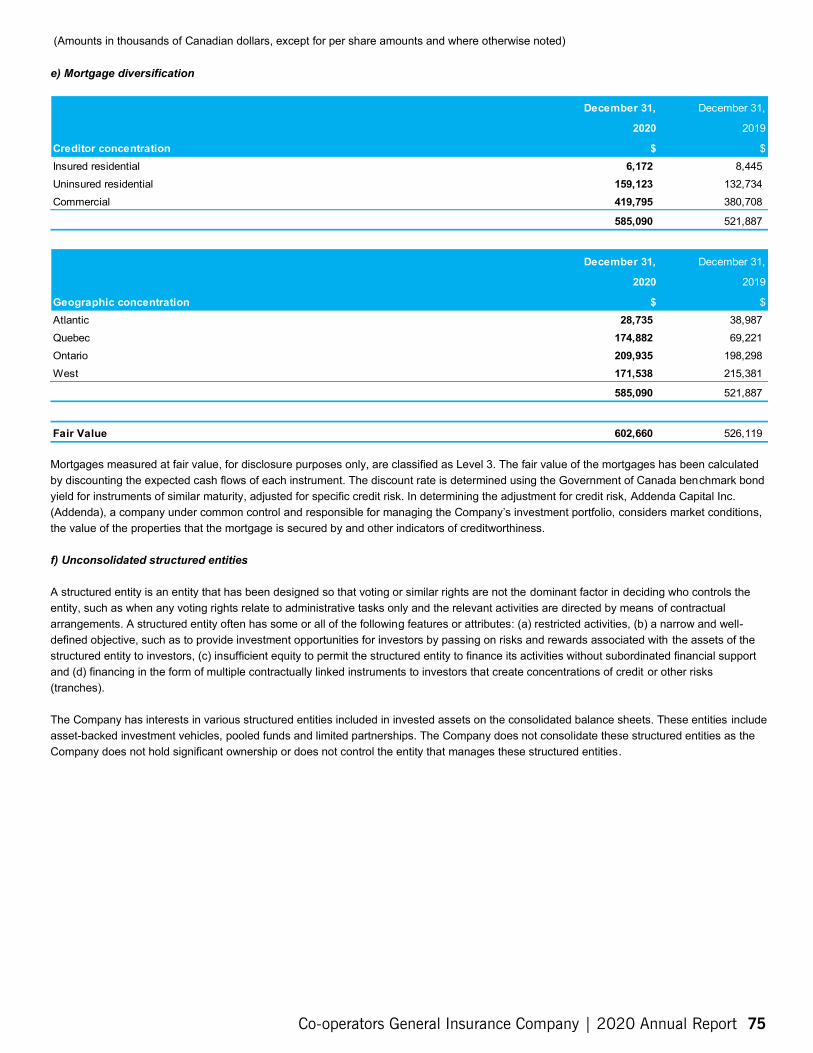
174,882 69,221
209,935 198,298
171,538 215,381
585,090 521,887
(Amounts in thousands of Canadian dollars, except for per share amounts and where otherwise noted)
e) Mortgage diversification
December 31,
2020
$
December 31,
2019
$ Creditor concentration Insured residential 6,172 8,445 Uninsured residential 159,123 132,734 Commercial 419,795 380,708
585,090 521,887
December 31,
2020
$
December 31,
2019
$ Geographic concentration Atlantic Quebec Ontario West
28,735 38,987
Fair Value 602,660 526,119
Mortgages measured at fair value, for disclosure purposes only, are classified as Level 3. The fair value of the mortgages has been calculated by discounting the expected cash flows of each instrument. The discount rate is determined using the Government of Canada benchmark bond yield for instruments of similar maturity, adjusted for specific credit risk. In determining the adjustment for credit risk, Addenda Capital Inc. (Addenda), a company under common control and responsible for managing the Company’s investment portfolio, considers market conditions, the value of the properties that the mortgage is secured by and other indicators of creditworthiness.
f) Unconsolidated structured entities
A structured entity is an entity that has been designed so that voting or similar rights are not the dominant factor in deciding who controls the entity, such as when any voting rights relate to administrative tasks only and the relevant activities are directed by means of contractual arrangements. A structured entity often has some or all of the following features or attributes: (a) restricted activities, (b) a narrow and well-defined objective, such as to provide investment opportunities for investors by passing on risks and rewards associated with the assets of the structured entity to investors, (c) insufficient equity to permit the structured entity to finance its activities without subordinated financial support and (d) financing in the form of multiple contractually linked instruments to investors that create concentrations of credit or other risks (tranches).
The Company has interests in various structured entities included in invested assets on the consolidated balance sheets. These entities include asset-backed investment vehicles, pooled funds and limited partnerships. The Company does not consolidate these structured entities as the Company does not hold significant ownership or does not control the entity that manages these structured entities.
Co-operators General Insurance Company | 2020 Annual Report 75
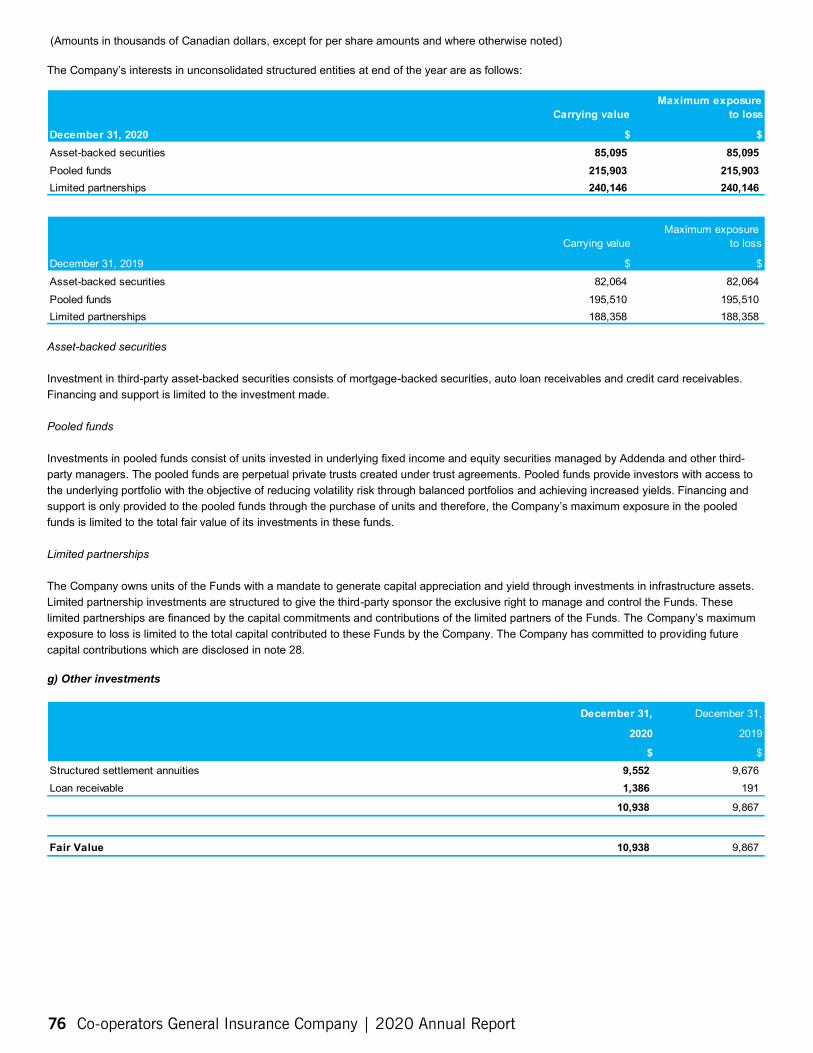
(Amounts in thousands of Canadian dollars, except for per share amounts and where otherwise noted)
The Company’s interests in unconsolidated structured entities at end of the year are as follows:
Carrying value
$
Maximum exposure to loss
$ December 31, 2020 Asset-backed securities 85,095 85,095 Pooled funds 215,903 215,903 Limited partnerships 240,146 240,146
Carrying value
$
Maximum exposure to loss
$ December 31, 2019 Asset-backed securities 82,064 82,064 Pooled funds 195,510 195,510 Limited partnerships 188,358 188,358
Asset-backed securities
Investment in third-party asset-backed securities consists of mortgage-backed securities, auto loan receivables and credit card receivables. Financing and support is limited to the investment made.
Pooled funds
Investments in pooled funds consist of units invested in underlying fixed income and equity securities managed by Addenda and other third-party managers. The pooled funds are perpetual private trusts created under trust agreements. Pooled funds provide investors with access to the underlying portfolio with the objective of reducing volatility risk through balanced portfolios and achieving increased yields. Financing and support is only provided to the pooled funds through the purchase of units and therefore, the Company’s maximum exposure in the pooled funds is limited to the total fair value of its investments in these funds.
Limited partnerships
The Company owns units of the Funds with a mandate to generate capital appreciation and yield through investments in infrastructure assets. Limited partnership investments are structured to give the third-party sponsor the exclusive right to manage and control the Funds. These limited partnerships are financed by the capital commitments and contributions of the limited partners of the Funds. The Company’s maximum exposure to loss is limited to the total capital contributed to these Funds by the Company. The Company has committed to providing future capital contributions which are disclosed in note 28.
g) Other investments
December 31,
2020
$
December 31,
2019
$ Structured settlement annuities 9,552 9,676 Loan receivable 1,386 191
10,938 9,867
Fair Value 10,938 9,867
76 Co-operators General Insurance Company | 2020 Annual Report
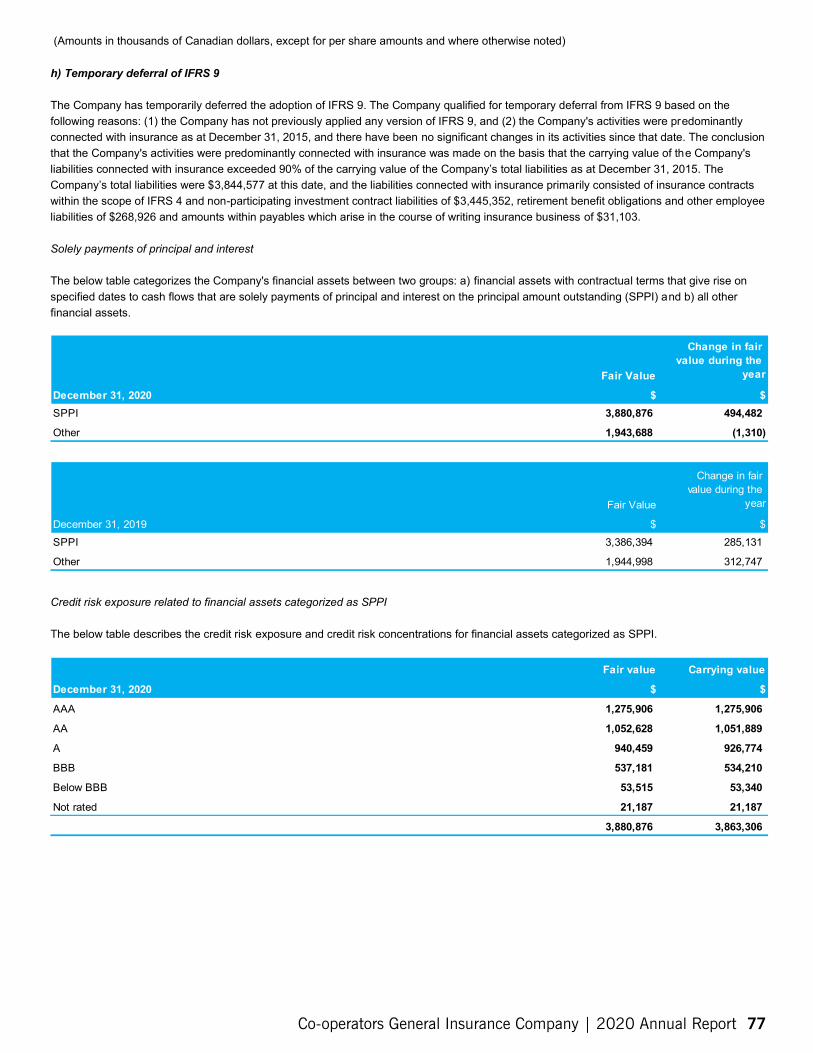
3, 880,876 494,482
1, 943,688 (1,310)
3, 386,394 285,131
1, 944,998 312,747
(Amounts in thousands of Canadian dollars, except for per share amounts and where otherwise noted)
h) Temporary deferral of IFRS 9
The Company has temporarily deferred the adoption of IFRS 9. The Company qualified for temporary deferral from IFRS 9 based on the following reasons: (1) the Company has not previously applied any version of IFRS 9, and (2) the Company's activities were predominantly connected with insurance as at December 31, 2015, and there have been no significant changes in its activities since that date. The conclusion that the Company's activities were predominantly connected with insurance was made on the basis that the carrying value of the Company's liabilities connected with insurance exceeded 90% of the carrying value of the Company’s total liabilities as at December 31, 2015. The Company’s total liabilities were $3,844,577 at this date, and the liabilities connected with insurance primarily consisted of insurance contracts within the scope of IFRS 4 and non-participating investment contract liabilities of $3,445,352, retirement benefit obligations and other employee liabilities of $268,926 and amounts within payables which arise in the course of writing insurance business of $31,103.
Solely payments of principal and interest
The below table categorizes the Company's financial assets between two groups: a) financial assets with contractual terms that give rise on specified dates to cash flows that are solely payments of principal and interest on the principal amount outstanding (SPPI) and b) all other financial assets.
Fair Value
$
Change in fair value during the
year
$ December 31, 2020 SPPI
Other
Change in fair value during the
year
$
Fair Value
$ December 31, 2019 SPPI
Other
Credit risk exposure related to financial assets categorized as SPPI
The below table describes the credit risk exposure and credit risk concentrations for financial assets categorized as SPPI.
Fair value
$
Carrying value
$ December 31, 2020
AAA 1,275,906 1,275,906
AA 1,052,628 1,051,889
A 940,459 926,774
BBB 537,181 534,210
Below BBB 53,515 53,340
Not rated 21,187 21,187
3,880,876 3,863,306
Co-operators General Insurance Company | 2020 Annual Report 77
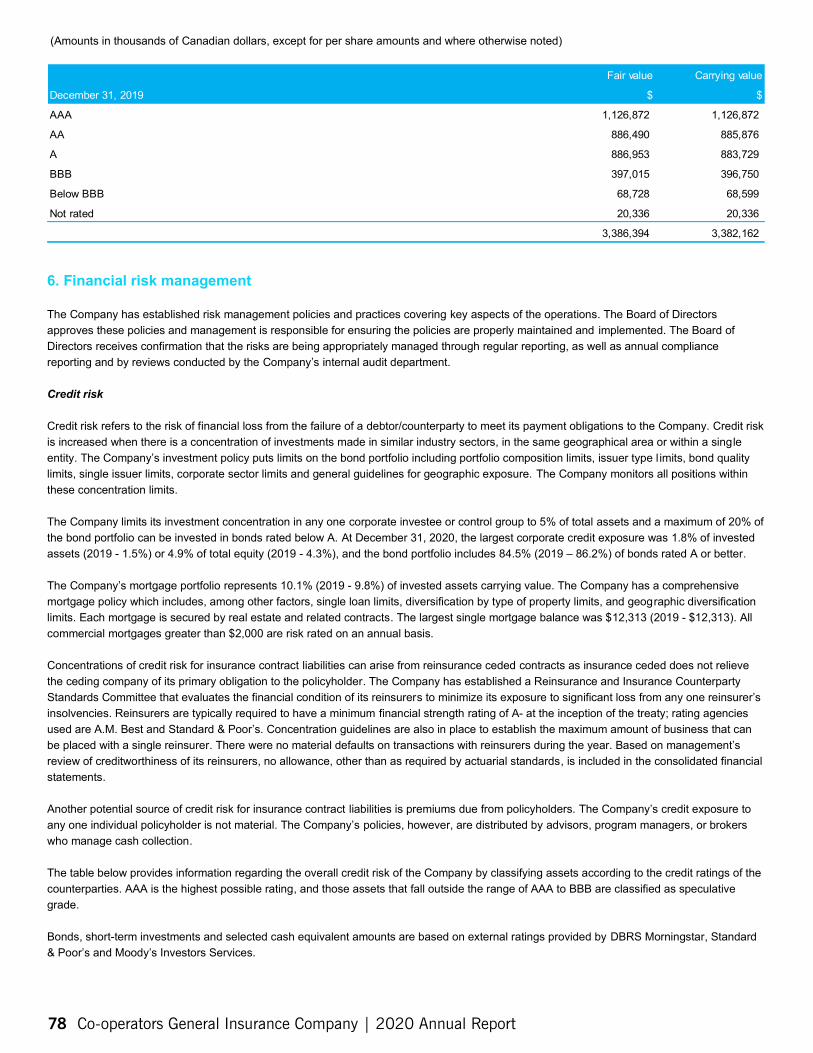
(Amounts in thousands of Canadian dollars, except for per share amounts and where otherwise noted)
Fair value
$
Carrying value
$ December 31, 2019
AAA 1,126,872 1,126,872
AA 886,490 885,876
A 886,953 883,729
BBB 397,015 396,750
Below BBB 68,728 68,599
Not rated 20,336 20,336
3,386,394 3,382,162
6. Financial risk management
The Company has established risk management policies and practices covering key aspects of the operations. The Board of Directors approves these policies and management is responsible for ensuring the policies are properly maintained and implemented. The Board of Directors receives confirmation that the risks are being appropriately managed through regular reporting, as well as annual compliance reporting and by reviews conducted by the Company’s internal audit department.
Credit risk
Credit risk refers to the risk of financial loss from the failure of a debtor/counterparty to meet its payment obligations to the Company. Credit risk is increased when there is a concentration of investments made in similar industry sectors, in the same geographical area or within a single entity. The Company’s investment policy puts limits on the bond portfolio including portfolio composition limits, issuer type l imits, bond quality limits, single issuer limits, corporate sector limits and general guidelines for geographic exposure. The Company monitors all positions within these concentration limits.
The Company limits its investment concentration in any one corporate investee or control group to 5% of total assets and a maximum of 20% of the bond portfolio can be invested in bonds rated below A. At December 31, 2020, the largest corporate credit exposure was 1.8% of invested assets (2019 - 1.5%) or 4.9% of total equity (2019 - 4.3%), and the bond portfolio includes 84.5% (2019 – 86.2%) of bonds rated A or better.
The Company’s mortgage portfolio represents 10.1% (2019 - 9.8%) of invested assets carrying value. The Company has a comprehensive mortgage policy which includes, among other factors, single loan limits, diversification by type of property limits, and geographic diversification limits. Each mortgage is secured by real estate and related contracts. The largest single mortgage balance was $12,313 (2019 - $12,313). All commercial mortgages greater than $2,000 are risk rated on an annual basis.
Concentrations of credit risk for insurance contract liabilities can arise from reinsurance ceded contracts as insurance ceded does not relieve the ceding company of its primary obligation to the policyholder. The Company has established a Reinsurance and Insurance Counterparty Standards Committee that evaluates the financial condition of its reinsurers to minimize its exposure to significant loss from any one reinsurer’s insolvencies. Reinsurers are typically required to have a minimum financial strength rating of A- at the inception of the treaty; rating agencies used are A.M. Best and Standard & Poor’s. Concentration guidelines are also in place to establish the maximum amount of business that can be placed with a single reinsurer. There were no material defaults on transactions with reinsurers during the year. Based on management’s review of creditworthiness of its reinsurers, no allowance, other than as required by actuarial standards, is included in the consolidated financial statements.
Another potential source of credit risk for insurance contract liabilities is premiums due from policyholders. The Company’s credit exposure to any one individual policyholder is not material. The Company’s policies, however, are distributed by advisors, program managers, or brokers who manage cash collection.
The table below provides information regarding the overall credit risk of the Company by classifying assets according to the credit ratings of the counterparties. AAA is the highest possible rating, and those assets that fall outside the range of AAA to BBB are classified as speculative grade.
Bonds, short-term investments and selected cash equivalent amounts are based on external ratings provided by DBRS Morningstar, Standard & Poor’s and Moody’s Investors Services.
78 Co-operators General Insurance Company | 2020 Annual Report
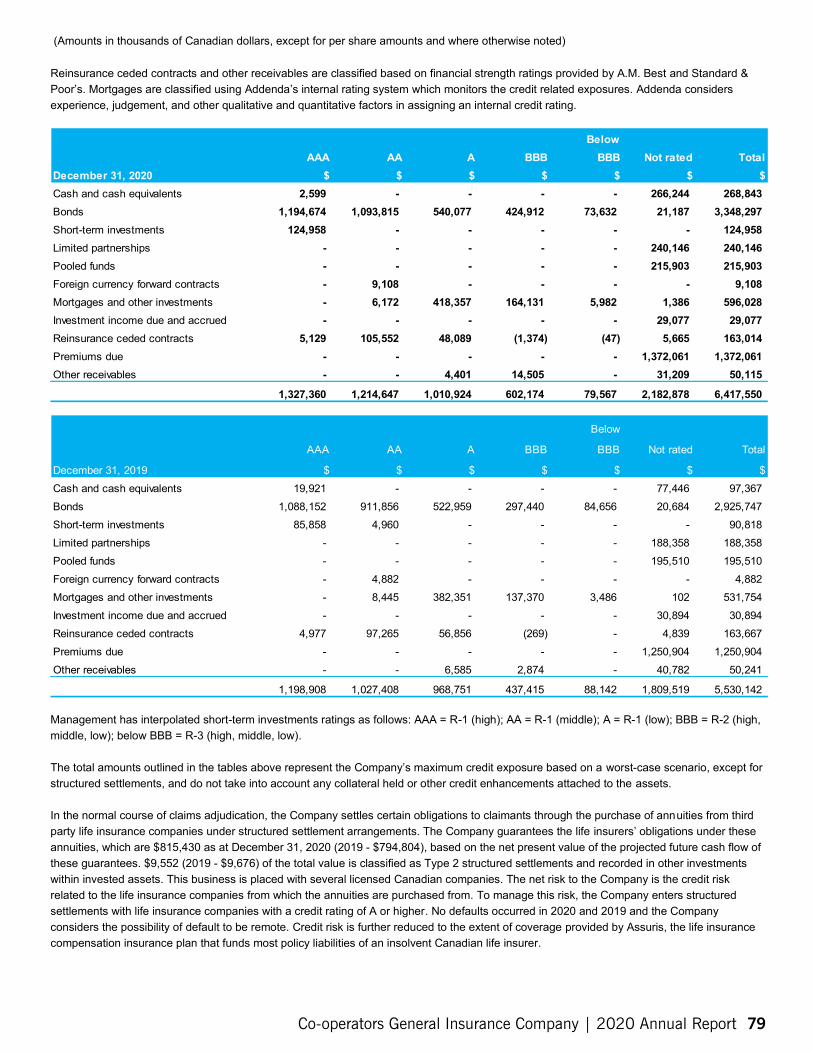
(Amounts in thousands of Canadian dollars, except for per share amounts and where otherwise noted)
Reinsurance ceded contracts and other receivables are classified based on financial strength ratings provided by A.M. Best and Standard & Poor’s. Mortgages are classified using Addenda’s internal rating system which monitors the credit related exposures. Addenda considers experience, judgement, and other qualitative and quantitative factors in assigning an internal credit rating.
Below BBB
$ AAA
$ AA
$ A $
BBB $
Not rated $
Total $ December 31, 2020
Cash and cash equivalents 2,599 - - - - 266,244 268,843 Bonds 1,194,674 1,093,815 540,077 424,912 73,632 21,187 3,348,297 Short-term investments 124,958 - - - - - 124,958 Limited partnerships - - - - - 240,146 240,146 Pooled funds - - - - - 215,903 215,903 Foreign currency forward contracts - 9,108 - - - - 9,108 Mortgages and other investments - 6,172 418,357 164,131 5,982 1,386 596,028 Investment income due and accrued - - - - - 29,077 29,077 Reinsurance ceded contracts 5,129 105,552 48,089 (1,374) (47) 5,665 163,014 Premiums due - - - - - 1,372,061 1,372,061 Other receivables - - 4,401 14,505 - 31,209 50,115
1,327,360 1,214,647 1,010,924 602,174 79,567 2,182,878 6,417,550
Below
BBB
$
AAA
$
AA
$
A
$
BBB
$
Not rated
$
Total
$ December 31, 2019 Cash and cash equivalents 19,921 - - - - 77,446 97,367 Bonds 1,088,152 911,856 522,959 297,440 84,656 20,684 2,925,747 Short-term investments 85,858 4,960 - - - - 90,818 Limited partnerships - - - - - 188,358 188,358 Pooled funds - - - - - 195,510 195,510 Foreign currency forward contracts - 4,882 - - - - 4,882 Mortgages and other investments - 8,445 382,351 137,370 3,486 102 531,754 Investment income due and accrued - - - - - 30,894 30,894 Reinsurance ceded contracts 4,977 97,265 56,856 (269) - 4,839 163,667 Premiums due - - - - - 1,250,904 1,250,904 Other receivables - - 6,585 2,874 - 40,782 50,241
1,198,908 1,027,408 968,751 437,415 88,142 1,809,519 5,530,142
Management has interpolated short-term investments ratings as follows: AAA = R-1 (high); AA = R-1 (middle); A = R-1 (low); BBB = R-2 (high, middle, low); below BBB = R-3 (high, middle, low).
The total amounts outlined in the tables above represent the Company’s maximum credit exposure based on a worst-case scenario, except for structured settlements, and do not take into account any collateral held or other credit enhancements attached to the assets.
In the normal course of claims adjudication, the Company settles certain obligations to claimants through the purchase of annuities from third party life insurance companies under structured settlement arrangements. The Company guarantees the life insurers’ obligations under these annuities, which are $815,430 as at December 31, 2020 (2019 - $794,804), based on the net present value of the projected future cash flow of these guarantees. $9,552 (2019 - $9,676) of the total value is classified as Type 2 structured settlements and recorded in other investments within invested assets. This business is placed with several licensed Canadian companies. The net risk to the Company is the credit risk related to the life insurance companies from which the annuities are purchased from. To manage this risk, the Company enters structured settlements with life insurance companies with a credit rating of A or higher. No defaults occurred in 2020 and 2019 and the Company considers the possibility of default to be remote. Credit risk is further reduced to the extent of coverage provided by Assuris, the life insurance compensation insurance plan that funds most policy liabilities of an insolvent Canadian life insurer.
Co-operators General Insurance Company | 2020 Annual Report 79
(Amounts in thousands of Canadian dollars, except for per share amounts and where otherwise noted)
The Company participates in a securities lending program managed by a federally regulated financial institution whereby the Company lends securities it owns to other financial institutions to allow them to meet delivery commitments. The Company receives securities of superior credit quality and value as collateral for securities loaned. Securities with a fair value of $904,779 (2019 - $849,524) were received as collateral. The collateral received has not been recorded in the Company’s consolidated balance sheet.
The Company is the assigned beneficiary of collateral consisting of cash, trust accounts and letters of credit totaling $102,090 as at December 31, 2020 (2019 - $112,652) as security from unlicensed reinsurers. This collateral is held in support of policy liabilities of $56,691 as at December 31, 2020, (2019 - $74,309) and could be used should these reinsurers be unable to meet their obligations. The cash portion of the collateral $17,593 (2019 - $15,171) has been recorded in the Company’s consolidated balance sheet.
Market risk
Market risk is the risk that the fair value or future cash flows of a financial instrument will fluctuate because of changes in market prices. Market risk is comprised of three types of risks: equity risk, currency risk and interest rate risk.
a) Equity risk
Equity risk arises whenever financial results are adversely affected by changes in the capital markets.
An investment policy is in place and its application is monitored by the Board of Directors on a quarterly basis. Diversification techniques are employed to minimize risk. Policies limit investments in any entity or group of related entities to a maximum of 5% of the Company’s assets.
The Company’s stock portfolio is benchmarked to the indices noted in the table below. A 10% movement in the indices, with all other variables held constant, would have the following estimated effect on the fair values and OCI before taxes of the Company’s stock holdings.
Stock Portfolio Benchmark
December 31, 2020 AFS
$
December 31, 2019 AFS
$
Canadian common S&P/TSX Composite Index 57,969 69,716 U.S. equities S&P 500 Index (CDN $) 17,825 18,773
b) Currency risk
Currency risk is the risk that the value of the foreign denominated financial instruments that is not offset by corresponding liabilities will fluctuate as a result of changes in foreign exchange rates.
The majority of the Company’s currency risk is related to its investment holdings. Policies limit investments in foreign denominated securities to a maximum value of 15% of invested assets. A 10% change in the value of the foreign currency would be offset in net income by a change in the fair value of foreign currency forward contract hedges of $19,672 (2019 - $20,147). A 10% change in the value of the foreign currency would affect the fair value of investments by $42,274 (2019 - $37,332). For AFS foreign denominated investments, a 10% change in the value of the foreign currency would result in an increase or decrease in OCI of $31,198 (2019 - $27,253).
The Company mitigates a portion of currency risk by buying or selling foreign exchange forward contracts. Foreign exchange forward contracts are commitments to buy or sell foreign currencies for delivery at a specified date in the future at a fixed rate. Foreign exchange forward contracts are transacted in over-the-counter markets. Foreign exchange forward contracts with positive fair values are included in invested assets (note 5) and those with negative fair values are included in provisions and other liabilities (note 15).
The counterparty risk of default for these derivative financial instruments is limited to their positive replacement cost, which is substantially lower than their notional amount. The replacement cost of over-the-counter derivative financial instruments is an estimate and is determined using valuation models that incorporate prevailing foreign exchange rates and prices on underlying instruments with similar maturities and characteristics. The replacement cost reflects the estimated amount that the Company would receive, or might have to pay, to terminate the contracts as at December 31, 2020. The Company would receive $8,184 to terminate the contracts as at December 31, 2020 (2019 - receive $4,811). The maturity date for the Company’s contracts range from January 29 to April 15, 2021. The notional amounts of the foreign currency forward contracts total $265,001 (2019 - $252,625). The counterparties are federally regulated financial institutions.
OSFI requires disclosure of the replacement cost, credit equivalent amount and the risk-weighted equivalent for each type of derivative instrument. The credit equivalent amount is the replacement cost of an instrument plus an additional amount representing potential future credit exposure, as defined by OSFI. The risk-weighted equivalent is determined by applying a risk-weighted factor to the credit equivalent amount based on OSFI guidelines.
80 Co-operators General Insurance Company | 2020 Annual Report
9,199
Liquidity risk
- -
(Amounts in thousands of Canadian dollars, except for per share amounts and where otherwise noted)
The credit equivalent amount and risk-weighted equivalent by t ype of derivative instrument is as follows:
December 31, 2020 December 31, 2019 Credit Equivalent Risk weighted Credit Equivalent Risk weighted
Amount Equivalent Amount Equivalent $ $ $ $
Foreign currency forward contracts 46 4,931 24
Exposure to currency fluctuations on insurance contract liabilities is not considered to be material.
c) Interest rate risk
Interest rate risk is the risk that the fair value or future cash flows of a financial instrument will fluctuate because of changes in market interest rates. The Company is significantly exposed to changes in interest rates. Movements in short-term and long-term interest rates, including changes in credit spreads, cause changes in the realized and unrealized gains and losses.
To manage this risk, historical data and current information that profiles the ultimate claims settlement pattern by class of insurance, is used as a basis to develop a Board-approved and monitored investment policy and strategy. The policy and strategy is based upon prudence, regulatory guidelines and claims settlement patterns by product line. The policy provides conservative investment limits which balance the Company’s long-term focus with market opportunities as they arise. This is achieved by investing in a diversified mix of securities and by shifting between asset classes as trends in capital markets develop.
Interest rate risk also causes income volatility as a result of the discounting of the unpaid claims and adjustment expenses on the projected portfolio yield of the assets backing the claims liabilities. Changes in the value of the unpaid claims and adjustment expenses resulting from fluctuations in interest rates flow through claims and adjustment expenses in the consolidated statements of income. The corresponding change in asset values will either flow through the consolidated statements of income or through OCI based on the designation of assets held to settle future claims obligations. If the assets backing the liabilities are classified as AFS, the gains and losses due to interest rate fluctuations flow through OCI. If the assets backing the liabilities are designated under the fair value option as FVTPL, the gains and losses due to interest rate fluctuations flow through the consolidated statements of income.
To mitigate the impact of interest rate risk, the Company utilizes an asset liability management (ALM) strategy. A portion of the assets backing the Company’s unpaid claims and adjustment expense liabilities are designated as FVTPL under the fair value option with the objective of offsetting a targeted proportion of the financial impact of interest rate changes and avoiding an accounting mismatch between the impact of interest rate changes on assets and liabilities in the consolidated statements of income.
A 1% movement in the interest rate, with all other variables held constant, would have the following estimated effect on the fair values, and net income or OCI before taxes, of the Company’s holdings:
AFS $
FVTPL $
AFS $
FVTPL $
December 31, 2020 December 31, 2019
Bonds 160,606 7,391 131,949 7,097 Canadian preferred stocks - 13,695 - 16,882 Pooled funds 20,574 - 17,682 -
Liquidity risk refers to the ability of the Company to access sufficient funds to meet financial obligations as they fall due. The Company’s obligations arise as a result of claims, contractual commitments, or other outflows. The Company has no material commitments for capital expenditures and there is normally no need for such expenditures in the normal course of business.
Claims, contractual commitments and other outflows payments are funded by current revenue cash flow which normally exceeds cash requirements. At December 31, 2020, the Company had $268,843 (2019 - $97,367) of cash and cash equivalents, and $124,958 (2019 -$90,818) of short-term investments. In addition, the Company had a combination of lines of credit and a liquid investment portfolio. Together, the bond portion of the portfolio, which consists primarily of Canadian fixed-income securities issued or guaranteed by governments and investment grade corporate bonds, and publicly traded Canadian and U.S. equities had a December 31, 2020 fair value of $4,495,293 (2019 -$4,177,724).
Co-operators General Insurance Company | 2020 Annual Report 81
300, 892 - - - - 300, 892 3,192,301 1, 066,453 541, 869 321,999 58, 263 5,180,885
51, 175 44, 185 12, 803 27, 900 45, 374 181, 437
11, 019 10, 194 - - - 21, 213
7, 037 500 - - - 7, 537 923 - - - - 923 1, 416 657 8 - - 2, 081
3,564,763 1, 121,989 554, 680 349,899 103, 637 5, 694,968
25, 400 8, 490 - - - 33,890
8, 631 6, 674 61 - - 15, 366
(Amounts in thousands of Canadian dollars, except for per share amounts and where otherwise noted)
Along with internally generated funds, the Company has credit facilities of $19,000 (2019 - $19,000) that provide it with additional financial flexibility to fulfill cash requirements on an ongoing basis. The Company had utilized $nil (2019 - $nil) as at the balance sheet date.
The Company’s estimated maturities of its financial liabilities, insurance contract liabilities and other commitments are shown in the following table on an undiscounted basis. Financial liabilities and contractual commitments are presented based on their estimated contractual maturities. Insurance contacts and provisions and other liabilities are presented based on expectations of the timing of future cash flows and/or the duration of the contract.
Contractual commitments are not reported on the consolidated balance sheet.
< 1Year
$
1 - 3 Years
$
4 - 5 Years
$
6 - 9 Years
$
> 10 Years
$
Total
$ December 31, 2020 Accounts payable and accrued charges Insurance contract liabilities Provisions and other liabilities
Provision for advisor transition commissions Advisor transition commission payable Other provisions Foreign currency forward contracts Other liabilities
Contractual commitments Mortgage funding
< 1Year
$
1 - 3 Years
$
4 - 5 Years
$
6 - 9 Years
$
> 10 Years
$ Total
$ December 31, 2019 Accounts payable and accrued charges 324,665 - - - - 324,665 Income taxes payable 74,147 - - - - 74,147 Insurance contract liabilities 2,970,593 980,413 488,732 278,105 56,333 4,774,176 Provisions and other liabilities
Provision for advisor transition commissions 45,737 42,440 12,833 24,255 40,816 166,081 Advisor transition commission payable 9,537 8,214 - - - 17,751 Other provisions 8,267 500 - - - 8,767 Foreign currency forward contracts 71 - - - - 71 Other liabilities 1,619 822 160 - - 2,601
3,434,636 1,032,389 501,725 302,360 97,149 5,368,259
Contractual commitments Mortgage funding
The mortgage funding commitments have interest rates ranging from 2.37% to 5.95% (2019 – 3.54% to 6.45%).
7. Insurance risk management
a) Nature of risks arising from insurance contract liabilities
There is uncertainty whether an insured event occurs and to what degree for each policy. By the very nature of an insurance contract, the risk is random and therefore unpredictable. Insurance companies accept the transfer of uncertainty from policyholders and seek to add value through the aggregation and management of insurance risk. The Company is at risk for losses in the event that incomplete or incorrect assumptions or information are used when pricing, issuing or reserving for insurance products.
82 Co-operators General Insurance Company | 2020 Annual Report
(Amounts in thousands of Canadian dollars, except for per share amounts and where otherwise noted)
The principal risk to the Company under its insurance contracts is that the actual claims and benefit payments arising may exceed the carrying amount of the insurance liabilities because the frequency and/or severity of the actual claims were greater than expected.
As a property and casualty insurer, catastrophes could have a significant effect on the Company’s operating results and financial condition. Catastrophic loss risk is the exposure to loss resulting from multiple claims arising out of a single catastrophic event. Potential events include perils such as earthquake, tornado, wind, hail, flood or fire.
Underwriting risk, claims risk and product design and pricing risk are also important to the proper management of insurance r isk. Underwriting risk is the exposure to financial loss resulting from the selection and approval of risks to be insured or the inappropriate application of underwriting rules to risks being insured. Claims risk is the exposure to financial loss resulting from a change in the frequency and/or severity of claims; inadequate claim adjudication; or inappropriate claim settlement. Product design and pricing risk is the exposure to financial loss from transacting insurance business where costs and liabilities experienced in respect of a product line exceed the expectation in pricing it. Policies, processes and other internal controls have been established to manage these risks to within tolerable levels.
In managing certain insurance risks, reinsurance is employed by the Company; however, the Company is still exposed to reinsurance risk. Reinsurance risk is the risk of financial loss due to inadequacies in reinsurance coverage or the default of a reinsurer. If a reinsurer fails to pay a claim for any reason, the Company remains liable for the payment to the policyholder.
Other external factors play a role in the Company’s management of insurance risk. Property and casualty insurers are subject to significant regulation by governments. As in any regulated industry, it is possible that future regulatory changes or developments may prevent the Company from raising rates or taking other actions to enhance operating results. As well, future regulatory changes, novel or unexpected judicial interpretations or political developments could impact the ultimate amount of claims that must be paid out. Macroeconomic risks such as fluctuations in the long-term portfolio yields used in the valuation of the Company’s insurance contract liabilities or changes in the Company’s forecasts of expected inflation levels are also important considerations in developing the estimated liability.
b) Sources of uncertainty and processes used to determine assumptions for unpaid claims and adjustment expenses
The Company establishes an unpaid claims and adjustment expense provision which includes an amount to settle all reported claims and an IBNR provision.
Individual reported claims estimates are set by internal claims adjusters on a case-by-case basis. These specialists apply their knowledge and expertise, after taking available information regarding the circumstances of the claim into account, to set individual case reserve estimates. The Company has documented policy and procedures by which case reserve estimates are set. The claims reserving strategy and monitoring of their application and effectiveness falls under the accountability of the Company’s National Claims department except for travel insurance, which is completed by the MGU’s actuarial department. Additional monitoring is provided over the travel insurance through a quarterly meeting of the Canada Statutory Reserve Committee, which includes members of the Company and the MGU. The claims reserves are reviewed by the committee, and the Company’s actuarial department subsequently performs a quarterly peer review.
The IBNR is a provision intended to cover future development on both reported claims and claims that have occurred but have yet to be reported. Uncertainty exists on reported claims in that all information may not be available at the valuation date. Claims that have occurred may not be reported to the Company immediately; therefore, estimates are made as to their value, an amount which may take years to finally determine.
The IBNR provision is an estimate that is determined using a range of accepted actuarial claims projection techniques, such as the Chain Ladder and Bornhuetter-Ferguson methods. These methods are designed to determine the ultimate cost of all unpaid claims and adjustment expenses, including both reported and note yet reported claims, and use assumptions for expected loss ratios, loss development patterns, claims frequency and severity trends, exposure, expected reinsurance recoveries and trends. In situations where there has been a significant change in the environment or underlying risks, the historical data is adjusted to account for expected differences.
Co-operators General Insurance Company | 2020 Annual Report 83
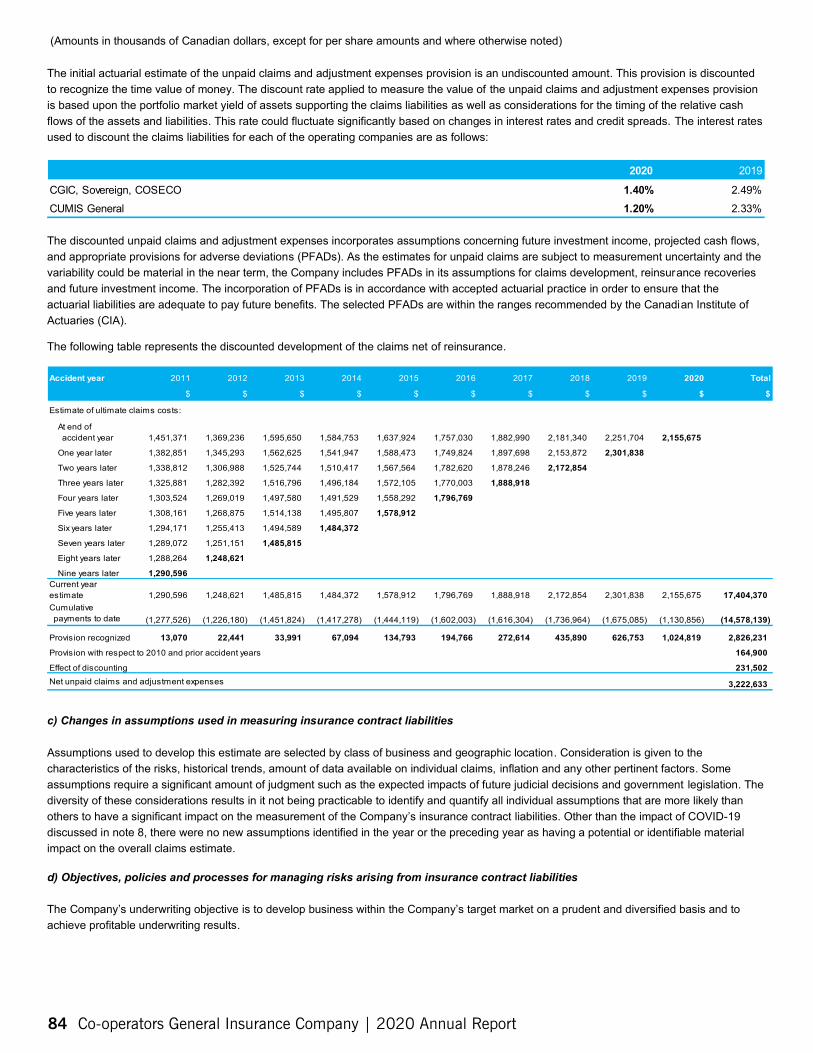
(Amounts in thousands of Canadian dollars, except for per share amounts and where otherwise noted)
The initial actuarial estimate of the unpaid claims and adjustment expenses provision is an undiscounted amount. This provision is discounted to recognize the time value of money. The discount rate applied to measure the value of the unpaid claims and adjustment expenses provision is based upon the portfolio market yield of assets supporting the claims liabilities as well as considerations for the timing of the relative cash flows of the assets and liabilities. This rate could fluctuate significantly based on changes in interest rates and credit spreads. The interest rates used to discount the claims liabilities for each of the operating companies are as follows:
2020 2019
CGIC, Sovereign, COSECO 1.40% 2.49% CUMIS General 1.20% 2.33%
The discounted unpaid claims and adjustment expenses incorporates assumptions concerning future investment income, projected cash flows, and appropriate provisions for adverse deviations (PFADs). As the estimates for unpaid claims are subject to measurement uncertainty and the variability could be material in the near term, the Company includes PFADs in its assumptions for claims development, reinsurance recoveries and future investment income. The incorporation of PFADs is in accordance with accepted actuarial practice in order to ensure that the actuarial liabilities are adequate to pay future benefits. The selected PFADs are within the ranges recommended by the Canadian Institute of Actuaries (CIA).
The following table represents the discounted development of the claims net of reinsurance.
Accident year 2011
$
2012
$
2013
$
2014
$
2015
$
2016
$
2017
$
2018
$
2019
$
2020
$
Total
$
Estimate of ultimate claims costs:
At end of accident year 1,451,371 1,369,236 1,595,650 1,584,753 1,637,924 1,757,030 1,882,990 2,181,340 2,251,704 2,155,675
One year later 1,382,851 1,345,293 1,562,625 1,541,947 1,588,473 1,749,824 1,897,698 2,153,872 2,301,838
Two years later 1,338,812 1,306,988 1,525,744 1,510,417 1,567,564 1,782,620 1,878,246 2,172,854
Three years later 1,325,881 1,282,392 1,516,796 1,496,184 1,572,105 1,770,003 1,888,918
Four years later 1,303,524 1,269,019 1,497,580 1,491,529 1,558,292 1,796,769
Five years later 1,308,161 1,268,875 1,514,138 1,495,807 1,578,912
Six years later 1,294,171 1,255,413 1,494,589 1,484,372
Seven years later 1,289,072 1,251,151 1,485,815
Eight years later 1,288,264 1,248,621
Nine years later 1,290,596 Current year estimate 1,290,596 1,248,621 1,485,815 1,484,372 1,578,912 1,796,769 1,888,918 2,172,854 2,301,838 2,155,675 17,404,370 Cumulative payments to date (1,277,526) (1,226,180) (1,451,824) (1,417,278) (1,444,119) (1,602,003) (1,616,304) (1,736,964) (1,675,085) (1,130,856) (14,578,139)
Provision recognized 13,070 22,441 33,991 67,094 134,793 194,766 272,614 435,890 626,753 1,024,819 2,826,231
Provision with respect to 2010 and prior accident years 164,900
Effect of discounting 231,502 Net unpaid claims and adjustment expenses 3,222,633
c) Changes in assumptions used in measuring insurance contract liabilities
Assumptions used to develop this estimate are selected by class of business and geographic location. Consideration is given to the characteristics of the risks, historical trends, amount of data available on individual claims, inflation and any other pertinent factors. Some assumptions require a significant amount of judgment such as the expected impacts of future judicial decisions and government legislation. The diversity of these considerations results in it not being practicable to identify and quantify all individual assumptions that are more likely than others to have a significant impact on the measurement of the Company’s insurance contract liabilities. Other than the impact of COVID-19 discussed in note 8, there were no new assumptions identified in the year or the preceding year as having a potential or identifiable material impact on the overall claims estimate.
d) Objectives, policies and processes for managing risks arising from insurance contract liabilities
The Company’s underwriting objective is to develop business within the Company’s target market on a prudent and diversified basis and to achieve profitable underwriting results.
84 Co-operators General Insurance Company | 2020 Annual Report
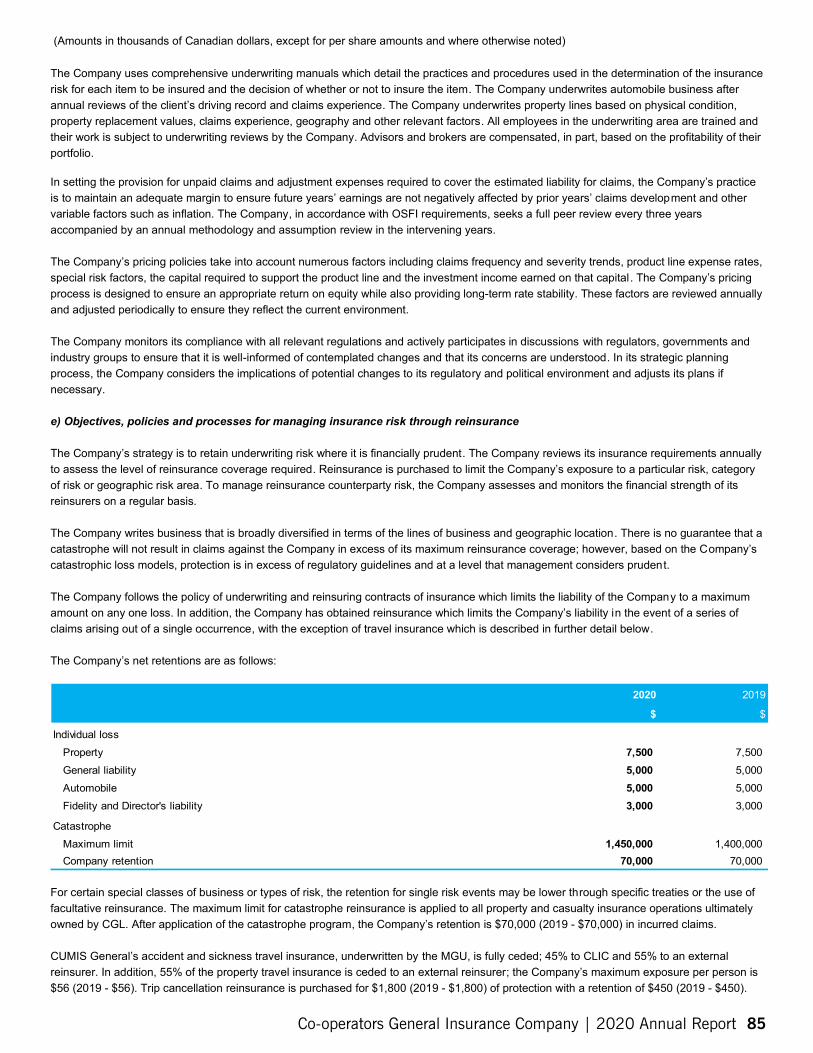
(Amounts in thousands of Canadian dollars, except for per share amounts and where otherwise noted)
The Company uses comprehensive underwriting manuals which detail the practices and procedures used in the determination of the insurance risk for each item to be insured and the decision of whether or not to insure the item. The Company underwrites automobile business after annual reviews of the client’s driving record and claims experience. The Company underwrites property lines based on physical condition, property replacement values, claims experience, geography and other relevant factors. All employees in the underwriting area are trained and their work is subject to underwriting reviews by the Company. Advisors and brokers are compensated, in part, based on the profitability of their portfolio.
In setting the provision for unpaid claims and adjustment expenses required to cover the estimated liability for claims, the Company’s practice is to maintain an adequate margin to ensure future years’ earnings are not negatively affected by prior years’ claims development and other variable factors such as inflation. The Company, in accordance with OSFI requirements, seeks a full peer review every three years accompanied by an annual methodology and assumption review in the intervening years.
The Company’s pricing policies take into account numerous factors including claims frequency and severity trends, product line expense rates, special risk factors, the capital required to support the product line and the investment income earned on that capital. The Company’s pricing process is designed to ensure an appropriate return on equity while also providing long-term rate stability. These factors are reviewed annually and adjusted periodically to ensure they reflect the current environment.
The Company monitors its compliance with all relevant regulations and actively participates in discussions with regulators, governments and industry groups to ensure that it is well-informed of contemplated changes and that its concerns are understood. In its strategic planning process, the Company considers the implications of potential changes to its regulatory and political environment and adjusts its plans if necessary.
e) Objectives, policies and processes for managing insurance risk through reinsurance
The Company’s strategy is to retain underwriting risk where it is financially prudent. The Company reviews its insurance requirements annually to assess the level of reinsurance coverage required. Reinsurance is purchased to limit the Company’s exposure to a particular risk, category of risk or geographic risk area. To manage reinsurance counterparty risk, the Company assesses and monitors the financial strength of its reinsurers on a regular basis.
The Company writes business that is broadly diversified in terms of the lines of business and geographic location. There is no guarantee that a catastrophe will not result in claims against the Company in excess of its maximum reinsurance coverage; however, based on the Company’s catastrophic loss models, protection is in excess of regulatory guidelines and at a level that management considers prudent.
The Company follows the policy of underwriting and reinsuring contracts of insurance which limits the liability of the Company to a maximum amount on any one loss. In addition, the Company has obtained reinsurance which limits the Company’s liability in the event of a series of claims arising out of a single occurrence, with the exception of travel insurance which is described in further detail below.
The Company’s net retentions are as follows:
2020
$
2019
$
Individual loss Property 7,500 7,500 General liability 5,000 5,000 Automobile 5,000 5,000 Fidelity and Director's liability 3,000 3,000
Catastrophe Maximum limit 1,450,000 1,400,000 Company retention 70,000 70,000
For certain special classes of business or types of risk, the retention for single risk events may be lower through specific treaties or the use of facultative reinsurance. The maximum limit for catastrophe reinsurance is applied to all property and casualty insurance operations ultimately owned by CGL. After application of the catastrophe program, the Company’s retention is $70,000 (2019 - $70,000) in incurred claims.
CUMIS General’s accident and sickness travel insurance, underwritten by the MGU, is fully ceded; 45% to CLIC and 55% to an external reinsurer. In addition, 55% of the property travel insurance is ceded to an external reinsurer; the Company’s maximum exposure per person is $56 (2019 - $56). Trip cancellation reinsurance is purchased for $1,800 (2019 - $1,800) of protection with a retention of $450 (2019 - $450).
Co-operators General Insurance Company | 2020 Annual Report 85
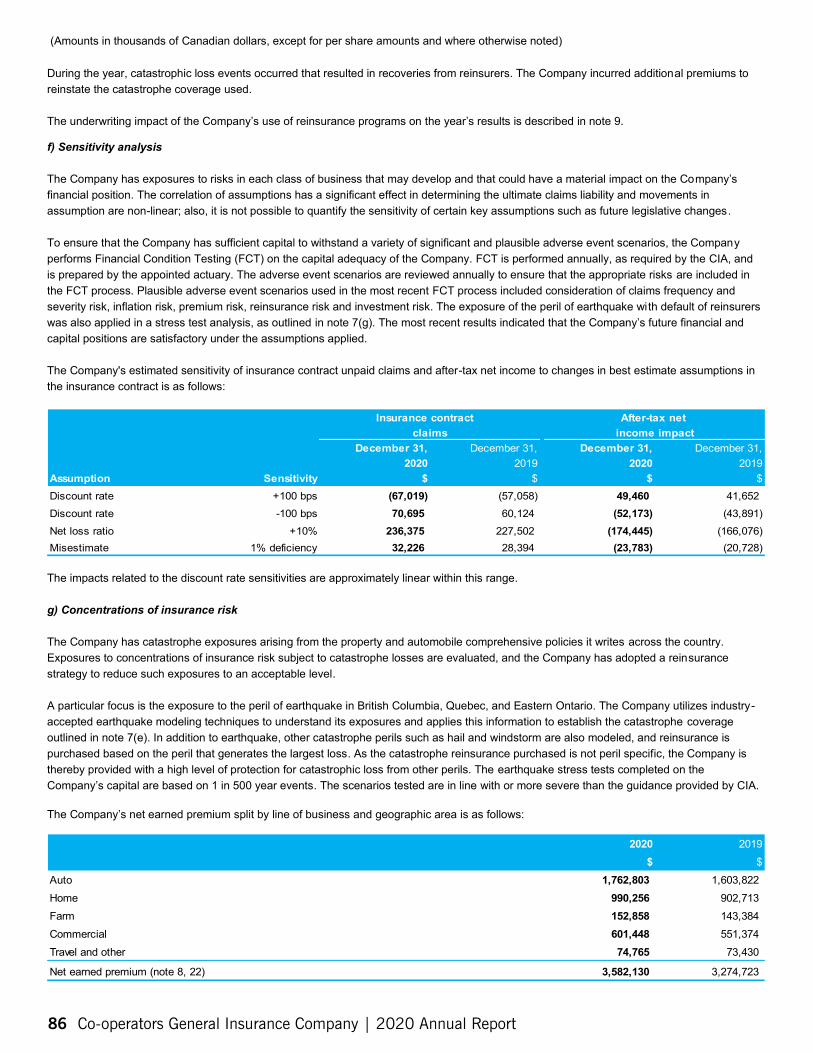
-
(Amounts in thousands of Canadian dollars, except for per share amounts and where otherwise noted)
During the year, catastrophic loss events occurred that resulted in recoveries from reinsurers. The Company incurred additional premiums to reinstate the catastrophe coverage used.
The underwriting impact of the Company’s use of reinsurance programs on the year’s results is described in note 9.
f) Sensitivity analysis
The Company has exposures to risks in each class of business that may develop and that could have a material impact on the Company’s financial position. The correlation of assumptions has a significant effect in determining the ultimate claims liability and movements in assumption are non-linear; also, it is not possible to quantify the sensitivity of certain key assumptions such as future legislative changes.
To ensure that the Company has sufficient capital to withstand a variety of significant and plausible adverse event scenarios, the Company performs Financial Condition Testing (FCT) on the capital adequacy of the Company. FCT is performed annually, as required by the CIA, and is prepared by the appointed actuary. The adverse event scenarios are reviewed annually to ensure that the appropriate risks are included in the FCT process. Plausible adverse event scenarios used in the most recent FCT process included consideration of claims frequency and severity risk, inflation risk, premium risk, reinsurance risk and investment risk. The exposure of the peril of earthquake with default of reinsurers was also applied in a stress test analysis, as outlined in note 7(g). The most recent results indicated that the Company’s future financial and capital positions are satisfactory under the assumptions applied.
The Company's estimated sensitivity of insurance contract unpaid claims and after-tax net income to changes in best estimate assumptions in the insurance contract is as follows:
Insurance contract After-tax net claims income impact
December 31, December 31, December 31, December 31, 2020 2019 2020 2019
Assumption Sensitivity $ $ $ $ Discount rate +100 bps (67,019) (57,058) 49,460 41,652 Discount rate -100 bps 70,695 60,124 (52,173) (43,891) Net loss ratio +10% 236,375 227,502 (174,445) (166,076) Misestimate 1% deficiency 32,226 28,394 (23,783) (20,728)
The impacts related to the discount rate sensitivities are approximately linear within this range.
g) Concentrations of insurance risk
The Company has catastrophe exposures arising from the property and automobile comprehensive policies it writes across the country. Exposures to concentrations of insurance risk subject to catastrophe losses are evaluated, and the Company has adopted a reinsurance strategy to reduce such exposures to an acceptable level.
A particular focus is the exposure to the peril of earthquake in British Columbia, Quebec, and Eastern Ontario. The Company utilizes industry-accepted earthquake modeling techniques to understand its exposures and applies this information to establish the catastrophe coverage outlined in note 7(e). In addition to earthquake, other catastrophe perils such as hail and windstorm are also modeled, and reinsurance is purchased based on the peril that generates the largest loss. As the catastrophe reinsurance purchased is not peril specific, the Company is thereby provided with a high level of protection for catastrophic loss from other perils. The earthquake stress tests completed on the Company’s capital are based on 1 in 500 year events. The scenarios tested are in line with or more severe than the guidance provided by CIA.
The Company’s net earned premium split by line of business and geographic area is as follows:
2020 $
2019 $
Auto 1,762,803 1,603,822 Home 990,256 902,713 Farm 152,858 143,384 Commercial 601,448 551,374 Travel and other 74,765 73,430
Net earned premium (note 8, 22) 3,582,130 3,274,723
86 Co-operators General Insurance Company | 2020 Annual Report
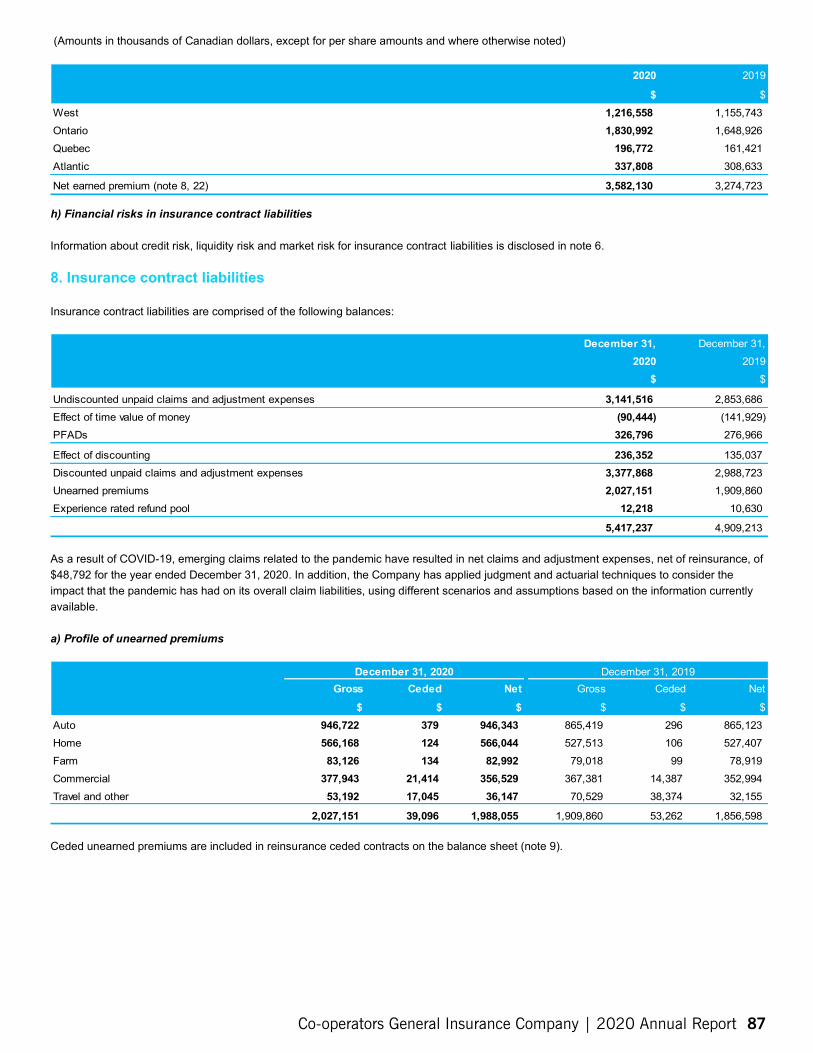
December 31, 2020 December 31, 2019
Gross $
Ceded $
Net $
Gross
$
Ceded
$
Net
$ Auto 946,722 379 946,343 865,419 296 865,123 Home 566,168 566,044 527,513 106 527,407 Farm 83,126 13 4
124 82,992 79,018 99 78,919
Commercial 377,943 21, 414 356,529 367,381 14, 387 352,994 Travel and other 53,192 17, 045 36,147 70,529 38, 374 32,155
2,027,151 39,096 1,988,055 1,909,860 53,262 1,856,598
(Amounts in thousands of Canadian dollars, except for per share amounts and where otherwise noted)
2020
$
2019
$ West 1,216,558 1,155,743 Ontario 1,830,992 1,648,926 Quebec 196,772 161,421 Atlantic 337,808 308,633
Net earned premium (note 8, 22) 3,582,130 3,274,723
h) Financial risks in insurance contract liabilities
Information about credit risk, liquidity risk and market risk for insurance contract liabilities is disclosed in note 6.
8. Insurance contract liabilities
Insurance contract liabilities are comprised of the following balances:
December 31, 2020
$
December 31, 2019
$
Undiscounted unpaid claims and adjustment expenses 3,141,516 2,853,686 Effect of time value of money (90,444) (141,929) PFADs 326,796 276,966
Effect of discounting 236,352 135,037 Discounted unpaid claims and adjustment expenses 3,377,868 2,988,723 Unearned premiums 2,027,151 1,909,860 Experience rated refund pool 12,218 10,630
5,417,237 4,909,213
As a result of COVID-19, emerging claims related to the pandemic have resulted in net claims and adjustment expenses, net of reinsurance, of $48,792 for the year ended December 31, 2020. In addition, the Company has applied judgment and actuarial techniques to consider the impact that the pandemic has had on its overall claim liabilities, using different scenarios and assumptions based on the information currently available.
a) Profile of unearned premiums
Ceded unearned premiums are included in reinsurance ceded contracts on the balance sheet (note 9).
Co-operators General Insurance Company | 2020 Annual Report 87
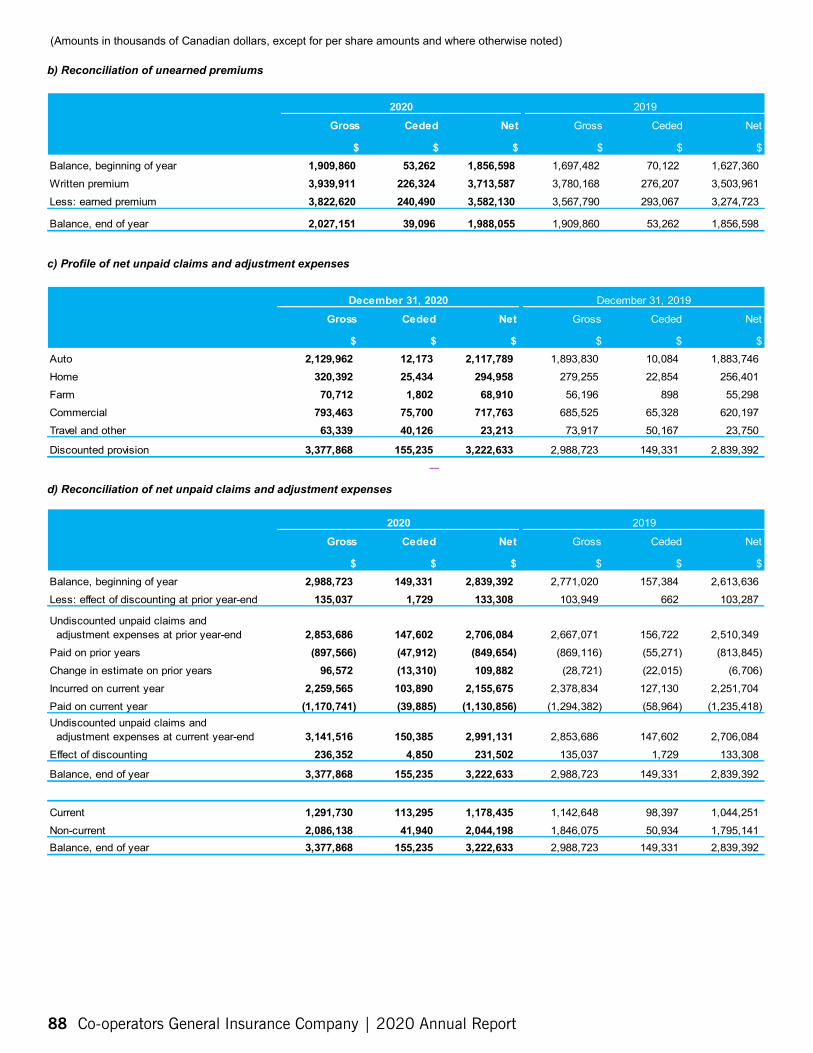
(Amounts in thousands of Canadian dollars, except for per share amounts and where otherwise noted)
b) Reconciliation of unearned premiums
Gross
$
Ceded
$
Net
$
Gross
$
Ceded
$
Net
$
2020 2019
Balance, beginning of year 1,909,860 53,262 1,856,598 1,697,482 70,122 1,627,360 Written premium 3,939,911 226,324 3,713,587 3,780,168 276,207 3,503,961 Less: earned premium 3,822,620 240,490 3,582,130 3,567,790 293,067 3,274,723
Balance, end of year 2,027,151 39,096 1,988,055 1,909,860 53,262 1,856,598
c) Profile of net unpaid claims and adjustment expenses
Gross
$
Ceded
$
Net
$
Gross
$
Ceded
$
Net
$
December 31, 2020 December 31, 2019
Auto 2,129,962 12,173 2,117,789 1,893,830 10,084 1,883,746 Home 320,392 25,434 294,958 279,255 22,854 256,401 Farm 70,712 1,802 68,910 56,196 898 55,298 Commercial 793,463 75,700 717,763 685,525 65,328 620,197 Travel and other 63,339 40,126 23,213 73,917 50,167 23,750
Discounted provision 3,377,868 155,235 3,222,633 2,988,723 149,331 2,839,392
d) Reconciliation of net unpaid claims and adjustment expenses
Gross
$
Ceded
$
Net
$
Gross
$
Ceded
$
Net
$
2020 2019
Balance, beginning of year 2,988,723 149,331 2,839,392 2,771,020 157,384 2,613,636 Less: effect of discounting at prior year-end 135,037 1,729 133,308 103,949 662 103,287
Undiscounted unpaid claims and adjustment expenses at prior year-end 2,853,686 147,602 2,706,084 2,667,071 156,722 2,510,349 Paid on prior years (897,566) (47,912) (849,654) (869,116) (55,271) (813,845) Change in estimate on prior years 96,572 (13,310) 109,882 (28,721) (22,015) (6,706) Incurred on current year 2,259,565 103,890 2,155,675 2,378,834 127,130 2,251,704 Paid on current year (1,170,741) (39,885) (1,130,856) (1,294,382) (58,964) (1,235,418) Undiscounted unpaid claims and adjustment expenses at current year-end 3,141,516 150,385 2,991,131 2,853,686 147,602 2,706,084 Effect of discounting 236,352 4,850 231,502 135,037 1,729 133,308
Balance, end of year 3,377,868 155,235 3,222,633 2,988,723 149,331 2,839,392
Current 1,291,730 113,295 1,178,435 1,142,648 98,397 1,044,251 Non-current 2,086,138 41,940 2,044,198 1,846,075 50,934 1,795,141 Balance, end of year 3,377,868 155,235 3,222,633 2,988,723 149,331 2,839,392
88 Co-operators General Insurance Company | 2020 Annual Report
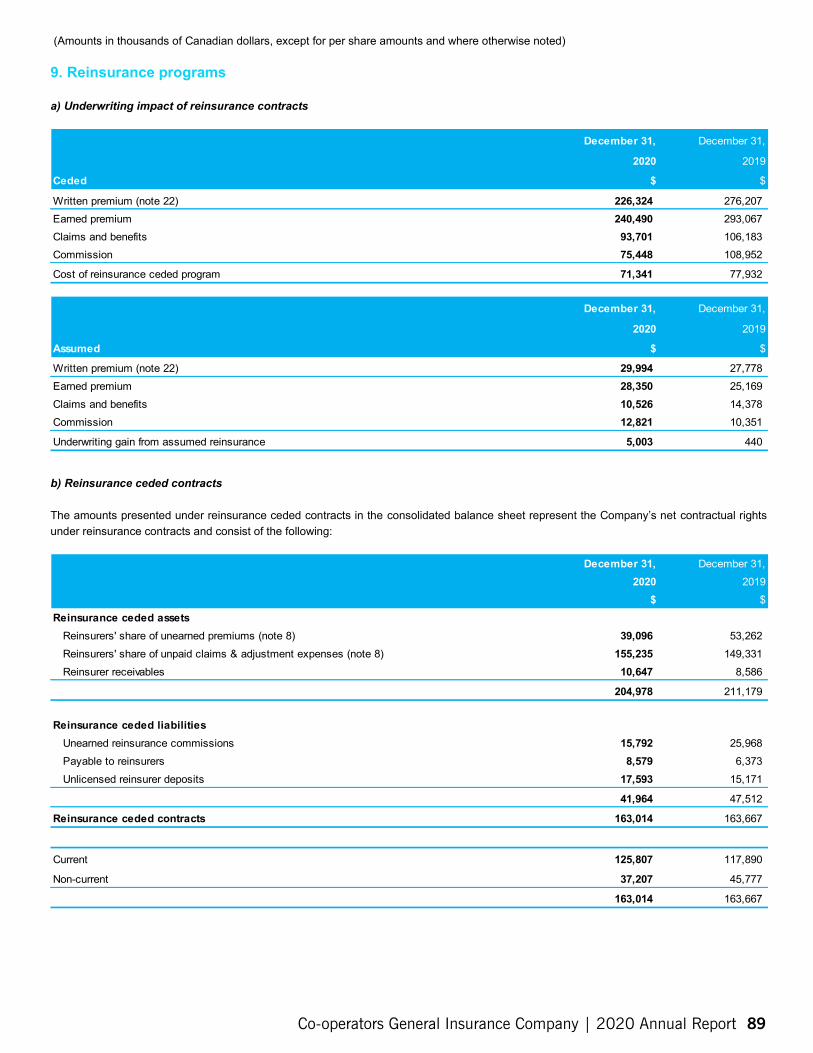
a) Underwriting impact of reinsurance contracts
b) Reinsurance ceded contracts
(Amounts in thousands of Canadian dollars, except for per share amounts and where otherwise noted)
9. Reinsurance programs
December 31,
2020
$
December 31,
2019
$ Ceded
Written premium (note 22) 226,324 276,207 Earned premium 240,490 293,067 Claims and benefits 93,701 106,183 Commission 75,448 108,952
Cost of reinsurance ceded program 71,341 77,932
December 31,
2020
$
December 31,
2019
$ Assumed
Written premium (note 22) 29,994 27,778 Earned premium 28,350 25,169 Claims and benefits 10,526 14,378 Commission 12,821 10,351
Underwriting gain from assumed reinsurance 5,003 440
The amounts presented under reinsurance ceded contracts in the consolidated balance sheet represent the Company’s net contractual rights under reinsurance contracts and consist of the following:
December 31, 2020
$
December 31, 2019
$ Reinsurance ceded assets
Reinsurers' share of unearned premiums (note 8) 39,096 53,262 Reinsurers' share of unpaid claims & adjustment expenses (note 8) 155,235 149,331 Reinsurer receivables 10,647 8,586
204,978 211,179
Reinsurance ceded liabilities Unearned reinsurance commissions 15,792 25,968 Payable to reinsurers 8,579 6,373 Unlicensed reinsurer deposits 17,593 15,171
41,964 47,512
Reinsurance ceded contracts 163,014 163,667
Current 125,807 117,890
Non-current 37,207 45,777
163,014 163,667
Co-operators General Insurance Company | 2020 Annual Report 89
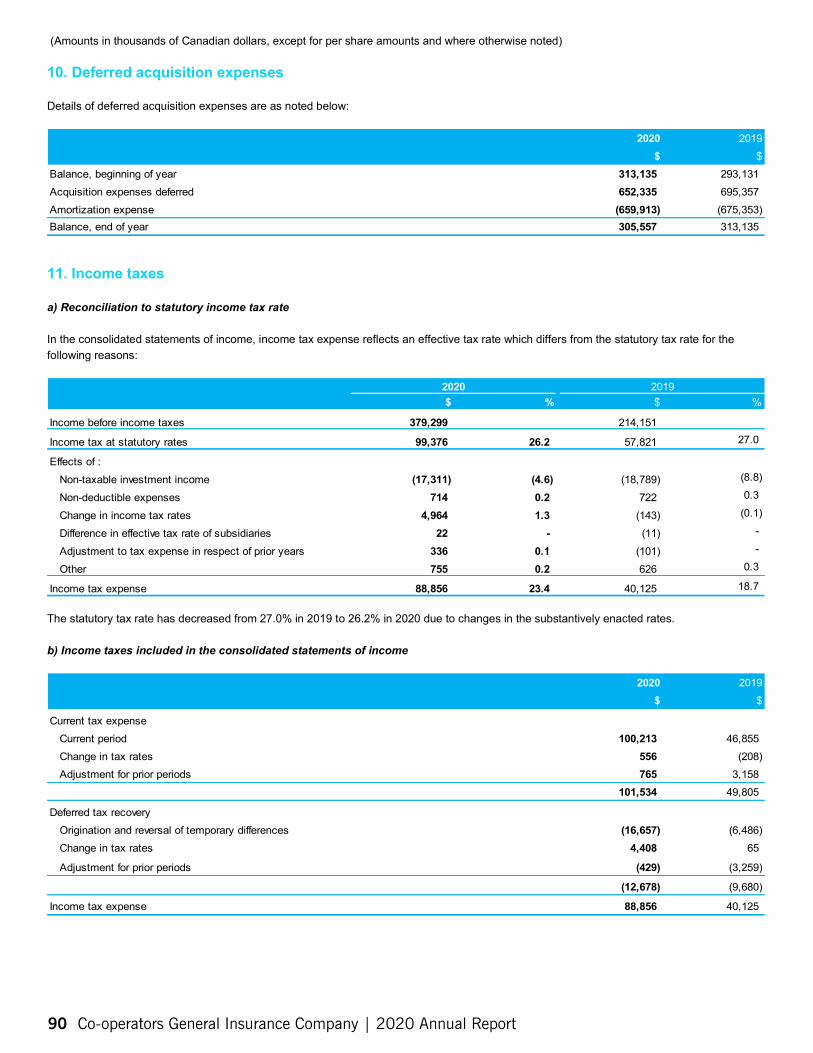
379,299 214,151
99,376 26.2 57,821 27.0
(17,311) (4.6) (18,789) (8.8)
714 0.2 722 0.3
4,964 1.3 (143) (0.1)
22 - (11) -
336 0.1 (101) -
755 0.2 626 0.3
88,856 23.4 40,125 18.7
(Amounts in thousands of Canadian dollars, except for per share amounts and where otherwise noted)
10. Deferred acquisition expenses
Details of deferred acquisition expenses are as noted below:
2020 $
2019 $
Balance, beginning of year 313,135 293,131 Acquisition expenses deferred 652,335 695,357 Amortization expense (659,913) (675,353) Balance, end of year 305,557 313,135
11. Income taxes
a) Reconciliation to statutory income tax rate
In the consolidated statements of income, income tax expense reflects an effective tax rate which differs from the statutory tax rate for the following reasons:
$ % $ % 2020 2019
Income before income taxes
Income tax at statutory rates
Effects of : Non-taxable investment income Non-deductible expenses Change in income tax rates Difference in effective tax rate of subsidiaries Adjustment to tax expense in respect of prior years Other
Income tax expense
The statutory tax rate has decreased from 27.0% in 2019 to 26.2% in 2020 due to changes in the substantively enacted rates.
b) Income taxes included in the consolidated statements of income
2020 $
2019 $
Current tax expense Current period 100,213 46,855 Change in tax rates 556 (208) Adjustment for prior periods 765 3,158
101,534 49,805
Deferred tax recovery Origination and reversal of temporary differences (16,657) (6,486) Change in tax rates 4,408 65
Adjustment for prior periods (429) (3,259)
(12,678) (9,680)
Income tax expense 88,856 40,125
90 Co-operators General Insurance Company | 2020 Annual Report
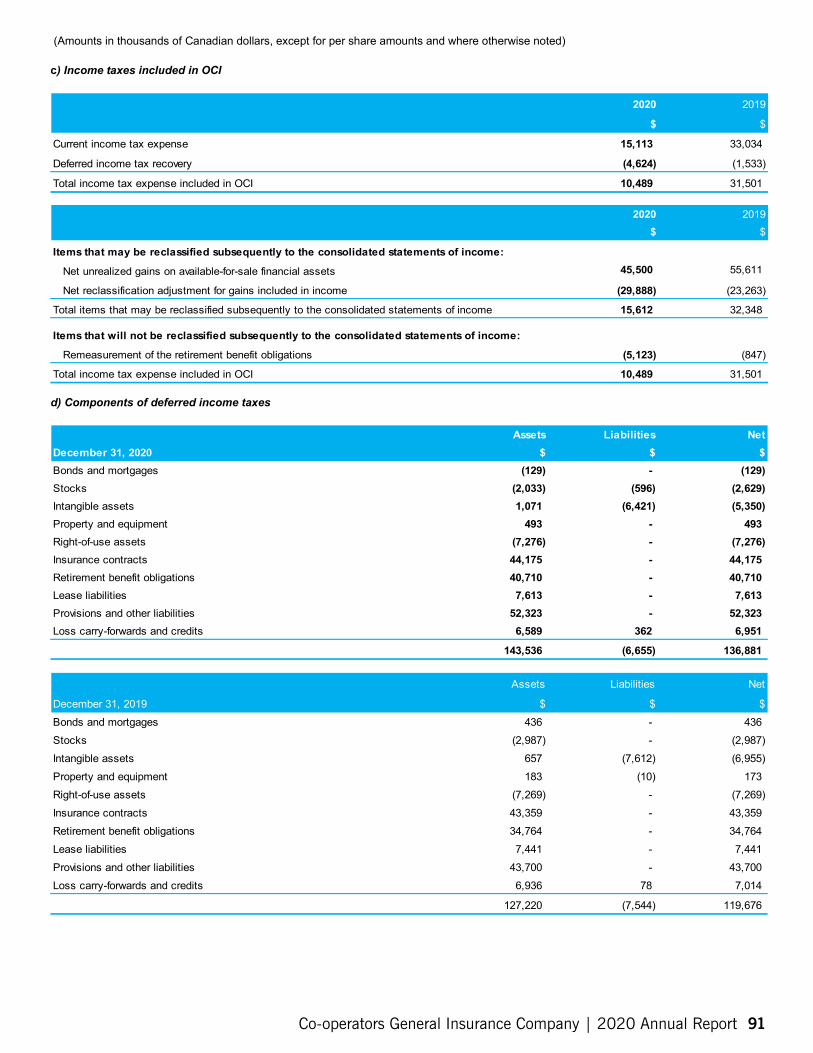
c) Income taxes included in OCI
d) Components of deferred income taxes
(Amounts in thousands of Canadian dollars, except for per share amounts and where otherwise noted)
2020
$
2019
$
Current income tax expense 15,113 33,034
Deferred income tax recovery (4,624) (1,533)
Total income tax expense included in OCI 10,489 31,501
2020 $
2019 $
Items that may be reclassified subsequently to the consolidated statements of income:
Net unrealized gains on available-for-sale financial assets 45,500 55,611
Net reclassification adjustment for gains included in income (29,888) (23,263)
Total items that may be reclassified subsequently to the consolidated statements of income 15,612 32,348
Items that will not be reclassified subsequently to the consolidated statements of income:
Remeasurement of the retirement benefit obligations (5,123) (847)
Total income tax expense included in OCI 10,489 31,501
Assets $
Liabilities $
Net $ December 31, 2020
Bonds and mortgages (129) - (129) Stocks (2,033) (596) (2,629) Intangible assets 1,071 (6,421) (5,350) Property and equipment 493 - 493 Right-of-use assets (7,276) - (7,276) Insurance contracts 44,175 - 44,175 Retirement benefit obligations 40,710 - 40,710 Lease liabilities 7,613 - 7,613 Provisions and other liabilities 52,323 - 52,323 Loss carry-forwards and credits 6,589 362 6,951
143,536 (6,655) 136,881
Assets
$
Liabilities
$
Net
$ December 31, 2019 Bonds and mortgages 436 - 436 Stocks (2,987) - (2,987) Intangible assets 657 (7,612) (6,955) Property and equipment 183 (10) 173 Right-of-use assets (7,269) - (7,269) Insurance contracts 43,359 - 43,359 Retirement benefit obligations 34,764 - 34,764 Lease liabilities 7,441 - 7,441 Provisions and other liabilities 43,700 - 43,700 Loss carry-forwards and credits 6,936 78 7,014
127,220 (7,544) 119,676
Co-operators General Insurance Company | 2020 Annual Report 91
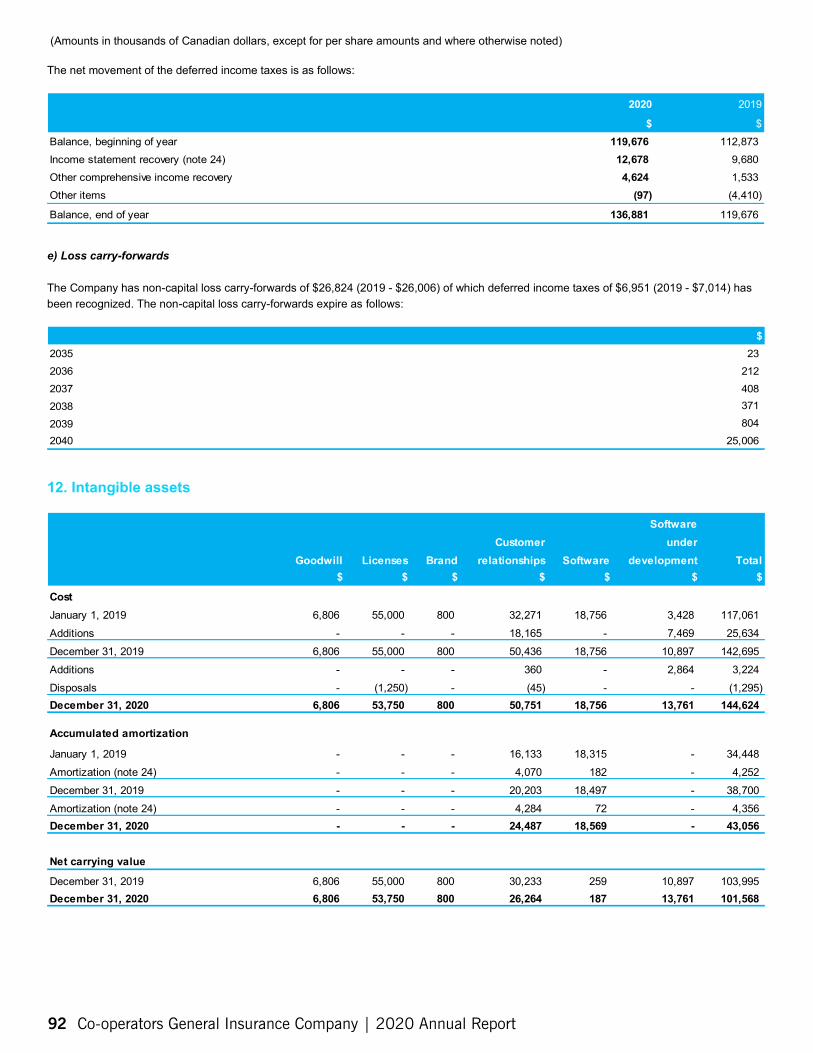
e) Loss carry-forwards
(Amounts in thousands of Canadian dollars, except for per share amounts and where otherwise noted)
The net movement of the deferred income taxes is as follows:
2020
$
2019
$ Balance, beginning of year 119,676 112,873 Income statement recovery (note 24) 12,678 9,680 Other comprehensive income recovery 4,624 1,533 Other items (97) (4,410)
Balance, end of year 136,881 119,676
The Company has non-capital loss carry-forwards of $26,824 (2019 - $26,006) of which deferred income taxes of $6,951 (2019 - $7,014) has been recognized. The non-capital loss carry-forwards expire as follows:
$ 2035 23 2036 212 2037 408 2038 371
2039 804 2040 25,006
12. Intangible assets
Software under
development $
Customer relationships
$ Goodwill
$ Licenses
$ Brand
$ Software
$ Total
$
Cost January 1, 2019 6,806 55,000 800 32,271 18,756 3,428 117,061 Additions - - - 18,165 - 7,469 25,634 December 31, 2019 6,806 55,000 800 50,436 18,756 10,897 142,695 Additions - - - 360 - 2,864 3,224 Disposals - (1,250) - (45) - - (1,295) December 31, 2020 6,806 53,750 800 50,751 18,756 13,761 144,624
Accumulated amortization
January 1, 2019 - - - 16,133 18,315 - 34,448 Amortization (note 24) - - - 4,070 182 - 4,252 December 31, 2019 - - - 20,203 18,497 - 38,700 Amortization (note 24) - - - 4,284 72 - 4,356 December 31, 2020 - - - 24,487 18,569 - 43,056
Net carrying value
December 31, 2019 6,806 55,000 800 30,233 259 10,897 103,995 December 31, 2020 6,806 53,750 800 26,264 187 13,761 101,568
92 Co-operators General Insurance Company | 2020 Annual Report
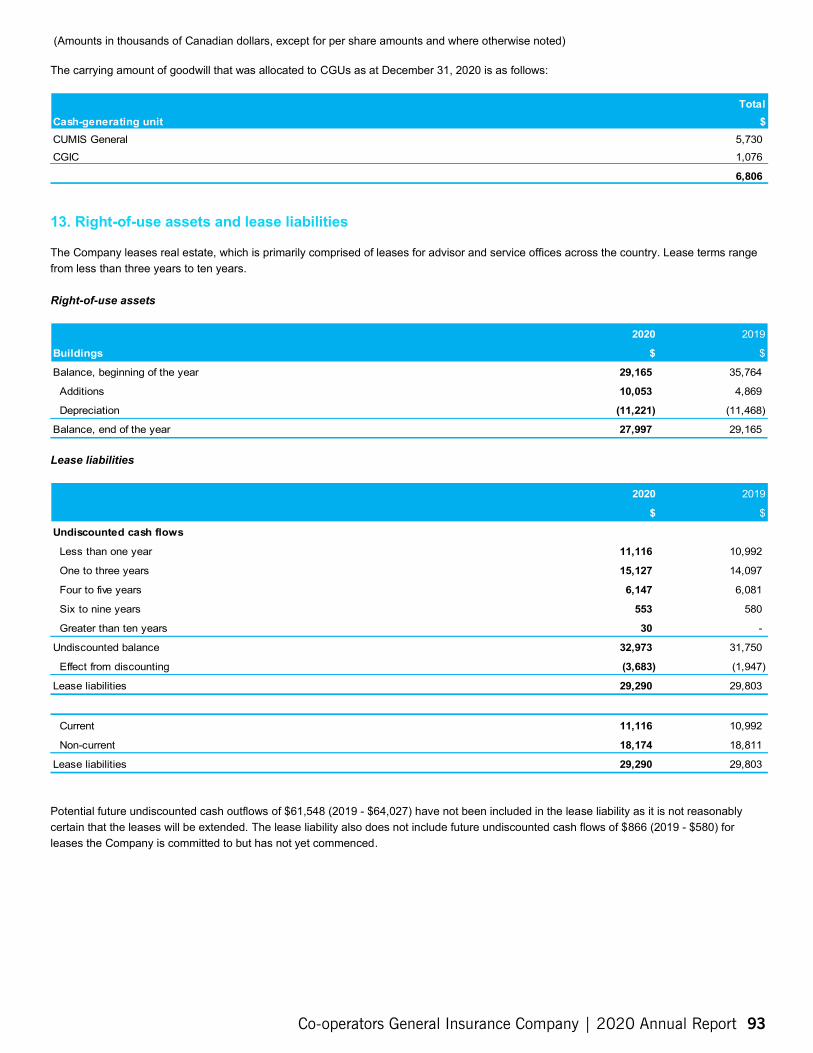
5,730 1,076
6,806
Lease liabilities
(Amounts in thousands of Canadian dollars, except for per share amounts and where otherwise noted)
The carrying amount of goodwill that was allocated to CGUs as at December 31, 2020 is as follows:
Total $ Cash-generating unit
CUMIS General CGIC
13. Right-of-use assets and lease liabilities
The Company leases real estate, which is primarily comprised of leases for advisor and service offices across the country. Lease terms range from less than three years to ten years.
Right-of-use assets
2020
$
2019
$ Buildings
Balance, beginning of the year 29,165 35,764
Additions 10,053 4,869
Depreciation (11,221) (11,468)
Balance, end of the year 27,997 29,165
2020
$
2019
$
Undiscounted cash flows
Less than one year 11,116 10,992
One to three years 15,127 14,097
Four to five years 6,147 6,081
Six to nine years 553 580
Greater than ten years 30 -
Undiscounted balance 32,973 31,750
Effect from discounting (3,683) (1,947)
Lease liabilities 29,290 29,803
Current 11,116 10,992
Non-current 18,174 18,811
Lease liabilities 29,290 29,803
Potential future undiscounted cash outflows of $61,548 (2019 - $64,027) have not been included in the lease liability as it is not reasonably certain that the leases will be extended. The lease liability also does not include future undiscounted cash flows of $866 (2019 - $580) for leases the Company is committed to but has not yet commenced.
Co-operators General Insurance Company | 2020 Annual Report 93
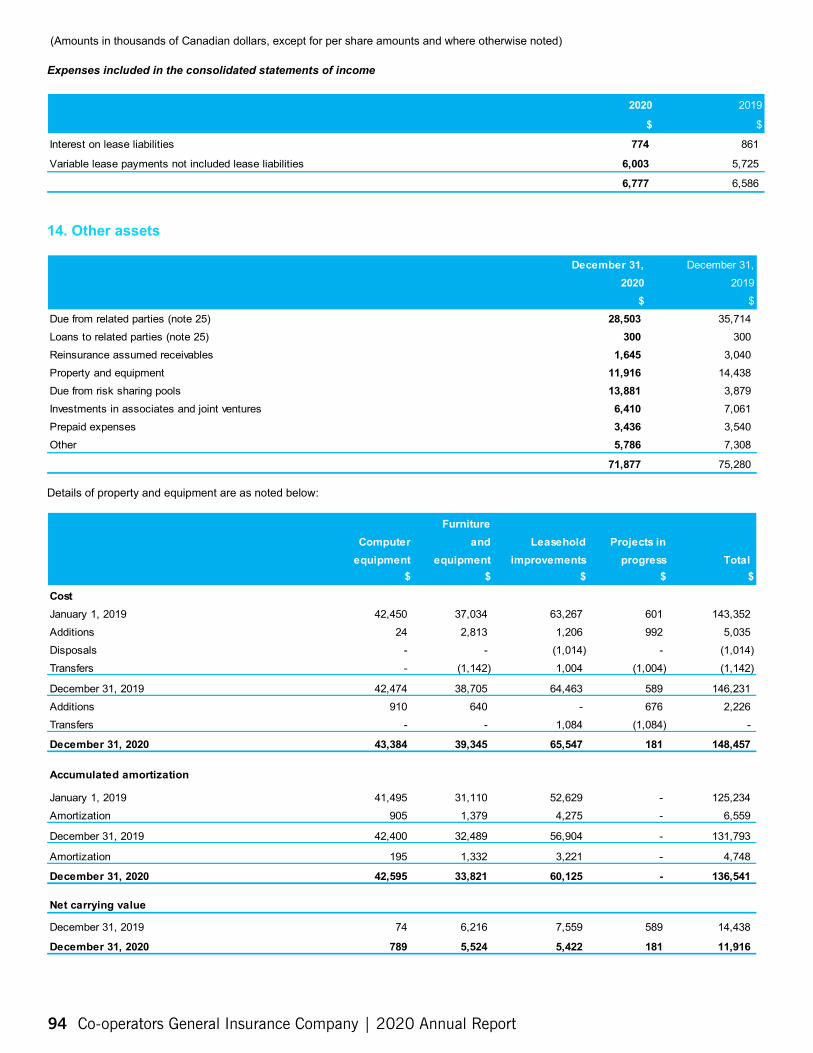
Expenses included in the consolidated statements of income
42, 450 37,034 63,267 601 143, 352 24 2,813 1,206 992 5,035 - - (1,014) - ( 1,014) - (1,142) 1,004 (1,004) ( 1,142)
(Amounts in thousands of Canadian dollars, except for per share amounts and where otherwise noted)
2020
$
2019
$
Interest on lease liabilities 774 861
Variable lease payments not included lease liabilities 6,003 5,725
6,777 6,586
14. Other assets
December 31, 2020
$
December 31, 2019
$ Due from related parties (note 25) 28,503 35,714 Loans to related parties (note 25) 300 300 Reinsurance assumed receivables 1,645 3,040 Property and equipment 11,916 14,438 Due from risk sharing pools 13,881 3,879 Investments in associates and joint ventures 6,410 7,061 Prepaid expenses 3,436 3,540 Other 5,786 7,308
71,877 75,280
Details of property and equipment are as noted below:
Furniture and
equipment $
Computer equipment
$
Leasehold improvements
$
Projects in progress
$ Total
$
Cost January 1, 2019 Additions Disposals Transfers
December 31, 2019 42,474 38,705 64,463 589 146,231 Additions 910 640 - 676 2,226 Transfers - - 1,084 (1,084) -
December 31, 2020 43,384 39,345 65,547 181 148,457
Accumulated amortization
January 1, 2019 41,495 31,110 52,629 - 125,234 Amortization 905 1,379 4,275 - 6,559
December 31, 2019 42,400 32,489 56,904 - 131,793
Amortization 195 1,332 3,221 - 4,748
December 31, 2020 42,595 33,821 60,125 - 136,541
Net carrying value
December 31, 2019 74 6,216 7,559 589 14,438
December 31, 2020 789 5,524 5,422 181 11,916
94 Co-operators General Insurance Company | 2020 Annual Report
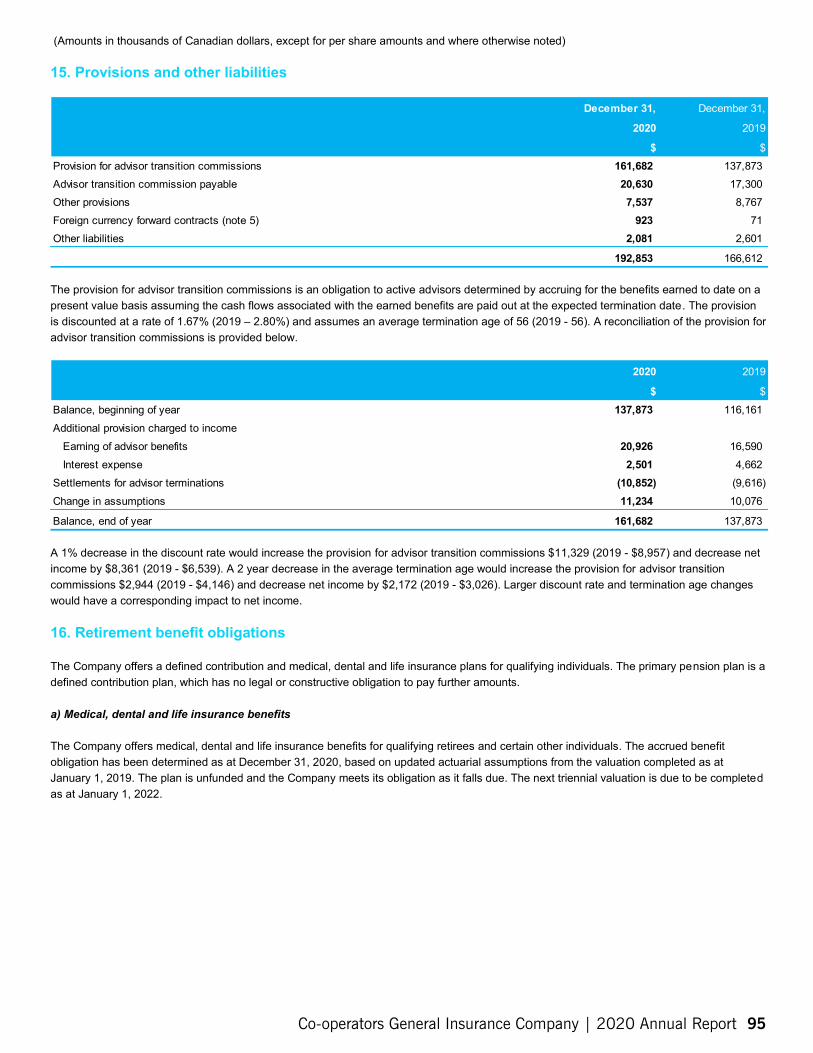
a) Medical, dental and life insurance benefits
(Amounts in thousands of Canadian dollars, except for per share amounts and where otherwise noted)
15. Provisions and other liabilities
December 31,
2020
$
December 31,
2019
$ Provision for advisor transition commissions 161,682 137,873 Advisor transition commission payable 20,630 17,300 Other provisions 7,537 8,767 Foreign currency forward contracts (note 5) 923 71 Other liabilities 2,081 2,601
192,853 166,612
The provision for advisor transition commissions is an obligation to active advisors determined by accruing for the benefits earned to date on a present value basis assuming the cash flows associated with the earned benefits are paid out at the expected termination date. The provision is discounted at a rate of 1.67% (2019 – 2.80%) and assumes an average termination age of 56 (2019 - 56). A reconciliation of the provision for advisor transition commissions is provided below.
2020
$
2019
$ Balance, beginning of year 137,873 116,161 Additional provision charged to income
Earning of advisor benefits 20,926 16,590 Interest expense 2,501 4,662
Settlements for advisor terminations (10,852) (9,616) Change in assumptions 11,234 10,076
Balance, end of year 161,682 137,873
A 1% decrease in the discount rate would increase the provision for advisor transition commissions $11,329 (2019 - $8,957) and decrease net income by $8,361 (2019 - $6,539). A 2 year decrease in the average termination age would increase the provision for advisor transition commissions $2,944 (2019 - $4,146) and decrease net income by $2,172 (2019 - $3,026). Larger discount rate and termination age changes would have a corresponding impact to net income.
16. Retirement benefit obligations
The Company offers a defined contribution and medical, dental and life insurance plans for qualifying individuals. The primary pension plan is a defined contribution plan, which has no legal or constructive obligation to pay further amounts.
The Company offers medical, dental and life insurance benefits for qualifying retirees and certain other individuals. The accrued benefit obligation has been determined as at December 31, 2020, based on updated actuarial assumptions from the valuation completed as at January 1, 2019. The plan is unfunded and the Company meets its obligation as it falls due. The next triennial valuation is due to be completed as at January 1, 2022.
Co-operators General Insurance Company | 2020 Annual Report 95
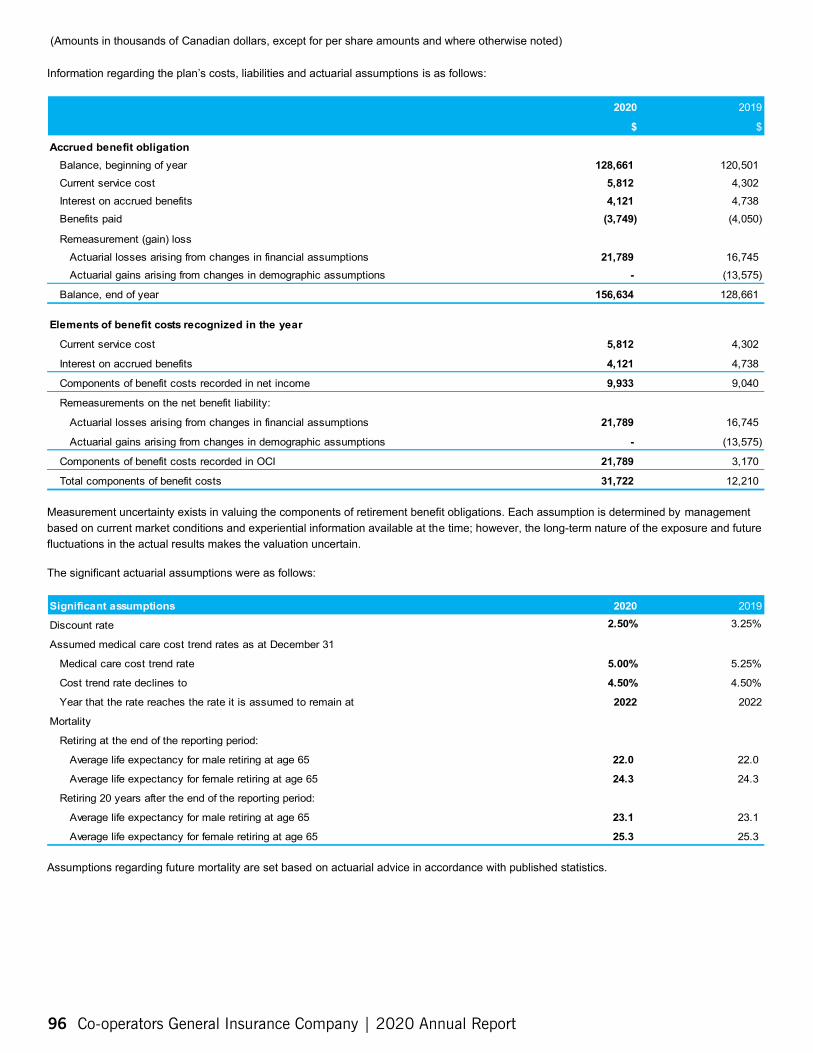
(Amounts in thousands of Canadian dollars, except for per share amounts and where otherwise noted)
Information regarding t he p lan’s costs, liabilities and actuarial assumptions is as follows:
2020
$
2019
$
Accrued benefit obligation Balance, beginning of year 128,661 120,501 Current service cost 5,812 4,302 Interest on accrued benefits 4,121 4,738 Benefits paid (3,749) (4,050)
Remeasurement (gain) loss Actuarial losses arising from changes in financial assumptions 21,789 16,745 Actuarial gains arising from changes in demographic assumptions - (13,575)
Balance, end of year 156,634 128,661
Elements of benefit costs recognized in the year
Current service cost 5,812 4,302
Interest on accrued benefits 4,121 4,738
Components of benefit costs recorded in net income 9,933 9,040
Remeasurements on the net benefit liability:
Actuarial losses arising from changes in financial assumptions 21,789 16,745
Actuarial gains arising from changes in demographic assumptions - (13,575)
Components of benefit costs recorded in OCI 21,789 3,170
Total components of benefit costs 31,722 12,210
Measurement uncertainty exists in valuing the components of retirement benefit obligations. Each assumption is determined by management based on current market conditions and experiential information available at the time; however, the long-term nature of the exposure and future fluctuations in the actual results makes the valuation uncertain.
The significant actuarial assumptions were as follows:
Significant assumptions 2020 2019
Discount rate 2.50% 3.25%
Assumed medical care cost trend rates as at December 31
Medical care cost trend rate 5.00% 5.25%
Cost trend rate declines to 4.50% 4.50%
Year that the rate reaches the rate it is assumed to remain at 2022 2022
Mortality
Retiring at the end of the reporting period:
Average life expectancy for male retiring at age 65 22.0 22.0
Average life expectancy for female retiring at age 65 24.3 24.3
Retiring 20 years after the end of the reporting period:
Average life expectancy for male retiring at age 65 23.1 23.1
Average life expectancy for female retiring at age 65 25.3 25.3
Assumptions regarding future mortality are set based on actuarial advice in accordance with published statistics.
96 Co-operators General Insurance Company | 2020 Annual Report
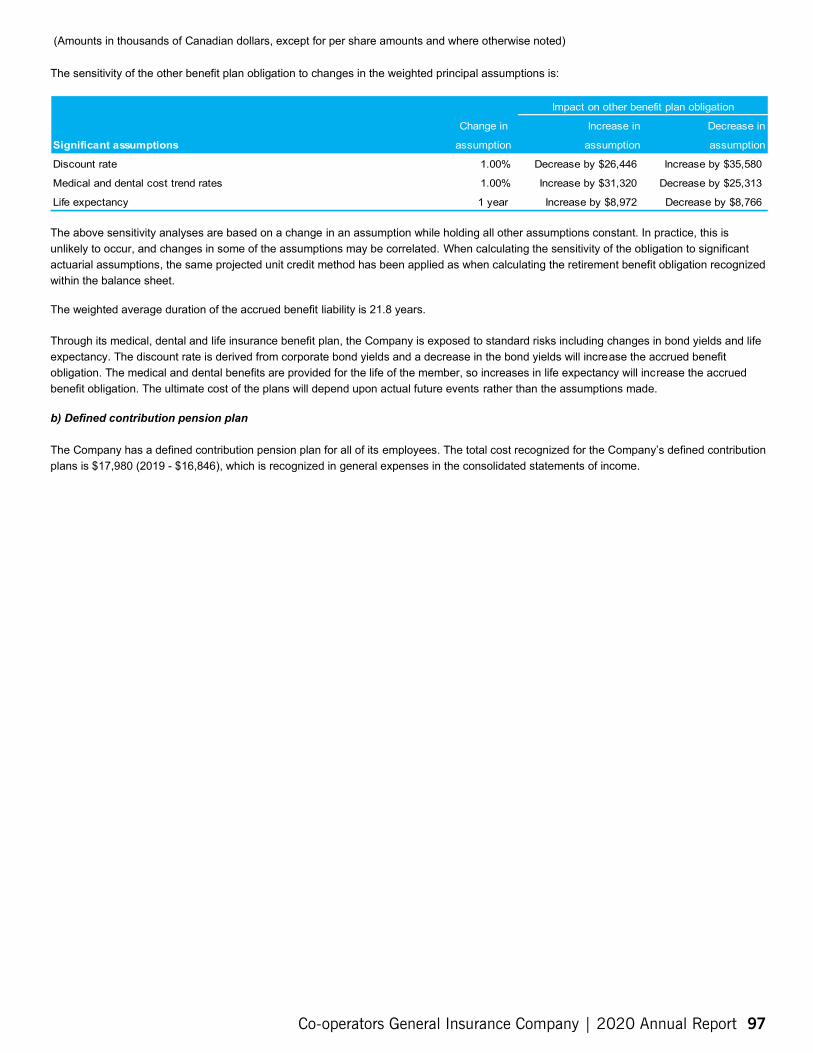
b) Defined contribution pension plan
(Amounts in thousands of Canadian dollars, except for per share amounts and where otherwise noted)
The sensitivity of the other benefit plan obligation to changes in the weighted principal assumptions is:
Change in
assumption
Increase in
assumption
Decrease in
assumption Significant assumptions
Impact on other benefit plan obligation
Discount rate 1.00% Decrease by $26,446 Increase by $35,580
Medical and dental cost trend rates 1.00% Increase by $31,320 Decrease by $25,313
Life expectancy 1 year Increase by $8,972 Decrease by $8,766
The above sensitivity analyses are based on a change in an assumption while holding all other assumptions constant. In practice, this is unlikely to occur, and changes in some of the assumptions may be correlated. When calculating the sensitivity of the obligation to significant actuarial assumptions, the same projected unit credit method has been applied as when calculating the retirement benefit obligation recognized within the balance sheet.
The weighted average duration of the accrued benefit liability is 21.8 years.
Through its medical, dental and life insurance benefit plan, the Company is exposed to standard risks including changes in bond yields and life expectancy. The discount rate is derived from corporate bond yields and a decrease in the bond yields will increase the accrued benefit obligation. The medical and dental benefits are provided for the life of the member, so increases in life expectancy will increase the accrued benefit obligation. The ultimate cost of the plans will depend upon actual future events rather than the assumptions made.
The Company has a defined contribution pension plan for all of its employees. The total cost recognized for the Company’s defined contribution plans is $17,980 (2019 - $16,846), which is recognized in general expenses in the consolidated statements of income.
Co-operators General Insurance Company | 2020 Annual Report 97
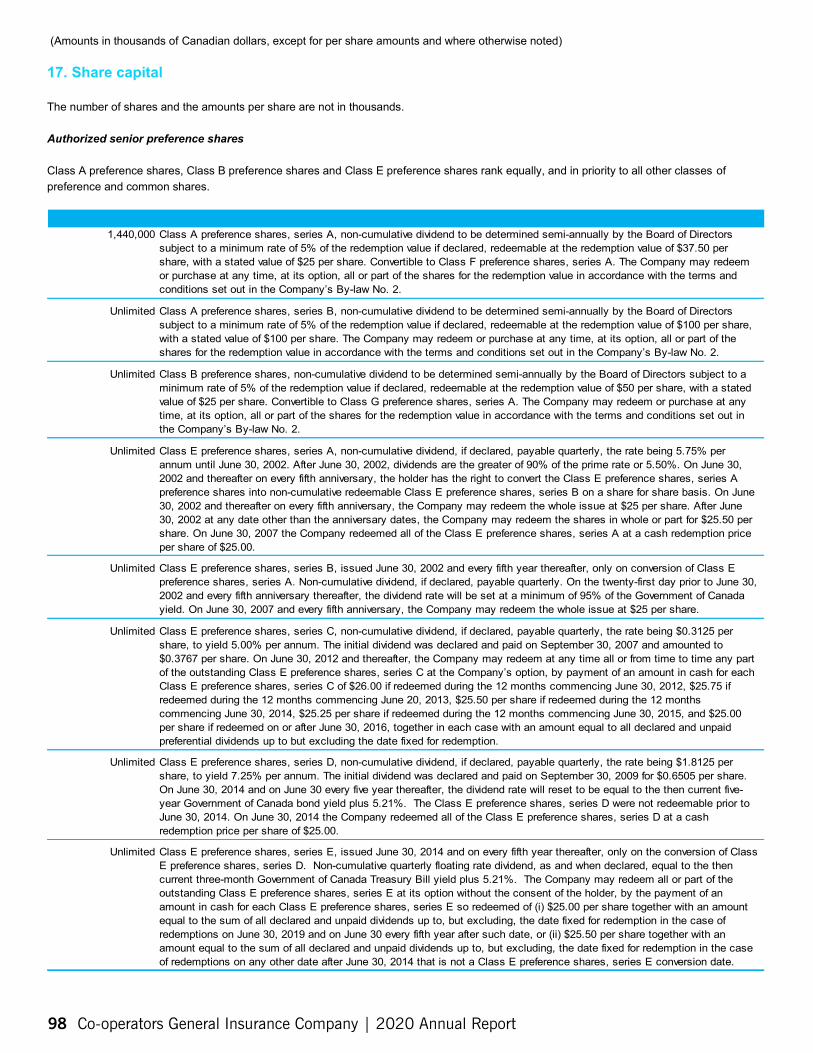
Authorized senior preference shares
(Amounts in thousands of Canadian dollars, except for per share amounts and where otherwise noted)
17. Share capital
The number of shares and the amounts per share are not in thousands.
Class A preference shares, Class B preference shares and Class E preference shares rank equally, and in priority to all other classes of preference and common shares.
1,440,000 Class A preference shares, series A, non-cumulative dividend to be determined semi-annually by the Board of Directors subject to a minimum rate of 5% of the redemption value if declared, redeemable at the redemption value of $37.50 per share, with a stated value of $25 per share. Convertible to Class F preference shares, series A. The Company may redeem or purchase at any time, at its option, all or part of the shares for the redemption value in accordance with the terms and conditions set out in the Company’s By-law No. 2.
Unlimited Class A preference shares, series B, non-cumulative dividend to be determined semi-annually by the Board of Directors subject to a minimum rate of 5% of the redemption value if declared, redeemable at the redemption value of $100 per share, with a stated value of $100 per share. The Company may redeem or purchase at any time, at its option, all or part of the shares for the redemption value in accordance with the terms and conditions set out in the Company’s By-law No. 2.
Unlimited Class B preference shares, non-cumulative dividend to be determined semi-annually by the Board of Directors subject to a minimum rate of 5% of the redemption value if declared, redeemable at the redemption value of $50 per share, with a stated value of $25 per share. Convertible to Class G preference shares, series A. The Company may redeem or purchase at any time, at its option, all or part of the shares for the redemption value in accordance with the terms and conditions set out in the Company’s By-law No. 2.
Unlimited Class E preference shares, series A, non-cumulative dividend, if declared, payable quarterly, the rate being 5.75% per annum until June 30, 2002. After June 30, 2002, dividends are the greater of 90% of the prime rate or 5.50%. On June 30, 2002 and thereafter on every fifth anniversary, the holder has the right to convert the Class E preference shares, series A preference shares into non-cumulative redeemable Class E preference shares, series B on a share for share basis. On June 30, 2002 and thereafter on every fifth anniversary, the Company may redeem the whole issue at $25 per share. After June 30, 2002 at any date other than the anniversary dates, the Company may redeem the shares in whole or part for $25.50 per share. On June 30, 2007 the Company redeemed all of the Class E preference shares, series A at a cash redemption price per share of $25.00.
Unlimited Class E preference shares, series B, issued June 30, 2002 and every fifth year thereafter, only on conversion of Class E preference shares, series A. Non-cumulative dividend, if declared, payable quarterly. On the twenty-first day prior to June 30, 2002 and every fifth anniversary thereafter, the dividend rate will be set at a minimum of 95% of the Government of Canada yield. On June 30, 2007 and every fifth anniversary, the Company may redeem the whole issue at $25 per share.
Unlimited Class E preference shares, series C, non-cumulative dividend, if declared, payable quarterly, the rate being $0.3125 per share, to yield 5.00% per annum. The initial dividend was declared and paid on September 30, 2007 and amounted to $0.3767 per share. On June 30, 2012 and thereafter, the Company may redeem at any time all or from time to time any part of the outstanding Class E preference shares, series C at the Company’s option, by payment of an amount in cash for each Class E preference shares, series C of $26.00 if redeemed during the 12 months commencing June 30, 2012, $25.75 if redeemed during the 12 months commencing June 20, 2013, $25.50 per share if redeemed during the 12 months commencing June 30, 2014, $25.25 per share if redeemed during the 12 months commencing June 30, 2015, and $25.00 per share if redeemed on or after June 30, 2016, together in each case with an amount equal to all declared and unpaid preferential dividends up to but excluding the date fixed for redemption.
Unlimited Class E preference shares, series D, non-cumulative dividend, if declared, payable quarterly, the rate being $1.8125 per share, to yield 7.25% per annum. The initial dividend was declared and paid on September 30, 2009 for $0.6505 per share. On June 30, 2014 and on June 30 every five year thereafter, the dividend rate will reset to be equal to the then current five-year Government of Canada bond yield plus 5.21%. The Class E preference shares, series D were not redeemable prior to June 30, 2014. On June 30, 2014 the Company redeemed all of the Class E preference shares, series D at a cash redemption price per share of $25.00.
Unlimited Class E preference shares, series E, issued June 30, 2014 and on every fifth year thereafter, only on the conversion of Class E preference shares, series D. Non-cumulative quarterly floating rate dividend, as and when declared, equal to the then current three-month Government of Canada Treasury Bill yield plus 5.21%. The Company may redeem all or part of the outstanding Class E preference shares, series E at its option without the consent of the holder, by the payment of an amount in cash for each Class E preference shares, series E so redeemed of (i) $25.00 per share together with an amount equal to the sum of all declared and unpaid dividends up to, but excluding, the date fixed for redemption in the case of redemptions on June 30, 2019 and on June 30 every fifth year after such date, or (ii) $25.50 per share together with an amount equal to the sum of all declared and unpaid dividends up to, but excluding, the date fixed for redemption in the case of redemptions on any other date after June 30, 2014 that is not a Class E preference shares, series E conversion date.
98 Co-operators General Insurance Company | 2020 Annual Report

Authorized junior preference shares
Authorized common shares
790,177 79, 017 412 10
13,803 1, 380
42,535 4, 254
43,184 4, 318
4,000,000 100,000
488,624 12, 216
14,984 375 26,620,395 359,778
(Amounts in thousands of Canadian dollars, except for per share amounts and where otherwise noted)
Unlimited Class C, preference shares issuable in series
100,000 Class C preference shares, series A, non-cumulative 6% dividend and a participating dividend up to 5%, each to be determined annually by the Board of Directors with a stated value of $100
Unlimited Class D preference shares, series A, non-cumulative dividend to be determined annually by the Board of Directors, redeemable at $100 per share, with a stated value of $100 per share
Unlimited Class D preference shares, series B, non-cumulative dividend to be determined annually by the Board of Directors, redeemable at $100 per share, with a stated value of $100 per share
Unlimited Class D preference shares, series C, non-cumulative dividend to be determined annually by the Board of Directors, redeemable at $100 per share, with a stated value of $100 per share
Unlimited Class F preference shares, series A, non-cumulative dividend subject to a minimum rate of 5% if declared to be determined annually by the Board of Directors, redeemable at $37.50 per share, with a stated value of $25 per share
Unlimited Class G preference shares, series A, non-cumulative dividend subject to a minimum rate of 5% if declared to be determined annually by the Board of Directors, redeemable at $50 per share, with a stated value of $25 per share
Unlimited Class H, Class I and Class J preference shares, these have been authorized but have been given no attributes and have not yet been issued. The Board of Directors has the right to define the attributes and issue as required
Unlimited Common Shares
The redemption of any share must be approved in advance by OSFI.
The changes and the number of shares issued and outstanding are as follows:
Redeemed during
Beginning of year Issued during the year the year End of year
Number of Shares
Amount $
Number of Shares
Amount $
Number of Shares
Amount $
Number of Shares
Amount $ 2020
Class A preference shares, series B 117,989 11,799 46,046 4,606 862,120 86,210 Class B preference shares - - - - 412 10 Class D preference shares, series A - - - - 13,803 1,380 Class D preference shares, series B - - - - 42,535 4,254 Class D preference shares, series C - - - - 43,184 4,318 Class E preference shares, series C - - - - 4,000,000 100,000 Class F preference shares, series A - - - - 488,624 12,216 Class G preference shares, series A - - - - 14,984 375 Common shares 98,549 - - - 26,718,944 359,778
561,348 11,799 4,606 568,541
Less staff share loan plan 16,569 17,841
544,779 550,700
Co-operators General Insurance Company | 2020 Annual Report 99
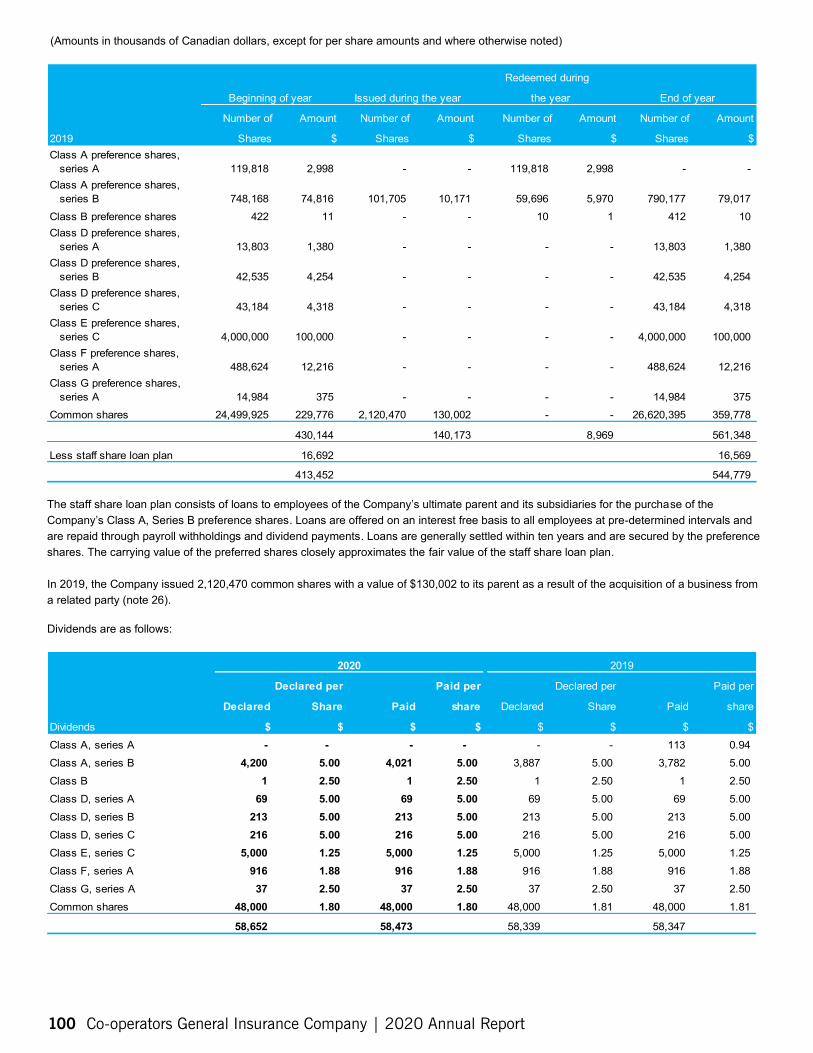
13,803 1, 380 - - - - 13, 803 1,380
(Amounts in thousands of Canadian dollars, except for per share amounts and where otherwise noted)
Redeemed during
the year Beginning of year Issued during the year End of year
Number of
Shares
Amount
$
Number of
Shares
Amount
$
Number of
Shares
Amount
$
Number of
Shares
Amount
2019 $ Class A preference shares, series A 119,818 2,998 - - 119,818 2,998 - -Class A preference shares, series B 748,168 74,816 101,705 10,171 59,696 5,970 790,177 79,017 Class B preference shares Class D preference shares, series A
422 11 - - 10 1 412 10
Class D preference shares, series B 42,535 4,254 - - - - 42,535 4,254 Class D preference shares, series C 43,184 4,318 - - - - 43,184 4,318 Class E preference shares, series C 4,000,000 100,000 - - - - 4,000,000 100,000 Class F preference shares, series A 488,624 12,216 - - - - 488,624 12,216 Class G preference shares, series A 14,984 375 - - - - 14,984 375 Common shares 24,499,925 229,776 2,120,470 130,002 - - 26,620,395 359,778
430,144 140,173 8,969 561,348
Less staff share loan plan 16,692 16,569
413,452 544,779
The staff share loan plan consists of loans to employees of the Company’s ultimate parent and its subsidiaries for the purchase of the Company’s Class A, Series B preference shares. Loans are offered on an interest free basis to all employees at pre-determined intervals and are repaid through payroll withholdings and dividend payments. Loans are generally settled within ten years and are secured by the preference shares. The carrying value of the preferred shares closely approximates the fair value of the staff share loan plan.
In 2019, the Company issued 2,120,470 common shares with a value of $130,002 to its parent as a result of the acquisition of a business from a related party (note 26).
Dividends are as follows:
2020 2019
Declared per
Share
$
Paid per
share
$
Declared per
Share
$
Paid per
share
$
Declared
$
Paid
$
Declared
$
Paid
$ Dividends Class A, series A - - - - - - 113 0.94 Class A, series B 4,200 5.00 4,021 5.00 3,887 5.00 3,782 5.00 Class B 1 2.50 1 2.50 1 2.50 1 2.50 Class D, series A 69 5.00 69 5.00 69 5.00 69 5.00 Class D, series B 213 5.00 213 5.00 213 5.00 213 5.00 Class D, series C 216 5.00 216 5.00 216 5.00 216 5.00 Class E, series C 5,000 1.25 5,000 1.25 5,000 1.25 5,000 1.25 Class F, series A 916 1.88 916 1.88 916 1.88 916 1.88 Class G, series A 37 2.50 37 2.50 37 2.50 37 2.50 Common shares 48,000 1.80 48,000 1.80 48,000 1.81 48,000 1.81
58,652 58,473 58,339 58,347
100 Co-operators General Insurance Company | 2020 Annual Report
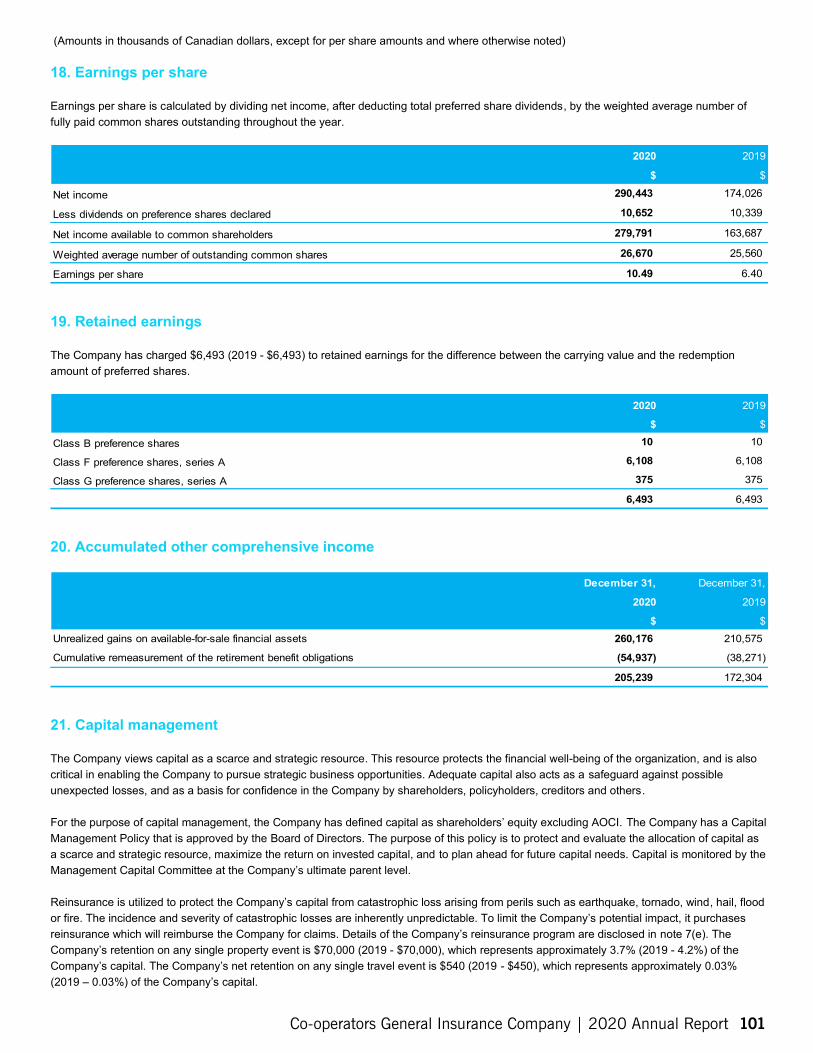
(Amounts in thousands of Canadian dollars, except for per share amounts and where otherwise noted)
18. Earnings per share
Earnings per share is calculated by dividing net income, after deducting total preferred share dividends, by the weighted average number of fully paid common shares outstanding throughout the year.
2020
$
2019
$
Net income 290,443 174,026
Less dividends on preference shares declared 10,652 10,339
Net income available to common shareholders 279,791 163,687
Weighted average number of outstanding common shares 26,670 25,560
Earnings per share 10.49 6.40
19. Retained earnings
The Company has charged $6,493 (2019 - $6,493) to retained earnings for the difference between the carrying value and the redemption amount of preferred shares.
2020
$
2019
$
Class B preference shares 10 10
Class F preference shares, series A 6,108 6,108
Class G preference shares, series A 375 375
6,493 6,493
20. Accumulated other comprehensive income
December 31,
2020
$
December 31,
2019
$ Unrealized gains on available-for-sale financial assets 260,176 210,575
Cumulative remeasurement of the retirement benefit obligations (54,937) (38,271)
205,239 172,304
21. Capital management
The Company views capital as a scarce and strategic resource. This resource protects the financial well-being of the organization, and is also critical in enabling the Company to pursue strategic business opportunities. Adequate capital also acts as a safeguard against possible unexpected losses, and as a basis for confidence in the Company by shareholders, policyholders, creditors and others.
For the purpose of capital management, the Company has defined capital as shareholders’ equity excluding AOCI. The Company has a Capital Management Policy that is approved by the Board of Directors. The purpose of this policy is to protect and evaluate the allocation of capital as a scarce and strategic resource, maximize the return on invested capital, and to plan ahead for future capital needs. Capital is monitored by the Management Capital Committee at the Company’s ultimate parent level.
Reinsurance is utilized to protect the Company’s capital from catastrophic loss arising from perils such as earthquake, tornado, wind, hail, flood or fire. The incidence and severity of catastrophic losses are inherently unpredictable. To limit the Company’s potential impact, it purchases reinsurance which will reimburse the Company for claims. Details of the Company’s reinsurance program are disclosed in note 7(e). The Company’s retention on any single property event is $70,000 (2019 - $70,000), which represents approximately 3.7% (2019 - 4.2%) of the Company’s capital. The Company’s net retention on any single travel event is $540 (2019 - $450), which represents approximately 0.03% (2019 – 0.03%) of the Company’s capital.
Co-operators General Insurance Company | 2020 Annual Report 101
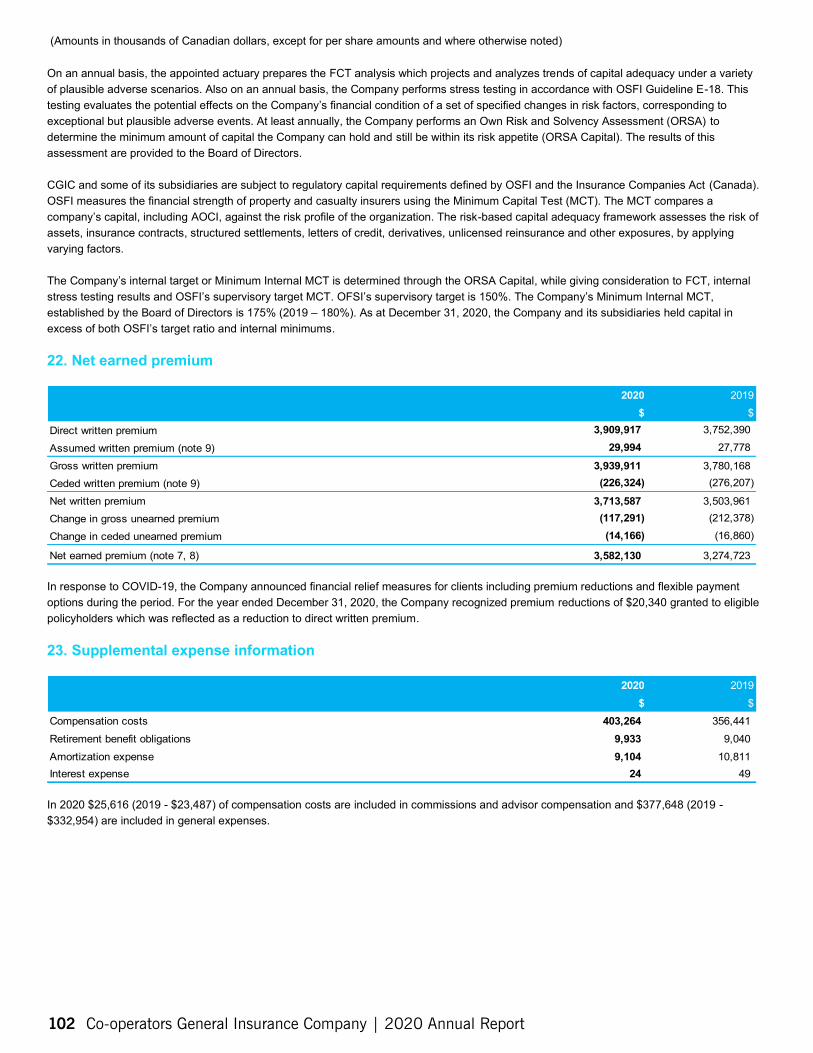
(Amounts in thousands of Canadian dollars, except for per share amounts and where otherwise noted)
On an annual basis, the appointed actuary prepares the FCT analysis which projects and analyzes trends of capital adequacy under a variety of plausible adverse scenarios. Also on an annual basis, the Company performs stress testing in accordance with OSFI Guideline E-18. This testing evaluates the potential effects on the Company’s financial condition of a set of specified changes in risk factors, corresponding to exceptional but plausible adverse events. At least annually, the Company performs an Own Risk and Solvency Assessment (ORSA) to determine the minimum amount of capital the Company can hold and still be within its risk appetite (ORSA Capital). The results of this assessment are provided to the Board of Directors.
CGIC and some of its subsidiaries are subject to regulatory capital requirements defined by OSFI and the Insurance Companies Act (Canada). OSFI measures the financial strength of property and casualty insurers using the Minimum Capital Test (MCT). The MCT compares a company’s capital, including AOCI, against the risk profile of the organization. The risk-based capital adequacy framework assesses the risk of assets, insurance contracts, structured settlements, letters of credit, derivatives, unlicensed reinsurance and other exposures, by applying varying factors.
The Company’s internal target or Minimum Internal MCT is determined through the ORSA Capital, while giving consideration to FCT, internal stress testing results and OSFI’s supervisory target MCT. OFSI’s supervisory target is 150%. The Company’s Minimum Internal MCT, established by the Board of Directors is 175% (2019 – 180%). As at December 31, 2020, the Company and its subsidiaries held capital in excess of both OSFI’s target ratio and internal minimums.
22. Net earned premium
2020 $
2019 $
Direct written premium 3,909,917 3,752,390
Assumed written premium (note 9) 29,994 27,778
Gross written premium 3,939,911 3,780,168 Ceded written premium (note 9) (226,324) (276,207)
Net written premium 3,713,587 3,503,961 Change in gross unearned premium (117,291) (212,378)
Change in ceded unearned premium (14,166) (16,860)
Net earned premium (note 7, 8) 3,582,130 3,274,723
In response to COVID-19, the Company announced financial relief measures for clients including premium reductions and flexible payment options during the period. For the year ended December 31, 2020, the Company recognized premium reductions of $20,340 granted to eligible policyholders which was reflected as a reduction to direct written premium.
23. Supplemental e xpense information
2020 $
2019 $
Compensation costs 403,264 356,441 Retirement benefit obligations 9,933 9,040 Amortization expense 9,104 10,811 Interest expense 24 49
In 2020 $25,616 (2019 - $23,487) of compensation costs are included in commissions and advisor compensation and $377,648 (2019 -$332,954) are included in general expenses.
102 Co-operators General Insurance Company | 2020 Annual Report
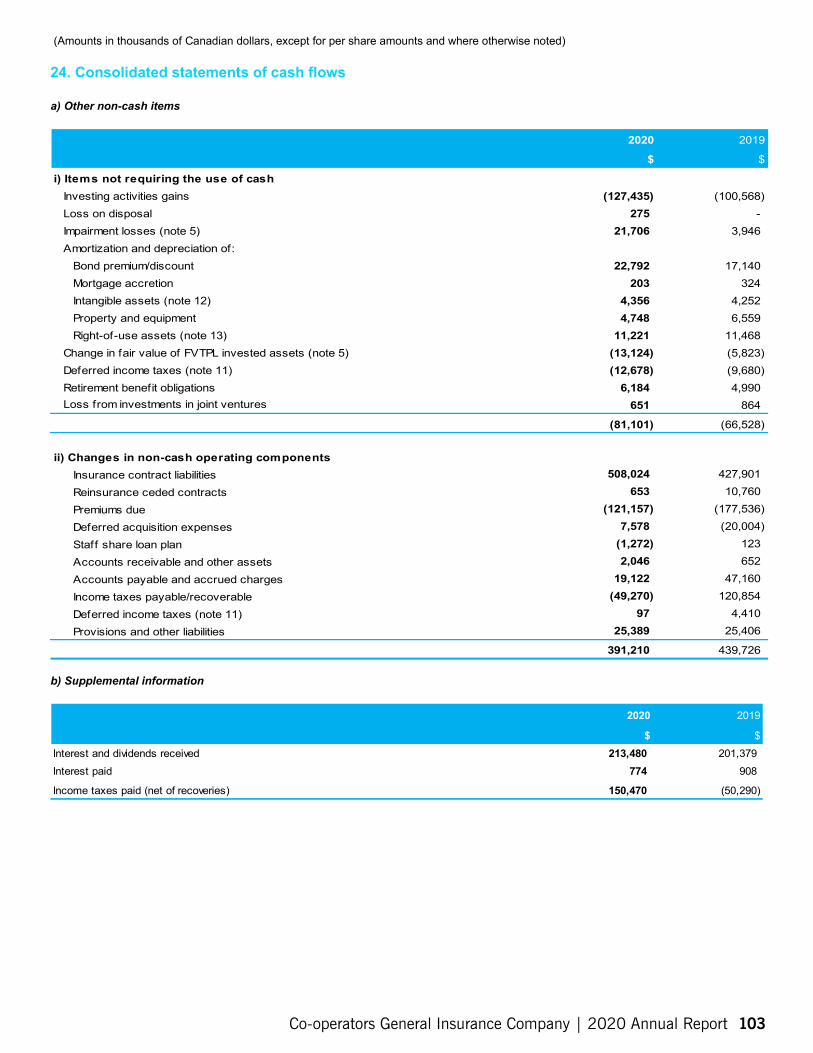
a) Other non-cash items
i) Items not requiring the use of cash Investing activities gains (127,435) (100,568) Loss on disposal 275 -Impairment losses (note 5) 21,706 3,946 Amortization and depreciation of:
Bond premium/discount 22,792 17,140 Mortgage accretion 203 324 Intangible assets (note 12) 4,356 4,252 Property and equipment 4,748 6,559 Right-of-use assets (note 13) 11,221 11,468
Change in fair value of FVTPL invested assets (note 5) (13,124) (5,823) Deferred income taxes (note 11) (12,678) (9,680) Retirement benefit obligations 6,184 4,990
Loss from investments in joint ventures 651 864
(81,101) (66,528)
(Amounts in thousands of Canadian dollars, except for per share amounts and where otherwise noted)
24. Consolidated statements of cash flows
2020
$
2019
$
ii) Changes in non-cash operating components Insurance contract liabilities 508,024 427,901
Reinsurance ceded contracts 653 10,760
Premiums due (121,157) (177,536)
Deferred acquisition expenses 7,578 (20,004)
Staff share loan plan (1,272) 123
Accounts receivable and other assets 2,046 652
Accounts payable and accrued charges 19,122 47,160
Income taxes payable/recoverable (49,270) 120,854
Deferred income taxes (note 11) 97 4,410
Provisions and other liabilities 25,389 25,406
391,210 439,726
b) Supplemental information
2020
$
2019
$ Interest and dividends received 213,480 201,379 Interest paid 774 908
Income taxes paid (net of recoveries) 150,470 (50,290)
Co-operators General Insurance Company | 2020 Annual Report 103
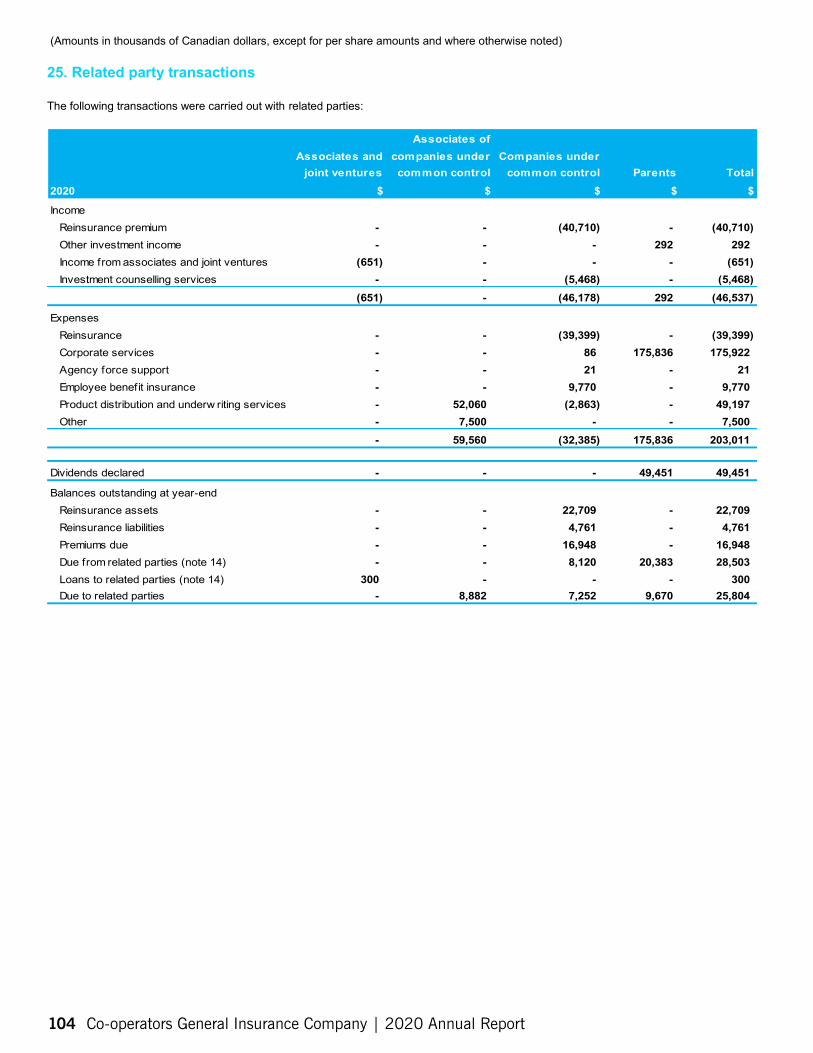
(Amounts in thousands of Canadian dollars, except for per share amounts and where otherwise noted)
25. Related party transactions
The following transactions were carried out with related parties:
Associates of companies under common control
$
Associates and joint ventures
$
Companies under common control
$ Parents
$ Total
$ 2020
Income Reinsurance premium - - (40,710) - (40,710) Other investment income - - - 292 292 Income from associates and joint ventures (651) - - - (651) Investment counselling services - - (5,468) - (5,468)
(651) - (46,178) 292 (46,537)
Expenses Reinsurance - - (39,399) - (39,399) Corporate services - - 86 175,836 175,922 Agency force support - - 21 - 21 Employee benefit insurance - - 9,770 - 9,770 Product distribution and underw riting services - 52,060 (2,863) - 49,197 Other - 7,500 - - 7,500
- 59,560 (32,385) 175,836 203,011
Dividends declared - - - 49,451 49,451
Balances outstanding at year-end Reinsurance assets - - 22,709 - 22,709 Reinsurance liabilities - - 4,761 - 4,761 Premiums due - - 16,948 - 16,948 Due from related parties (note 14) - - 8,120 20,383 28,503 Loans to related parties (note 14) 300 - - - 300 Due to related parties - 8,882 7,252 9,670 25,804
104 Co-operators General Insurance Company | 2020 Annual Report
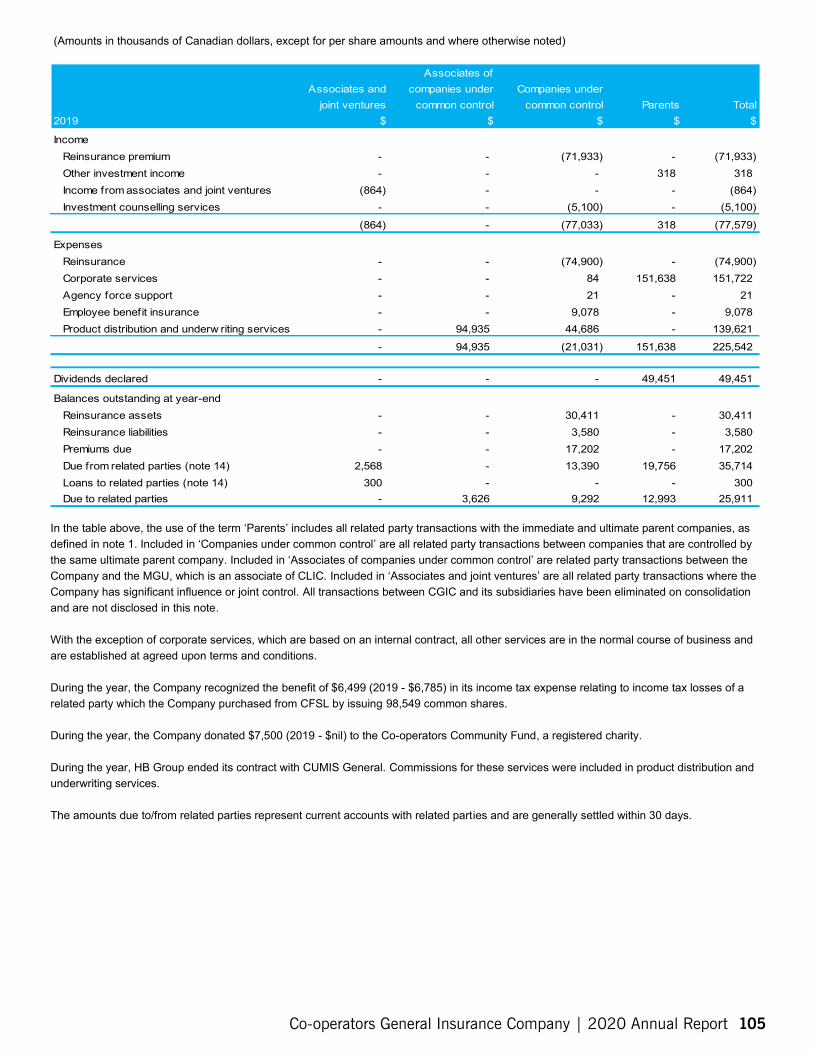
(Amounts in thousands of Canadian dollars, except for per share amounts and where otherwise noted)
Associates of companies under
common control $
Associates and joint ventures
$
Companies under common control
$ Parents
$ Total
$ 2019
Income Reinsurance premium - - (71,933) - (71,933) Other investment income - - - 318 318 Income from associates and joint ventures (864) - - - (864) Investment counselling services - - (5,100) - (5,100)
(864) - (77,033) 318 (77,579)
Expenses Reinsurance - - (74,900) - (74,900) Corporate services - - 84 151,638 151,722 Agency force support - - 21 - 21 Employee benefit insurance - - 9,078 - 9,078 Product distribution and underw riting services - 94,935 44,686 - 139,621
- 94,935 (21,031) 151,638 225,542
Dividends declared - - - 49,451 49,451
Balances outstanding at year-end Reinsurance assets - - 30,411 - 30,411 Reinsurance liabilities - - 3,580 - 3,580 Premiums due - - 17,202 - 17,202 Due from related parties (note 14) 2,568 - 13,390 19,756 35,714 Loans to related parties (note 14) 300 - - - 300 Due to related parties - 3,626 9,292 12,993 25,911
In the table above, the use of the term ‘Parents’ includes all related party transactions with the immediate and ultimate parent companies, as defined in note 1. Included in ‘Companies under common control’ are all related party transactions between companies that are controlled by the same ultimate parent company. Included in ‘Associates of companies under common control’ are related party transactions between the Company and the MGU, which is an associate of CLIC. Included in ‘Associates and joint ventures’ are all related party transactions where the Company has significant influence or joint control. All transactions between CGIC and its subsidiaries have been eliminated on consolidation and are not disclosed in this note.
With the exception of corporate services, which are based on an internal contract, all other services are in the normal course of business and are established at agreed upon terms and conditions.
During the year, the Company recognized the benefit of $6,499 (2019 - $6,785) in its income tax expense relating to income tax losses of a related party which the Company purchased from CFSL by issuing 98,549 common shares.
During the year, the Company donated $7,500 (2019 - $nil) to the Co-operators Community Fund, a registered charity.
During the year, HB Group ended its contract with CUMIS General. Commissions for these services were included in product distribution and underwriting services.
The amounts due to/from related parties represent current accounts with related parties and are generally settled within 30 days.
Co-operators General Insurance Company | 2020 Annual Report 105
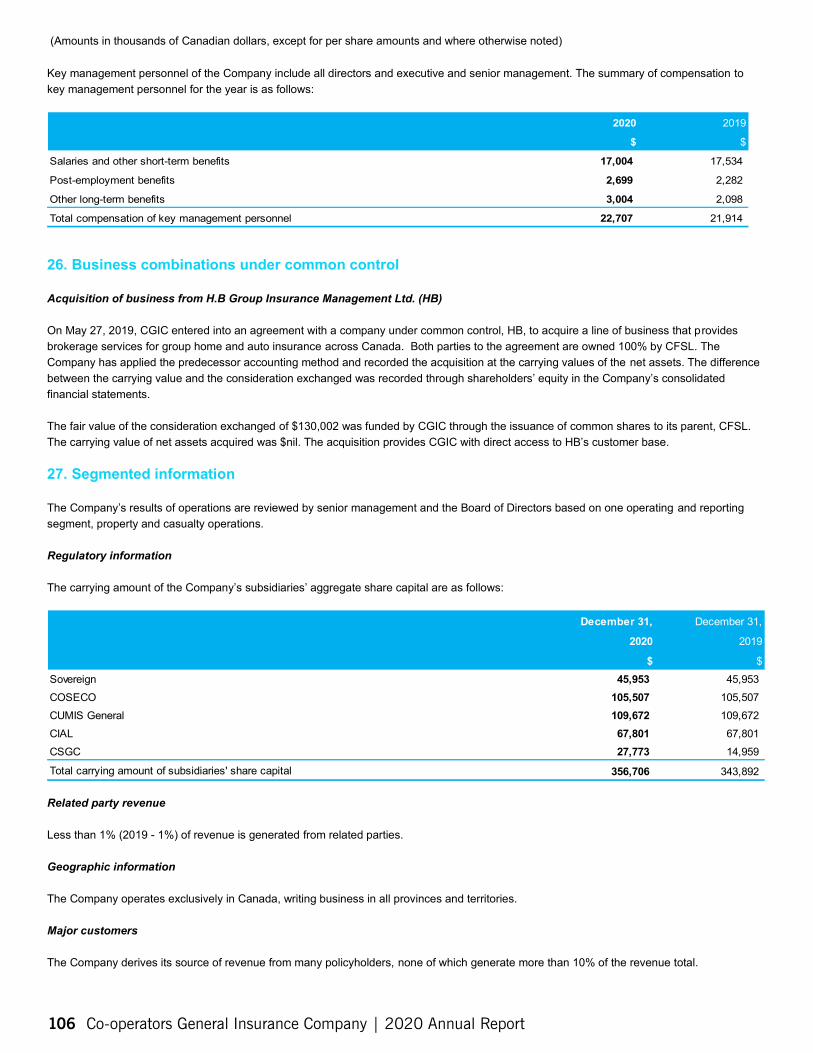
Acquisition of business from H.B Group Insurance Management Ltd. (HB)
Regulatory information
Related party revenue
Geographic information
Major customers
(Amounts in thousands of Canadian dollars, except for per share amounts and where otherwise noted)
Key management personnel of the Company include all directors and executive and senior management. The summary of compensation to key management personnel for the year is as follows:
2020
$
2019
$
Salaries and other short-term benefits 17,004 17,534
Post-employment benefits 2,699 2,282
Other long-term benefits 3,004 2,098
Total compensation of key management personnel 22,707 21,914
26. Business combinations under common control
On May 27, 2019, CGIC entered into an agreement with a company under common control, HB, to acquire a line of business that provides brokerage services for group home and auto insurance across Canada. Both parties to the agreement are owned 100% by CFSL. The Company has applied the predecessor accounting method and recorded the acquisition at the carrying values of the net assets. The difference between the carrying value and the consideration exchanged was recorded through shareholders’ equity in the Company’s consolidated financial statements.
The fair value of the consideration exchanged of $130,002 was funded by CGIC through the issuance of common shares to its parent, CFSL. The carrying value of net assets acquired was $nil. The acquisition provides CGIC with direct access to HB’s customer base.
27. Segmented information
The Company’s results of operations are reviewed by senior management and the Board of Directors based on one operating and reporting segment, property and casualty operations.
The carrying amount of the Company’s subsidiaries’ aggregate share capital are as follows:
December 31,
2020
$
December 31,
2019
$ Sovereign 45,953 45,953 COSECO 105,507 105,507 CUMIS General 109,672 109,672 CIAL 67,801 67,801 CSGC 27,773 14,959
Total carrying amount of subsidiaries' share capital 356,706 343,892
Less than 1% (2019 - 1%) of revenue is generated from related parties.
The Company operates exclusively in Canada, writing business in all provinces and territories.
The Company derives its source of revenue from many policyholders, none of which generate more than 10% of the revenue total.
106 Co-operators General Insurance Company | 2020 Annual Report
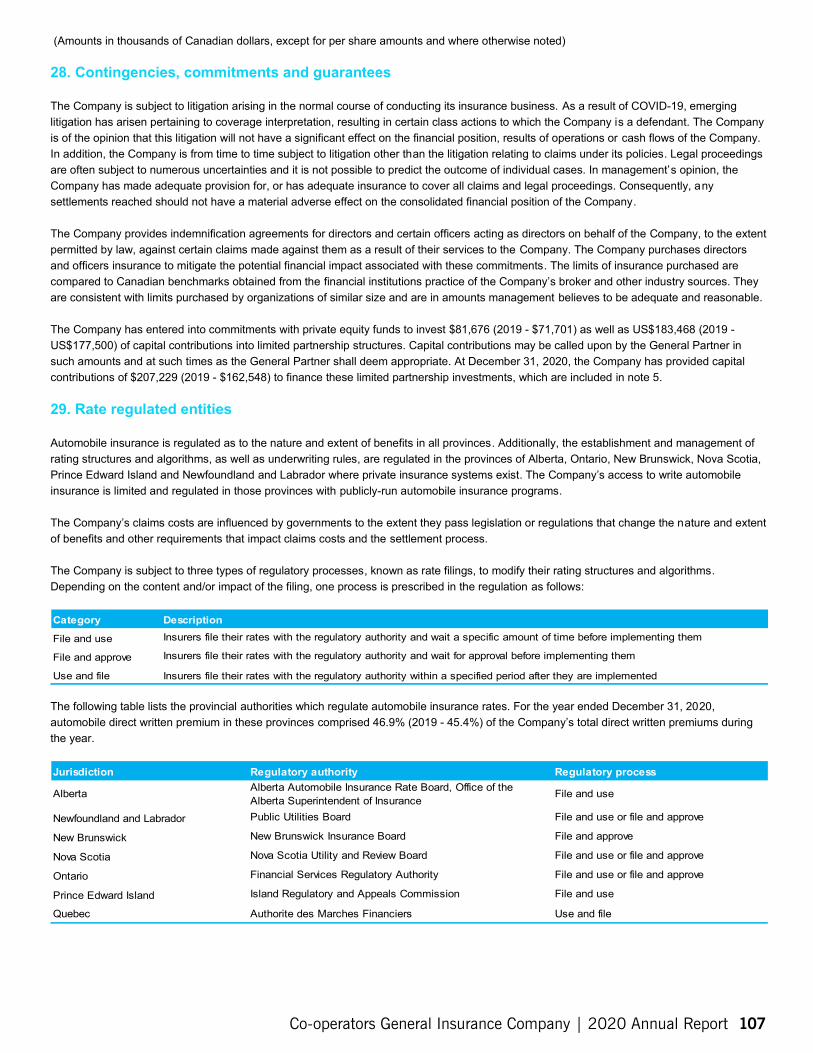
(Amounts in thousands of Canadian dollars, except for per share amounts and where otherwise noted)
28. Contingencies, commitments and guarantees
The Company is subject to litigation arising in the normal course of conducting its insurance business. As a result of COVID-19, emerging litigation has arisen pertaining to coverage interpretation, resulting in certain class actions to which the Company is a defendant. The Company is of the opinion that this litigation will not have a significant effect on the financial position, results of operations or cash flows of the Company. In addition, the Company is from time to time subject to litigation other than the litigation relating to claims under its policies. Legal proceedings are often subject to numerous uncertainties and it is not possible to predict the outcome of individual cases. In management’s opinion, the Company has made adequate provision for, or has adequate insurance to cover all claims and legal proceedings. Consequently, any settlements reached should not have a material adverse effect on the consolidated financial position of the Company.
The Company provides indemnification agreements for directors and certain officers acting as directors on behalf of the Company, to the extent permitted by law, against certain claims made against them as a result of their services to the Company. The Company purchases directors and officers insurance to mitigate the potential financial impact associated with these commitments. The limits of insurance purchased are compared to Canadian benchmarks obtained from the financial institutions practice of the Company’s broker and other industry sources. They are consistent with limits purchased by organizations of similar size and are in amounts management believes to be adequate and reasonable.
The Company has entered into commitments with private equity funds to invest $81,676 (2019 - $71,701) as well as US$183,468 (2019 -US$177,500) of capital contributions into limited partnership structures. Capital contributions may be called upon by the General Partner in such amounts and at such times as the General Partner shall deem appropriate. At December 31, 2020, the Company has provided capital contributions of $207,229 (2019 - $162,548) to finance these limited partnership investments, which are included in note 5.
29. Rate regulated entities
Automobile insurance is regulated as to the nature and extent of benefits in all provinces. Additionally, the establishment and management of rating structures and algorithms, as well as underwriting rules, are regulated in the provinces of Alberta, Ontario, New Brunswick, Nova Scotia, Prince Edward Island and Newfoundland and Labrador where private insurance systems exist. The Company’s access to write automobile insurance is limited and regulated in those provinces with publicly-run automobile insurance programs.
The Company’s claims costs are influenced by governments to the extent they pass legislation or regulations that change the nature and extent of benefits and other requirements that impact claims costs and the settlement process.
The Company is subject to three types of regulatory processes, known as rate filings, to modify their rating structures and algorithms. Depending on the content and/or impact of the filing, one process is prescribed in the regulation as follows:
Category Description
File and use Insurers file their rates with the regulatory authority and wait a specific amount of time before implementing them
File and approve Insurers file their rates with the regulatory authority and wait for approval before implementing them
Use and file Insurers file their rates with the regulatory authority within a specified period after they are implemented
The following table lists the provincial authorities which regulate automobile insurance rates. For the year ended December 31, 2020, automobile direct written premium in these provinces comprised 46.9% (2019 - 45.4%) of the Company’s total direct written premiums during the year.
Jurisdiction Regulatory authority Regulatory process
Alberta Alberta Automobile Insurance Rate Board, Office of the Alberta Superintendent of Insurance
File and use
Newfoundland and Labrador Public Utilities Board File and use or file and approve
New Brunswick New Brunswick Insurance Board File and approve
Nova Scotia Nova Scotia Utility and Review Board File and use or file and approve
Ontario Financial Services Regulatory Authority File and use or file and approve
Prince Edward Island Island Regulatory and Appeals Commission File and use
Quebec Authorite des Marches Financiers Use and file
Co-operators General Insurance Company | 2020 Annual Report 107
Corporate directoryCUMIS GENERAL INSURANCE COMPANY 151 North Service RoadBurlington, ON L7R 4C2Phone: (800) 263-9120cumis.com
Lisa GugliettiExecutive Vice-President and Chief Operating Officer, P&C Manufacturing
Bob HagueExecutive Vice-President, President Credit Union Distribution
COSECO INSURANCE COMPANY5600 Cancross CourtMississauga, ON L5R 3E9Phone: (800) 387-1963cooperatorsgroupinsurance.ca
Lisa GugliettiExecutive Vice-President and Chief Operating Officer, P&C Manufacturing
THE SOVEREIGN GENERALINSURANCE COMPANYSovereign Centre140, 6700 MacLeod Trail SECalgary, AB T2H 0L3Phone: (403) 298-4200sovereigngeneral.com
Steve Phillips Executive Vice-President and Chief Operating Officer
CO-OPERATORS GENERALINSURANCE COMPANY130 Macdonell StreetGuelph, ON N1H 6P8Phone: (519) [email protected]
Robert WesselingPresident and Chief Executive Officer
Kevin DanielExecutive Vice-President and Chief Client Officer
Emmie FukuchiExecutive Vice-President and Chief Digital & Marketing Officer
Lisa GugliettiExecutive Vice-President and Chief Operating Officer, P&C Manufacturing
Paul HannaExecutive Vice-President, Member Relations, Governance and Corporate Services
Karen HigginsExecutive Vice-President and Chief Financial Officer
Carol PoulsenExecutive Vice-President and Chief Information Officer
INVESTOR RELATIONS
Lesley ChristodoulouVice-President, Corporate Finance Services130 Macdonell StreetGuelph, ON N1H 6P8Phone: (519) [email protected]
REGION VICE-PRESIDENTS
Jessica BakerAtlantic Region10 Record StreetMoncton, NB E1C 8N9Phone: (506) 853-1277
Patrick DécarieQuebec Region3080 le Carrefour Blvd., Suite 700Laval, QC H7T 2R5Phone: (514) 703-0983
Mark FeeneyCentral Ontario Region1720 Bishop Street NCambridge, ON N1T 1T2Phone: (519) 618-1216
Chris RossWestern Region 5550 1 Street SW Calgary, AB T2H 0C8Phone: (403) 221-7137
Don ViauNorth East and West Ontario Region1547 Merivale Road, Suite 400Nepean, ON K2G 4V3Phone: (613) 683-1327
SHARE LISTINGSThe Toronto Stock Exchange Symbol“CCS.PR.C”
108 Co-operators General Insurance Company | 2020 Annual Report
Board of DirectorsJohn HarvieChairpersonAtlantic
Denis LaverdièreVice-ChairpersonAtlantic
Robert WesselingPresident and Chief Executive Officer
ALBERTAHazel CorcoranJim LaverickBob Petryk
ATLANTIC Jim MacFarlane
BRITISH COLUMBIAPhil BaudinBill KissMarilyn Loewen Mauritz
MANITOBAJocelyn VanKoughnet
ONTARIODenis BourdeauRick HoevenaarsChris JohnsonGeri KamenzRobert PatersonReba PlummerJack WilkinsonAlexandra Wilson
QUEBECLouis-H. CampagnaJessica Provencher
SASKATCHEWANGilles ColbertCollette Robertson
Co-operators General Insurance Company | 2020 Annual Report 109
The membership of The Co-operators Group Limited consists primarily of co-operative organizations, credit union centrals and representative farm organizations.
Member organizations
Alberta• Alberta Federation of Agriculture• Alberta Federation of Rural
Electrification Associations• Credit Union Central Alberta Limited• Federation of Alberta Gas Co-ops Ltd.• UFA Co-operative Limited
Atlantic• Amalgamated Dairies Limited• Atlantic Central• Atlantic Retail Co-operatives Federation• Canadian Worker Co-operative
Federation†
• Newfoundland-Labrador Federation of Co-operatives
• Northumberland Cooperative Limited• Scotian Gold Cooperative Limited• UNI Coopération Financière
British Columbia• Agrifoods International
Cooperative Limited†
• BC Agriculture Council• BC Tree Fruits Cooperative
• Central 1 Credit Union†
• Modo Co-operative• PBC Health Benefits Society• Realize Strategies Co-op
Manitoba• Arctic Co-operatives Limited• Bee Maid Honey Limited†
• Caisse Populaire Groupe Financier Ltée
• Credit Union Central of Manitoba Limited
• Keystone Agricultural Producers
Ontario• Caisse Populaire Alliance Limitée• Co-operative Housing Federation
of Canada†
• Gay Lea Foods Co-operative Limited• GROWMARK, Inc.• Ontario Federation of Agriculture• Ontario Organic Farmers
Co-operative Inc.• St-Albert Cheese Co-operative Inc.• United Steelworkers ‒ District 6†
Quebec• Exceldor†
• Fédération des coopératives d’alimentation du Québec
• Fédération des coopératives funéraires du Québec
• Fédération québécoise des coopératives en milieu scolaire/COOPSCO
• La Fédération des coopératives du Nouveau-Québec
• Sollio Cooperative Group• william.coop
Saskatchewan• Access Communications
Co-operative Limited• Agricultural Producers Association
of Saskatchewan• Credit Union Central of Saskatchewan• Federated Co-operatives Limited†
• Regina Community Clinic
† Multi-region member
110 Co-operators General Insurance Company | 2020 Annual Report
The Co-operators, 130 Macdonell Street, Guelph, ON N1H 6P8Phone: (519) 824-4400 | cooperators.ca | [email protected] in French ~ Disponible en françaisReleased March 18, 2021 | COR701 (03/21)