Embed Size (px)
Citation preview
This article was downloaded by: [Temple University Libraries]On: 30 September 2013, At: 06:44Publisher: RoutledgeInforma Ltd Registered in England and Wales Registered Number: 1072954Registered office: Mortimer House, 37-41 Mortimer Street, London W1T 3JH,UK
The Journal of InternationalTrade & Economic Development:An International andComparative ReviewPublication details, including instructions for authorsand subscription information:http://www.tandfonline.com/loi/rjte20
Cooperative and non-cooperative R&D and trade costsArghya Ghosh a & Jonathan Lim aa School of Economics, Australian School of Business ,University of New South Wales , Sydney , NSW , 2052 ,AustraliaPublished online: 10 Nov 2011.
To cite this article: Arghya Ghosh & Jonathan Lim (2013) Cooperative and non-cooperative R&D and trade costs, The Journal of International Trade & EconomicDevelopment: An International and Comparative Review, 22:6, 942-958, DOI:10.1080/09638199.2011.618228
To link to this article: http://dx.doi.org/10.1080/09638199.2011.618228
PLEASE SCROLL DOWN FOR ARTICLE
Taylor & Francis makes every effort to ensure the accuracy of all theinformation (the “Content”) contained in the publications on our platform.However, Taylor & Francis, our agents, and our licensors make norepresentations or warranties whatsoever as to the accuracy, completeness, orsuitability for any purpose of the Content. Any opinions and views expressedin this publication are the opinions and views of the authors, and are not theviews of or endorsed by Taylor & Francis. The accuracy of the Content shouldnot be relied upon and should be independently verified with primary sourcesof information. Taylor and Francis shall not be liable for any losses, actions,claims, proceedings, demands, costs, expenses, damages, and other liabilitieswhatsoever or howsoever caused arising directly or indirectly in connectionwith, in relation to or arising out of the use of the Content.

This article may be used for research, teaching, and private study purposes.Any substantial or systematic reproduction, redistribution, reselling, loan, sub-licensing, systematic supply, or distribution in any form to anyone is expresslyforbidden. Terms & Conditions of access and use can be found at http://www.tandfonline.com/page/terms-and-conditions
Dow
nloa
ded
by [
Tem
ple
Uni
vers
ity L
ibra
ries
] at
06:
44 3
0 Se
ptem
ber
2013
© 2013 Taylor & Francis
The Journal of International Trade & Economic Development, 2013Vol. 22, No. , 942–958, http://dx.doi.org/10.1080/09638199.2011.6182286
Cooperative and non-cooperative R&D and trade costs
Arghya Ghosh and Jonathan Lim*
School of Economics, Australian School of Business, University of New South Wales,Sydney, NSW 2052, Australia
(Received 21 December 2010; final version received 24 August 2011)
We examine the effect of trade liberalization on the level and mode ofR&D in an international duopoly setting. Firms have the choice toinvest in R&D either independently or cooperatively. A reduction intrade cost increases R&D irrespective of the mode of R&D. However,an increase in spillovers has ambiguous effects on R&D. More precisely,we find that an increase in spillover leads to higher R&D activity undercooperation but lower R&D activity under non-cooperation. Concern-ing cooperation versus non-cooperation, we find that firms prefercooperation only if trade costs are low. Consumers are better off undercooperation if spillovers are high. We find that there can be a mismatchbetween private and social incentives. If spillovers are low and tradecosts are low then cooperation might be privately profitable but sociallyundesirable. On the other hand, if there are large spillovers and hightrade costs then cooperation may be socially desirable but not privatelyprofitable.
Keywords: R&D; spillovers; trade costs
JEL Classification: F12
1. Introduction
The past 60 years has seen unprecedented growth in trade volume and R&Dexpenditure. According to the World Trade Organization (WTO), growth intrade volume in the past 60 years has averaged around 6.5%. Investment inR&D has also seen dramatic increases in recent years. According to theOECD report (2009), investment in R&D by OECD countries increasedfrom $468 billion in 1996 to $818 billion in 2008. Furthermore, the reportsuggests that trade liberalization has played a significant role in encouragingR&D investment; similar findings have been reported in Liu and Wang(2003), Baldwin and Gu (2004) and Kaiser (2002) amongst others.
Evidence suggests that trade liberalization has encouraged cooperationin R&D. Moreover, the OECD report mentioned above shows that there
*Corresponding author. Email: [email protected]
Dow
nloa
ded
by [
Tem
ple
Uni
vers
ity L
ibra
ries
] at
06:
44 3
0 Se
ptem
ber
2013
The Journal of International Trade & Economic Development 943
Cooperative and non-cooperative R&D and trade costs
Arghya Ghosh and Jonathan Lim*
School of Economics, Australian School of Business, University of New South Wales,Sydney, NSW 2052, Australia
(Received 21 December 2010; final version received 24 August 2011)
We examine the effect of trade liberalization on the level and mode ofR&D in an international duopoly setting. Firms have the choice toinvest in R&D either independently or cooperatively. A reduction intrade cost increases R&D irrespective of the mode of R&D. However,an increase in spillovers has ambiguous effects on R&D. More precisely,we find that an increase in spillover leads to higher R&D activity undercooperation but lower R&D activity under non-cooperation. Concern-ing cooperation versus non-cooperation, we find that firms prefercooperation only if trade costs are low. Consumers are better off undercooperation if spillovers are high. We find that there can be a mismatchbetween private and social incentives. If spillovers are low and tradecosts are low then cooperation might be privately profitable but sociallyundesirable. On the other hand, if there are large spillovers and hightrade costs then cooperation may be socially desirable but not privatelyprofitable.
Keywords: R&D; spillovers; trade costs
JEL Classification: F12
1. Introduction
The past 60 years has seen unprecedented growth in trade volume and R&Dexpenditure. According to the World Trade Organization (WTO), growth intrade volume in the past 60 years has averaged around 6.5%. Investment inR&D has also seen dramatic increases in recent years. According to theOECD report (2009), investment in R&D by OECD countries increasedfrom $468 billion in 1996 to $818 billion in 2008. Furthermore, the reportsuggests that trade liberalization has played a significant role in encouragingR&D investment; similar findings have been reported in Liu and Wang(2003), Baldwin and Gu (2004) and Kaiser (2002) amongst others.
Evidence suggests that trade liberalization has encouraged cooperationin R&D. Moreover, the OECD report mentioned above shows that there
*Corresponding author. Email: [email protected]
has been an increase in the globalization of production, which has led tomore open and networked R&D activities. Vornortas (1997) reports that thenumber of cooperative arrangements has increased tremendously during1985–1995. Specifically, the number of R&D ventures rose from 800 to morethan 3500 in the US (see Hagedoorn 2002; Kaiser 2002; Becker and Dietz2004; and Vuegelers 1997 for more evidence in favor of this claim).International cooperation in R&D has also seen significant growth duringthe 1970s and 1980s. Hergert and Morris (2002) report a clear upward trendin the number of international partnerships between the US and Japan aswell as between the US and the EEC. Guellec and van Pottlesberghe de laPotterie (2001) also find that the international collaboration has alsoincreased. Using patent data, they find that the share of cross-borderownership has increased from the 1985 to 1995; the share of internationalco-inventions has also increased during the same period.
How does trade liberalization affect R&D? Does it encourage coopera-tion? Are privately profitable outcomes necessarily socially desirable? Weaddress these questions in this article. We consider the framework used byBrander and Krugman (1983). There are two countries, each with onedomestic and one foreign firm. The foreign firm faces a tariff when theycompete in the domestic product market. Following Brander and Krugman(1983), we assume that firms are Cournot competitors in the productmarket. In the subsequent analysis, we augment this framework toincorporate R&D. In our model, R&D is modeled as a reduction inmarginal cost (process R&D). R&D spillover is modeled as a reduction inthe marginal cost of production for the competing firm.
Under this setting, we are able to decompose the effects of tradeliberalization and its impact on R&D levels into two effects. One effect isthat foreign competition in the domestic market has increased. This reducesthe incentive for firms to innovate, since the cost of R&D is spread acrossfewer units. However, there is a second effect: trade liberalization increasesmarket share in the export market, which encourages R&D activity. We findthat the latter effect dominates, which in turn leads to higher R&D. Thisresult holds irrespective of the R&D regime.
Interestingly, we find that the impact of spillovers differs across regimes.These differences can be explained by decomposing the effects of spilloverson R&D. On the one hand, an increase in spillover reduces the cost ofproduction for a home firm, which consequently encourages production andtherefore R&D. However, the same spillover also reduces the foreign firm’scost of production. This encourages production by the foreign firm, whichreduces the domestic firm’s production. Under non-cooperation, we findthat the second effect dominates; thus an increase in spillovers discouragesR&D. Under cooperation, the second effect is internalized since firmsmaximize joint profits; thus, we find that an increase in spillovers encouragesR&D when firms cooperate in their R&D decision.
Dow
nloa
ded
by [
Tem
ple
Uni
vers
ity L
ibra
ries
] at
06:
44 3
0 Se
ptem
ber
2013
944 A. Ghosh and J. Lim
The exploration of R&D, spillovers and strategic behavior is not newand was first addressed by Mansfield, Schwartz, and Wagner (1981) andSpence (1984). Mansfield, Schwartz, and Wagner (1981) empirically showedthat about 60% of patented innovations in his sample were imitated withinfour years. As a result, if an industry was characterized by large spillovers, itwas impossible for the innovator to expropriate all the benefits from aninnovation. This finding was reinforced by Spence (1984), who found thatspillovers weaken the incentive to invest in R&D.
One way to overcome this incentive problem was to cooperate in R&D,since cooperation enables the participants to internalize the spillovers andmany authors have argued that the cooperation in R&D could enhance bothR&D expenditure and output (see, e.g. Katz (1986), d’Aspremont andJacquemine (1988), Kamien, Mueller, and Zang (1992), Suzumura (1992)amongst others). Katz (1986) found that cooperation can be beneficial whenproduct market competition is low and spillovers are high. A similar findingwas also reported in d’Aspremont and Jacquemine (1988), who demon-strated that R&D cooperation can also improve welfare under a linearduopoly model. Suzumura (1992) extends d’Aspremont and Jacquemin’s(1988) work by incorporating many firms and a general welfare analysis forboth cooperative and non-cooperative R&D regimes.
Kamien, Mueller, and Zang (1992) extend d’Aspremont andJacquemine (1988) by considering price competition and research jointventures (RJV) as a mode of R&D. Specifically, they consider a two stagegame. In stage 1, firms choose the level of R&D and in stage 2, firmsengage in product competition. The authors consider four different modesof R&D under which firms can cooperate: R&D competition, R&Dcartelization, RJV competition and RJV cartelization. The difference ineach of these cases is in the treatment of the R&D stage game. UnderR&D competition, firms choose the level of R&D independently tomaximize individual profits. Under R&D cartelization, firms coordinatetheir R&D effort by maximizing joint profits. Under RJV competition,firms maximize individual profits by choosing R&D independently butshare their R&D knowledge (i.e. spillovers are perfect). Finally, underRJV cartelization, firms not only share their knowledge but alsocoordinate their efforts to maximize joint profits. Kamien, Mueller, andZang (1992) find that RJV cartelization yields the highest equilibriumwelfare. Furthermore, a RJV cartel also results in the highest per firmprofit and the lowest prices of all other cases considered in equilibrium.This finding further reinforces D’Aspremont and Jacquemine (1988), whofind that cooperation in R&D can be welfare improving.
Until recently, the literature on cooperative R&D has ignored the effectsof cooperation under an open economy setting. Two exceptions are Motta(1996) and DeCourcy (2005). Motta (1996) considers a two-country settingin which duopolistic competition takes place in each country. Motta (1996)
A. Ghosh and J. Lim
Dow
nloa
ded
by [
Tem
ple
Uni
vers
ity L
ibra
ries
] at
06:
44 3
0 Se
ptem
ber
2013
The Journal of International Trade & Economic Development 945
The exploration of R&D, spillovers and strategic behavior is not newand was first addressed by Mansfield, Schwartz, and Wagner (1981) andSpence (1984). Mansfield, Schwartz, and Wagner (1981) empirically showedthat about 60% of patented innovations in his sample were imitated withinfour years. As a result, if an industry was characterized by large spillovers, itwas impossible for the innovator to expropriate all the benefits from aninnovation. This finding was reinforced by Spence (1984), who found thatspillovers weaken the incentive to invest in R&D.
One way to overcome this incentive problem was to cooperate in R&D,since cooperation enables the participants to internalize the spillovers andmany authors have argued that the cooperation in R&D could enhance bothR&D expenditure and output (see, e.g. Katz (1986), d’Aspremont andJacquemine (1988), Kamien, Mueller, and Zang (1992), Suzumura (1992)amongst others). Katz (1986) found that cooperation can be beneficial whenproduct market competition is low and spillovers are high. A similar findingwas also reported in d’Aspremont and Jacquemine (1988), who demon-strated that R&D cooperation can also improve welfare under a linearduopoly model. Suzumura (1992) extends d’Aspremont and Jacquemin’s(1988) work by incorporating many firms and a general welfare analysis forboth cooperative and non-cooperative R&D regimes.
Kamien, Mueller, and Zang (1992) extend d’Aspremont andJacquemine (1988) by considering price competition and research jointventures (RJV) as a mode of R&D. Specifically, they consider a two stagegame. In stage 1, firms choose the level of R&D and in stage 2, firmsengage in product competition. The authors consider four different modesof R&D under which firms can cooperate: R&D competition, R&Dcartelization, RJV competition and RJV cartelization. The difference ineach of these cases is in the treatment of the R&D stage game. UnderR&D competition, firms choose the level of R&D independently tomaximize individual profits. Under R&D cartelization, firms coordinatetheir R&D effort by maximizing joint profits. Under RJV competition,firms maximize individual profits by choosing R&D independently butshare their R&D knowledge (i.e. spillovers are perfect). Finally, underRJV cartelization, firms not only share their knowledge but alsocoordinate their efforts to maximize joint profits. Kamien, Mueller, andZang (1992) find that RJV cartelization yields the highest equilibriumwelfare. Furthermore, a RJV cartel also results in the highest per firmprofit and the lowest prices of all other cases considered in equilibrium.This finding further reinforces D’Aspremont and Jacquemine (1988), whofind that cooperation in R&D can be welfare improving.
Until recently, the literature on cooperative R&D has ignored the effectsof cooperation under an open economy setting. Two exceptions are Motta(1996) and DeCourcy (2005). Motta (1996) considers a two-country settingin which duopolistic competition takes place in each country. Motta (1996)
finds that national cooperation gives domestic firms an advantage in theinternational market (in much the same way as a domestic R&D subsidywould provide a strategic advantage). Furthermore, in the policy game,governments allow firms to cooperate amongst themselves, which improveswelfare for both countries. DeCourcy (2005) extends upon Motta (1996) byconsidering all three cases mentioned by Kamien, Muller, and Zang (1992).She finds that cooperation can result in more R&D relative to non-cooperation. If spillovers are high, cooperation is preferred to subsidies.Given the strategic importance of R&D (in a trade context), issues regardingoptimal subsidies (R&D or Export) has attracted significant attention;Leahy and Neary (1997, 1999) and Neary and O’Sullivan (1999) haveexamined this issue in detail.
Most papers in this literature use the Brander and Spencer (1983)framework, in which firms from the two countries compete in a thirdmarket. Under this framework, we cannot distinguish the effects of trade onexports and home production. So, here we take a segmented marketsapproach and examine how trade liberalization affects a firm’s incentive toundertake R&D given exogenous spillovers. Furthermore, we examinewhether trade liberalization affects the nature of arrangement in which R&Dis undertaken. A direct consequence of this analysis is the potentialmismatch between consumers and firms’ preferred mode of R&D. Theseconflicts arise when both spillovers and trade costs are low as well as whenspillovers and trade costs are high.
Cooperative and non-cooperative R&D policy in a two-country settinghave been discussed in some recent papers by Haaland and Kind (2006,2008) and Petit and Sanna-Randaccio (1998, 2000). Both papers by Haalandand Kind (2006, 2008) consider international duopoly with differentiatedproducts and look at subsidy policies in a two-country setting like ourswhere each country has one firm. However, they do not consider R&Dspillovers which play an important role in the choice of cooperation versusnon-cooperation in our framework. Petit and Sanna-Randaccio (2000)consider homogenous product duopoly and allow for R&D spillover. Inaddition to the case where firms serve foreign market via exports, they alsoconsider the case where firms undertake FDI to serve the foreign markets.The spillover parameter plays an important role in each firm’s decisionregarding mode of entry in the foreign markets – exports versus FDI. Thechoice of entry mode is also the key question in Petit and Sanna-Randaccio(1998). However, the latter article focuses on a monopoly scenario wherespillover does not play any role.
The article is organized as follows. Section 2 describes the basic modeland the timing of the game. Section 3 analyzes the framework with a focuson the effects of trade and spillovers on R&D. Section 4 examines the choicebetween the two regimes (non-cooperation and cooperation) and examineshow trade liberalization affects a firm’s profit and consumer surplus. It also
Dow
nloa
ded
by [
Tem
ple
Uni
vers
ity L
ibra
ries
] at
06:
44 3
0 Se
ptem
ber
2013
946 A. Ghosh and J. Lim
contains discussion on policy implications of our results. Section 5concludes.
2. The model
We consider amodel with two countries (A andB), each with one firm. FirmAis located in and owned by residents of country A, likewise for firm B. Bothfirms,A andB, produce for the homemarket and export to the foreignmarket.
There is a unit mass of identical consumers in each country. Therepresentative consumer preference in each country i is given by:
Ui ¼ aðqii þ qjiÞ �qii2þ qji
2
� �2þ y ð1Þ
where qij denote the output sold by firm i in country j’s market and y denotesthe numeraire good.
Solving the consumer’s utility maximization problem gives the followinginverse demand curve for country i:
Pi ¼ a�Qi ¼ a� qii � qji ð2Þ
where Pi and Qi(¼ qii þ qji) respectively denote the price and aggregateoutput in market i.
The marginal cost of production is c for both firms. We assume thatc 5 a. Firms have the option of conducting R&D to reduce the marginalcost of production. We denote the R&D conducted by firm i as xi, i 2 [A,B].The cost of R&D is
dx2i2 , where d captures the efficiency of the R&D
technology and is identical across firms.1 R&D results in spillovers (g) tocompeting firms which in turn reduces their unit cost of production. The netmarginal cost of production for firm i is:
ci ¼ c� xi � gxj; i 6¼ j
where g 2 (0,1) captures the spillover from firm j’s R&D.Given this framework, firm i’s profit from domestic market i and export
market j are
pii ¼ ðPi � ciÞqiiand
pij ¼ ðPj � ci � tÞqij
Observe that, for the export market, each producer faces an additionalper unit tariff t for each unit exported. We denote the total profit of firm i, pi,
Dow
nloa
ded
by [
Tem
ple
Uni
vers
ity L
ibra
ries
] at
06:
44 3
0 Se
ptem
ber
2013
The Journal of International Trade & Economic Development 947
contains discussion on policy implications of our results. Section 5concludes.
2. The model
We consider amodel with two countries (A andB), each with one firm. FirmAis located in and owned by residents of country A, likewise for firm B. Bothfirms,A andB, produce for the homemarket and export to the foreignmarket.
There is a unit mass of identical consumers in each country. Therepresentative consumer preference in each country i is given by:
Ui ¼ aðqii þ qjiÞ �qii2þ qji
2
� �2þ y ð1Þ
where qij denote the output sold by firm i in country j’s market and y denotesthe numeraire good.
Solving the consumer’s utility maximization problem gives the followinginverse demand curve for country i:
Pi ¼ a�Qi ¼ a� qii � qji ð2Þ
where Pi and Qi(¼ qii þ qji) respectively denote the price and aggregateoutput in market i.
The marginal cost of production is c for both firms. We assume thatc 5 a. Firms have the option of conducting R&D to reduce the marginalcost of production. We denote the R&D conducted by firm i as xi, i 2 [A,B].The cost of R&D is
dx2i2 , where d captures the efficiency of the R&D
technology and is identical across firms.1 R&D results in spillovers (g) tocompeting firms which in turn reduces their unit cost of production. The netmarginal cost of production for firm i is:
ci ¼ c� xi � gxj; i 6¼ j
where g 2 (0,1) captures the spillover from firm j’s R&D.Given this framework, firm i’s profit from domestic market i and export
market j are
pii ¼ ðPi � ciÞqiiand
pij ¼ ðPj � ci � tÞqij
Observe that, for the export market, each producer faces an additionalper unit tariff t for each unit exported. We denote the total profit of firm i, pi,
as the sum of profits from the domestic and foreign market. Thuspi ¼ pii þ pij. This implies that the firm i’s net profit is:
Pi ¼ pi �dx2i2
ð3Þ
We consider the following two stage game.
[Stage 1] R&D decisions: There are two possible cases – cooperation andnon-cooperation in R&D. In the non-cooperation case, given xj, each firm ichooses xi to maximize Pi. In the cooperative case, firms A and B jointlychooses xA and xB to maximize joint net profits PA þ PB.
[Stage 2] Cournot competition: Each firm i 2 {A,B} chooses qii and qij tomaximize pi.
3. Analysis
We consider an equilibrium in which the two firms decide whether or not tocooperate in Stage 1, so that each firm’s profit in the subsequent symmetricSPNE outcome is maximized. We assume that a 4 2(c þ t), so that eachfirm sells a strictly positive amount in the export market. Furthermore, weassume that d > 16
9 which ensures that the profit function Pi is strictlyconcave in xi for all regimes.
Consider the stage 2 subgame in which firms compete in quantities.Suppose xi and xj are the chosen levels of R&D in the first stage. Withoutloss of generality, consider country i’s market. Routine calculation gives thefollowing Cournot equilibrium quantities:
qiiðxi; xj; tÞ ¼a� cþ tþ xið2� gÞ þ xjð2g� 1Þ
3ð4Þ
qjiðxi; xj; tÞ ¼a� c� 2tþ xjð2� gÞ þ xið2g� 1Þ
3ð5Þ
where {i,j} 2 {A,B}, i 6¼j.Note that while an increase in xi unambiguously raises qii, the effect of xi
on qji depends on the spillovers.
Lemma 1: An increase in R&D by firm i leads to an increase in firm i’soutput though firm j’s output can increase or decrease. If spillovers are high( g > 1
2 ), rival firm j’s output increase while if spillovers are low ( g < 12 ) rival
firm j’s output decline. More precisely, (i) @qii@xi
> 0 for all g 2 [0,1), (ii)@qji@xi
< 0if g < 1
2, and (iii)@qji@xi
> 0 if g > 12.
Dow
nloa
ded
by [
Tem
ple
Uni
vers
ity L
ibra
ries
] at
06:
44 3
0 Se
ptem
ber
2013
948 A. Ghosh and J. Lim
An increase in R&D by firm i reduces the unit cost of production for firmi which in turn leads to lower qii. Concerning the impact of xi on qji, there aretwo effects at work: the strategic effect and the spillover effect. It is apparentthat an increase in xi increases qii. However, since qii and qji are strategicsubstitutes, an increase in qii leads to a decline in qji. This is the strategiceffect. The spillover effect examines the impact of spillover from firm i’sR&D on firm j’s output. The higher the xi, the greater is gxi, and the lower iscj ¼ c 7xj 7 gxi. This in turn increases qji. Lemma 1 captures the interplaybetween these two effects and the importance of spillovers. If spillovers arehigh, the spillover effect dominates and consequently an increase in the firmi’s R&D increases qji. However, if spillovers are low then the strategic effectdominates.
Now we turn to the analysis of the stage 1 subgame in which each firmchoose R&D levels. We first consider the non-cooperative case.
3.1. Non-cooperation subgame
Given the simple setup, we can show that the stage 2 profits are denoted by:
pii ¼ qii xi; xj; t� �� �2 � pii xi; xj; t
� �;pij ¼ qij xi; xj; t
� �� �2 � pij xi; xj; t� �
Under the non-cooperation regime, firm i chooses xi to maximize
pii xi; xj; t� �
þ pij xi;xj; t� �
� dx2i2
which results in the following reaction function:
xi ¼4ð2� gÞða� c� tþ xjð2g� 1ÞÞ
9d� 4g2 þ 16g� 16i 6¼ j
Lemma 2: If g 5 1/2, xi and xj are strategic substitutes, whereas ifg 4 1/2, xi and xj are strategic complements. That is, dxidxj
< ð>Þ0 if g < ð>Þ 12.
Lemma 2 highlights an interesting point. If spillovers are low (i.e. g < 12),
the R&D game mirrors the Cournot quantity game. That is, an increase inR&D by firm j reduces the level of R&D undertaken by firm i, thus implyingthat xi and xj are strategic substitutes. However, if spillovers are high (i.e.g > 1
2), an increase in xj leads to an increase in qi (see Lemma 1). Thisincreases the incentive for firm i to undertake additional R&D since the costreduction can be spread across more units.
The results stated in Lemmas 1 and 2 are not new. Similar results havebeen reported in Suzumura (1992). Nevertheless we present those results asLemmas to show that these results are applicable to our two country trade
Dow
nloa
ded
by [
Tem
ple
Uni
vers
ity L
ibra
ries
] at
06:
44 3
0 Se
ptem
ber
2013
The Journal of International Trade & Economic Development 949
An increase in R&D by firm i reduces the unit cost of production for firmi which in turn leads to lower qii. Concerning the impact of xi on qji, there aretwo effects at work: the strategic effect and the spillover effect. It is apparentthat an increase in xi increases qii. However, since qii and qji are strategicsubstitutes, an increase in qii leads to a decline in qji. This is the strategiceffect. The spillover effect examines the impact of spillover from firm i’sR&D on firm j’s output. The higher the xi, the greater is gxi, and the lower iscj ¼ c 7xj 7 gxi. This in turn increases qji. Lemma 1 captures the interplaybetween these two effects and the importance of spillovers. If spillovers arehigh, the spillover effect dominates and consequently an increase in the firmi’s R&D increases qji. However, if spillovers are low then the strategic effectdominates.
Now we turn to the analysis of the stage 1 subgame in which each firmchoose R&D levels. We first consider the non-cooperative case.
3.1. Non-cooperation subgame
Given the simple setup, we can show that the stage 2 profits are denoted by:
pii ¼ qii xi; xj; t� �� �2 � pii xi; xj; t
� �;pij ¼ qij xi; xj; t
� �� �2 � pij xi; xj; t� �
Under the non-cooperation regime, firm i chooses xi to maximize
pii xi; xj; t� �
þ pij xi;xj; t� �
� dx2i2
which results in the following reaction function:
xi ¼4ð2� gÞða� c� tþ xjð2g� 1ÞÞ
9d� 4g2 þ 16g� 16i 6¼ j
Lemma 2: If g 5 1/2, xi and xj are strategic substitutes, whereas ifg 4 1/2, xi and xj are strategic complements. That is, dxidxj
< ð>Þ0 if g < ð>Þ 12.
Lemma 2 highlights an interesting point. If spillovers are low (i.e. g < 12),
the R&D game mirrors the Cournot quantity game. That is, an increase inR&D by firm j reduces the level of R&D undertaken by firm i, thus implyingthat xi and xj are strategic substitutes. However, if spillovers are high (i.e.g > 1
2), an increase in xj leads to an increase in qi (see Lemma 1). Thisincreases the incentive for firm i to undertake additional R&D since the costreduction can be spread across more units.
The results stated in Lemmas 1 and 2 are not new. Similar results havebeen reported in Suzumura (1992). Nevertheless we present those results asLemmas to show that these results are applicable to our two country trade
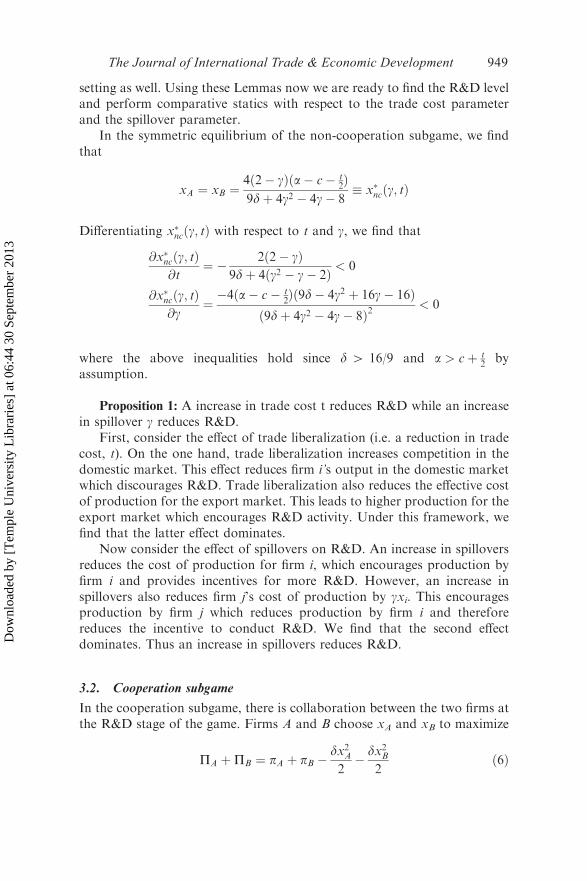
setting as well. Using these Lemmas now we are ready to find the R&D leveland perform comparative statics with respect to the trade cost parameterand the spillover parameter.
In the symmetric equilibrium of the non-cooperation subgame, we findthat
xA ¼ xB ¼4ð2� gÞða� c� t
2Þ9dþ 4g2 � 4g� 8
� x�ncðg; tÞ
Differentiating x�ncðg; tÞ with respect to t and g, we find that
@x�ncðg; tÞ@t
¼ � 2ð2� gÞ9dþ 4ðg2 � g� 2Þ < 0
@x�ncðg; tÞ@g
¼�4ða� c� t
2Þð9d� 4g2 þ 16g� 16Þð9dþ 4g2 � 4g� 8Þ2
< 0
where the above inequalities hold since d 4 16/9 and a > cþ t2 by
assumption.
Proposition 1: A increase in trade cost t reduces R&D while an increasein spillover g reduces R&D.
First, consider the effect of trade liberalization (i.e. a reduction in tradecost, t). On the one hand, trade liberalization increases competition in thedomestic market. This effect reduces firm i’s output in the domestic marketwhich discourages R&D. Trade liberalization also reduces the effective costof production for the export market. This leads to higher production for theexport market which encourages R&D activity. Under this framework, wefind that the latter effect dominates.
Now consider the effect of spillovers on R&D. An increase in spilloversreduces the cost of production for firm i, which encourages production byfirm i and provides incentives for more R&D. However, an increase inspillovers also reduces firm j’s cost of production by gxi. This encouragesproduction by firm j which reduces production by firm i and thereforereduces the incentive to conduct R&D. We find that the second effectdominates. Thus an increase in spillovers reduces R&D.
3.2. Cooperation subgame
In the cooperation subgame, there is collaboration between the two firms atthe R&D stage of the game. Firms A and B choose xA and xB to maximize
PA þPB ¼ pA þ pB � dx2A2
� dx2B2
ð6Þ
Dow
nloa
ded
by [
Tem
ple
Uni
vers
ity L
ibra
ries
] at
06:
44 3
0 Se
ptem
ber
2013
950 A. Ghosh and J. Lim
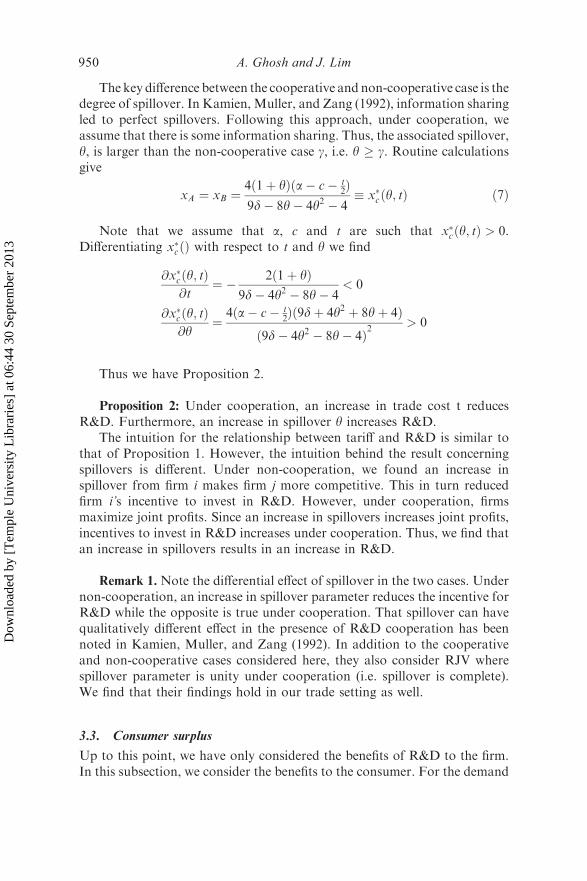
Thekey difference between the cooperative and non-cooperative case is thedegree of spillover. In Kamien, Muller, and Zang (1992), information sharingled to perfect spillovers. Following this approach, under cooperation, weassume that there is some information sharing. Thus, the associated spillover,y, is larger than the non-cooperative case g, i.e. y � g. Routine calculationsgive
xA ¼ xB ¼4ð1þ yÞða� c� t
2Þ9d� 8y� 4y2 � 4
� x�cðy; tÞ ð7Þ
Note that we assume that a, c and t are such that x�cðy; tÞ > 0.Differentiating x�cðÞ with respect to t and y we find
@x�cðy; tÞ@t
¼ � 2ð1þ yÞ9d� 4y2 � 8y� 4
< 0
@x�cðy; tÞ@y
¼4ða� c� t
2Þð9dþ 4y2 þ 8yþ 4Þ
ð9d� 4y2 � 8y� 4Þ2> 0
Thus we have Proposition 2.
Proposition 2: Under cooperation, an increase in trade cost t reducesR&D. Furthermore, an increase in spillover y increases R&D.
The intuition for the relationship between tariff and R&D is similar tothat of Proposition 1. However, the intuition behind the result concerningspillovers is different. Under non-cooperation, we found an increase inspillover from firm i makes firm j more competitive. This in turn reducedfirm i’s incentive to invest in R&D. However, under cooperation, firmsmaximize joint profits. Since an increase in spillovers increases joint profits,incentives to invest in R&D increases under cooperation. Thus, we find thatan increase in spillovers results in an increase in R&D.
Remark 1. Note the differential effect of spillover in the two cases. Undernon-cooperation, an increase in spillover parameter reduces the incentive forR&D while the opposite is true under cooperation. That spillover can havequalitatively different effect in the presence of R&D cooperation has beennoted in Kamien, Muller, and Zang (1992). In addition to the cooperativeand non-cooperative cases considered here, they also consider RJV wherespillover parameter is unity under cooperation (i.e. spillover is complete).We find that their findings hold in our trade setting as well.
3.3. Consumer surplus
Up to this point, we have only considered the benefits of R&D to the firm.In this subsection, we consider the benefits to the consumer. For the demand
Dow
nloa
ded
by [
Tem
ple
Uni
vers
ity L
ibra
ries
] at
06:
44 3
0 Se
ptem
ber
2013
The Journal of International Trade & Economic Development 951
Thekey difference between the cooperative and non-cooperative case is thedegree of spillover. In Kamien, Muller, and Zang (1992), information sharingled to perfect spillovers. Following this approach, under cooperation, weassume that there is some information sharing. Thus, the associated spillover,y, is larger than the non-cooperative case g, i.e. y � g. Routine calculationsgive
xA ¼ xB ¼4ð1þ yÞða� c� t
2Þ9d� 8y� 4y2 � 4
� x�cðy; tÞ ð7Þ
Note that we assume that a, c and t are such that x�cðy; tÞ > 0.Differentiating x�cðÞ with respect to t and y we find
@x�cðy; tÞ@t
¼ � 2ð1þ yÞ9d� 4y2 � 8y� 4
< 0
@x�cðy; tÞ@y
¼4ða� c� t
2Þð9dþ 4y2 þ 8yþ 4Þ
ð9d� 4y2 � 8y� 4Þ2> 0
Thus we have Proposition 2.
Proposition 2: Under cooperation, an increase in trade cost t reducesR&D. Furthermore, an increase in spillover y increases R&D.
The intuition for the relationship between tariff and R&D is similar tothat of Proposition 1. However, the intuition behind the result concerningspillovers is different. Under non-cooperation, we found an increase inspillover from firm i makes firm j more competitive. This in turn reducedfirm i’s incentive to invest in R&D. However, under cooperation, firmsmaximize joint profits. Since an increase in spillovers increases joint profits,incentives to invest in R&D increases under cooperation. Thus, we find thatan increase in spillovers results in an increase in R&D.
Remark 1. Note the differential effect of spillover in the two cases. Undernon-cooperation, an increase in spillover parameter reduces the incentive forR&D while the opposite is true under cooperation. That spillover can havequalitatively different effect in the presence of R&D cooperation has beennoted in Kamien, Muller, and Zang (1992). In addition to the cooperativeand non-cooperative cases considered here, they also consider RJV wherespillover parameter is unity under cooperation (i.e. spillover is complete).We find that their findings hold in our trade setting as well.
3.3. Consumer surplus
Up to this point, we have only considered the benefits of R&D to the firm.In this subsection, we consider the benefits to the consumer. For the demand
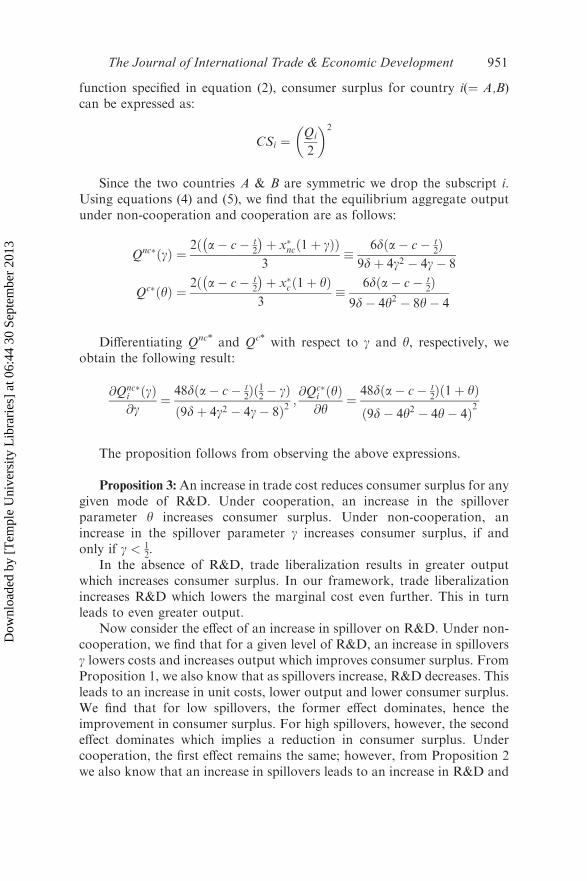
function specified in equation (2), consumer surplus for country i(¼ A,B)can be expressed as:
CSi ¼Qi
2
� �2
Since the two countries A & B are symmetric we drop the subscript i.Using equations (4) and (5), we find that the equilibrium aggregate outputunder non-cooperation and cooperation are as follows:
Qnc�ðgÞ ¼2ð a� c� t
2
� �þ x�ncð1þ gÞÞ3
�6dða� c� t
2Þ9dþ 4g2 � 4g� 8
Qc�ðyÞ ¼2ð a� c� t
2
� �þ x�cð1þ yÞ
3�
6dða� c� t2Þ
9d� 4y2 � 8y� 4
Differentiating Qnc* and Qc* with respect to g and y, respectively, weobtain the following result:
@Qnc�i ðgÞ@g
¼48dða� c� t
2Þð12 � gÞ
ð9dþ 4g2 � 4g� 8Þ2;@Qc�
i ðyÞ@y
¼48dða� c� t
2Þð1þ yÞ
ð9d� 4y2 � 4y� 4Þ2
The proposition follows from observing the above expressions.
Proposition 3: An increase in trade cost reduces consumer surplus for anygiven mode of R&D. Under cooperation, an increase in the spilloverparameter y increases consumer surplus. Under non-cooperation, anincrease in the spillover parameter g increases consumer surplus, if andonly if g < 1
2.In the absence of R&D, trade liberalization results in greater output
which increases consumer surplus. In our framework, trade liberalizationincreases R&D which lowers the marginal cost even further. This in turnleads to even greater output.
Now consider the effect of an increase in spillover on R&D. Under non-cooperation, we find that for a given level of R&D, an increase in spilloversg lowers costs and increases output which improves consumer surplus. FromProposition 1, we also know that as spillovers increase, R&D decreases. Thisleads to an increase in unit costs, lower output and lower consumer surplus.We find that for low spillovers, the former effect dominates, hence theimprovement in consumer surplus. For high spillovers, however, the secondeffect dominates which implies a reduction in consumer surplus. Undercooperation, the first effect remains the same; however, from Proposition 2we also know that an increase in spillovers leads to an increase in R&D and
Dow
nloa
ded
by [
Tem
ple
Uni
vers
ity L
ibra
ries
] at
06:
44 3
0 Se
ptem
ber
2013
952 A. Ghosh and J. Lim
lower costs. Thus we find that an increase in spillovers leads to animprovement in consumer surplus under cooperation.
4. Cooperation versus non-cooperation
So far, we have considered the effect of trade on R&D for firms andconsumers and concluded that trade liberalization benefits both firms andconsumers irrespective of the R&D regime. Now, suppose, in addition tostage 1 (R&D decisions) and stage 2 (Cournot competition) there is a stage0, a prior stage where the two firms decide whether to cooperate or not. Inthis section we compare the two cases, i.e. cooperative R&D and non-cooperative R&D, and evaluate the conditions under which firms andconsumer prefer cooperation in stage 0.
4.1. Firms’ profits
Suppose that there are no additional costs of cooperation. Firm i prefers tocooperate if (equilibrium) profits under cooperation, PiC�i ðy; tÞ, exceed thatfrom non-cooperation, PNC�
i ðg; tÞ. That is,
PC�i ðy; tÞ �PNC�
i ðg; tÞ � 0
Since the two firms are symmetric, without loss of generality we considerfirm A’s problem. Assuming that the fixed cost, F, of cooperation is sharedequally among two firms, cooperation occurs if,
PC�A ðy; tÞ �PNC�
A ðg; tÞ � F
2
This can be re-written as:
ðPC�A ðy; tÞ �PC�
A ðg; tÞÞ|fflfflfflfflfflfflfflfflfflfflfflfflfflfflfflfflfflfflffl{zfflfflfflfflfflfflfflfflfflfflfflfflfflfflfflfflfflfflffl}Spillover Effect
þðPC�A ðgÞ �PNC�
A ðgÞÞ|fflfflfflfflfflfflfflfflfflfflfflfflfflfflfflffl{zfflfflfflfflfflfflfflfflfflfflfflfflfflfflfflffl}Coordination Effect
� Gðy; g; tÞ � F
2
Note that in the above expression, we have decomposed the gainsfrom cooperation into two effects. They are the ‘spillover effect’ and the‘coordination effect’. The spillover effect measures the change incooperative profit due to an increase in the spillover parameter from gto y. The coordination effect measures the change in profitability due toa switch of regime from non-cooperation to cooperation. Substitutingx�ncðÞ, x�cðÞ, Q�
ncðÞ and Q�cðÞ into G(), we find the equivalent condition to
be:
Dow
nloa
ded
by [
Tem
ple
Uni
vers
ity L
ibra
ries
] at
06:
44 3
0 Se
ptem
ber
2013
The Journal of International Trade & Economic Development 953
lower costs. Thus we find that an increase in spillovers leads to animprovement in consumer surplus under cooperation.
4. Cooperation versus non-cooperation
So far, we have considered the effect of trade on R&D for firms andconsumers and concluded that trade liberalization benefits both firms andconsumers irrespective of the R&D regime. Now, suppose, in addition tostage 1 (R&D decisions) and stage 2 (Cournot competition) there is a stage0, a prior stage where the two firms decide whether to cooperate or not. Inthis section we compare the two cases, i.e. cooperative R&D and non-cooperative R&D, and evaluate the conditions under which firms andconsumer prefer cooperation in stage 0.
4.1. Firms’ profits
Suppose that there are no additional costs of cooperation. Firm i prefers tocooperate if (equilibrium) profits under cooperation, PiC�i ðy; tÞ, exceed thatfrom non-cooperation, PNC�
i ðg; tÞ. That is,
PC�i ðy; tÞ �PNC�
i ðg; tÞ � 0
Since the two firms are symmetric, without loss of generality we considerfirm A’s problem. Assuming that the fixed cost, F, of cooperation is sharedequally among two firms, cooperation occurs if,
PC�A ðy; tÞ �PNC�
A ðg; tÞ � F
2
This can be re-written as:
ðPC�A ðy; tÞ �PC�
A ðg; tÞÞ|fflfflfflfflfflfflfflfflfflfflfflfflfflfflfflfflfflfflffl{zfflfflfflfflfflfflfflfflfflfflfflfflfflfflfflfflfflfflffl}Spillover Effect
þðPC�A ðgÞ �PNC�
A ðgÞÞ|fflfflfflfflfflfflfflfflfflfflfflfflfflfflfflffl{zfflfflfflfflfflfflfflfflfflfflfflfflfflfflfflffl}Coordination Effect
� Gðy; g; tÞ � F
2
Note that in the above expression, we have decomposed the gainsfrom cooperation into two effects. They are the ‘spillover effect’ and the‘coordination effect’. The spillover effect measures the change incooperative profit due to an increase in the spillover parameter from gto y. The coordination effect measures the change in profitability due toa switch of regime from non-cooperation to cooperation. Substitutingx�ncðÞ, x�cðÞ, Q�
ncðÞ and Q�cðÞ into G(), we find the equivalent condition to
be:
2dð2þ yþ gÞðy� gÞð2a� 2c� tÞ2
ð9d� 4y2 � 8y� 4Þð9d� 4g2 � 8g� 4Þ|fflfflfflfflfflfflfflfflfflfflfflfflfflfflfflfflfflfflfflfflfflfflfflfflfflfflfflfflfflfflfflfflfflfflfflffl{zfflfflfflfflfflfflfflfflfflfflfflfflfflfflfflfflfflfflfflfflfflfflfflfflfflfflfflfflfflfflfflfflfflfflfflffl}Spillover Effect
þ 18d2ð2g� 1Þ2ð2a� 2c� tÞ2
ð9d� 4g2 � 8g� 4Þð9dþ 4g2 � 4g� 8Þ|fflfflfflfflfflfflfflfflfflfflfflfflfflfflfflfflfflfflfflfflfflfflfflfflfflfflfflfflfflfflfflfflfflfflfflffl{zfflfflfflfflfflfflfflfflfflfflfflfflfflfflfflfflfflfflfflfflfflfflfflfflfflfflfflfflfflfflfflfflfflfflfflffl}Coordination Effect
>F
2ð8Þ
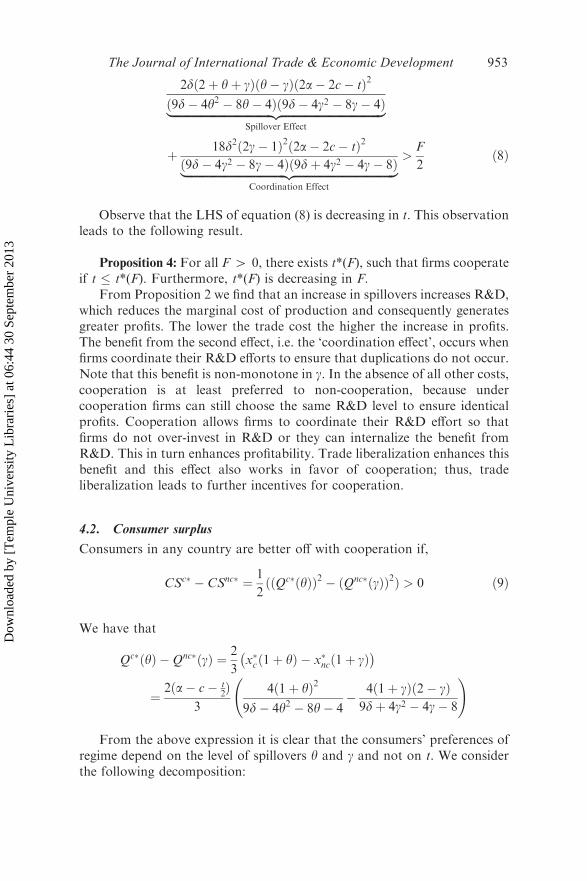
Observe that the LHS of equation (8) is decreasing in t. This observationleads to the following result.
Proposition 4: For all F 4 0, there exists t*(F), such that firms cooperateif t � t*(F). Furthermore, t*(F) is decreasing in F.
From Proposition 2 we find that an increase in spillovers increases R&D,which reduces the marginal cost of production and consequently generatesgreater profits. The lower the trade cost the higher the increase in profits.The benefit from the second effect, i.e. the ‘coordination effect’, occurs whenfirms coordinate their R&D efforts to ensure that duplications do not occur.Note that this benefit is non-monotone in g. In the absence of all other costs,cooperation is at least preferred to non-cooperation, because undercooperation firms can still choose the same R&D level to ensure identicalprofits. Cooperation allows firms to coordinate their R&D effort so thatfirms do not over-invest in R&D or they can internalize the benefit fromR&D. This in turn enhances profitability. Trade liberalization enhances thisbenefit and this effect also works in favor of cooperation; thus, tradeliberalization leads to further incentives for cooperation.
4.2. Consumer surplus
Consumers in any country are better off with cooperation if,
CSc� � CSnc� ¼ 1
2ððQc�ðyÞÞ2 � ðQnc�ðgÞÞ2Þ > 0 ð9Þ
We have that
Qc�ðyÞ �Qnc�ðgÞ ¼ 2
3x�cð1þ yÞ � x�ncð1þ gÞ� �
¼2ða� c� t
2Þ3
4ð1þ yÞ2
9d� 4y2 � 8y� 4� 4ð1þ gÞð2� gÞ9dþ 4g2 � 4g� 8
!
From the above expression it is clear that the consumers’ preferences ofregime depend on the level of spillovers y and g and not on t. We considerthe following decomposition:
Dow
nloa
ded
by [
Tem
ple
Uni
vers
ity L
ibra
ries
] at
06:
44 3
0 Se
ptem
ber
2013
954 A. Ghosh and J. Lim
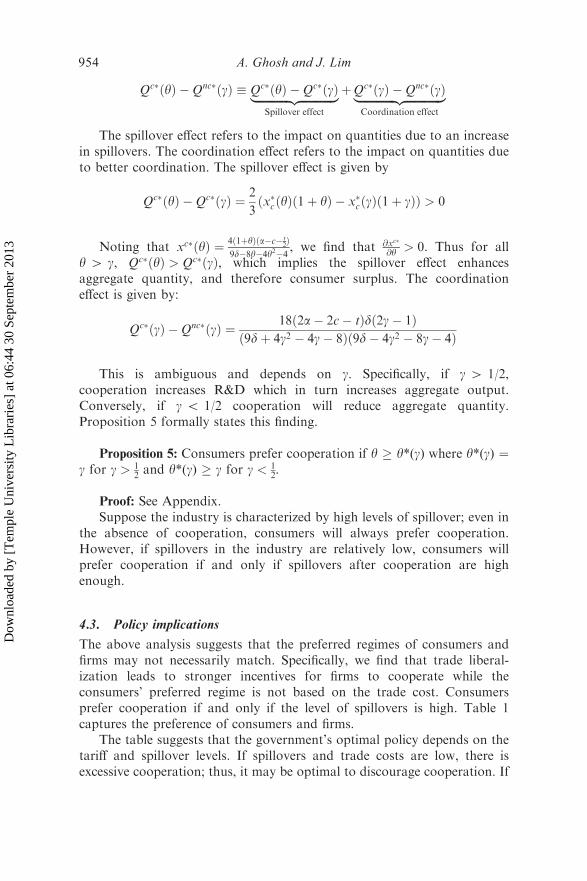
Qc�ðyÞ �Qnc�ðgÞ � Qc�ðyÞ �Qc�ðgÞ|fflfflfflfflfflfflfflfflfflfflfflffl{zfflfflfflfflfflfflfflfflfflfflfflffl}Spillover effect
þQc�ðgÞ �Qnc�ðgÞ|fflfflfflfflfflfflfflfflfflfflfflfflffl{zfflfflfflfflfflfflfflfflfflfflfflfflffl}Coordination effect
The spillover effect refers to the impact on quantities due to an increasein spillovers. The coordination effect refers to the impact on quantities dueto better coordination. The spillover effect is given by
Qc�ðyÞ �Qc�ðgÞ ¼ 2
3ðx�cðyÞð1þ yÞ � x�cðgÞð1þ gÞÞ > 0
Noting that xc�ðyÞ ¼ 4ð1þyÞða�c�t2Þ
9d�8y�4y2�4, we find that @xc�
@y > 0. Thus for ally 4 g, Qc�ðyÞ > Qc�ðgÞ, which implies the spillover effect enhancesaggregate quantity, and therefore consumer surplus. The coordinationeffect is given by:
Qc�ðgÞ �Qnc�ðgÞ ¼ 18ð2a� 2c� tÞdð2g� 1Þð9dþ 4g2 � 4g� 8Þð9d� 4g2 � 8g� 4Þ
This is ambiguous and depends on g. Specifically, if g 4 1/2,cooperation increases R&D which in turn increases aggregate output.Conversely, if g 5 1/2 cooperation will reduce aggregate quantity.Proposition 5 formally states this finding.
Proposition 5: Consumers prefer cooperation if y � y*(g) where y*(g) ¼g for g > 1
2 and y*(g) � g for g < 12.
Proof: See Appendix.Suppose the industry is characterized by high levels of spillover; even in
the absence of cooperation, consumers will always prefer cooperation.However, if spillovers in the industry are relatively low, consumers willprefer cooperation if and only if spillovers after cooperation are highenough.
4.3. Policy implications
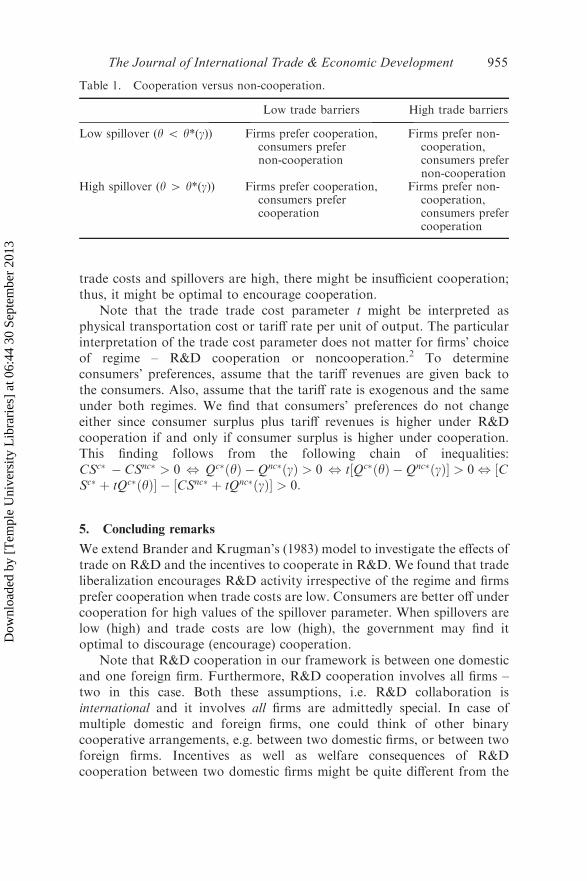
The above analysis suggests that the preferred regimes of consumers andfirms may not necessarily match. Specifically, we find that trade liberal-ization leads to stronger incentives for firms to cooperate while theconsumers’ preferred regime is not based on the trade cost. Consumersprefer cooperation if and only if the level of spillovers is high. Table 1captures the preference of consumers and firms.
The table suggests that the government’s optimal policy depends on thetariff and spillover levels. If spillovers and trade costs are low, there isexcessive cooperation; thus, it may be optimal to discourage cooperation. If
Dow
nloa
ded
by [
Tem
ple
Uni
vers
ity L
ibra
ries
] at
06:
44 3
0 Se
ptem
ber
2013
The Journal of International Trade & Economic Development 955
Qc�ðyÞ �Qnc�ðgÞ � Qc�ðyÞ �Qc�ðgÞ|fflfflfflfflfflfflfflfflfflfflfflffl{zfflfflfflfflfflfflfflfflfflfflfflffl}Spillover effect
þQc�ðgÞ �Qnc�ðgÞ|fflfflfflfflfflfflfflfflfflfflfflfflffl{zfflfflfflfflfflfflfflfflfflfflfflfflffl}Coordination effect
The spillover effect refers to the impact on quantities due to an increasein spillovers. The coordination effect refers to the impact on quantities dueto better coordination. The spillover effect is given by
Qc�ðyÞ �Qc�ðgÞ ¼ 2
3ðx�cðyÞð1þ yÞ � x�cðgÞð1þ gÞÞ > 0
Noting that xc�ðyÞ ¼ 4ð1þyÞða�c�t2Þ
9d�8y�4y2�4, we find that @xc�
@y > 0. Thus for ally 4 g, Qc�ðyÞ > Qc�ðgÞ, which implies the spillover effect enhancesaggregate quantity, and therefore consumer surplus. The coordinationeffect is given by:
Qc�ðgÞ �Qnc�ðgÞ ¼ 18ð2a� 2c� tÞdð2g� 1Þð9dþ 4g2 � 4g� 8Þð9d� 4g2 � 8g� 4Þ
This is ambiguous and depends on g. Specifically, if g 4 1/2,cooperation increases R&D which in turn increases aggregate output.Conversely, if g 5 1/2 cooperation will reduce aggregate quantity.Proposition 5 formally states this finding.
Proposition 5: Consumers prefer cooperation if y � y*(g) where y*(g) ¼g for g > 1
2 and y*(g) � g for g < 12.
Proof: See Appendix.Suppose the industry is characterized by high levels of spillover; even in
the absence of cooperation, consumers will always prefer cooperation.However, if spillovers in the industry are relatively low, consumers willprefer cooperation if and only if spillovers after cooperation are highenough.
4.3. Policy implications
The above analysis suggests that the preferred regimes of consumers andfirms may not necessarily match. Specifically, we find that trade liberal-ization leads to stronger incentives for firms to cooperate while theconsumers’ preferred regime is not based on the trade cost. Consumersprefer cooperation if and only if the level of spillovers is high. Table 1captures the preference of consumers and firms.
The table suggests that the government’s optimal policy depends on thetariff and spillover levels. If spillovers and trade costs are low, there isexcessive cooperation; thus, it may be optimal to discourage cooperation. If
trade costs and spillovers are high, there might be insufficient cooperation;thus, it might be optimal to encourage cooperation.
Note that the trade trade cost parameter t might be interpreted asphysical transportation cost or tariff rate per unit of output. The particularinterpretation of the trade cost parameter does not matter for firms’ choiceof regime – R&D cooperation or noncooperation.2 To determineconsumers’ preferences, assume that the tariff revenues are given back tothe consumers. Also, assume that the tariff rate is exogenous and the sameunder both regimes. We find that consumers’ preferences do not changeeither since consumer surplus plus tariff revenues is higher under R&Dcooperation if and only if consumer surplus is higher under cooperation.This finding follows from the following chain of inequalities:CSc� � CSnc� > 0 , Qc�ðyÞ �Qnc�ðgÞ > 0 , t½Qc�ðyÞ �Qnc�ðgÞ� > 0 , ½CSc� þ tQc�ðyÞ� � ½CSnc� þ tQnc�ðgÞ� > 0:
5. Concluding remarks
We extend Brander and Krugman’s (1983) model to investigate the effects oftrade on R&D and the incentives to cooperate in R&D. We found that tradeliberalization encourages R&D activity irrespective of the regime and firmsprefer cooperation when trade costs are low. Consumers are better off undercooperation for high values of the spillover parameter. When spillovers arelow (high) and trade costs are low (high), the government may find itoptimal to discourage (encourage) cooperation.
Note that R&D cooperation in our framework is between one domesticand one foreign firm. Furthermore, R&D cooperation involves all firms –two in this case. Both these assumptions, i.e. R&D collaboration isinternational and it involves all firms are admittedly special. In case ofmultiple domestic and foreign firms, one could think of other binarycooperative arrangements, e.g. between two domestic firms, or between twoforeign firms. Incentives as well as welfare consequences of R&Dcooperation between two domestic firms might be quite different from the
Table 1. Cooperation versus non-cooperation.
Low trade barriers High trade barriers
Low spillover (y 5 y*(g)) Firms prefer cooperation,consumers prefernon-cooperation
Firms prefer non-cooperation,consumers prefernon-cooperation
High spillover (y 4 y*(g)) Firms prefer cooperation,consumers prefercooperation
Firms prefer non-cooperation,consumers prefercooperation
Dow
nloa
ded
by [
Tem
ple
Uni
vers
ity L
ibra
ries
] at
06:
44 3
0 Se
ptem
ber
2013
956 A. Ghosh and J. Lim
same between one domestic firm and one foreign firm. We leave the analysisof R&D cooperation in presence of multiple domestic and foreign firms forfuture research.
Instead of using a Cournot model, we can consider price competitionwith differentiated products. Our initial finding suggests that this will notqualitatively change our result. A more interesting extension is to considerasymmetric firms, i.e. one firm has lower marginal cost than the other. Ourconjecture is that the incentive for cooperation might weaken in the presenceof asymmetric firms.
Acknowledgements
We wish to thank two anonymous referees and the editor, Pasquale Sgro, forvaluable comments. Financial support from the Australian Research Council isgratefully acknowledged.
Notes
1. A higher d implies higher marginal cost and therefore lower efficiency.2. Note, trade liberalization considered in this article is multilateral. Under tariff
interpretation of trade cost, it is possible to think of unilateral tradeliberalization where only one country reduces its tariff. Unilateral liberalizationby a country increases the potential market size for the foreign firm and reducesit for the domestic firm. Irrespective of the R&D regime, the reduction (increase)in market size lowers (raises) the incentive of R&D for domestic (foreign) firm.
References
Baldwin, J., and W. Gu. 2004. Trade liberalization: Export-market participation,productivity growth, and innovation. Oxford Review of Economic Policy 20, no.3: 327–92.
Becker, W., and J. Dietz. 2004. R&D cooperation and innovation activities of firms –Evidence for the German manufacturing industry. Research Policy 33, no. 2:209–23.
Brander, J., and B. Spencer. 1983. International R&D rivalry and industrial strategy.The Review of Economic Studies 50, no. 4: 707–22.
Brander, J., and P. Krugman. 1983. A ‘Reciprocal Dumping’ model of internationaltrade. Journal of International Economics 15: 313–21.
D’Aspremont, C., and A. Jacquemin. 1988. Cooperative and noncooperative R&Din Duopoly with spillovers. The American Economic Review 78, no. 5: 1133–7.
DeCourcy, J. 2005. Cooperative R&D and strategic trade policy. Canadian Journalof Economics 38, no. 2: 526–73.
Guellec, D., and B. van Pottlesberghe de la Potterie. 2001. The internationlisation oftechnology analysed with patent data. Research Policy 30: 1253–66.
Haaland, J., and H. Kind. 2006. Cooperative and non-cooperative R&D policy in aneconomic union. Review of World Economics 142, no. 4: 720–45.
Haaland, J., and H. Kind. 2008. R&D policies, trade and process innovation. Journalof International Economics 74, no. 1: 170–87.
Hagedoorn, J. 2002. Interfirm R&D partnerships: An overview of major trends andpatterns since 1960. Research Policy 31, no. 3: 447–92.
Dow
nloa
ded
by [
Tem
ple
Uni
vers
ity L
ibra
ries
] at
06:
44 3
0 Se
ptem
ber
2013
The Journal of International Trade & Economic Development 957
same between one domestic firm and one foreign firm. We leave the analysisof R&D cooperation in presence of multiple domestic and foreign firms forfuture research.
Instead of using a Cournot model, we can consider price competitionwith differentiated products. Our initial finding suggests that this will notqualitatively change our result. A more interesting extension is to considerasymmetric firms, i.e. one firm has lower marginal cost than the other. Ourconjecture is that the incentive for cooperation might weaken in the presenceof asymmetric firms.
Acknowledgements
We wish to thank two anonymous referees and the editor, Pasquale Sgro, forvaluable comments. Financial support from the Australian Research Council isgratefully acknowledged.
Notes
1. A higher d implies higher marginal cost and therefore lower efficiency.2. Note, trade liberalization considered in this article is multilateral. Under tariff
interpretation of trade cost, it is possible to think of unilateral tradeliberalization where only one country reduces its tariff. Unilateral liberalizationby a country increases the potential market size for the foreign firm and reducesit for the domestic firm. Irrespective of the R&D regime, the reduction (increase)in market size lowers (raises) the incentive of R&D for domestic (foreign) firm.
References
Baldwin, J., and W. Gu. 2004. Trade liberalization: Export-market participation,productivity growth, and innovation. Oxford Review of Economic Policy 20, no.3: 327–92.
Becker, W., and J. Dietz. 2004. R&D cooperation and innovation activities of firms –Evidence for the German manufacturing industry. Research Policy 33, no. 2:209–23.
Brander, J., and B. Spencer. 1983. International R&D rivalry and industrial strategy.The Review of Economic Studies 50, no. 4: 707–22.
Brander, J., and P. Krugman. 1983. A ‘Reciprocal Dumping’ model of internationaltrade. Journal of International Economics 15: 313–21.
D’Aspremont, C., and A. Jacquemin. 1988. Cooperative and noncooperative R&Din Duopoly with spillovers. The American Economic Review 78, no. 5: 1133–7.
DeCourcy, J. 2005. Cooperative R&D and strategic trade policy. Canadian Journalof Economics 38, no. 2: 526–73.
Guellec, D., and B. van Pottlesberghe de la Potterie. 2001. The internationlisation oftechnology analysed with patent data. Research Policy 30: 1253–66.
Haaland, J., and H. Kind. 2006. Cooperative and non-cooperative R&D policy in aneconomic union. Review of World Economics 142, no. 4: 720–45.
Haaland, J., and H. Kind. 2008. R&D policies, trade and process innovation. Journalof International Economics 74, no. 1: 170–87.
Hagedoorn, J. 2002. Interfirm R&D partnerships: An overview of major trends andpatterns since 1960. Research Policy 31, no. 3: 447–92.
Hergert, M., and D. Morris. 2002. Trends in international collaborative agreements.In Cooperative strategies in international business: Joint ventures and technologypartnership between firms, ed. Farok J. Contractor and Peter Lorange, 99–109.United Kingdom: Elsevier Science.
Kaiser, U. 2002. An empirical test of models explaining research expenditures andresearch cooperation: Evidence for the German service sector. InternationalJournal of Industrial Organization 20, no. 4: 747–74.
Kamien, M., E. Muller, and Z. Zang. 1992. Research joint ventures and R&Dcartels. The American Economic Review 82, no. 5: 1293–306.
Katz, M.L. 1986. An analysis of cooperative research and development. RANDJournal of Economics 17, no. 4: 527–43.
Leahy, D., and J.P. Neary. 1997. Public policy towards R&D in oligopolisticindustries. American Economic Review 87, no. 4: 642–62.
Leahy, D., and J.P. Neary. 1999. R&D spillovers and the case for industrial policy inan open economy. Oxford Economic Papers 50, no. 1: 40–9.
Liu, X., and C. Wang. 2003. Does foreign direct investment facilitate technicalprogress? Evidence from Chinese industries. Research Policy 32: 945–53.
Mansfield, E., M. Schwartz, and S. Wagner. 1981. Imitation costs and patents: Anempirical study. The Economic Journal 91: 907–18.
Neary, J.P., and P. O’Sullivan. 1999. Beat’em or Join’em? Export subsidies versusinternational research joint ventures in oligopolistic markets. ScandinavianJournal of Economics 101, no. 4: 577–96.
Motta, M. 1996. Research joint ventures in an international economy. RicercheEconomiche 50: 293–315.
Organization for Economic Cooperation and Development (OECD). 2009. OECDscience, technology and industry outlook. Paris: OECD.
Petit, M.-L., and F. Sanna-Randaccio. 2000. Endogenous R&D and foreign directinvestment in international oligopolies. International Journal of IndustrialOrganization 18, no.2: 339–67.
Petit, M.-L., and F. Sanna-Randaccio. 1998. Technological innovation andmultinational expansion: A two-way link? Journal of Economics 68, no. 1: 1–26.
Spence, M. 1984. Cost reduction, competition and industry performance. Econome-trica 52, no. 1: 102–21.
Suzumura, K. 1992. Cooperative and non-cooperative R&D in an oligopoly withspillovers. The American Economic Review 82, no. 5: 1307–22.
Vornortas, N. 1997. Research joint ventures in the US. Research Policy 26: 577–95.Vuegelers, R. 1997. Internal R&D expenditures and external technology sourcing.
Research Policy 26, no. 3: 303–15.World Trade Organization (WTO). 2008. World trade report 2008. Geneva: WTO
Publishing.
Appendix
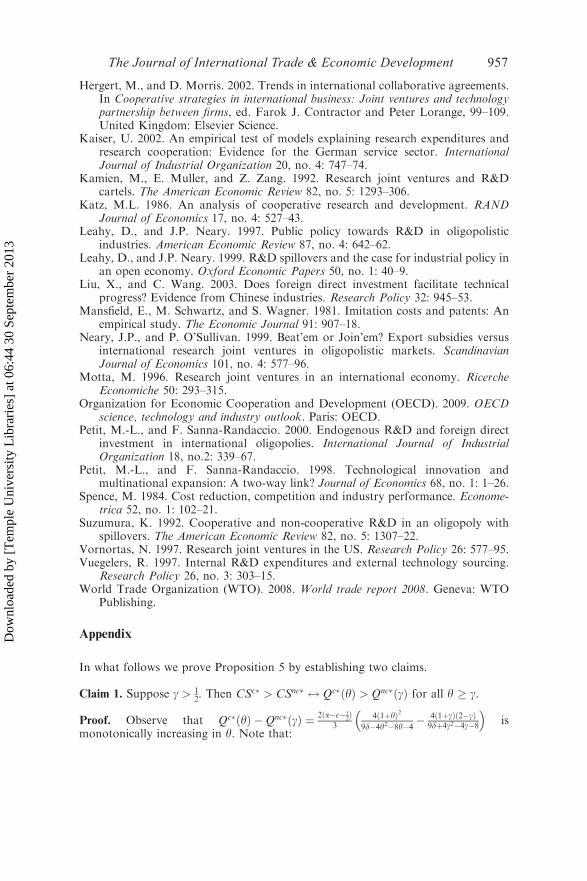
In what follows we prove Proposition 5 by establishing two claims.
Claim 1. Suppose g > 12. Then CSc� > CSnc� $ Qc�ðyÞ > Qnc�ðgÞ for all y � g.
Proof. Observe that Qc�ðyÞ �Qnc�ðgÞ ¼ 2ða�c�t2Þ
34ð1þyÞ2
9d�4y2�8y�4� 4ð1þgÞð2�gÞ
9dþ4g2�4g�8
� �is
monotonically increasing in y. Note that:
Dow
nloa
ded
by [
Tem
ple
Uni
vers
ity L
ibra
ries
] at
06:
44 3
0 Se
ptem
ber
2013
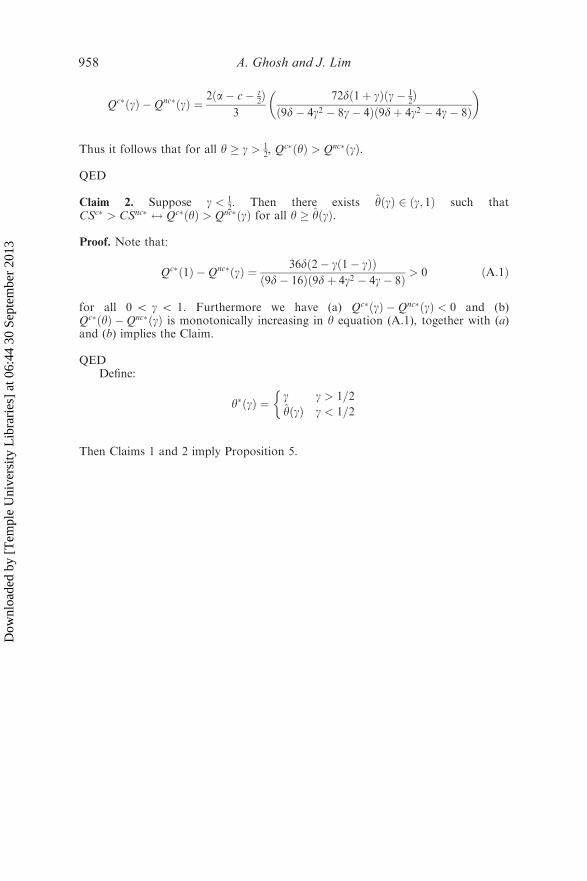
958 A. Ghosh and J. Lim
Qc�ðgÞ �Qnc�ðgÞ ¼2ða� c� t
2Þ3
72dð1þ gÞðg� 12Þ
ð9d� 4g2 � 8g� 4Þð9dþ 4g2 � 4g� 8Þ
� �
Thus it follows that for all y � g > 12, Q
c�ðyÞ > Qnc�ðgÞ.
QED
Claim 2. Suppose g < 12. Then there exists yðgÞ 2 ðg; 1Þ such that
CSc� > CSnc� $ Qc�ðyÞ > Qnc�ðgÞ for all y � yðgÞ.
Proof. Note that:
Qc�ð1Þ �Qnc�ðgÞ ¼ 36dð2� gð1� gÞÞð9d� 16Þð9dþ 4g2 � 4g� 8Þ > 0 ðA:1Þ
for all 0 5 g 5 1. Furthermore we have (a) Qc�ðgÞ �Qnc�ðgÞ < 0 and (b)Qc�ðyÞ �Qnc�ðgÞ is monotonically increasing in y equation (A.1), together with (a)and (b) implies the Claim.
QEDDefine:
y�ðgÞ ¼ g g > 1=2
yðgÞ g < 1=2
�
Then Claims 1 and 2 imply Proposition 5.
Dow
nloa
ded
by [
Tem
ple
Uni
vers
ity L
ibra
ries
] at
06:
44 3
0 Se
ptem
ber
2013


![**KH8 (revised)** IV. Various Costs of Trade and Trade Arrangements Direct and indirect costs of trade [Head, 59-90] The costs associated with international](https://img.pdfslide.us/doc/110x75/56649d9e5503460f94a88ba8/kh8-revised-iv-various-costs-of-trade-and-trade-arrangements-direct.jpg)