Embed Size (px)
Citation preview

Cooper, A.K., O’Brien, P.E., and Richter, C. (Eds.)Proceedings of the Ocean Drilling Program, Scientific Results Volume 188
14. PRYDZ CHANNEL FAN AND THE HISTORY OF EXTREME ICE ADVANCES
IN PRYDZ BAY1
P.E. O’Brien,2 A.K. Cooper,3 F. Florindo,4 D.A. Handwerger,5 M. Lavelle,6 S. Passchier,7 J.J. Pospichal,8 P.G. Quilty,9 C. Richter,10 K.M. Theissen,3 and J.M. Whitehead11
ABSTRACT
During the late Neogene, the Lambert Glacier–Amery Ice Shelf drain-age system flowed across Prydz Bay in an ice stream that reached theshelf edge and built a trough mouth fan on the upper continentalslope. The adjacent banks saw mostly subglacial till deposition beneathslower-moving ice. The fan consists mostly of debris flow deposits de-rived from the melting out of subglacial debris at the grounding line atthe continental shelf edge. Thick debris flow intervals are separated bythin mudstone horizons deposited when the ice had retreated from theshelf edge. Age control at Ocean Drilling Program Site 1167 indicatesthat the bulk of the trough mouth fan was deposited prior to ~780 kawith as few as three debris flow intervals deposited since then. This stra-tigraphy indicates that extreme advances of the Lambert Glacier-AmeryIce Shelf system ceased during the mid-Pleistocene. Possible causes forthis change are progressive over-deepening of the inner shelf, a reduc-tion in maximum ice volumes in the interior of the East Antarctic IceSheet caused by temperature change, and a change in the interaction ofMilankovich cycles and the response time of the ice sheet.
INTRODUCTION
The East Antarctic Ice Sheet is presently the largest ice mass on Earthand it is the longest lived, having been initiated in the Paleogene (Bar-
1O’Brien, P.E., Cooper, A.K., Florindo, F., Handwerger, D.A., Lavelle, M., Passchier, S., Pospichal, J.J., Quilty, P.G., Richter, C., Theissen, K.M., and Whitehead, J.M., 2004. Prydz Channel Fan and the history of extreme ice advances in Prydz Bay. In Cooper, A.K., O’Brien, P.E., and Richter, C. (Eds.), Proc. ODP, Sci. Results, 188, 1–32 [Online]. Available from World Wide Web: <http://www-odp.tamu.edu/publications/188_SR/VOLUME/CHAPTERS/016.PDF>. [Cited YYYY-MM-DD]2Geoscience Australia, GPO Box 378, Canberra ACT 2904, Australia. [email protected] of Geological and Environmental Sciences, Stanford University, Building 320, Room 118, Stanford CA 94305, USA.4Istituto Nazionale di Geofisica e Vulcanologia, Via di Vigna Murata 605, 00143 Rome, Italy.5Department of Geology and Geophysics, University of Utah, 1460 East 135 South, Room 719, Salt Lake City UT 84105, USA.6Geological Sciences, British Antarctic Survey, High Cross, Madingley Road, Cambridge CB3 OET, United Kingdom.7NITG-TNO–National Geological Survey, Geo-Marine and Coast, PO Box 80015, 3508 TA Utrecht, The Netherlands.8Department of Geology, Florida State University, Tallahassee FL 32306, USA.9School of Earth Sciences, University of Tasmania, Sandy Bay Campus, GPO Box 252-79, Hobart TAS 7050, Australia.10Department of Geology, University of Louisiana, PO Box 44530, Lafayette LA 70504-0002, USA.11Department of Geosciences, University of Nebraska, 214 Bessy Hall, Lincoln NE 68588-0340, USA.
Initial receipt: 30 May 2003Acceptance: 28 April 2004Web publication: 30 July 2004Ms 188SR-016

P.E. O’BRIEN ET AL.ICE ADVANCES IN PRYDZ BAY 2
ron et al., 1991; O’Brien, Cooper, Richter, et al., 2001). Since its forma-tion, it has played a central role in global climate and in higher-ordersea level change. Although global ice volume/temperature changes canbe estimated using low-latitude δ18O records, the distribution of ice onthe continent and the evolution of the Antarctic Ice Sheet through gla-cial–interglacial cycles requires direct evidence from Antarctica. PrydzBay, East Antarctica, was drilled during Leg 188 to sample the record leftby the Lambert Glacier–Amery Ice Shelf drainage system that flowsfrom the interior of the East Antarctic Ice Sheet. The results from Leg188, when combined with results from Leg 119, also drilled in PrydzBay, provide a record of the extensive erosion of the shelf by ice ad-vances, starting in the late Eocene to early Oligocene but becoming in-tense from the middle Miocene onward (Barron et al., 1991; O’Brien,Cooper, Richter, et al., 2001). Erosion has removed large parts of therecord in places, but the erosion surfaces can be traced into their correl-ative conformities on the continental slope, where the debris carried bythe grounded ice has been deposited in trough mouth fans (Cooper etal., 1991; Kuvaas and Leitchenkov, 1992; Bart et al., 2000). These fansform where fast-flowing ice streams reach the shelf edge during epi-sodes of extreme ice extent and should contain a record of intervals notrepresented on the shelf (Vorren and Laberg, 1997; Boulton, 1990).They should consist of thick mass flow deposits formed from debris re-leased from the basal ice at the shelf break interbedded with thin hemi-pelagic and pelagic intervals deposited when the ice was shoreward ofthe shelf edge.
Trough mouth fans might hold the answer to a problem that has be-come apparent with the greater understanding of the position of theAntarctic ice grounding zone during the Last Glacial Maximum (LGM)(18–12 ka). There is evidence for grounding of the ice sheet at the shelfedge in many places (e.g., Mac.Robertson Land [Harris et al., 1996],eastern Ross Sea [Shipp et al., 1999; Domack et al., 1999], and AntarcticPeninsula [Pusdsey et al., 1994]). LGM grounding zone deposits havebeen identified in the western Ross Sea well back from the shelf edge(Licht et al., 1999; Shipp et al., 1999; Domack et al., 1999). The EastAntarctic continental shelf displays abundant evidence of ice advanceto the edge of the continental shelf (Vanney and Johnson, 1985;O’Brien and Leitchenkov, 1997; Bart et al., 2000). However, Anderson etal. (2002) reviewed the literature on East Antarctic Ice Sheet LGMgrounding zone positions and concluded that around most of the mar-gin, the LGM grounding zone is in a mid-shelf position or near itspresent location. In the case of Prydz Bay, Domack et al. (1998) andO’Brien et al. (1999) mapped LGM grounding zone wedges aroundPrydz Channel more than 130 km from the continental shelf edge (Fig.F1). Seaward of these wedges, the floor of Prydz Channel lacks flutesand other subglacial features and is blanketed by thick glaciomarineclays and oozes (O’Brien et al., 1999; Domack et al., 1998) indicatingthat the Lambert Glacier did not ground there during the last glacial cy-cle. This raises several questions:
1. Why did large parts of the East Antarctic Ice Sheet includingsome large interior-derived ice streams not reach the shelf edgeduring the LGM?
2. When did the ice sheet last reach the shelf edge if not during theLGM?
3. What sort of glacial episode is required to make the ice advanceto the shelf edge?
68°E72° 76°
66°S
67°
68°
69°
3000
2000
1000
LGM Grounding zone wedge Ice flow direction during extreme advances
Bathymetric contour (interval 200 m)
740
741
1166742
739
743
1167
23/09/357
Four LadiesBank
Mac.RobertsonLand
Amery IceShelf
AmeryDepression
400
200
Prydz ChannelPrydz ChannelFanFan
Prydz Channel
Prydz C
hannel
PrincessElizabeth
Land
F1. Bathymetry of Prydz Bay, p. 17.

P.E. O’BRIEN ET AL.ICE ADVANCES IN PRYDZ BAY 3
Domack et al. (1998) suggested that relatively long periods of low sealevel and increased ice volume might be needed for the interior ice sheetto respond and advance to the shelf edge. Site 1167 of Ocean DrillingProgram (ODP) Leg 188 was intended to investigate these questions bysampling a record through the trough mouth fan at the mouth of PrydzChannel that would provide a history of Pleistocene advances.
In spite of their potential value as records of past glaciation, troughmouth fans were not drilled in the Antarctic margin until ODP Leg 188.Site 743 was drilled during Leg 119 on the Prydz Bay slope but to theeast of the Prydz Channel Fan on a steep, eroded part of the slope (Bar-ron, Larson, et al., 1989; O’Brien and Leitchenkov, 1997).
Regional Setting
Prydz Bay is the downstream end of the Lambert Glacier–Amery IceShelf ice drainage system, which drains ~16% of the East Antarctic IceSheet (Allison, 1979; Fricker et al., 2000). The Lambert Glacier–AmeryIce Shelf system responds to mass balance fluctuations in the interior ofthe East Antarctic Ice Sheet that are then reflected in the sediments ofPrydz Bay and the adjacent slope and rise (Fig. F1). Prydz Bay is typicalof the Antarctic shelf in having its deepest areas inshore, near the frontof the Amery Ice Shelf in the Amery Depression (Fig. F1). On the east-ern side of the bay, the seafloor shoals to depths as shallow as 200 m inFour Ladies Bank. Four Ladies Bank is separated from the Princess Eliza-beth Land coast by a series of deeps and saddles collectively known asthe Svenner Channel. The Amery Depression is linked to the shelf edgeby Prydz Channel, which occupies the western part of the bay and hasdepths from 700 meters below sea level (mbsl) at its inshore end to~500 mbsl at the shelf edge.
Prydz Channel Fan can be seen in bathymetric contours as a smoothseaward bulge directly north of the mouth of the Prydz Channel and inisopach contour as locally thick sediment overlying the surface (pp-12)that defines the base of the fan (Fig. F2) (O’Brien, Cooper, Richter, et al.,2001). The fan extends to water depths of ~2400 m and has a surfaceslope of ~2°.
O’Brien and Harris (1996) inferred that the Prydz Channel and Fandeveloped in the early to mid-Pliocene, when the amount of ice accu-mulating in Princess Elizabeth Land on the southeastern side of PrydzBay increased to the point where it deflected the flow of the main Lam-bert-Amery system westward. The system then formed a fast-flowing icestream that cut Prydz Channel and deposited debris on the upper slope.
Prydz Channel Fan Seismic Stratigraphy
Data
The Prydz Channel Fan is imaged by a number of seismic surveys;however, the most comprehensive network of data is Australian Geo-logical Survey Organisation (AGSO) Survey 149, which consisted oflines collected in 1995 using a single generator-injector (GI) gun (45-in3
generator chamber) and a four-channel, 25-m streamer (Fig. F3)(O’Brien et al., 1995). The lines were arranged with dip lines normal tofan contours and tie lines at the base of the fan and on the shelf. Twolines were shot on the slope west and east of the fan to investigate con-trasting settings. Ice conditions made the collection of along-slope linesin midfan impossible in 1995, and again in 1997, a large iceberg re-
Isopach contour (interval 100 m)
72° 76°
66°S
67°
68°
69°
23/09/358
Amery IceShelf Princess
ElizabethLand
68°E
Mac.RobertsonLand
200
500
1000
200
0
0
740
741741
1166742
739
743743
11671167
edge
Shelf
F2. Isopach map of the Prydz Channel Trough Mouth Fan, p. 18.
68°E72° 76°
66°S
67°
68°
69°
3000
2000
1000
23/09/359
Four LadiesBank
Mac.RobertsonLand
Amery IceShelf
AmeryDepression
400
200
Prydz ChannelPrydz ChannelFanFan
PrincessElizabeth
Land
740
741
1166742
739
149/1501149/1501
149/0901149/0901
149/
1701
149/
1701
149/
1402
149/
1402
149/
1401
149/
1401
149/1201149/1201
149/1301149/1301
149/
1601
149/
1601
149/0801149/0801
149/1101149/1101
149/1001149/1001
149/1101
149/1101
149/1801,149/1801,149/1802149/1802
149/0203
149/0601
149/0201149/0201
149/0202149/0202
743
Prydz Channel
Prydz C
hannel
Bathymetric contour (interval 200 m)
1167
F3. 1995 ANARE/AGSO survey lines, p. 19.

P.E. O’BRIEN ET AL.ICE ADVANCES IN PRYDZ BAY 4
stricted the length of along-slope lines that could be shot (Harris et al.,1997).
Reflection Geometry
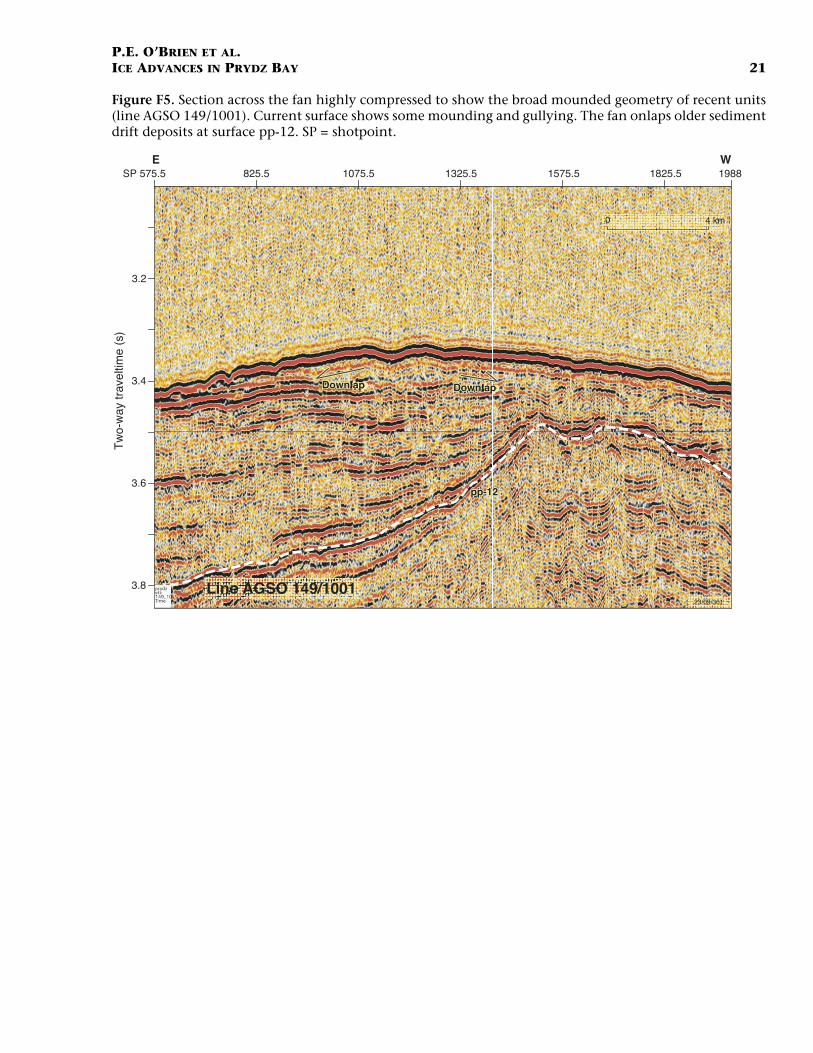
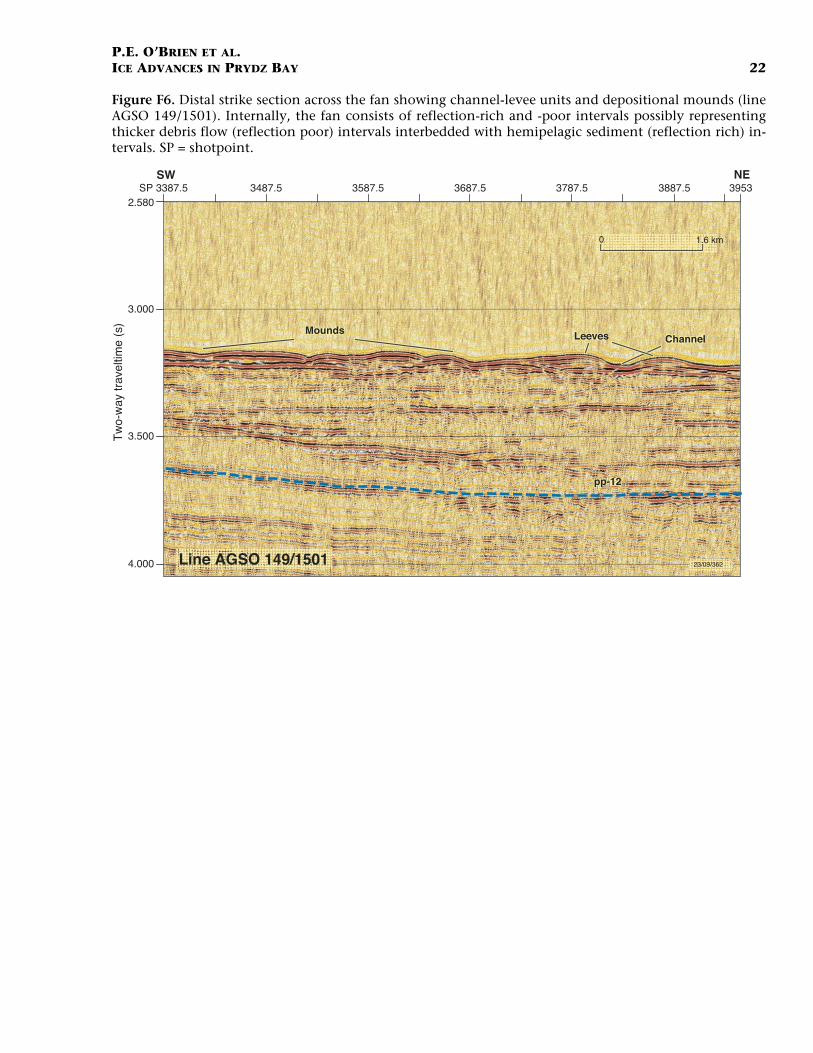
In dip section, the Prydz Channel Fan slopes seaward in a continuousconcave-upward curve with an average slope of 2° (cf. Laberg and Vor-ren, 1995) and with only small steps in the profile (Fig. F4). The fan sed-iments extend >50 km from the shelf edge. The steps on the upper fanare probably small slump scars or, near the shelf break, ice keel scours.Farther down the fan, the steps are down to basin and are probably thenoses of debris flows that have halted on the slope. Internally, the fandisplays clinoforms in packages that pinch out at the base of the fan or,in the case of the uppermost packages, in midfan where the pinchoutcorresponds to a step in the seafloor profile (Fig. F4). In sections acrossthe slope in midfan, the fan forms a broad mound with smaller-scalemounds on its surface (Fig. F5). These vary from 0.5 to 30 km across.Small gullies with levees are present in a few places, but these are notcommon. At the toe of the fan, the overall mound shape is less obviouson strike sections, but the smaller mounds and channel-levee systemsare more obvious. Mounds are up to a few kilometers across and 10 to20 ms high and overlap in an irregular fashion (Fig. F6). The channel-levee systems are of similar scale but comprise levees arranged symmet-rically about a channel with a floor that produces high-amplitude re-flections (Fig. F6).
The fan foreset reflectors form moderately continuous packages 10–20 ms thick of high-amplitude reflectors separated by reflection-poorintervals (Figs. F4, F6). The reflector packages pinch and swell, andsome channel structures are present. Reflection-poor intervals showfaint reflectors parallel to the basal or mounded reflectors (Figs. F4, F6).
The foresets forming the upper continental slope seaward of Four La-dies Bank extend some 25 km from the shelf edge and are concave up-ward, sloping as much as ~4° (Fig. F7). Several mounded deposits arevisible on the surface, suggesting slump deposits. Foreset reflections areless continuous than in the trough mouth fan seaward of Prydz Chan-nel and show abundant mounding and channeling.
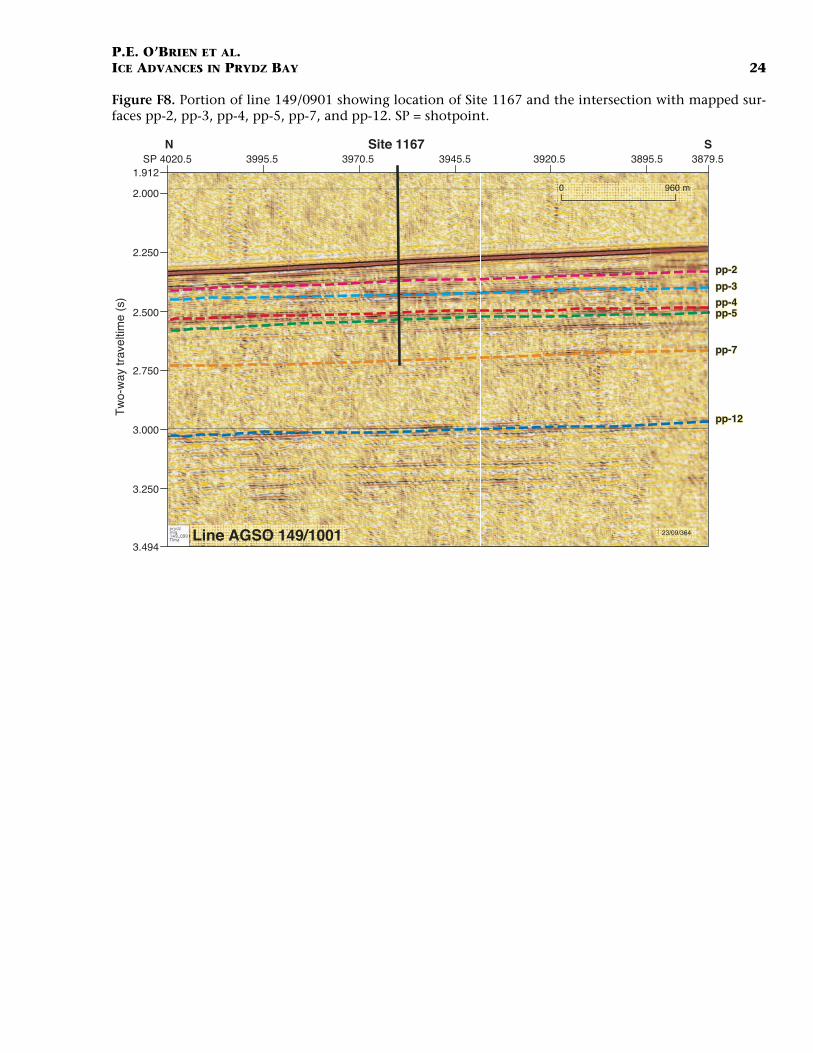
The prominent surface at the base of the fan, surface A of Mitzukoshiet al. (1986), was mapped on both the 1995 data and on older, lower-resolution lines. It can be traced along the slope adjacent to the troughmouth fan and onto Four Ladies Bank. This surface marks the begin-ning of fan growth, as determined by tracing surface A beneath the con-tinental slope to a paleoshelf break that is linear across Prydz Channeland parallel to the shelf on both sides of the fan. On the GI gun lines,12 horizons that show some truncation or downlap could be seen; how-ever, only 5 could be mapped confidently on most lines. These are sur-faces pp-2, pp-4, pp-5, pp-7, and the fan base (surface A), hereindesignated pp-12 (Fig. F8). Close examination of an expanded displayof the seismic data indicates that pp-12 intersects Site 739 within theearly Pliocene interval that includes Cores 119-739C-13R to 15R(105.9–130.3 meters below seafloor [mbsf]) (Barron et al., 1991).
Topset-Foreset Relationships
The seismic stratigraphy of both the Prydz Channel Fan and the ad-jacent Four Ladies Bank provides some insights into sedimentation pro-cesses at the head of trough mouth fans. Line AGSO 149/0901 runs
Site 1167
Line AGSO 149/0901 23/09/360
S
Tw
o-w
ay tr
avel
time
(s)
0.705
1.500
2.000
2.500
3.000
3.733
SP 5041 4641 4141 3641 3141 2641 2223.5N
pp-12pp-12StepStepPinch outPinchout
6.4 km0
F4. Dip section through axis of Prydz Channel Trough Mouth Fan, p. 20.
E WSP 575.5 825.5 1075.5 1325.5 1575.5 1825.5 1988
Tw
o-w
ay tr
avel
time
(s)
3.8
3.6
3.4
3.2
Down lapDownlapDown lapDownlap
pp-12pp-12
4 km0
23/09/361
Line AGSO 149/1001
F5. Broad mounded geometry of recent units, p. 21.
SW NE
2.580
3.000
3.500
4.000
SP 3387.5 3487.5 3587.5 3687.5 3787.5 3887.5 3953
Tw
o-w
ay tr
avel
time
(s)
pp-12pp-12
23/09/362Line AGSO 149/1501
0 1.6 km
ChannelChannelLeevesLeevesMoundsMounds
F6. Channel-levee units and depo-sitional mounds, p. 22.
SWNE
Tw
o-w
ay tr
avel
time
(s)
195.5453.5853.51253.51653.52053.5SP 2453.5
Line AGSO 149/1401 23/09/363
pp-12pp-12
Paleo Shelf EdgePaleoshelf Edge
Four Ladies BankFour Ladies Bank
6.4 km0
3.164
3.000
2.000
1.000
0.000
F7. Shelf edge and upper slope of Prydz Bay east of the Prydz Chan-nel Fan, p. 23.
Site 1167
Tw
o-w
ay tr
avel
time
(s)
N S3970.5 3920.5 3879.5SP 4020.5 3995.5 3945.5 3895.5
pp-12pp-12
23/09/364Line AGSO 149/1001
0 960 m
pp-2pp-2
pp-3pp-3
pp-4pp-4pp-5pp-5
pp-7pp-7
1.912
2.000
2.250
2.500
2.750
3.000
3.250
3.494
F8. Intersection with pp-2, pp-3, pp-4, pp-5, pp-7, and pp-12, p. 24.

P.E. O’BRIEN ET AL.ICE ADVANCES IN PRYDZ BAY 5
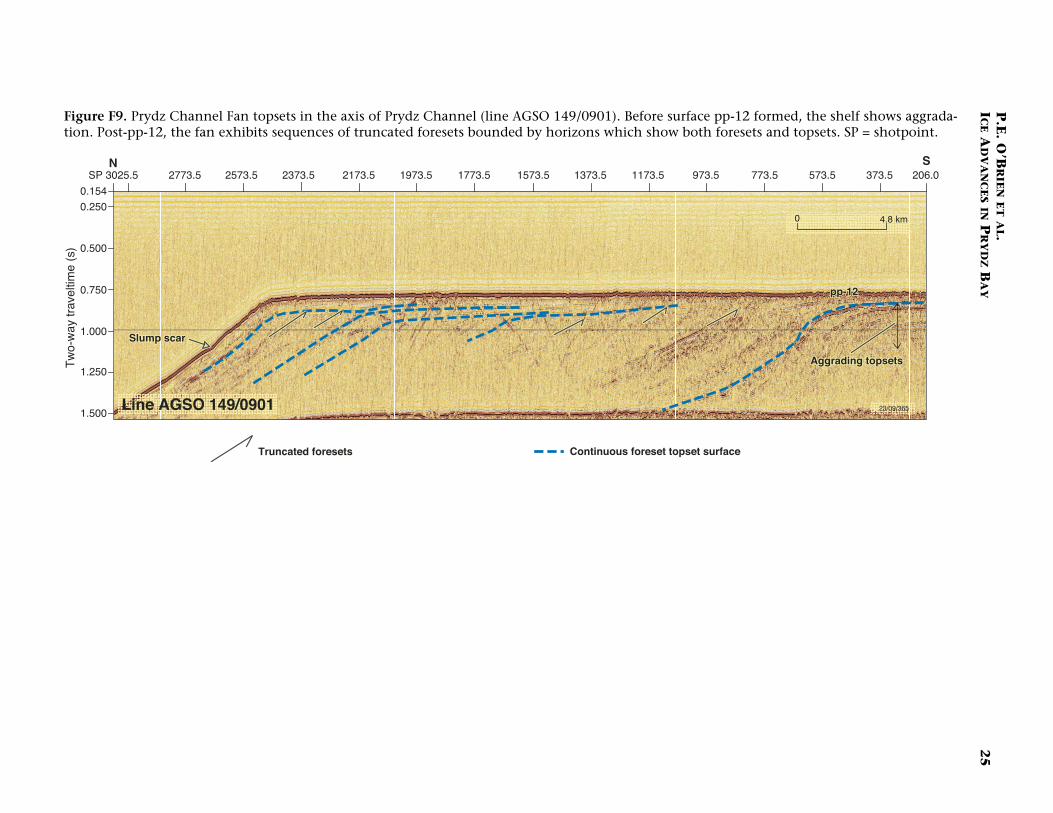
along the fan axis into Prydz Channel (Fig. F3). Prior to fan deposition,the shelf aggraded. The base of the fan (surface pp-12) shows as a high-amplitude reflector with a convex-upward seaward dip that passes land-ward into a horizontal, high-amplitude topset reflector (Fig. F9). Surfacepp-12 passes offshore into steeply dipping, undulating reflectors ofpoor continuity and variable amplitude. From pp-12 time onward, shelfaggradation occurred on the edge of Prydz Channel but was minor inthe center of the channel where progradation prevailed.
Seaward of the pp-12 paleoshelf edge, overlying foresets offlapagainst gently seaward-dipping topsets ~0.15 s two-way traveltime(TWT) thick (Fig. F9). This geometry is repeated but with the base ofsuccessive sequence-bounding topsets being progressively higher.
On Four Ladies Bank, away from the trough mouth fan, paleoshelfedges aggraded vertically by 0.25 s TWT until ~pp-4 time with only mi-nor prograding of the paleoshelf edge between pp-12 and pp-7 (Fig.F10). From pp-7 time onward, the shelf edge prograded rapidly, form-ing an upper slope wedge with greatest thickness beneath the presentshelf edge. Topsets display high amplitudes, especially those pp-12 andolder. Surface pp-12 is onlapped by topsets to a point ~8 km landwardof the pp-12 paleoshelf edge (Fig. F10).
Thickness Relationships
A series of isopach maps illustrates several major features of fan depo-sition. The total fan thickness (seafloor to pp-12) (Fig. F2) shows thatthe locus of fan deposition was beneath the present shelf break wherethe axis of Prydz Channel crosses the shelf break (Fig. F2). Prydz Chan-nel has very thin post-pp-12 sediments, whereas Four Ladies Bankshows a relatively thick, horizontal layer of similar age sediments. Onthe slope, post-pp-12 sediments are slightly thicker on the eastern sideof the Prydz Channel axis than on the western side. Also, sedimentsthin more rapidly on the western side than the eastern side.
The initial phase of fan sedimentation (pp-12 to pp-7) produced alow-relief wedge of slope sediments that was slightly thicker beneaththe eastern side of the area seaward of Prydz Channel (Fig. F11). Thissuggests that a broad channel fed sediment to the shelf edge, althoughthe contours are influenced by the thick topsets deposited on FourLadies Bank prior to surface pp-7 (Fig. F10). The next phase (Fig. F12)(pp-5 to pp-7) saw deposition of a pronounced lobe seaward of thepresent Prydz Channel axis. Prydz Channel appears to become narrowduring this phase of deposition, leading to an approximation of a pointsource for fan sediment and rapid progradation of the shelf edge alongthe channel axis. Subsequent sequences show seaward displacement ofthe locus of thickest deposition (pp-2 to pp-5).
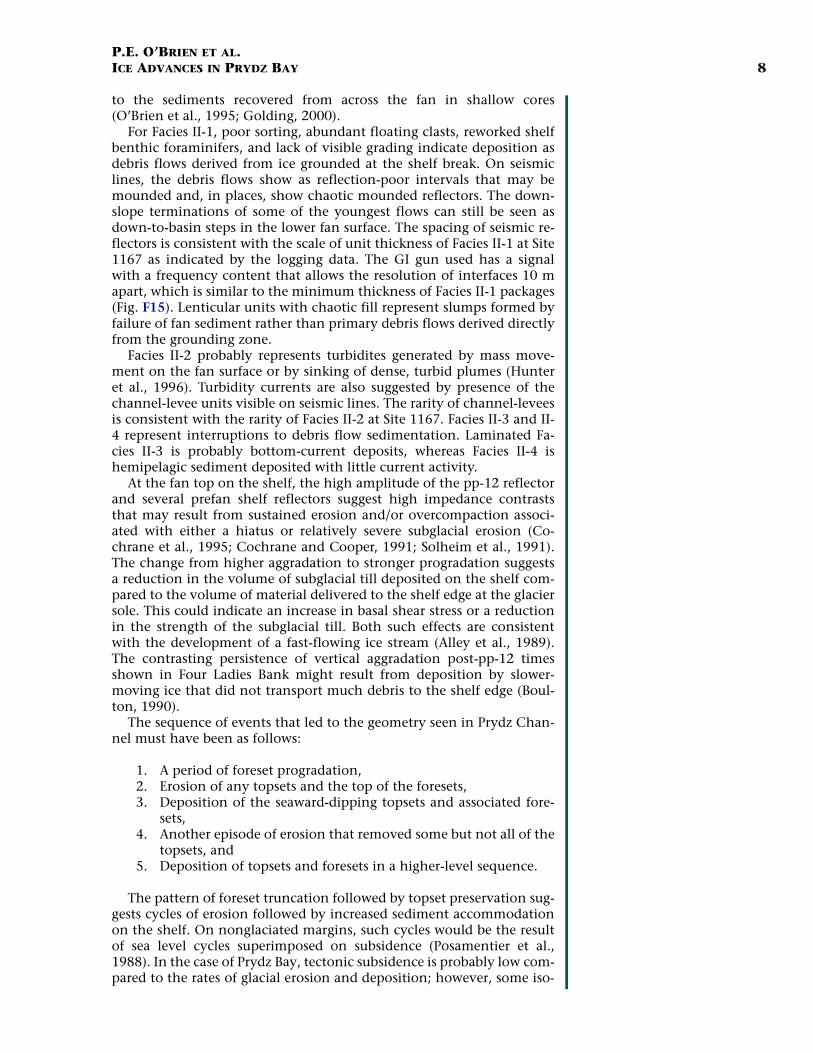
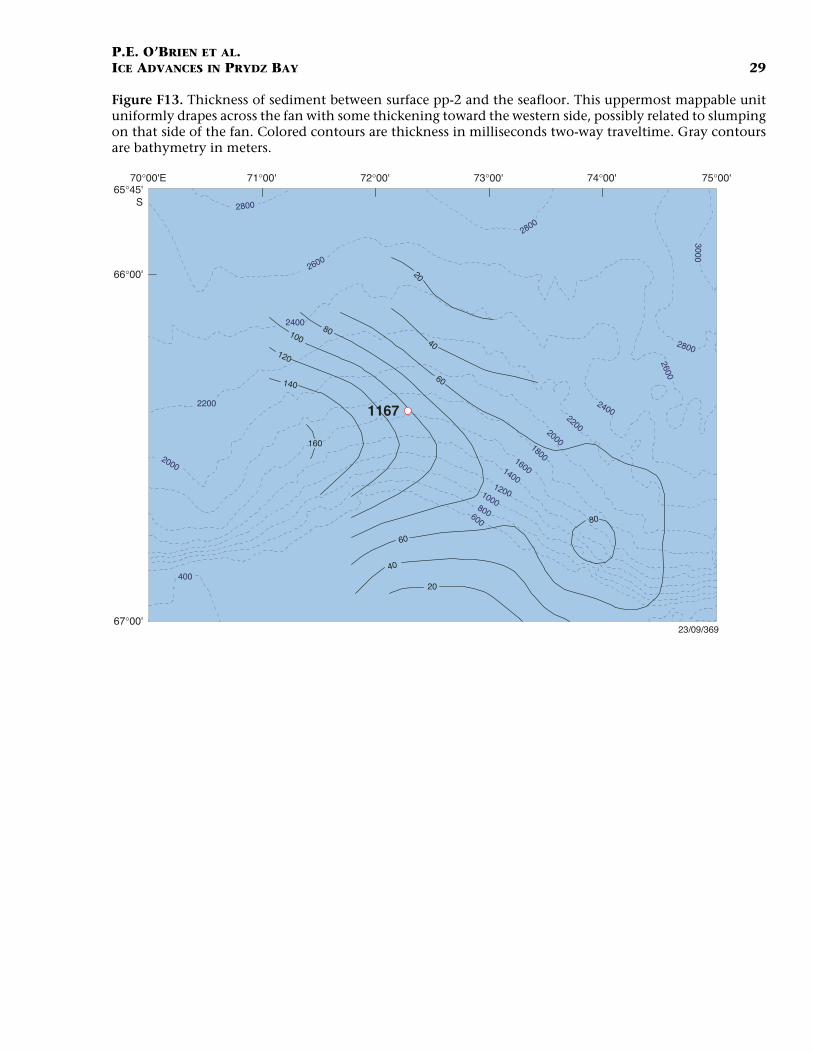
The final stage of fan sedimentation (Fig. F13) (pp-2 to surface) con-sists of a relatively thin layer that drapes the fan and thickens to thewest, with the thickest parts of the sequence on the middle to westernside of the fan.
SITE 1167
Drilling History
Site 1167 was located midfan to obtain as complete a section as pos-sible without drilling too great a thickness and also to avoid shelf edge
pp-12pp-12
0
N S2773.5 2573.5 2373.5 2173.5 1973.5
Line AGSO 149/0901 23/09/365
Tw
o-w
ay tr
avel
time
(s)
4.8 km
1773.5 1573.5 1373.5 1173.5 973.5 773.5 573.5 373.5SP 3025.5 206.0
Slump scarSlump scar
Aggrading topsetsAggrading topsets
Truncated foresets Continuous foreset topset surface
0.154
0.250
0.500
0.750
1.000
1.250
1.500
F9. Topsets in the axis of Prydz Channel, p. 25.
SWNE1453.5 1253.5 1053.5 853.5 653.5 453.5 195.5SP 1653.5
Line AGSO 149/1401
pp-12pp-12
23/09/366
Tw
o-w
ay tr
avel
time
(s)
24 km0
ProgradationProgradationAggrading TopsetsAggrading Topsets
1.250
1.000
0.750
0.500
0.250
0.000
F10. Topset geometry on Four La-dies Bank, p. 26.
2600
2800
2400
2200
2000
400
3000
2800
2800
2600
24002200
200018001600140012001000800
600
1167
2600
2800
2400
2200
2000
400
3000
2800
2800
2600
24002200200018001600
140012001000800600
1167
100
200
300
400
500
600
700
900
1000
800
60
80
80
100
120140
160180200220240260280
80 60
23/09/367
65°45'S
66°00'
67°00'
65°45'S
66°00'
67°00'
70°00'E 71°00' 72°00' 73°00' 74°00' 75°00'
70°00'E 71°00' 72°00' 73°00' 74°00' 75°00'
A
B
F11. Thickness of sediments de-posited (pp-7 to pp-12), p. 27.
1167
1167
406080
100
20
40608010012014016018
0200
40
60
40
2600
2800
2400
2200
2000
400
3000
2800
2800
260024002200
200018001600140012001000800
600
2600
2000
400
2600
2800
2400
2200
2000
400
3000
2800
2800
260024002200
200018001600140012001000800
600
2600
2000
40023/09/368
70°00'E 71°00' 72°00' 73°00' 74°00' 75°00'
70°00'E 71°00' 72°00' 73°00' 74°00' 75°00'
65°45'S
66°00'
67°00'
65°45'S
66°00'
67°00'
A
B
F12. Surfaces pp-5 and pp-4 and pp-4 to pp-2, p. 28.
23/09/369
2600
2800
2400
2200
2000
400
3000
2800
2800
2600
240022002000
18001600140012001000
800600 80
20
40
60
80100
120
14060
40
20
160
1167
70°00'E 71°00' 72°00' 73°00' 74°00' 75°00'65°45'
S
66°00'
67°00'
F13. Latest mappable unit (pp-2 to surface), p. 29.

P.E. O’BRIEN ET AL.ICE ADVANCES IN PRYDZ BAY 6
slumps. Hole 1167A was spudded in 1640 m water depth and drilled to447.5 mbsf, achieving ~40% recovery. Because of the incomplete recov-ery, it was decided to cease core drilling and attempt wireline logging.This was unsuccessful, so Hole 1167B was drilled with logging-while-drilling (LWD) tools. This hole reached 261.8 mbsf before time ran out.
Lithostratigraphy
Site 1167 intersected predominantly clayey silty sands with dispersedrock clasts, minor beds of clays, and coarse sands. Two units were recog-nized by O’Brien, Cooper, Richter, et al. (2001) (Fig. F14):
1. Unit I extends from the seafloor to 5.17 mbsf. It consists of oliveto red-brown clay and sandy clay with isolated beds of fine sandand sand beds that grade from granular at the base to mediumsand at the top. Lonestones are rare, and diatoms and spongespicules form as much as 2% of the clay beds.
2. Unit II makes up the rest of the section. It consists of four facies:a. Facies II-1 makes up most of the section. It is dark gray to red-
dish gray poorly sorted sandy silt, silty sand, clayey sand withdispersed granules, and pebbles and clast-poor diamicton.Foraminifers are a minor component, but diatoms, radiolar-ians, and sponge spicules are absent. Some benthic foramini-fers are typical of the adjacent continental shelf. A few gravelbeds (60% gravel and 40% matrix) are present.
b. Facies II-2 is represented by only a few beds, up to 3 m thick,of moderately sorted quartz coarse sand with granules andmud clasts.
c. Facies II-3 consists of decimeter-scale beds of dark gray clayand clay with thin (<1 mm) silt laminae and burrowed inter-vals. This facies has sharp upper and lower contacts with otherfacies. Rare sand grains are present but the facies lacks lone-stones.
d. Facies II-4 comprises centimeter- to decimeter-scale beds ofgreenish gray to dark gray clay with dispersed sand and gran-ules. Foraminifers and nannoplankton are common. Foramin-ifers are both planktonic forms (Neogloboquadrina pachyderma,sinistral) and benthic forms usually associated with mid-bathyal environments (O’Brien, Cooper, Richter, et al., 2001).
Lithostratigraphy from Logging-While-Drilling Data
The low recovery in the hole made it impossible to estimate thenumber of glacial–interglacial episodes based solely on core samples.However, the LWD tools provided this information for the upper 260 mof the hole. LWD tools collect geophysical measurements of thesediment in the borehole wall using sensors in drill collars just behindthe bit and are used where poor hole conditions prevent conventionallogging (see the ODP Guide to Logging at www.ldeo.columbia.edu/BRG/ODP/LOGGING/TOOLS/tools.html). The configuration of LWDtools used at Site 1167 gave shallow and deep resistivity and spectralgamma readings (Fig. F15).
The combination of deep and shallow resistivity and natural gammalogs clearly shows 16 fine-grained interbeds within the 260 m logged.These clay-rich interbeds appear as low-resistivity spikes, commonly as-sociated with small gamma peaks. Two resistivity peaks at 40 and 60
23/09/369
2600
2800
2400
2200
2000
400
3000
2800
2800
2600
240022002000
18001600140012001000
800600 80
20
40
60
80100
120
14060
40
20
160
1167
70°00'E 71°00' 72°00' 73°00' 74°00' 75°00'65°45'
S
66°00'
67°00'
F14. Lithostratigraphy of Site 1167, p. 30.
Res.(LWD deep)
LithostratigraphicunitGamma Ray
(LWD)(gAPI)
I
II
0 150 1 3.5(Ωm)
Resistivity(LWD shallow)
Cn14a
Cn13b
0.78
1.13+0.2/-0.45
(Sr)
20
40
60
80
100
120
140
160
180
200
220
240
260
0
pp-2
pp-3
pp-4
Chr
on
Bio
stra
tigra
phy
Age(Ma) C
lay
Silt
San
d
C1n
C1r.1r
C1r.2r
Fine-grained intervals
Intersection with seismic surface
Dep
th (
mbs
f)
F15. Logs, lithologies, and age control points, p. 31.
P.E. O’BRIEN ET AL.ICE ADVANCES IN PRYDZ BAY 7
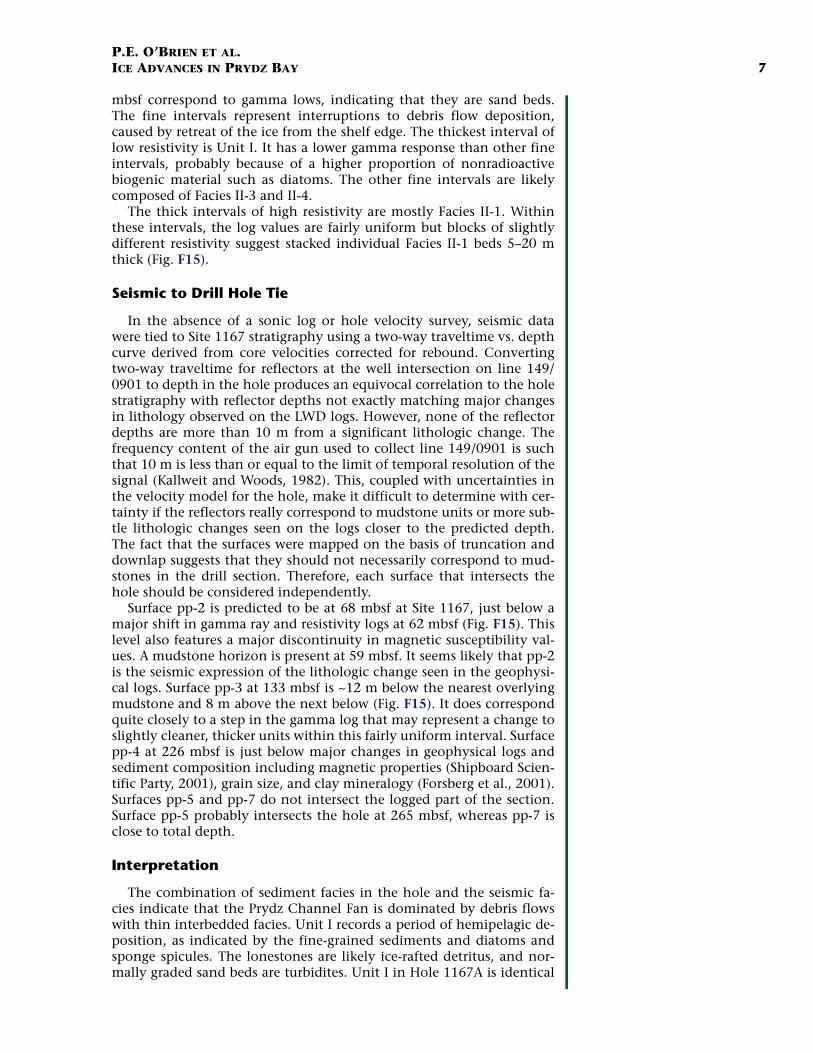
mbsf correspond to gamma lows, indicating that they are sand beds.The fine intervals represent interruptions to debris flow deposition,caused by retreat of the ice from the shelf edge. The thickest interval oflow resistivity is Unit I. It has a lower gamma response than other fineintervals, probably because of a higher proportion of nonradioactivebiogenic material such as diatoms. The other fine intervals are likelycomposed of Facies II-3 and II-4.
The thick intervals of high resistivity are mostly Facies II-1. Withinthese intervals, the log values are fairly uniform but blocks of slightlydifferent resistivity suggest stacked individual Facies II-1 beds 5–20 mthick (Fig. F15).
Seismic to Drill Hole Tie
In the absence of a sonic log or hole velocity survey, seismic datawere tied to Site 1167 stratigraphy using a two-way traveltime vs. depthcurve derived from core velocities corrected for rebound. Convertingtwo-way traveltime for reflectors at the well intersection on line 149/0901 to depth in the hole produces an equivocal correlation to the holestratigraphy with reflector depths not exactly matching major changesin lithology observed on the LWD logs. However, none of the reflectordepths are more than 10 m from a significant lithologic change. Thefrequency content of the air gun used to collect line 149/0901 is suchthat 10 m is less than or equal to the limit of temporal resolution of thesignal (Kallweit and Woods, 1982). This, coupled with uncertainties inthe velocity model for the hole, make it difficult to determine with cer-tainty if the reflectors really correspond to mudstone units or more sub-tle lithologic changes seen on the logs closer to the predicted depth.The fact that the surfaces were mapped on the basis of truncation anddownlap suggests that they should not necessarily correspond to mud-stones in the drill section. Therefore, each surface that intersects thehole should be considered independently.
Surface pp-2 is predicted to be at 68 mbsf at Site 1167, just below amajor shift in gamma ray and resistivity logs at 62 mbsf (Fig. F15). Thislevel also features a major discontinuity in magnetic susceptibility val-ues. A mudstone horizon is present at 59 mbsf. It seems likely that pp-2is the seismic expression of the lithologic change seen in the geophysi-cal logs. Surface pp-3 at 133 mbsf is ~12 m below the nearest overlyingmudstone and 8 m above the next below (Fig. F15). It does correspondquite closely to a step in the gamma log that may represent a change toslightly cleaner, thicker units within this fairly uniform interval. Surfacepp-4 at 226 mbsf is just below major changes in geophysical logs andsediment composition including magnetic properties (Shipboard Scien-tific Party, 2001), grain size, and clay mineralogy (Forsberg et al., 2001).Surfaces pp-5 and pp-7 do not intersect the logged part of the section.Surface pp-5 probably intersects the hole at 265 mbsf, whereas pp-7 isclose to total depth.
Interpretation
The combination of sediment facies in the hole and the seismic fa-cies indicate that the Prydz Channel Fan is dominated by debris flowswith thin interbedded facies. Unit I records a period of hemipelagic de-position, as indicated by the fine-grained sediments and diatoms andsponge spicules. The lonestones are likely ice-rafted detritus, and nor-mally graded sand beds are turbidites. Unit I in Hole 1167A is identical
P.E. O’BRIEN ET AL.ICE ADVANCES IN PRYDZ BAY 8
to the sediments recovered from across the fan in shallow cores(O’Brien et al., 1995; Golding, 2000).
For Facies II-1, poor sorting, abundant floating clasts, reworked shelfbenthic foraminifers, and lack of visible grading indicate deposition asdebris flows derived from ice grounded at the shelf break. On seismiclines, the debris flows show as reflection-poor intervals that may bemounded and, in places, show chaotic mounded reflectors. The down-slope terminations of some of the youngest flows can still be seen asdown-to-basin steps in the lower fan surface. The spacing of seismic re-flectors is consistent with the scale of unit thickness of Facies II-1 at Site1167 as indicated by the logging data. The GI gun used has a signalwith a frequency content that allows the resolution of interfaces 10 mapart, which is similar to the minimum thickness of Facies II-1 packages(Fig. F15). Lenticular units with chaotic fill represent slumps formed byfailure of fan sediment rather than primary debris flows derived directlyfrom the grounding zone.
Facies II-2 probably represents turbidites generated by mass move-ment on the fan surface or by sinking of dense, turbid plumes (Hunteret al., 1996). Turbidity currents are also suggested by presence of thechannel-levee units visible on seismic lines. The rarity of channel-leveesis consistent with the rarity of Facies II-2 at Site 1167. Facies II-3 and II-4 represent interruptions to debris flow sedimentation. Laminated Fa-cies II-3 is probably bottom-current deposits, whereas Facies II-4 ishemipelagic sediment deposited with little current activity.
At the fan top on the shelf, the high amplitude of the pp-12 reflectorand several prefan shelf reflectors suggest high impedance contraststhat may result from sustained erosion and/or overcompaction associ-ated with either a hiatus or relatively severe subglacial erosion (Co-chrane et al., 1995; Cochrane and Cooper, 1991; Solheim et al., 1991).The change from higher aggradation to stronger progradation suggestsa reduction in the volume of subglacial till deposited on the shelf com-pared to the volume of material delivered to the shelf edge at the glaciersole. This could indicate an increase in basal shear stress or a reductionin the strength of the subglacial till. Both such effects are consistentwith the development of a fast-flowing ice stream (Alley et al., 1989).The contrasting persistence of vertical aggradation post-pp-12 timesshown in Four Ladies Bank might result from deposition by slower-moving ice that did not transport much debris to the shelf edge (Boul-ton, 1990).
The sequence of events that led to the geometry seen in Prydz Chan-nel must have been as follows:
1. A period of foreset progradation,2. Erosion of any topsets and the top of the foresets,3. Deposition of the seaward-dipping topsets and associated fore-
sets,4. Another episode of erosion that removed some but not all of the
topsets, and5. Deposition of topsets and foresets in a higher-level sequence.
The pattern of foreset truncation followed by topset preservation sug-gests cycles of erosion followed by increased sediment accommodationon the shelf. On nonglaciated margins, such cycles would be the resultof sea level cycles superimposed on subsidence (Posamentier et al.,1988). In the case of Prydz Bay, tectonic subsidence is probably low com-pared to the rates of glacial erosion and deposition; however, some iso-
P.E. O’BRIEN ET AL.ICE ADVANCES IN PRYDZ BAY 9
static subsidence of the shelf edge induced by shelf progradation is pos-sible (Boulton, 1990; ten Brink et al., 1995).
Consideration needs to be given to the controls on subglacial deposi-tion. Glacial erosion and deposition are controlled by a range of factors(Boulton, 1990). High ice velocities produce high basal shear stress,which favors erosion. High vertical effective pressure, which is theweight of ice thickness minus water pressure at the bed, also produceshigh basal shear stress. Till rheology also influences erosion and deposi-tion (Boulton and Hindmarsh, 1987; Murray, 1997). Till deposition isfavored by lower velocities, lower vertical effective pressure, and rapidbasal melting that delivers sediment to the glacier sole. Basal freezing isthought to entrain sediment in the basal ice (Alley et al., 1997).
For a major ice mass grounded at the shelf edge, vertical effectivepressure is likely to vary with sea level change though the glacial cycleas well as ice volume (Boulton, 1990). The pattern of truncated foresetsseparated by a topset that passes into a foreset can be explained by theresponse of the ice stream to a sea level cycle. Falling sea level increasesthe height of ice above buoyancy and increases the depth of the de-forming bed, eroding the sediments beneath. As sea level begins to rise,the process reverses, depositing a subglacial topset bed as the ice decou-ples from the deforming bed (Murray, 1997) overlain by groundingzone deposits and proximal glaciomarine facies if the grounding zoneretreats from the shelf (Boulton, 1990). This retreat phase produces theforeset–topset unit. The preservation of topset beds in Prydz Channelfrom successive erosion episodes could result from relatively minor ero-sion beneath the outer part of the glacier during each major advance.The slight seaward dip of topsets suggests that preservation was en-hanced by subsidence of the outer shelf sediment wedge caused by dif-ferential compaction and loading of the crust (ten Brink et al., 1995).
Although the tie between the drill site and seismic section is uncer-tain, consideration of the likely processes on the fan surface might ex-plain why the mapped surfaces do not correspond to the obvious fine-grained units. It is thought that trough mouth fans grow primarily dur-ing episodes when the ice is grounded at the shelf edge (Boulton, 1990;Vorren and Laberg, 1997). The erosion surfaces mapped within the fanprobably formed during periods of relative sediment starvation whenthe ice had retreated. During such periods, the fan surface could be re-worked by contour currents or have a hemipelagic drape deposited onit, forming mudstone intervals. Boulton (1990) points out that debrisdeposited near the top of the fan may be reworked during such “inter-glacial” periods. This is also suggested by the surficial slump scars nearthe top of the Prydz Channel Fan (Fig. F4). Therefore, the erosion sur-faces mapped within the fan could conceivably be overlain by thin de-bris flows as well as by hemipelagic intervals. Such reworked debrisflows might contain less clay and so appear to have lower gamma andresistivity values than debris flows beneath. This may be the case forsurfaces pp-3 and pp-4, which correspond to subtle changes in loggingvalues (Fig. F15). Such debris flows may also contain foraminifers with“interglacial” isotope values.
The isopach maps show that the Prydz Channel started as a fairlybroad feature that deposited the more sheetlike interval pp-12 to pp-7but deposited a strongly lobate fan from pp-7 to pp-2. This suggestspreferential downcutting and sediment transport along the channelaxis through that time. The last stage of sedimentation (pp-2 to present)produced a more drapelike deposit with debris flows and, finally, hemi-pelagic sediments deposited evenly across the fan.

P.E. O’BRIEN ET AL.ICE ADVANCES IN PRYDZ BAY 10
CHRONOLOGY AND SEDIMENTATION RATES
The chronology for sediments at Site 1167 is derived from paleomag-netic measurements on cores, diatoms in the uppermost core, a few oc-currences of nannoplankton, and Sr isotope dates from samples ofplanktonic foraminifers (Fig. F15), (O’Brien, Cooper, Richter, et al.,2001). Although these data sources do not provide tightly constrainedages, they can be used to estimate a range of sedimentation rates, eventhough there are probably unresolved disconformities in the section.
Diatoms are restricted to Core 188-1167A-1H, which extends to 5.25mbsf. They include elements of the Thalassiosira lentiginosa Zone,which indicates the age of these sediments is <0.66 Ma (O’Brien, Coo-per, Richter, et al., 2001). Nannoplankton of Subzone CN14a (200–900ka) are found at 37.4 mbsf. Two age data points below this level are a Srdate of 1.13 +0.25/–0.45 Ma on planktonic foraminifers at 218 mbsfand nannoplankton of Zone CN13b between 218 and 228 mbsf, givingan age range of 900 ka to 2 Ma for the interval. The paleomagneticrecord is marked by normal polarity near the top of the section with adownward shift to reversed polarity at 32 mbsf. Shipboard ScientificParty (2001) interpreted this to be the Brunhes/Matuyama boundary(780 ka) on the basis of proximity to the nannoplankton at 37.4 mbsf.Reversed polarity then continues to the base of the hole. We interpretthe apparent absence of the Jaramillo normal episode as the result of andisconformity or a break in core recovery.
Most of the debris flow deposition occurred prior to 780 ka. There areonly three debris flow intervals above this level and they are muchthinner than the units below (Fig. F15). If the average sedimentationrate above 32 mbsf is calculated by dividing depth by age, a rate of only0.041 m/k.y. is obtained. Below 32 mbsf (Brunhes/Matuyama bound-ary), the minimum Sr age allowed by the nannoplankton is 900 ka. Us-ing the maximum age for the Sr date at 218 mbsf (1.38 Ma), theminimum sedimentation rate obtained is 0.31 m/k.y., an order of mag-nitude higher than that above. This rises to 0.53 m/k.y. for the centralage of 1.13 Ma. The maximum rate, using the minimum age for thesample at 218 mbsf (900 ka), is 1.55 m/k.y.
This apparent large reduction in sedimentation rate and the lessernumber of debris flows shallower than 32 mbsf implies a reduction inthe frequency of debris flow episodes after 780 ka. This in turn suggeststhat the Lambert Glacier advanced to the shelf edge only a few times af-ter 780 ka. The uncertainties in the age dating make it difficult to deter-mine when the last advance took place. An approximate date for thelast debris flow may be obtained by using the average sedimentationrate for the upper 32 m (0.041 m/k.y.) and lower part of the hole (0.31–1.55 m/k.y.) to estimate the age of the uppermost debris flow at 5.17mbsf (base of Unit I). If this sedimentation rate is used, the age of thetop of the uppermost debris flow is ~126 ka. However, the sedimenta-tion rate estimate for the upper 32 m included 26.8 m of debris flows,which were likely deposited much faster than the hemipelagic sedi-ments of Unit I above 5.17 mbsf. Therefore, estimates using the rates fordebris flow deposition in the lower part of the hole may be more realis-tic. Using these rates, this 26.8 m of sediment would have taken be-tween 17.3 and 86.5 k.y. to accumulate after 780 ka, resulting in ageestimates of 693.5 to 762.7 ka for the uppermost debris flow. Using thecentral Sr age for the sample at 218 mbsf, the uppermost debris flowwas deposited at 729.4 ka.

P.E. O’BRIEN ET AL.ICE ADVANCES IN PRYDZ BAY 11
DISCUSSION
Fan History
Our age model is imprecise because of the scarcity of datable materialand the likely presence of erosion surfaces within the stacked debrisflow intervals that may have removed parts of the succession. In spiteof these problems, the results do indicate that extreme ice advances tothe shelf edge in Prydz Bay either ceased in the mid-Pleistocene or havebeen very rare since then. A better age model awaits refinements inmethods for dating the material in the hole, but the broad picture isstill clear.
The sedimentary record at Site 1167 suggests that most fan growthtook place between the early Pliocene and early Pleistocene when gla-cial episode duration was dominated by 41-k.y. cycles (Berger and Jan-sen, 1994). The late Pleistocene climatic regime, dominated by 100-k.y.cycles, produced few if any extreme advances. This is the first observa-tion that an ice drainage system sourced the interior of the East Antarc-tic Ice Sheet changed its behavior in the mid-Pleistocene. The cause ofthis change is unknown at present. Three possible mechanisms couldbe involved, singly or in combination.
The first is shelf overdeepening. Advances of an ice sheet onto a con-tinental margin produces overdeepening of the inner shelf by a combi-nation of erosion and isostatic loading (Boulton, 1990). With eachsuccessive advance, the inner shelf deep excavated by the Lambert Gla-cier became deeper so that greater ice volume was required for subse-quent advances to reach the shelf edge (ten Brink et al., 1995). Thereduction in frequency of advances around the mid-Pleistocene may re-flect the passing of a threshold of overdeepening, after which only verylarge increases in ice volume in the Lambert–Amery system caused it toreach the shelf edge. This mechanism may apply only to systems likethe Lambert–Amery, which have had a very long erosional history. Ithas eroded to at least 2200 mbsl near its grounding zone (Fricker et al.,2001). However, the failure of ice streams to reach the shelf edge in thewestern Ross Sea during the LGM (Shipp et al., 1999; Domack et al.,1999) may mean that a mechanism affecting the whole East AntarcticIce Sheet is more likely.
The second possible mechanism is related to global cooling in thelate Pleistocene. Late Pleistocene glacial–interglacial cycles of NorthernHemisphere ice sheets are thought to be related to major reorganiza-tions of the ocean-atmosphere system (Berger and Jansen, 1994). Thechanges that caused Northern Hemisphere ice sheets to expand afterthe mid-Pleistocene may have reduced Antarctic temperatures.
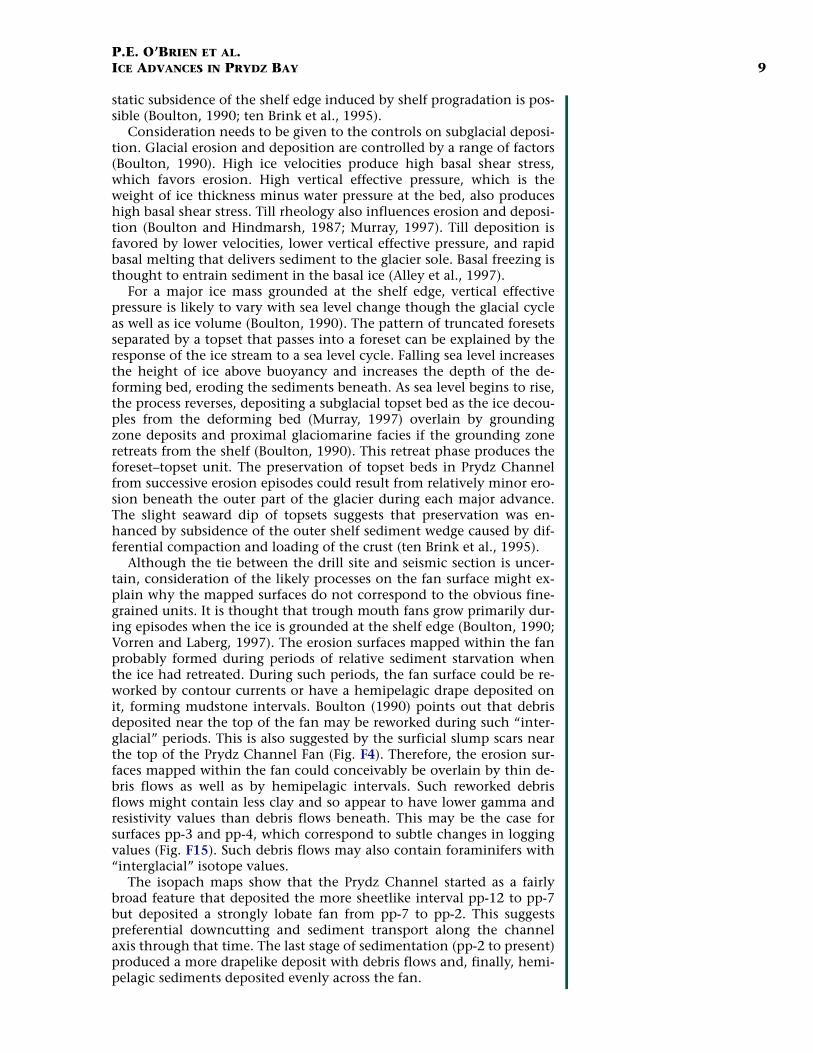
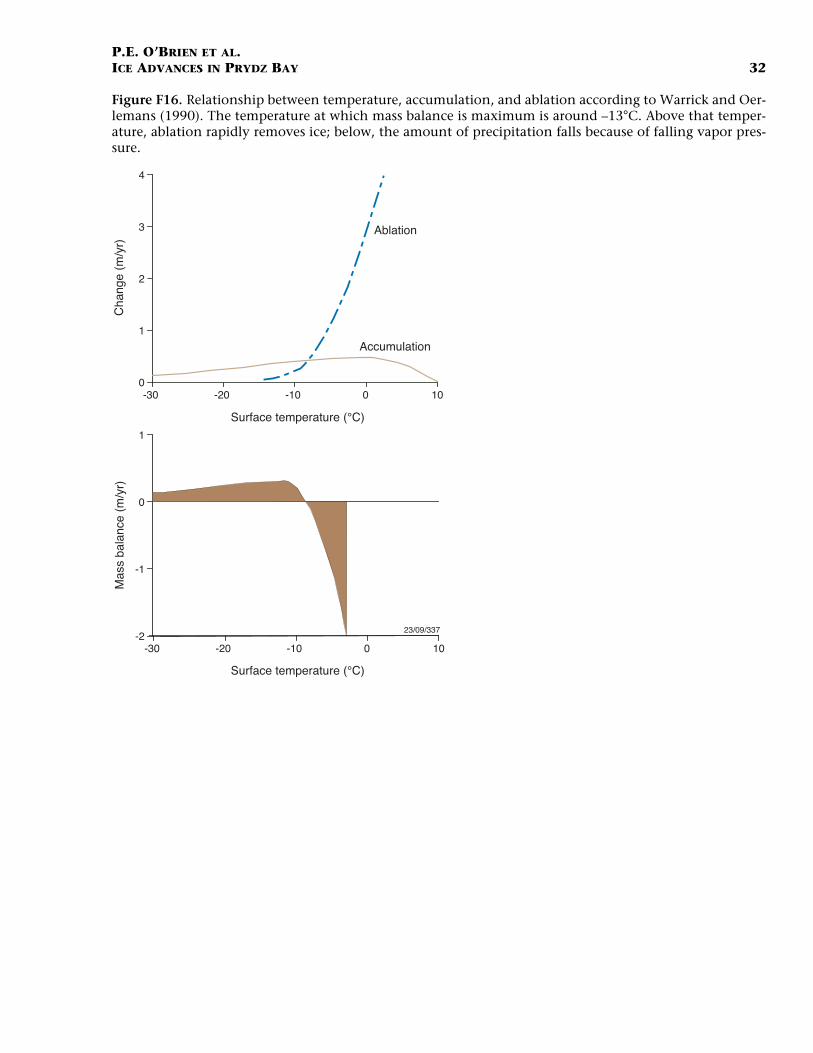
Robin (1977) suggested that precipitation over the Antarctic is con-trolled by advection of moisture in the troposphere. The rate of snow-fall is proportional to the water available in the atmosphere, which is afunction of temperature above the inversion layer, which in turn is re-lated to surface temperature. Thus, the present accumulation rates inAntarctica are highest near the coast, decreasing into the interior withfalling temperatures (Fig. F16), (Giovinetto and Bentley, 1985; Warrickand Oerlemans, 1990; Drewry and Morris, 1992). This reduction in ac-cumulation with falling temperatures is also supported by ice core datacomparing paleotemperatures derived from isotope measurements withaccumulation rates (Lorius, 1989).
An early Pleistocene glacial temperature regime warmer than the latePleistocene could have produced sufficient precipitation in the interior
Ablation
Accumulation
-30 -20 -10 0 10
Mas
s ba
lanc
e (m
/yr)
Cha
nge
(m/y
r)
23/09/337
Surface temperature (°C)
Surface temperature (°C)
-30 -20 -10 0 10
0
1
2
3
4
-2
-1
0
1
F16. Temperature, accumulation, and ablation, p. 32.
P.E. O’BRIEN ET AL.ICE ADVANCES IN PRYDZ BAY 12
to drive the interior ice to the shelf edge during glacial episodes. Mid-Pleistocene cooling reduced vapor transport and precipitation in theEast Antarctic interior, which reduced the volume of ice flowing downthe main Amery–Lambert drainage system and curtailed advances tothe shelf edge. This second process may explain regional differences inice behavior such as that between the eastern and western Ross Sea(Domack et al., 1999; Bart et al., 2000). The western Ross Sea receives itsdrainage from the West Antarctic Ice Sheet.
The third process that may contribute to greater ice advances prior tothe mid-Pleistocene is the interaction of the response time of the inte-rior of the East Antarctic with 41-k.y. climatic cycles that were domi-nant prior to the mid-Pleistocene. We estimate that ice deposited nearthe drainage divide at the head of the Lambert–Amery system takes ~20k.y. to reach the grounding zone. The extra ice deposited during warmparts of the 41-k.y. cycles would have reached the grounding zone nearthe sea level minimum of the cycle, reinforcing seaward advance ofgrounded ice.
Quantification of the volumes of erosion in the Amery Depressionand isostatic loading effects will be needed to see if overdeepeningalone is capable of stopping extreme advances of the Lambert–Amerysystem. The temperature-precipitation hypothesis and the role of cli-mate cycles will need to be investigated by gathering further data onAntarctic sedimentation patterns and paleotemperatures spanning themid-Pleistocene climatic transition. These suggested processes wouldpredict that outlet glaciers fed by ice from the East Antarctic interiorsuch as in the western Ross Sea and eastern Weddell Sea would havealso reached the shelf edge more frequently prior to the mid-Pleis-tocene. Site 1167 requires further detailed work to see if uphole changesin sediment composition can be related to the progress of erosion and/or ice volume changes.
CONCLUSIONS
From the early Pliocene onward, the Prydz Channel Fan was depos-ited mostly by sediment gravity flows formed from basal debris deliv-ered to the continental shelf edge by ice flowing through PrydzChannel during extreme ice advances. The adjacent bank saw minorprogradation and vertical aggradation, probably because the ice wasslower moving. Site 1167 shows that the Lambert Glacier–Amery IceShelf system deposited most of the fan before 780 ka. As few as threeadvances may have taken place since that time. This suggests that ex-treme advances of the East Antarctic Ice Sheet may have occurredmostly before the mid-Pleistocene climate transition. Further data onmid-Pleistocene conditions in Antarctica and direct sampling of otherAntarctic trough mouth fans will be needed to understand the mecha-nisms responsible for this change in ice sheet behavior.
ACKNOWLEDGMENTS
This research used samples and data provided by the Ocean DrillingProgram (ODP). ODP is sponsored by the U.S. National Science Founda-tion (NSF) and participating countries under management of JointOceanographic Institutions (JOI), Inc. The scientific party of ODP Leg188 would like to thank all those who gave support to the leg. We are
P.E. O’BRIEN ET AL.ICE ADVANCES IN PRYDZ BAY 13
grateful to the crew of the JOIDES Resolution, under the supervision ofCaptain Tom Ribbens and Drilling Superintendent Scott Pedersen, andLaboratory Officer Bill Mills and his staff for their hard work under dif-ficult conditions. Operations were conducted with the guidance of ODPOperations Manager Mike Storms. We would thank German Leitchen-kov of VNIIOkeangeologia (St. Petersberg, Russia) and Takemai Ishiharaand Manabu Tanahashi of the Geological Survey of Japan, who contrib-uted data and advice on drill sites. Neville Exon and Peter Harris pro-vided comments on the manuscript. Philip O’Brien publishes with thepermission of the Chief Executive Officer, Geoscience Australia.
P.E. O’BRIEN ET AL.ICE ADVANCES IN PRYDZ BAY 14
REFERENCES
Alley, R.B., Blankenship, D.D., Rooney, S.T., and Bentley, C.R., 1989. Sedimentationbeneath ice shelves: the view from Ice Stream B. Mar. Geol., 85:101–120.
Alley, R.B., Cuffey, K.M., Everson, E.B., Strasser, J.C., Lawson, D.E., and Larson, G.J.,1997. How glaciers entrain and transport basal sediment: physical constraints.Quat. Sci. Rev., 16:1017–1038.
Allison, I.F., 1979. The mass budget of the Lambert Glacier drainage basin, Antarctica.J. Glaciol., 22:223–235.
Anderson, J.B., Shipp, S.S., Lowe, A.L., Smith-Wellner, J., and Mosola, A.B., 2002. TheAntarctic ice sheet during the Last Glacial Maximum and its subsequent retreathistory: a review. Quat. Sci. Rev., 21:49–70.
Barron, J., Larsen, B., and Baldauf, J.G., 1991. Evidence for late Eocene to early Oli-gocene Antarctic glaciation and observations on late Neogene glacial history ofAntarctica: results from Leg 119. In Barron, J., Larsen, B., et al., Proc. ODP, Sci.Results, 119: College Station, TX (Ocean Drilling Program), 869–891.
Barron, J., Larsen, B., et al., 1989. Proc. ODP, Init. Repts., 119: College Station, TX(Ocean Drilling Program).
Bart, P.J., Anderson, J.B., Trincardi, F., and Shipp, S.S., 2000. Seismic data from theNorthern Basin Ross Sea record multiple expansions of the East Antarctic Ice Sheetduring the late Neogene. Mar. Geol., 166:31–50.
Berger, W.H., and Jansen, E., 1994. Mid-Pleistocene climate shift: the Nansen connec-tion. In Overland, J.E., Muench, R.D., and Johannessen, O.M. (Eds.), The PolarOceans and their Role in Shaping the Global Environment. Geophys. Monogr., 85:295–311.
Boulton, G.S., 1990. Sedimentary and sea level changes during glacial cycles and theircontrol on glacimarine facies architecture. In Dowdeswell, J.A., and Scourse, J.D.(Eds.), Glacimarine Environments: Processes and Sediments. Spec. Publ.—Geol. Soc.London, 53:15–52.
Boulton, G.S., and Hindmarsh, R.C.A., 1987. Sediment deformation below glaciers:rheology and geological consequences. J. Geophys. Res., 92:9059–9082.
Cochrane, G.R., and Cooper, A.K., 1991. Sonobuoy seismic studies at ODP drill sitesin Prydz Bay, Antarctica. In Barron, J., Larsen, B., et al., Proc. ODP, Sci. Results, 119:College Station, TX (Ocean Drilling Program), 27–44.
Cochrane, G.R., De Santis, L., and Cooper, A.K., 1995, Seismic velocity expression ofglacial sedimentary rocks beneath the Ross Sea from sonobuoy seismic-refractiondata. In Cooper, A.K., Barker, P.F., and Brancolini, G. (Eds.), Geology and SeismicStratigraphy of the Antarctic Margin. Antarct. Res. Ser., 68:261–270.
Cooper, A., Stagg, H., and Geist, E., 1991. Seismic stratigraphy and structure of PrydzBay, Antarctica: implications from Leg 119 drilling. In Barron, J., Larsen, B., et al.,Proc. ODP, Sci. Results, 119: College Station, TX (Ocean Drilling Program), 5–26.
Domack, E., O’Brien, P., Harris, P., Taylor, F., Quilty, P.G., DeSantis, L., and Rakers, B.,1998. Late Quaternary sedimentary facies in Prydz Bay, East Antarctica and theirrelationship to glacial advance onto the continental shelf. Antarct. Sci.,10:236–246.
Domack, E.W., Jacobson, E.A., Shipp, S., and Anderson, J.B., 1999. Late Pleistocene–Holocene retreat of the West Antarctic Ice-Sheet system on the Ross Sea, Part 2.Sedimentological and stratigraphic signature. Bull. Geol. Soc. Am., 111:1517–1536.
Drewry, D.J., and Morris, E.M., 1992. The response of large ice sheets to climatechange. Philos. Trans. R. Soc. London B., 338:235–242.
Forsberg, C.F., Solheim, A., Gruetzner, J., Taylor, B., and Strand, K., 2001. Glacialdevelopment in the Prydz Bay region as witnessed by geotechnical and mineralog-ical properties of Leg 188 Sites 1166 and 1167. In Florindo, F., and Cooper, A.K.(Eds.), The Geologic Record of the Antarctic Ice Sheet from Drilling, Coring and SeismicStudies. Quad. Geofis., 16:71–72. (Abstract)
P.E. O’BRIEN ET AL.ICE ADVANCES IN PRYDZ BAY 15
Fricker, H.A., Popov, S., Allison, I., and Young, N., 2001. Distribution of marine icebeneath the Amery Ice Shelf. Geophys. Res. Lett., 28:2241–2244.
Fricker, H.A., Warner, R.C., and Allison, I., 2000. Mass balance of the Lambert Gla-cier–Amery Ice Shelf system, East Antarctica: a comparison of computed balancefluxes and measured fluxes. J. Glaciol., 46:561–570.
Giovinetto, M.B., and Bentley, C.R., 1985. Surface drainage systems of Antarctica.Antarct. J. U.S., 20:6–13.
Golding, J., 2000. A sediment facies model of the Prydz Bay trough-mouth fan, EastAntarctica [Msc. thesis]. Univ. Sydney.
Harris, P.T., O’Brien, P.E., Quilty, P.G., Taylor, F., Domack, E., DeSantis, L., and Rakers,B., 1997. Post-cruise report, Antarctic CRC Marine Geoscience: Vincennes Bay,Prydz Bay and Mac.Robertson Shelf, AGSO Cruise 186, ANARE Voyage 5, 1996/97.AGSO Rec., 1997/51.
Harris, P.T., O’Brien, P.E., Sedwick, P., and Truswell, E.M., 1996. Late Quaternary his-tory of sedimentation on the Mac.Robertson Shelf, East Antarctica: problems with14C-dating of marine sediment cores. Pap. Proc. R. Soc. Tasmania, 130:47–53.
Hunter, L.E., Powell, R.D., and Smith, G.W. 1996. Facies architecture and grounding-line processes of morainal banks during deglaciation of coastal Maine, U.S.A. Geol.Soc. Am. Bull., 108:1022–1038.
Kallweit, R.S., and Woods, L.C., 1982. The limits of resolution of zero-phase wavelets.Geophysics, 47:1035–1046.
Kuvaas, B., and Leitchenkov, G., 1992. Glaciomarine turbidite and current-controlleddeposits in Prydz Bay, Antarctica. Mar. Geol., 108:365–381.
Laberg, J.S., and Vorren, T.O., 1995. Late Weichselian submarine debris flow depositson the Bear Island trough mouth fan. Mar. Geol., 127:45–72.
Licht, K.J., Dunbar, N.W., Andrews, J.T., and Jennings, A.E., 1999. Distinguishing sub-glacial till and glacial marine diamictons in the western Ross Sea, Antarctica: impli-cations for a Last Glacial Maximum grounding line. Geol. Soc. Am. Bull., 111:91–103.
Lorius, C., 1989. Polar ice cores and climate. In Berger, S., Schreider, S., and Duplessy,J.C. (Eds.), Climate and Geosciences: London (Kluwer Academic Publishers), 77–103.
Mizukoshi, I., Sunouchi, H., Saki, T., Sato, S., and Tanahashi, M., 1986. Preliminaryreport of geological geophysical surveys off Amery Ice Shelf, East Antarctica. Mem.Natl. Inst. Polar Res., Spec. Issue (Jpn.), 43:48–61.
Murray, T., 1997. Assessing the paradigm shift: deformable glacier beds. Quat. Sci.Rev., 16:995–1016.
O’Brien, P.E., Cooper, A.K., Richter, C., et al., 2001. Proc. ODP, Init. Repts., 188 [CD-ROM]. Available from: Ocean Drilling Program, Texas A&M University, College Sta-tion TX 77845-9547, USA.
O’Brien, P.E., De Santis, L., Harris, P.T., Domack, E., and Quilty, P.G., 1999. Ice shelfgrounding zone features of western Prydz Bay, Antarctica: sedimentary processesfrom seismic and sidescan images. Antarct. Sci., 11:78–91.
O’Brien, P.E., and Harris, P.T., 1996. Patterns of glacial erosion and deposition inPrydz Bay and the past behaviour of the Lambert Glacier. Pap. Proc. R. Soc. Tasma-nia, 130:79–86.
O’Brien, P.E., Harris, P.T., Quilty, P.G. Taylor, F., and Wells, P., 1995. Post-cruise report,Antarctic CRC Marine Geoscience: Prydz Bay, Mac.Robertson Shelf and KerguelenPlateau. AGSO Rec., 1995/29.
O’Brien, P.E., and Leitchenkov, G., 1997. Deglaciation of Prydz Bay, East Antarctica,based on echo sounder and topographic features. In Barker, P.F., and Cooper, A.K.(Eds.), Geology and Seismic Stratigraphy of the Antarctic Margin (Pt. 2). Antarct. Res.Ser., 71:109–125.
Posamentier, H.W., Jervey, M.T., and Vail, P.R., 1988. Eustatic controls on clasticdeposition, I. Conceptual framework. In Wilgus, C.K., Hastings, B.S., Ross, C.A.,Posamentier, H.W., Van Wagoner, J., and Kendall, C.G.St.C. (Eds.), Sea-Level
P.E. O’BRIEN ET AL.ICE ADVANCES IN PRYDZ BAY 16
Changes: An Integrated Approach. Spec. Publ.—Soc. Econ. Paleontol. Mineral.,42:109–124.
Pudsey, C.J., Barker, P.F., and Larter, R.D., 1994. Ice sheet retreat from the AntarcticPeninsula shelf. Cont. Shelf Res., 14:1647–1675.
Robin, G. de Q., 1977. Ice cores and climatic change. Philos. Trans. R. Soc. London, Ser.B, 280:143–168.
Shipboard Scientific Party, 2001. Site 1167. In O’Brien, P.E., Cooper, A.K., Richter, C.,et al., Proc. ODP, Init. Repts., 188, 1–97 [CD-ROM]. Available from: Ocean DrillingProgram, Texas A&M University, College Station TX 77845-9547, USA.
Shipp, S., Anderson, J.B., and Domack, E.W., 1999. Late Pleistocene–Holocene retreatof the West Antarctic Ice-Sheet system on the Ross Sea, Part 1. Geophysical results.Geol. Soc. Am. Bull., 111:1486–1516.
Solheim, A., Forsberg, C.F., and Pittenger, A., 1991. Geotechnical properties of gla-cigenic shelf sediments from Prydz Bay, East Antarctica. In Barron, J., Larsen, B., etal., Proc. ODP, Sci. Results, 119: College Station, TX (Ocean Drilling Program), 143–167.
ten Brink, U.S., Schneider, C., and Johnson, A.H., 1995. Morphology and stratalgeometry of the Antarctic continental shelf: insights from models. In Cooper, A.K.,Barker, P.F., and Brancolini, G. (Eds.), Geology and Seismic Stratigraphy of the AntarcticMargin. Antarct. Res. Ser., 68:1–24.
Vanney, J.R., and Johnson, G.L., 1985. GEBCO bathymetric sheet 5.18 (circum-Antarctic). In Jacobs, S.S. (Ed.), Oceanology of the Antarctic Continental Shelf. Antarct.Res. Ser., 43:1–3.
Vorren, T.O., and Laberg, J.S., 1997. Trough mouth fans—palaeoclimate and ice sheetmonitors. Quat. Sci. Rev., 16:865–881.
Warrick, R.A., and Oerlemans, J., 1990. Sea level rise. In Houghton, J.T., Jenkins, G.J.,and Ephraums, J.J., (Eds.), Climate Change—the IPCC Assessment: Cambridge (Cam-bridge Univ. Press), 257–281.

P.E. O’BRIEN ET AL.ICE ADVANCES IN PRYDZ BAY 17
Figure F1. Bathymetry of Prydz Bay showing the location of the Prydz Channel Trough Mouth Fan, PrydzChannel, and ODP Site 1167. Last Glacial Maximum (LGM) grounding zone wedges are shown afterDomack et al. (1998). Arrows indicate ice flow directions during post-late Miocene extreme advances of theLambert Glacier–Amery Ice Shelf system (modified from O’Brien and Harris, 1996).
68°E72° 76°
66°S
67°
68°
69°
3000
2000
1000
LGM Grounding zone wedge Ice flow direction during extreme advances
Bathymetric contour (interval 200 m)
740
741
1166742
739
743
1167
23/09/357
Four LadiesBank
Mac.RobertsonLand
Amery IceShelf
AmeryDepression
400
200
Prydz ChannelPrydz ChannelFanFan
Prydz Channel
Prydz C
hannel
PrincessElizabeth
Land

P.E. O’BRIEN ET AL.ICE ADVANCES IN PRYDZ BAY 18
Figure F2. Isopach map of the Prydz Channel Trough Mouth Fan.
Isopach contour (interval 100 m)
72° 76°
66°S
67°
68°
69°
23/09/358
Amery IceShelf Princess
ElizabethLand
68°E
Mac.RobertsonLand
200
500
1000
200
0
0
740
741741
1166742
739
743743
11671167
edge
Shelf

P.E. O’BRIEN ET AL.ICE ADVANCES IN PRYDZ BAY 19
Figure F3. Prydz Bay showing the location of seismic lines collected during the 1995 ANARE/AGSO survey.Figured lines shown in bold.
68°E72° 76°
66°S
67°
68°
69°
3000
2000
1000
23/09/359
Four LadiesBank
Mac.RobertsonLand
Amery IceShelf
AmeryDepression
400
200
Prydz ChannelPrydz ChannelFanFan
PrincessElizabeth
Land
740
741
1166742
739
149/1501149/1501
149/0901149/0901
149/
1701
149/
1701
149/
1402
149/
1402
149/
1401
149/
1401
149/1201149/1201
149/1301149/1301
149/
1601
149/
1601
149/0801149/0801
149/1101149/1101
149/1001149/1001
149/1101
149/1101
149/1801,149/1801,149/1802149/1802
149/0203
149/0601
149/0201149/0201
149/0202149/0202
743
Prydz Channel
Prydz C
hannel
Bathymetric contour (interval 200 m)
1167

P.E. O’BRIEN ET AL.ICE ADVANCES IN PRYDZ BAY 20
Figure F4. Seismic line showing a dip section through the axis of the Prydz Channel Trough Mouth Fan(line AGSO 149/0901) and Site 1167. Surface pp-12 is the base of the fan. Steps on the fan surface corre-spond to pinchout of surface units. SP = shotpoint.
Site 1167
Line AGSO 149/0901 23/09/360
S
Tw
o-w
ay tr
avel
time
(s)
0.705
1.500
2.000
2.500
3.000
3.733
SP 5041 4641 4141 3641 3141 2641 2223.5N
pp-12pp-12StepStepPinch outPinchout
6.4 km0
P.E. O’BRIEN ET AL.ICE ADVANCES IN PRYDZ BAY 21
Figure F5. Section across the fan highly compressed to show the broad mounded geometry of recent units(line AGSO 149/1001). Current surface shows some mounding and gullying. The fan onlaps older sedimentdrift deposits at surface pp-12. SP = shotpoint.
E WSP 575.5 825.5 1075.5 1325.5 1575.5 1825.5 1988
Tw
o-w
ay tr
avel
time
(s)
3.8
3.6
3.4
3.2
Down lapDownlapDown lapDownlap
pp-12pp-12
4 km0
23/09/361
Line AGSO 149/1001
P.E. O’BRIEN ET AL.ICE ADVANCES IN PRYDZ BAY 22
Figure F6. Distal strike section across the fan showing channel-levee units and depositional mounds (lineAGSO 149/1501). Internally, the fan consists of reflection-rich and -poor intervals possibly representingthicker debris flow (reflection poor) intervals interbedded with hemipelagic sediment (reflection rich) in-tervals. SP = shotpoint.
SW NE
2.580
3.000
3.500
4.000
SP 3387.5 3487.5 3587.5 3687.5 3787.5 3887.5 3953
Tw
o-w
ay tr
avel
time
(s)
pp-12pp-12
23/09/362Line AGSO 149/1501
0 1.6 km
ChannelChannelLeevesLeevesMoundsMounds

P.E. O’BRIEN ET AL.ICE ADVANCES IN PRYDZ BAY 23
Figure F7. Dip section across the shelf edge and upper slope of Prydz Bay east of the Prydz Channel Fan.The vertical exaggeration is the same as that in Figure F4, p. 20. Surface pp-12 is overlain by near-verticallystacked paleoshelf edges. SP = shotpoint.
SWNE
Tw
o-w
ay tr
avel
time
(s)
195.5453.5853.51253.51653.52053.5SP 2453.5
Line AGSO 149/1401 23/09/363
pp-12pp-12
Paleo Shelf EdgePaleoshelf Edge
Four Ladies BankFour Ladies Bank
6.4 km0
3.164
3.000
2.000
1.000
0.000
P.E. O’BRIEN ET AL.ICE ADVANCES IN PRYDZ BAY 24
Figure F8. Portion of line 149/0901 showing location of Site 1167 and the intersection with mapped sur-faces pp-2, pp-3, pp-4, pp-5, pp-7, and pp-12. SP = shotpoint.
Site 1167
Tw
o-w
ay tr
avel
time
(s)
N S3970.5 3920.5 3879.5SP 4020.5 3995.5 3945.5 3895.5
pp-12pp-12
23/09/364Line AGSO 149/1001
0 960 m
pp-2pp-2
pp-3pp-3
pp-4pp-4pp-5pp-5
pp-7pp-7
1.912
2.000
2.250
2.500
2.750
3.000
3.250
3.494
P.E
. O’B
RIE
N E
T AL.
ICE A
DV
AN
CE
S IN P
RY
DZ B
AY
25
Figure ne AGSO 149/0901). Before surface pp-12 formed, the shelf shows aggrada-tion. P nded by horizons which show both foresets and topsets. SP = shotpoint.
pp-12pp-12
0
S
23/09/365
Tw
o-w
ay tr
avel
time
(s)
4.8 km
1573.5 1373.5 1173.5 973.5 773.5 573.5 373.5SP 206.0
Aggrading topsetsAggrading topsets
Continuous foreset topset surface
0.15
0.25
0.50
0.75
1.00
1.25
1.50
F9. Prydz Channel Fan topsets in the axis of Prydz Channel (liost-pp-12, the fan exhibits sequences of truncated foresets bou
N2773.5 2573.5 2373.5 2173.5 1973.5
Line AGSO 149/0901
1773.5 3025.5
Slump scarSlump scar
Truncated foresets
4
0
0
0
0
0
0

P.E. O’BRIEN ET AL.ICE ADVANCES IN PRYDZ BAY 26
Figure F10. Topset geometry on Four Ladies Bank (line 149/1401). Near-vertical aggradation continued af-ter the cutting of surface pp-12 and ended before late-stage rapid progradation. Topsets include horizonswith high impedance suggesting high compaction produced by subglacial erosion. SP = shotpoint.
SWNE1453.5 1253.5 1053.5 853.5 653.5 453.5 195.5SP 1653.5
Line AGSO 149/1401
pp-12pp-12
23/09/366
Tw
o-w
ay tr
avel
time
(s)
24 km0
ProgradationProgradationAggrading TopsetsAggrading Topsets
1.250
1.000
0.750
0.500
0.250
0.000

P.E. O’BRIEN ET AL.ICE ADVANCES IN PRYDZ BAY 27
Figure F11. A. Thickness of sediments deposited during the early stage of fan growth (pp-12 to pp-7). Thefan started as a broad wedge of sediment. Green polygon shows extent of data in which both horizons arerecognizable. B. Thickness of sediments between surfaces pp-7 and pp-5. The sediments form a distinct lobeseaward of the axis of Prydz Channel. Colored contours are thickness in milliseconds two-way traveltime.Gray contours are bathymetry in meters.
2600
2800
2400
2200
2000
400
3000
2800
2800
2600
24002200
200018001600140012001000800
600
1167
2600
2800
2400
2200
2000
400
3000
2800
2800
2600
24002200200018001600
140012001000800600
1167
100
200
300
400
500
600
700
900
1000
800
60
80
80
100
120140
160180200220240260280
80 60
23/09/367
65°45'S
66°00'
67°00'
65°45'S
66°00'
67°00'
70°00'E 71°00' 72°00' 73°00' 74°00' 75°00'
70°00'E 71°00' 72°00' 73°00' 74°00' 75°00'
A
B

P.E. O’BRIEN ET AL.ICE ADVANCES IN PRYDZ BAY 28
Figure F12. A. Thickness of sediment between surfaces pp-5 and pp-4. These surfaces are close together sothe isopach shows as a thin sheet of sediment, slightly thicker on the western side. Green polygon showsextent of data in which both horizons are recognizable. B. Thickness of surfaces between pp-4 and pp-2.Deposition between these surfaces produced a sediment lobe in midfan seaward of the Prydz Channel axis.Colored contours are thickness in milliseconds two-way traveltime. Gray contours are bathymetry inmeters.
1167
1167
406080
100
20
40608010012014016018
0200
40
60
40
2600
2800
2400
2200
2000
400
3000
2800
2800
260024002200
200018001600140012001000800
600
2600
2000
400
2600
2800
2400
2200
2000
400
3000
2800
2800
260024002200
200018001600140012001000800
600
2600
2000
40023/09/368
70°00'E 71°00' 72°00' 73°00' 74°00' 75°00'
70°00'E 71°00' 72°00' 73°00' 74°00' 75°00'
65°45'S
66°00'
67°00'
65°45'S
66°00'
67°00'
A
B
P.E. O’BRIEN ET AL.ICE ADVANCES IN PRYDZ BAY 29
Figure F13. Thickness of sediment between surface pp-2 and the seafloor. This uppermost mappable unituniformly drapes across the fan with some thickening toward the western side, possibly related to slumpingon that side of the fan. Colored contours are thickness in milliseconds two-way traveltime. Gray contoursare bathymetry in meters.
23/09/369
2600
2800
2400
2200
2000
400
3000
2800
2800
2600
240022002000
18001600140012001000
800600 80
20
40
60
80100
120
14060
40
20
160
1167
70°00'E 71°00' 72°00' 73°00' 74°00' 75°00'65°45'
S
66°00'
67°00'

P.E. O’BRIEN ET AL.ICE ADVANCES IN PRYDZ BAY 30
Figure F14. Lithostratigraphic section of Site 1167 (Hole 1167A) (from O’Brien, Cooper, Richter, et al.,2001).
Dep
th (
mbs
f)
clay silt sandI
II
Unit I: Clay and sandy clay with isolated beds of fine sand and rare lonestones; minor biogenic component
Unit II: Clayey silty sand with local diamicton beds and minor foraminifers
One major facies and three minor facies:
Facies II-1: Dark gray sandy silt, silty sand, clayey sand and clast-poor diamicton
Facies II-2: Gray, moderately-sorted coarse sand
Facies II-3: Dark gray clay and clay with light-colored silt laminae
Facies II-4: Green gray clay with dispersed clasts, abundant foraminifers and minor nannofossil component
F-II-1
F-II-2
F-II-2
F-II-2
F-II-1
F-II-1
F-II-1
F-II-1
F-II-1
F-II-1
F-II-4
F-II-4
F-II-3
F-II-3
F-II-3
F-II-3
Intervals contain red color banding
F-II-4
Gravel bed
F-II-4
1H2H
3H
4H5H7X8X
9X
10X
11X
12X
13X
14X
15X
16X
17X
18X
19X
20X
21X
22X
23X
24X
25X
26X
27X
28X
29X
30X
31X
32X
33X
34X
35X
36X
37X
38X
39X
40X
41X
42X
43X
44X
45X
46X
47X
48X
49X
0
10cm
0
10cm
0
10cm

P.E. O’BRIEN ET AL.ICE ADVANCES IN PRYDZ BAY 31
Figure F15. Geophysical logs, lithologies, and age control points for the upper 260 m of Site 1167 (Hole1167B). Logs obtained by logging while drilling (LWD). Shaded intervals are clay beds, as indicated by lowresistivity and high gamma readings.
Res.(LWD deep)
LithostratigraphicunitGamma Ray
(LWD)(gAPI)
I
II
0 150 1 3.5(Ωm)
Resistivity(LWD shallow)
Cn14a
Cn13b
0.78
1.13+0.2/-0.45
(Sr)
20
40
60
80
100
120
140
160
180
200
220
240
260
0
pp-2
pp-3
pp-4
Chr
on
Bio
stra
tigra
phy
Age(Ma) C
lay
Silt
San
d
C1n
C1r.1r
C1r.2r
Fine-grained intervals
Intersection with seismic surface
Dep
th (
mbs
f)
P.E. O’BRIEN ET AL.ICE ADVANCES IN PRYDZ BAY 32
Figure F16. Relationship between temperature, accumulation, and ablation according to Warrick and Oer-lemans (1990). The temperature at which mass balance is maximum is around –13°C. Above that temper-ature, ablation rapidly removes ice; below, the amount of precipitation falls because of falling vapor pres-sure.
Ablation
Accumulation
-30 -20 -10 0 10
Mas
s ba
lanc
e (m
/yr)
Cha
nge
(m/y
r)
23/09/337
Surface temperature (°C)
Surface temperature (°C)
-30 -20 -10 0 10
0
1
2
3
4
-2
-1
0
1