Embed Size (px)
Citation preview

Coombabah State High School
ANNUAL REPORT
2018 Queensland State School Reporting
Every student succeeding State Schools Strategy
Department of Education
Contact information

Postal address PO Box 146 Runaway Bay 4216
Phone (07) 5552 3888
Fax (07) 5552 3800
Email [email protected]
Webpages Additional information about Queensland state schools is located on:
the My School website
the Queensland Government data website
the Queensland Government schools directory website.
Contact person Mr Chris Kern - Principal

From the Principal
School overview
Coombabah SHS - is a community committed to building productive partnerships and pathways. This is achieved by the provision of a diverse curriculum, comprised of both university entry subjects and nationally accredited certificate courses. Selective entry programs offered include Academic Excellence, Sport, Performing and Visual Arts. Academic acceleration is encouraged. An established Honours and scholarship scheme provides deserved recognition for high achieving students. An experienced student engagement team provides the essential support to assist students achieve their goals. Co-curricular opportunities are varied and extensive - in sport, creative and performing arts and leadership activities, to name but a few. The school is environmentally focused and has established many energy-efficient initiatives to ensure that Coombabah is at the forefront in projecting the environmental message. Literacy is a major area of focus for our school. Other priorities include quality curriculum, developing expert teachers, and maximising student engagment. Please feel free to contact us to discover the fantastic programs available in these areas. Coombabah's vision is to provide the structure and support to assist students achieve quality outcomes - so vital to success in the competitive global community of the twenty-first century.
School progress towards its goals in 2018
Welcome to the 2018 School Annual Report This report provides parents and members of the school community with information about the school’s activities and performance during the 2018 school year. It highlights strengths and identifies areas for development and improvement. The School Annual Report is a public document required for the school’s and Education Queensland’s accountability and improvement purposes. It provides valuable information for Education Queensland and members of the school community on the achievement of the school in relation to declared systemic and school priorities. The School Annual Report fulfils three functions: 1. It provides the school community, through the Parents and Citizens Association, with information on the school’s progress towards achieving the goals and priorities outlined in the school’s Annual Implementation Plan. 2. It provides the Assistant Regional Director with information to guide discussions about both the school’s progress towards achieving organisational goals and the priorities of the school. 3. It provides a base on which the school develops its next School Plan. The report provides information for prospective and current parents on our school, including size, subjects offered, qualifications of staff, results of School Opinion Surveys and school performance in NAPLAN testing for year 9. I trust you will find the 2018 School Annual Report informative. Chris Kern (Principal)
Future outlook
Significant areas of focus for 2019 include: Literacy improvement through clear Literacy development program Rebranding / communication project to bring public awareness to our high performing programs Continued development of meaningful partnerships with our partner Primary schools. Continuation of the work on personalised learning evident in classrooms along with explicit teaching agenda

Developing Performance Framework for all staff. Continuing development of Australian Curriculum and the implementation of the new ATAR qualification system
Our school at a glance
School profile
Coeducational or single sex Coeducational
Independent public school No
Year levels offered in 2018 Year 7 - Year 12
Student enrolments
Table 1: Student enrolments at this school
Enrolment category 2016 2017 2018
Notes:
1. Student counts are based on the Census (August) enrolment collection.
2. Indigenous refers to Aboriginal and Torres Strait Islander people of Australia.
3. pre-Prep is a kindergarten program for Aboriginal and Torres Strait Islander children, living in 35 Aboriginal and Torres Strait Islander communities, in the year before school.
Total 1092 1099 1064
Girls 451 463 453
Boys 641 636 611
Indigenous 50 53 57
Enrolment continuity (Feb. – Nov.) 88% 86% 86%
In 2018, there were no students enrolled in a pre-Prep program.
Characteristics of the student body
Overview
The student body has seen stable numbers of enrolment. Year 12 students who leave before completion are those who have moved into further study focused on their vocational pathway or who have transitioned to full time employment, usually through personal contacts. Our students are generally focused on learning and keen to be involved in extra-curricular activities. The student body continues to be quite diverse, though still harmonious, with many cultural backgrounds represented.

Average class sizes
Table 2: Average class size information for each phase of schooling
Phase of schooling 2016 2017 2018
Note:
The class size targets for composite classes are informed by the relevant year level target. Where composite classes exist across cohorts (e.g. year 3/4) the class size targets would be the lower cohort target.
Prep – Year 3
Year 4 – Year 6
Year 7 – Year 10 22 23 22
Year 11 – Year 12 20 19 16
Curriculum delivery
Our approach to curriculum delivery
Our distinctive curriculum offerings
Orchestra class
Performance class
Sports Excellence
Certificate III in Health Services
Certificate III in Children’s Services
Certificate III in Sport & Recreation
Functional literacy
High Performance Sports Academy
Co-curricular activities
Chess Club
Leadership support program
Student Council
Dancing / Cheerleading
Glee Club
Creative Generations
Boys & Books
Handball and table tennis competitions
Digital design and technology club
How information and communication technologies are used to assist learning
Computers are used to assist learning across year levels and across the school. This was achieved through:
A well-resourced Information Services Building, which has an emphasis on learning technologies in its
facilities.
An extensive local area computer network links all buildings.
Introduction of appropriate software and programs to assist learning.
Staff gaining Professional Development in digital pedagogies especially around One Note, Web 2 and
Photoshop.
Embedding ICT in C2C core subjects.
3D printer for IDT to enhance the graphics curriculum.
Introduction of Stile to support the BYOD program
Coding classes

Social climate
Overview
Coombabah has a comprehensive pastoral care program that includes teacher led activities and guest speakers.
This program is woven into all aspects of school life to ensure not only the academic but the mental and social
needs of the student are met.
The air-conditioned Student Support Services houses the Guidance Counsellor, Industry Liaison Officer, School
Nurse, Youth Support Coordinator, Youth Worker and Chaplain are readily accessible to assist students and
parents. On-line support is also made available to students.
Coombabah is a ‘Positive Behaviour for Learning’ school and as such the program provides an excellent
framework encouraging students to make positive choices and accept the consequences of poor choices. Specific
behaviour teaching is planned and delivered along with a highly popular school recognition system, Posbee
Points. The school continues to refine its PBL Tier 1 strategies and is developing Tier 2 strategies to ensure that
the rights of students to learn and teachers to teach is upheld.
The Year Level Dean plays an integral role in the day-to-day support of students. They are usually the first point of
contact for parents who would like to discuss any aspects of school life. E-mail addresses and direct phone
numbers are provided for ease of communication. Year Level Dean regularly organise sessions of particular
relevance to their Year level, which often involves outside personnel. Issues such as bullying, misuse of social
media and safety at schoolies were addressed.
The Student Engagement team, made up of student support team and Year level Deans meet regularly to present a streamlined wellbeing focus for students, including vocational education, career information, agency support, mentoring and wellbeing programs.
Parent, student and staff satisfaction
Tables 3–5 show selected items from the Parent/Caregiver, Student and Staff School Opinion Surveys.
Table 3: Parent opinion survey
Percentage of parents/caregivers who agree# that: 2016 2017 2018
their child is getting a good education at school (S2016) 97% 92% 91%
this is a good school (S2035) 95% 90% 92%
their child likes being at this school* (S2001) 95% 93% 94%
their child feels safe at this school* (S2002) 94% 92% 88%
their child's learning needs are being met at this school* (S2003) 92% 89% 90%
their child is making good progress at this school* (S2004) 94% 92% 91%
teachers at this school expect their child to do his or her best* (S2005) 98% 97% 97%
teachers at this school provide their child with useful feedback about his or her school work* (S2006)
89% 88% 92%
teachers at this school motivate their child to learn* (S2007) 90% 92% 91%
teachers at this school treat students fairly* (S2008) 90% 90% 85%
they can talk to their child's teachers about their concerns* (S2009) 88% 93% 98%
this school works with them to support their child's learning* (S2010) 92% 88% 89%
this school takes parents' opinions seriously* (S2011) 87% 89% 84%

Percentage of parents/caregivers who agree# that: 2016 2017 2018
student behaviour is well managed at this school* (S2012) 85% 79% 78%
this school looks for ways to improve* (S2013) 93% 93% 92%
this school is well maintained* (S2014) 97% 91% 87%
* Nationally agreed student and parent/caregiver items.
# ‘Agree’ represents the percentage of respondents who Somewhat Agree, Agree or Strongly Agree with the statement.
DW = Data withheld to ensure confidentiality.
Table 4: Student opinion survey
Percentage of students who agree# that: 2016 2017 2018
they are getting a good education at school (S2048) 97% 93% 96%
they like being at their school* (S2036) 93% 89% 91%
they feel safe at their school* (S2037) 97% 91% 93%
their teachers motivate them to learn* (S2038) 95% 93% 95%
their teachers expect them to do their best* (S2039) 99% 96% 100%
their teachers provide them with useful feedback about their school work* (S2040)
93% 90% 97%
teachers treat students fairly at their school* (S2041) 83% 78% 87%
they can talk to their teachers about their concerns* (S2042) 86% 74% 86%
their school takes students' opinions seriously* (S2043) 89% 76% 87%
student behaviour is well managed at their school* (S2044) 78% 59% 76%
their school looks for ways to improve* (S2045) 96% 88% 98%
their school is well maintained* (S2046) 93% 82% 87%
their school gives them opportunities to do interesting things* (S2047) 91% 92% 94%
* Nationally agreed student and parent/caregiver items.
# ‘Agree’ represents the percentage of respondents who Somewhat Agree, Agree or Strongly Agree with the statement.
DW = Data withheld to ensure confidentiality.
Table 5: Staff opinion survey
Percentage of school staff who agree# that: 2016 2017 2018
they enjoy working at their school (S2069) 90% 84% 93%
they feel that their school is a safe place in which to work (S2070) 90% 84% 89%
they receive useful feedback about their work at their school (S2071) 82% 74% 84%
they feel confident embedding Aboriginal and Torres Strait Islander perspectives across the learning areas (S2114)
77% 85% 94%
students are encouraged to do their best at their school (S2072) 93% 88% 96%
students are treated fairly at their school (S2073) 93% 86% 94%
student behaviour is well managed at their school (S2074) 65% 48% 83%
staff are well supported at their school (S2075) 67% 70% 78%
their school takes staff opinions seriously (S2076) 63% 70% 75%
their school looks for ways to improve (S2077) 83% 83% 86%

Percentage of school staff who agree# that: 2016 2017 2018
their school is well maintained (S2078) 84% 71% 80%
their school gives them opportunities to do interesting things (S2079) 81% 80% 87%
* Nationally agreed student and parent/caregiver items.
# ‘Agree’ represents the percentage of respondents who Somewhat Agree, Agree or Strongly Agree with the statement.
DW = Data withheld to ensure confidentiality.
Parent and community engagement
Two formal Parent / Teacher / Student interview evenings (March/April & July).
Numerous Parent Information evenings that begin with Year 7 transition and information evenings and
progress through the year levels to include subject selection evenings, QCS Test and QCE evenings.
Opportunities to celebrate with the community i.e. school assemblies (one per week), awards evenings (both
academic and sporting), scholarship recipient evenings and two Honours parades a year.
International Program – opportunity for families to host students from Japan, Taiwan and Korea and be
involved in associated functions held at school.
The comprehensive nature of our pastoral care, behaviour management and attendance programs facilitates
communication with parents.
Our “Reward Scheme” provides both students and parents with positive feedback on their child’s involvement
in school life.
Sporting, cultural and extra-curricular activities provide opportunities for students to excel.
Year 12 students receive written feedback regarding performance in QCS practice sessions.
Student performances including sport, music, dance and art occur throughout the year and provide numerous
opportunities for parents to be involved in their child’s education.
The Coombabah Parents & Citizens Association exists and functions for parents within the school community.
The Quality Partnership Week, held in June when Year 7 students have the opportunity with their parents to
attend the school and try out for the various specialist programs i.e. rugby league, orchestra, Academic
Excellence and Sports and Exercise Science.
ID Attend included an SMS system to alert parents of student absence and any urgent information.
Respectful relationships education programs
The school has developed and implemented a program/or programs that focus on appropriate, respectful, equitable and healthy relationships.

School disciplinary absences
Table 6: Count of incidents for students recommended for school disciplinary absences at this school
Type of school disciplinary absence
2016 2017 2018
Note:
School disciplinary absences (SDAs) are absences enforced by a school for student conduct that is prejudicial to the good order and management of the school.
Short suspensions – 1 to 10 days 248 359 293
Long suspensions – 11 to 20 days 17 10 15
Exclusions 16 23 10
Cancellations of enrolment 0 1 1
Environmental footprint
Reducing this school’s environmental footprint
Data is sourced from school's annual utilities return and is reliant on the accuracy of these returns.
Coombabah SHS has always had a focus on Environmental Education. Environmental footprint reduction activities
included solar power, irrigation from local water supply, energy efficient lighting, waterless toilets and water tanks
to supply toilets.
Staff are also regularly reminded about the importance of reducing electricity usage by turning off lights, air
conditioning systems etc. when not required.
Table 7: Environmental footprint indicators for this school
Utility category 2015–2016 2016–2017 2017–2018
Note:
Consumption data is compiled from sources including ERM, Ergon reports and utilities data entered into OneSchool* by schools. The data provides an indication of the consumption trend in each of the utility categories which impact on this school’s environmental footprint.
*OneSchool is the department's comprehensive software suite that schools use to run safe, secure, sustainable and consistent reporting and administrative processes.
Electricity (kWh) 445,285 464,828 454,730
Water (kL) 2,300 1,952 487
School funding
School income broken down by funding source
School income, reported by financial year accounting cycle using standardized national methodologies and broken down by funding source is available via the My School website at.
How to access our income details
1. Click on the My School link http://www.myschool.edu.au/.
2. Enter the school name or suburb of the school you wish to search.

3. Click on ‘View School Profile’ of the appropriate school to access the school’s profile.
4. Click on ‘Finances’ and select the appropriate year to view the school financial information.
Note:
If you are unable to access the internet, please contact the school for a hard copy of the school’s financial information.
Our staff profile
Workforce composition
Staff composition, including Indigenous staff
Table 8: Workforce composition for this school
Description Teaching staff* Non-teaching staff Indigenous** staff
Headcounts 92 39 <5
Full-time equivalents 89 31 <5
*Teaching staff includes School Leaders.
** Indigenous refers to Aboriginal and Torres Strait Islander people of Australia.
Qualification of all teachers
Table 9: Teacher qualifications for classroom teachers and school leaders at this school
Highest level of qualification Number of qualifications
*Graduate Diploma etc. includes Graduate Diploma, Bachelor Honours Degree, and Graduate Certificate.
Doctorate 0
Masters 4
Graduate Diploma etc.* 32
Bachelor degree 31
Diploma 27
Certificate 0

Professional development
Expenditure on and teacher participation in professional development
The total funds expended on teacher professional development in 2018 were $58 334.69
The major professional development initiatives are as follows:
Mentoring
Peer learning
Computer programs
Subject conferences
The proportion of the teaching staff involved in professional development activities during 2018 was 100%.
Staff attendance and retention
Staff attendance
Table 10: Average staff attendance for this school as percentages
Description 2016 2017 2018
Staff attendance for permanent and temporary staff and school leaders. 96% 95% 95%
Proportion of staff retained from the previous school year
From the end of the previous school year, 97% of staff were retained by the school for the entire 2018.
Performance of our students
Key student outcomes
Student attendance
The overall student attendance rate in 2018 for all Queensland state Secondary schools was 89%.
Tables 11–12 show attendance rates at this school as percentages.
Table 11: Overall student attendance at this school
Description 2016 2017 2018
Overall attendance rate* for students at this school 89% 89% 89%
Attendance rate for Indigenous** students at this school 85% 86% 86%
* Student attendance rate = the total of full-days and part-days that students attended divided by the total of all possible days for students to attend (expressed as a percentage).
** Indigenous refers to Aboriginal and Torres Strait Islander people of Australia.

Table 12: Average student attendance rates for each year level at this school
Year level 2016 2017 2018
Notes:
1. Attendance rates effectively count attendance for every student for every day of attendance in Semester 1.
2. Student attendance rate = the total of full-days and part-days that students attended divided by the total of all possible days for students to attend (expressed as a percentage).
3. DW = Data withheld to ensure confidentiality.
Year 7 91% 93% 91%
Year 8 88% 89% 89%
Year 9 86% 87% 86%
Year 10 86% 85% 86%
Year 11 91% 90% 91%
Year 12 92% 90% 92%
Student attendance distribution
Graph 1: Proportion of students by attendance rate
Description of how this school manages non-attendance
Queensland state schools manage non-attendance in line with the Queensland Department of Education procedures: Managing Student Absences and Enforcing Enrolment and Attendance at State Schools; and Roll Marking in State Schools, which outline processes for managing and recording student attendance and absenteeism.
How is Student Absence Managed?
Official rolls are marked at 9.00am each day
AO2 (Roll Officer) Collates data on student absenteeism on a daily basis
An SMS message is sent to each parent of a student with unexplained absence
Students identified as Fractional Truant (not in class & not on absence list) are collated by Behaviour
Management staff and class teachers follow up
How are Parents informed?
Letters are emailed home weekly for multiple unexplained absences.
Deputy Principal sights the letter and phones parents in cases of high concern.
End of semester report has days absent recorded on it.
List of students where the Roll Officer phones the parents automatically if the student is away.
Fractional truants are put on an attendance card that is signed by parents each night.
The Absentee Officer contacts parents of students identified by teachers through an attendance query.
23
23
23
12
16
15
24
26
27
40
34
35
0% 20% 40% 60% 80% 100%
2018
2017
2016
Proportion of Students
Attendance Rate: 0% to <85% 85% to <90% 90% to <95% 95% to 100%
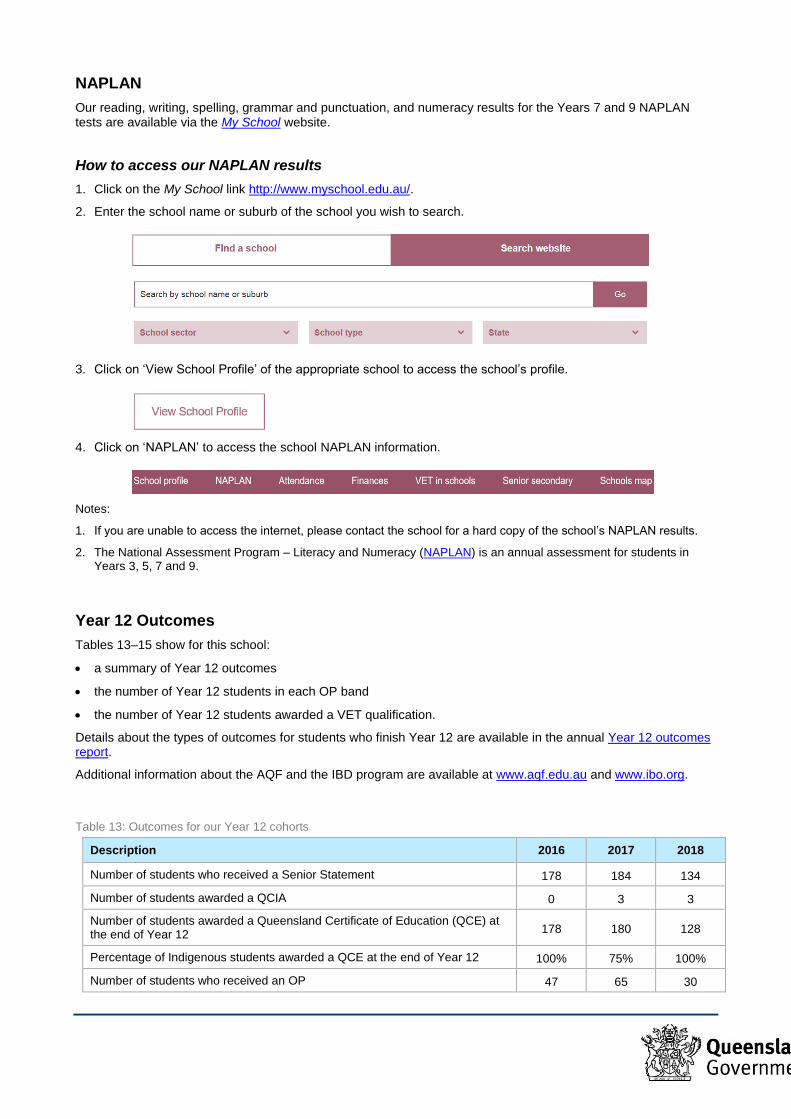
NAPLAN Our reading, writing, spelling, grammar and punctuation, and numeracy results for the Years 7 and 9 NAPLAN tests are available via the My School website.
How to access our NAPLAN results
1. Click on the My School link http://www.myschool.edu.au/.
2. Enter the school name or suburb of the school you wish to search.
3. Click on ‘View School Profile’ of the appropriate school to access the school’s profile.
4. Click on ‘NAPLAN’ to access the school NAPLAN information.
Notes:
1. If you are unable to access the internet, please contact the school for a hard copy of the school’s NAPLAN results.
2. The National Assessment Program – Literacy and Numeracy (NAPLAN) is an annual assessment for students in Years 3, 5, 7 and 9.
Year 12 Outcomes
Tables 13–15 show for this school:
a summary of Year 12 outcomes
the number of Year 12 students in each OP band
the number of Year 12 students awarded a VET qualification.
Details about the types of outcomes for students who finish Year 12 are available in the annual Year 12 outcomes report.
Additional information about the AQF and the IBD program are available at www.aqf.edu.au and www.ibo.org.
Table 13: Outcomes for our Year 12 cohorts
Description 2016 2017 2018
Number of students who received a Senior Statement 178 184 134
Number of students awarded a QCIA 0 3 3
Number of students awarded a Queensland Certificate of Education (QCE) at the end of Year 12 178 180 128
Percentage of Indigenous students awarded a QCE at the end of Year 12 100% 75% 100%
Number of students who received an OP 47 65 30

Description 2016 2017 2018
Percentage of Indigenous students who received an OP 17% 25% 20%
Number of students awarded one or more VET qualifications (including SAT) 131 139 112
Number of students awarded a VET Certificate II or above 113 107 83
Number of students who were completing/continuing a SAT 34 27 23
Number of students awarded an IBD 0 0 0
Percentage of OP/IBD eligible students with OP 1-15 or an IBD 81% 55% 97%
Percentage of Year 12 students who were completing or completed a SAT or were awarded one or more of the following: QCE, IBD, VET qualification 100% 99% 98%
Percentage of QTAC applicants who received a tertiary offer. 96% 96% 94%
Notes:
• The values above:
− are as at 11 February 2019
− exclude VISA students (students who are not Australian citizens or permanent residents of Australia).
• Indigenous refers to Aboriginal and Torres Strait Islander people of Australia.
Table 14: Overall Position (OP)
OP band 2016 2017 2018
Note:
The values in table 14:
• are as at 11 February 2019
• exclude VISA students (students who are not Australian citizens or permanent residents of Australia).
1-5 5 6 1
6-10 10 12 10
11-15 23 18 18
16-20 9 28 1
21-25 0 1 0
Table 15: Vocational Education and Training (VET)
VET qualification 2016 2017 2018
Note:
The values in table 15:
• are as at 11 February 2019
• exclude VISA students (students who are not Australian citizens or permanent residents of Australia).
Certificate I 67 69 66
Certificate II 96 81 75
Certificate III or above 51 54 37

Apparent retention rate – Year 10 to Year 12
Table 16: Apparent retention rates for Year 10 to Year 12 for this school
Description 2016 2017 2018
Year 12 student enrolment as a percentage of the Year 10 student cohort 77% 87% 75%
Year 12 Indigenous student enrolment as a percentage of the Year 10 Indigenous student cohort 88% 120% 56%
Notes:
1. The apparent retention rate for Year 10 to Year 12 = the number of full time students in Year 12 expressed as the percentage of those students who were in Year 10 two years previously (this may be greater than 100%).
2. Indigenous refers to Aboriginal and Torres Strait Islander people of Australia.
Student destinations
The Queensland Department of Education conducts annual surveys that capture information about the journey of early school leavers and Year 12 leavers from school to further study and employment.
Early school leavers
The destinations of young people who left this school in Year 10, 11 or before completing Year 12 are described below.
This school works closely with a range of external agencies to support students who left school early. Our Principal, Deputy Principal, Regional Transitions Officer or Guidance Officer liaises with early school leavers and their parents, providing a service ‘beyond the school gate’ to assist early leavers make a successful transition to other educational pursuits or employment.
Next Step – Post-school destinations
The results of the 2019 Next Step post-school destinations survey, Next Step – Post-School Destinations report (information about students who completed Year 12 in 2018), will be uploaded to this school’s website in September 2019.
To maintain privacy and confidentiality of individuals, schools with fewer than five responses will not have a report available.
This school’s report will be available at http://www.coombabashs.eq.edu.au/Supportandresources/Formsanddocuments/Pages/Documents.aspx