Embed Size (px)
Citation preview
NORSK POLARINSTITUTT SKRIFTER NR. 128
OVE WILSON
COOLING EFFECT
OF AN ANTARCTIC CLIMATE
ON MAN
WITH SOME OBSERVATIONS ON THE OCCURRENCE OF FROSTBITE
NORS K PO LARI N STITUTT OSLO 1963
DET KONGELIGE DEPARTEMENT FOR INDUSTRI OG HÅNDVERK
NORSK POLARINSTITUTT Observatoriegt. 1, Oslo, Norway
Short account of the publications of Norsk Polarinstitutt The two series, Norsk Polarinstitutt - SKRIFTER and Norsk Polarinstitutt -
MEDDELELSER, were taken over from the institution Norges Svalbard- og Ishavs
undersøkelser (NSIU), which was incorporated in Norsk Polarinstitutt when this was
founded in 1 948. A third series, Norsk Polarinstitutt - ARB OK, is published with
one volume per year. SKRIFTER inc1udes scientific papers, published in English, French or German.
MEDDELELSER comprises shorter papers, of ten being reprints from other publi
cations. They generally have a more popular form and are mostly published in
Norwegian. SKRIFTER has previously been published under various titles:
Nos. 1-11. Resultater av De norske statsunderstøttede Spitsbergen-ekspeditioner.
No. 12. Skrifter om Svalbard og Nordishavet.
Nos. 1 3-81 . Skrifter om Svalbard og Ishavet. 82-89. Norges Svalbard- og Ishavs-undersøkelser. Skrifter.
• 90- . Norsk Polarinstitutt Skrifter. In addition a special series is published: NORWEGIAN-BRITISH-SWEDISH
ANTARCTIC EXPEDITION, 1 949-52. SCIENTIFIC RESULTS. This series will
comprise six volumes, three of which are now completed. Hydrographic and topographic surveys make an important part of the work carried
out by Norsk Polarinstitutt. A list of the published charts and maps is printed on p. 3 and 4 of this cover.
A complete list of publications, charts and maps is obtainable on request.
Arbok 1960. 1962. Kr. 15.00.
Arbok 1961. 1962. Kr. 24.00.
ÅRBØKER
NORSK POLARINSTITUTT SKRIFTER NR. 128
OVE WILSON
COOLING EFFECT
OF AN ANTARCTIC CLIMATE
ON MAN
WITH SOME OBSERVATIONS ON THE OCCURRENCE OF FROSTBITE
NORSK POLARINSTITUTT
OSLO 1963

Received for publication February, 1862
Printed November 1963
PUBLISHED BY NORSK POLARINSTITUTT
DISTRI B UTE D BY UNIVERS ITETS FO RLAG ET
OSLO 1963
Contents
Abstract . . . . . . . . . . . . . . . . . . . . . . . . . . . . . . . . . . . . . . . . . . . . . . . . . . . . . . . . . . . .
Illtroduction ... . . . . ............ . . . ..... . . .... .. ............ . . .. . . . . .
General description of cl imate
Heat exchange and wind chill
Materials and methods . . . . . . . .. . . . . . . .... .. . . ... . . . . . .... .. . . . .. . . . . . .
Data and results
Temperature . .. .. .. . . . . . ........ ............ .... . ..... . . . . . ... . .
Wind speed ... . . . . .. .... ........... . . .... . ......... . ........ .... .
Radiation .. . . . .. . .... ..... ...... .. .... ... . . . . . .. .... .... .. . . . . . . .
Wind chill at Maudheim ....... . . . . ... . . . .... . . . . ...... . .. .. .. . . ... .
Calculation of mean wind chill index . . . . .. . . . . . . . . . . . . . . . . . . . . . .. . . .
Wind chill during sledging journeys ........ . .... . . . . . .. . . . . . . . . .. . .
Mean wind chill indices for other antalctic stations .. . ... . . . . . . .. . . . . . .
Discussion ... . .. . .. . . . . . . . . . . .. .. . . . . . . . ... .. . . ... . . . . . . . . . . . . . . .. . .
Use of mean values for \Vind chill . . ....... . . . . .. ... .......... . . . ... . .
Relative level of mean wind chill at :\Iaudheim ...... ...... .... .
Con tri bu ti on of solar radiation . . . .. ....... ...... ...... ...... .. ... .. .
Wind chill conditions during sledging ......... . ....... ... . ........ .. .
Frostbites
Selection of cases . . . . . . . . . .. . . . . . .. . .. . . .. .... . ..... ... . . . . . . . . . .
Wind chill and frostbite . . . . . . . . . . . . . . . . . . . . . . . . . . . . . . . . . . . . . . . .
Rate of occurrence . . . . . . . .. . . ......... ... . . .. . .... ..... . . ..... . . . .
Summary . . . ... . . . . . . . . . . . . . . . . . . . ............... . .. ...... . . . . . . . . . . .
Acknowledgements . . . . . .... . .
Referenees . . . . . . . . . . . . . . . . . . . . . . . . . . . . . .
Page 5 5 5 7
10 12 12 12 14 14 15 17 19 19 19 21 23 24 26 26 27 27 29 30
3 1

Abstract The antaretie c1imate at :r-.Iaudheim is studied in terms of atmospheric cooling, using tempera
ture, wind speed, radiation, and wind chill index. Weekly mean values for these factors ale pre
sented graphically, giving a synopsis of the c1imate . Weekly mean changes in temperature and
wind chill are also given for the field parties traveIling inland, and the deviations are discussed.
Wind chill frequencies at different intervals of temperature have been calculated for Maudheim,
as well as cumulative frequencies for each month. Differences in the mode of calculating mean
wind chill are discussed. The mean wind chill index at Maudheim and at various other stations all
over the antarctic continent are compared. Incidents of frostbite at Maudheim are studied in
relation to temperature, wind speed and wind chill index, and the rate of occurrence in different
seasons and at different temperatures is also discussed .
Introduetion
As medical officer to the �orwegian-British-Swedish Antarctic Expedition (NBSX), 1949-52, I spent two years of alternating life at the base station Maudheim (71 °03' S, 10° 56' W) and on sledging journeys into the interior of Dronning Maud Land. Besides having my share of the daily duties at the base, I conducted physiological investigations and took part in other research work continuously going on. This included participation in climatological measurements of various types. Through these investigations my interest was focused on the special problems of cooling effect on man, which are an important medical and hygienic problem. The climate of Antarctica provides meteorological conditions which must be regarded as a severe environmental stress to man and his heat regulation. It is, hO\vever, difficult to evaluate and measure the degree of the climatic stress to which man is exposed during a sojourn in the Antarctic. It cannot simply be expressed by a temperature curve or by giving mean values of meteorological data. The atmospheric cooling power at low temperatures is greatly increased by air movement. There is als o the heat gain from solar radiation.
In this paper an attempt will be made to describe the antarctic climate in terms of atmospheric cooling as experienced at Maudheim and on sledging trips into the interior of the continent. The atmospheric cooling effect will also be correlated to incidents of frostbite as evidence of cold exposure.
General description of climate
For an account of the general aspects of antarctic weather, reference is made to RUBIN (1 962),
and to "Science in Antaretica" (WEXLER and RUBIN, 1 961 ) , which gives many important references
on antaretie meteorology. The folloY;ing description of the c1imate is mainly condensed from these
reports. The antarctic climate is determined by the proximity to the pole, with yearly alternating
-6-
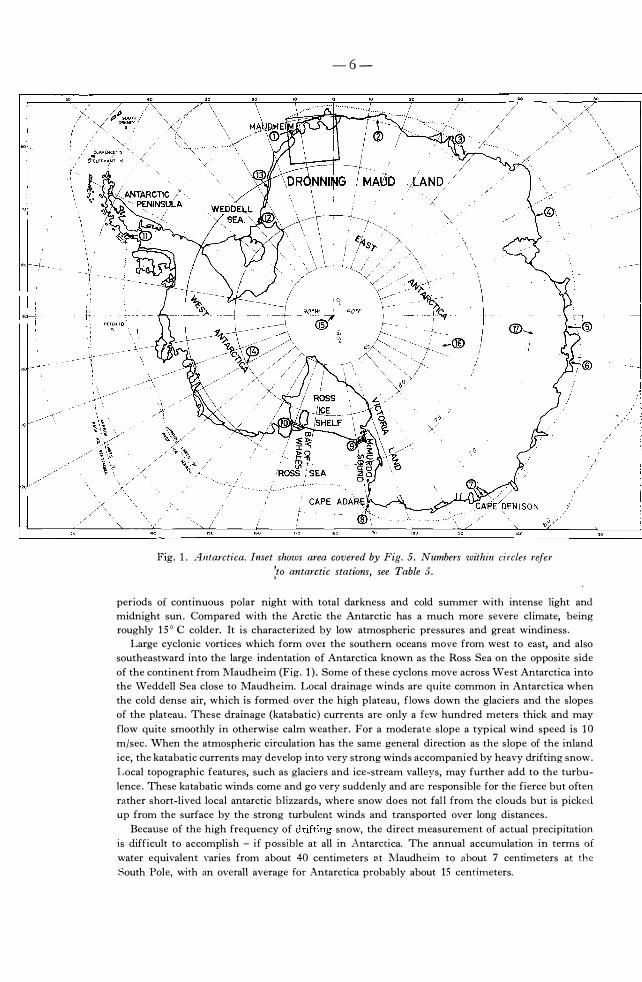
Fig. 1. Antarctica. lmet shows area covered by Fig. 5. Numbers within circles reIer :to antaretie stations, see Table 5.
periods of continuous polar night with total darkness and cold summer with intense light and
midnight sun. Compared with the Arctic the Antarctic has a much more severe dimate, being
roughly 1 5 ° C colder. It is characterized by low atmospheric pressures and great windiness.
Large cydonic vortices which form ovel the southern oceans move from west to east, and also
southeastward into the large indentation of Antarctica known as the Ross Sea on the opposite side
of the continent from lVIaudheim (Fig. 1 ) . Some of these cydons move across "Vest Antarctica into
the Weddell Sea dose to Maudheim. Local drainage winds are quite common in Antarctica when
the cold dense air, which is formed over the high plateau, flows down the glaeiers and the slopes
of the plateau. These drainage (katabatic) currents are only a few hund red meters thick and may
flow quite smoothly in otherwise calm weather. For a moderate slope a typical wind speed is 10 m/sec. When the atmospherie circulation has the same general direction as the slope of the inland
ice, the katabatic currents may develop into very strong winds accompanied by heavy drifting snow.
Local topographic features, such as glaeiers and ice-stream valleys, may further add to the turbu
lence. These katabatic winds come and go very suddenly and arc responsible for the fierce but of ten
rather short-lived local antarctic blizzards, where snow do es not fal l from the clouds but is picked
up from the surface by the st rong turbulent winds and transported over long distances.
Because of the high frequency of drifting snow, the direct measurement of actual precipitation
is difficult to accomplish - if possible at all in Antaretica. The annual accumulation in terms of water equivalent varies from about 40 centimeters s.t lVIaudheim to about 7 centimeters at the South Pole, with an overall average for Antaretiea prohably about 15 centimeters.
-7-
In general the mean temperature of the year follows the expected decrease with increased latitude
and altitude from an average value around -15 ° C at the coast. The difference between the
\Varmest and coldest months of the year is quite large, ranging from more than 30° C on the plateau
to about 20° C at the coast. The drop in temperature in autumn is largely completed by the time
the sun has set for the winter and is followed by a much slower decline in the dark months, giving
rise to a characteristic flat tempe ra ture curve throughout the winter months at many stations,
coastal and interior. During pal t of the winter night, the mean temperature may even increase.
_\Iso, extremely large year-to-year changes in temperature are observed.
The physical property which gives Antarctica its distinctive climate is radiation. During the
sunlit period, the extremely clear air and the low water vapour content (due to the low temperature)
permits irradiation of the Antarctic continent by intense solar radiation. While snow-free ground
",ill absorb most of the incoming solar radiation, a snow-field will keep only a minor part. Since
more than 95 per cent of Antarctica is covered by a brilliantly white snow surface reflecting 80 to
90 per cent of the total incoming solar radiation, only a min or part of this strong insolation is
retained in the surface layers of the snow. Besides, snow is a black-body radiator at temperatures
below 0° C and it is a very poor conductor of heat . These properties of snow tend to increase the
severity of the polar climate. During the brief summer season (mid-�ovember to the end of January)
the radiation balance at the surface (absorbed solar radiation minus outgoing net long-waye radia
tion) is generally positive, but for the rest of the year it is negative. This means that the sur face
loses radiation energy, except in the height of summer. When the radiation balance is negative,
the temperature will drop until a balanee is about reached between the radiation loss and the energy
in come to the surface. This takes part in the form of turbulent transfer of heat from the air and
heat conduction from the snow. Such a balanee is generally developed in the winter in fine weather
situations, characterized by marked surface inversions, i. e. a pronounced increase in temperature
with height in the surface air layers, of ten some 20° C from the surface to the 10 meter layer
(LILJEQUIST, 1 957 b) . Thus the snow is protected from heavy energy losses by the development of
a coating of cold air (an inversion), which makes the radiation losses small and which bes id es sets
up a turbulent flux of heat from the air to the surface. Such an inversion may persist even with
winds as high as 8 m/sec at the 10 meter level, which mainly is due to the very flat snow surface
(causing comparatively weak turbulence). Vv'ith wind speeds higher than 8-9 m/sec the inversions
are generally destroyed, letting the warmer air above the inversion reach the surface. A sudden in
crease in wind may therefore be accompanied by a sudden rise in temperature, amounting to
10-20° C in the winter. A clouding-over is aiso usually followed by a marked rise in temperature,
sometimes amounting to 1 0-20° C. This is explained by the fact that the base of low or midd le
clouds is generally warmer than the snow surface (owing to the surface inversion) . As the clouds
in general are black-body radiators, the net long-wave radiation to the snow will be incoming and
the surface temperature will rise and also the temperature of the air near the surface (LILJEQLIST,
1956 b, 1 958).
Heat exchange and wind chill In a cold climate the environmental stress consists of a combination of air
temperature, wind, and radiation, which determine the relative comfort sensation and may cause injury, such as frostbite, snow-blindness, damage to the skin, etc. The main factor concerned with relative discomfort and health hazard is heat loss. The mechanisms governing heat loss are described in detail by BURTO� and EDHOLM (1955). In evaluating the cooling effect of the atmospherie conditions on the human body, one has to take into consideration the various ways in which the body exchanges heat with the atmosphere. These include convective exchange \vith the air, radiative exchange with objects and the sky, conductive exchange to the ground or other objects in contact, evaporation from the skin and from the respiration tract, warming and humidifying inspired air. Of these avenues of heat loss the convective is the most important and accounts for the major portion.
-8-
Important is a1so the heat loss through the 1ungs. Investigations (WEBB, 1955; BREBBIA, GOLDMAN and BUSKlRK, 1957) indicate that at 10w environmental temperatures, in absence of sweating, the total heat loss from respiration will be a relatively constant fraction of the heat loss from the body, when in therma1 balance, and may amount to about 1 7 %. During increased physica1 activity body heat production rises, perspiration begins, and the excess heat is removed by vaporization. One can assurne that this avenue of heat loss is adequately controlled by the body and that the heat removed by evaporation does not exceed the additional heat produced by the muscu1ar activity. However, condensation of perspiration in the clothes may lessen the insulation of the clothing and thus increase heat loss by convection. Conductive heat loss is a1so augmented in this way. But with adequate and appropriate polar c10thing and suitable footgear, used with the experience one acquires in a polar c1imate, the conductive exchange is reduced to a
minimum. An exception is when working with bare hands touch ing cold meta1, in which case frostbite often occurs. At low temperatures (-----40° C) and almost no air movement the radiative heat loss amounts to 20-30 �/6 of the dry heat transfer, but with increasing air movement assurnes a proportionally decreasing fraction and at 2 m/sec accounts for only 8 % (BURTON and EDHOLM, 1955). Thus the main factor concerned with uncomfortable or de1eterious heat loss is convective coaling.
Various formulas to express the dry convective cooling power of the atmosphere have been proposed. They have been extensively reviewed by STONE (1943), who cautions against extrapolation of formulas very far beyond the laboratory or experimental ranges over which they were originally evaluated. There are very few formulas based on actual observations in an extremely cold c1imate as in the Antarctic (BODMAN, 1908; SIPLE and PASSEL, 1945; SAP IN-JALOUSTRE, 1955; VINJE, 1962). Of these the formula of SIPLE and PASSEL (1945) is the only one that has more c10sely correlated atmospheric cooling to stages of relative human comfort sensations under very cold c1imatic conditions and established approximate limits for the onset of freezing of human flesh. VINJE (1962) has als o calculated the cooling power at which human skin freezes in the Antarctic, but for his measurements he has used the kata thermometer) and STONE (1943) points out that human body-cooling computed from kata thermometer readings considerably exceeds the actual (directly measured) human heat loss. Because of the small size of the kata thermometer, air currents exert a greater cooling effect on it than on the human body. Therefore in physiology the kata thermometer is nowadays used almost exc1usively as an anernometer (BEDFORD, 1948). The formula of SIPLE and PASSEL was developed from experiments conducted at Little America, Antarctica, at temperatures down to -56° C. This ''vvind chill" formula, given below, was calculated from observations of the cooling rate and freezing of water sealed in a plastic cylinder, and related to + 33° C (neutral skin temperature).
H = Heat loss (wind chill) in kcal/m2/hr 1 0 .45 - v) (33 - t) v = Wind speed in m/sec
t - Air temperature in o C
The wind chill formula is calculated to measure the cooling power of wind and
-9-
temperature on shaded, dry human skin, without regard to evaporation. The resulting heat loss is expressed in kilogram calories per square meter of exposed (nude) skin surface per hour. The term wind chill is applied to a scale of heat loss (Table 1 ) extending from an index of 50 (hot) to 2500 (intolerably cold). The formula has been further discussed by severai authors (COURT, 1 948; BURTON and EDHOLM, 1955; MOL:�AR, 1 960) . It has been criticized for its lack of theoretical basis, because it is not feasible to express the effect of wind on heat loss without references to the amount of clothing that is being wom. The same wind speed will increase the heat loss of a lightly clad man very greatly, but increases only slightly the heat loss of a heavily clothed man. The dominant factor in determining heat loss should be the insulation of clothing wom. However, the calculation of insulation provided by polar clothing presents a major problem, as the insulation is different for various clothing assemblies and changes markedly under windy conditions. Experiments (BRECKENRIDGE and \VOODCOCK, 1 950) with cold-weather clothing have shown that in the wind there is a reduction in insulation, which is
Wi�d Chill ! mdex
600
800 1000 1200 1+00
2000
2300
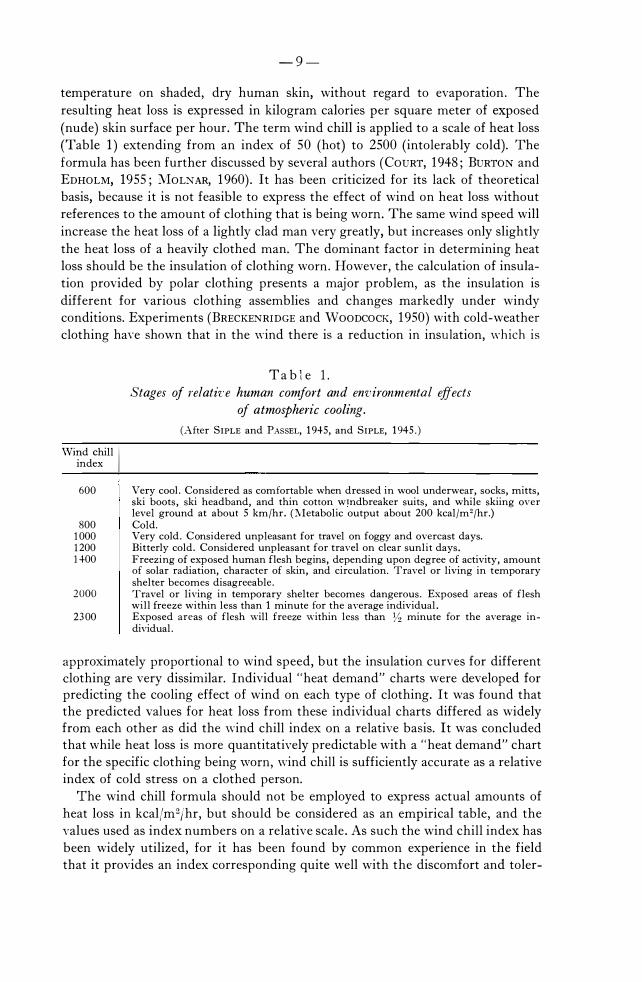
Ta ble L Stages of relathe human comfort and em,ironmental effects
of atmospherie cooling.
(After SIPLE and PASSEL, 1 945, and SIPLE, 1 945.)
Very cool. Considered as comfortable when dressed in wool underwear, socks, mitts, ski boots, ski headband, and thin cotton wlndbreaker suits, and while skiing over leve! ground at about 5 km/hr. (�Ietabolic output about 200 kcal/m2/hr.) Cold. Very cold. Considered unpleasant for travel on foggy and overeast days. Bitterly cold. Considered unpleasant for travel on dear sunlit days. Freezing of exposed human flesh begins, depending upon degree of activity, amount of solar radiation, character of skin, and circulation. Travel or living in temporary shelter becomes disagreeable. Travel or living in temporary shelter becomes dangerous . Exposed areas of flesh will freeze within less than 1 minute for the average individual. Exposed an'as of flesh will freeze within less than % minute for the average individual.
approximately proportional to wind speed, but the insulation curves for different clothing are very dissimilar. Individual "heat demand" charts were developed for predicting the cooling effect of wind on each type of clothing. It was found that the predicted values for heat loss from these individual charts differed as widely from each other as did the wind chill index on a relative basis. It was concluded that while heat loss is more quantitatively predictable with a "heat demand" chart for the specific clothing being wom, \Vind chill is sufficiently accurate as a relative index of cold stress on a clothed person.
The wind chill formula should not be employed to express actual amounts of heat loss in kcal/m2/hr, but should be considered as an empirical table, and the values used as index numbers on a relative scale. As such the wind chill index has been widely utilized, for it has been found by common experience in the field that it provides an index corresponding quite well with the discomfort and toler-
- 10 -
ance of man in the cold. This is because the tolerance will be determined by the parts of the body which are usually unprotected, such as the face and hands. The wind chill then applies to the naked face or the bare hands, where the pathological effect of cooling first will appear. U sually only general mention has been made of the occurrence of frostbite in relation to wind chill (MOLNAR, 1960). Except for sume experiments made at Little America III (SIPLE and PASSEL, 1945) to determine the time required for the freezing of normal flesh exposed to cold wind, no work has been published on the correlation of simultaneous observations of wind chill and actual cases of frostbite. Rowever, there is an extensive study of the epidemiology of cold injury in Korea (SCHU!VlAN, 1954), where the relationship between daily incidence of co Id injury and daily average wind chill has been considered. In this investigation were induded all types of frostbite, primarily of the feet with considerably less cases of hand frostbite and only few of the face. The incidence was correlated to the daily average wind chill for the entire day and for the entire U.S . Front in Korea. It must be pointed out that in Korea in the winter the temperature range each day is enormous and temperature swings from - 30° C to zero. Thus an ave rage wind chill index cannot possibly be representative of the coldest conditions of the day, when the cold injuries no
doubt occurred. Actually there was a somewhat doser relationship between the incidence of cold injury and daily minimum temperature. This is quite natural considering the fact that the recorded cases of frostbite were mainly cold injuries of dothed parts of the body and not of exposed skin.
Materials and methods
Data and meteorological studies of the dimatic conditions at lVIaudheim have been published by the NBSX (SCHUMACHER, 1952; RISDAL, AMBLE and SCHU:vIACHER, 1956; RISDAL, 1958, 1960; LILJEQUIST, 1954, 1956 a, b, 1957 a, b, 1958), and the methods used by the expedition have been described in detail in these papers. All instruments were carefully calibrated and continuously checked, and
all necessary corrections have been applied. The wind speed (LILJEQUIST, 1957 a) was measured continuously with an anemometer at a standard level of 1 0 meters above the surface and als o at five different intermediate leveis. The mean wind speed was determined for houdy intervals half an hour before and after each even hour. The temperature (RISDAL, 1960) was measured with mercury-thallium thermometers and thermographs, as well as with platinum thermometers at five different levels up to 10 meters (LILJEQUIST, 1957 b). During the summer halfyear the temperature measurements were strongly influenced by the intense solar radiation. On calm, sunny days, especially with a thin doud cover, radiation \vithin the screen could cause an error of as much as three to five degrees centigrade, i.e. the screen-recording would be that much higher than the true air temperature. Therefore readings had to be made up on a ventilated Assmann psychrometer to supplement the ordinary weather observations. The readings on the unventilated maximum thermometer in the screen could not be corrected for radiation error as could the temperature observations at fixed hours. It is very likely that the estimated correction of this error is frequently too small (RISDAL, 1960).
-11-
The highest temperature ev er read on a ventilated thermometer was a few tenths above 0° C, while values up to + 4°, 2 C were observed upon the unventilated
thermometer in the screen. For measurements of the duration of sunshine a Campbell-Stokes sunshine recorder of a special design for high latitudes was used (LIL]EQUIST, 1956 a).
For the present study additional data have been compiled from the original Maudheim records and from the log-books of the sledging parties. To be able to use means for shortest possible time intervals in the climatic analysis at hand and for the computation of mean and individual wind chill values, it has been necessary for the aut hor to go back to the original primary observations and to recalculate the data to fit the requirements of the present investigation. This has required a complete going through of all the meteorological log-books of the base and of the various sledging parties for the whole two-year period. Individual daily values have been used in determining the weather conditions for each recorded case of frostbite, which \Vork has been greatly facilitated by the detailed personal diaries kept by the author during the complete expedition period. Together with the medical records these notes have provided means for tracing individual activity and pinpointing the time of occurrence of frost bite and conditions associated with it.
The weekly arithmetical means for temperature, wind speed, and duration of sunshine have been calculated by the author for alternating periods of 8 and 7 days to make four "weeks" a full month. The daily temperature means are from measurements every third hour from 06 .00 to 24.00 hours, including maximum and minimum values. The temperature data are representative of the layer 1 . 5-2 .0 meters above the surface. The \Vind speed values have been recalculated for a layer 1 -1 . 5 meter above snow level, \vhere the speed is only 80 % of that at the standard 10 meter level (LILJEQUIST, 1 957 a). The daily means for wind speed are from hourly means, computed from continuous recordings. The maximum and minimum hourly wind speed values, on the other hand, are only for the time period 08.00 to 22.00 hours. It contrast to minimum temperature which alone never limited outdoor activity, the maximum wind speed of ten was a deterrent factor, restricting outdoor activity during working hours to the least possible and abolishing it at night - except for the meteorologists. Accordingly, during night hours exposure to maximum wind speed values almost never occurred, which is the reason why they have not been included.
For the sledging journeys the meteorological data have been taken from the Yarious log-books. Repeated daily observations \Vere made during all of these trips. The mean number of daily observations on each trip varied from 3 to 5. Mostly 5 observations were made, and on one journey 6 or more daily observations \Vere made during half of the time. The temperature was measured by sling-thermometers, calibrated and checked by the meteorologists at the base. Wind speed was estimated by experience. The constant necessity of having to evaluate weather conditions accurately led to a considerable personal skill in correctly judging wind speed, especially by expedition members in the field. Estimated values usually agreed well with measured \vind speeds and were never much in error. An estimated wind speed may be regarded at least as accurate as a solitary observation obtained with instrument, compared with hourly mean \'alues.
-12-
Wind chill values have been calculated from daily observations of temperature and wind at 09.00 and 15.00 hours at the base Maudheim, according to the tables of SIPLE and PASSEL ( 1 945) . These twa term-hours have been chosen, rather than the ane at 12.00, because the first will be representative of morning exposure and the second of afternoon conditions, and will thus indicate changes during the day. For the field parties wind chill has been computed as far as possible from meteorological observations made from camp to camp, which covers the time of exposure from breaking camp, on the trail, to erecting camp, whether travelling by day or night. For each day the simultaneaus observation of temperature and wind which gave the highest wind chill index has been chosen. This implies that the daily values us ed for weekly mean wind chill are representative of the coldest conditions during sledging, which do es not necessarily mean the very coldest encountered during each day, as wind chill values can be estimated only for the moments when weather observations were made. Cooling figures for sledging must therefore be regarded as only approximate.
1Vlonthly mean wind chill indices have been computed also for 1 5 other antarctic stations from recent meteorological data. Monthly mean values for standard measurements of temperature and wind have been used (supplied by T. VINJE, Norsk Polarinstitutt, Oslo) . In addition mean wind chill values for 7 antarctic stations occupied prior to 1 941 have been taken from SIPLE and PASSEL ( 1 945) .
Data and results
Temperature
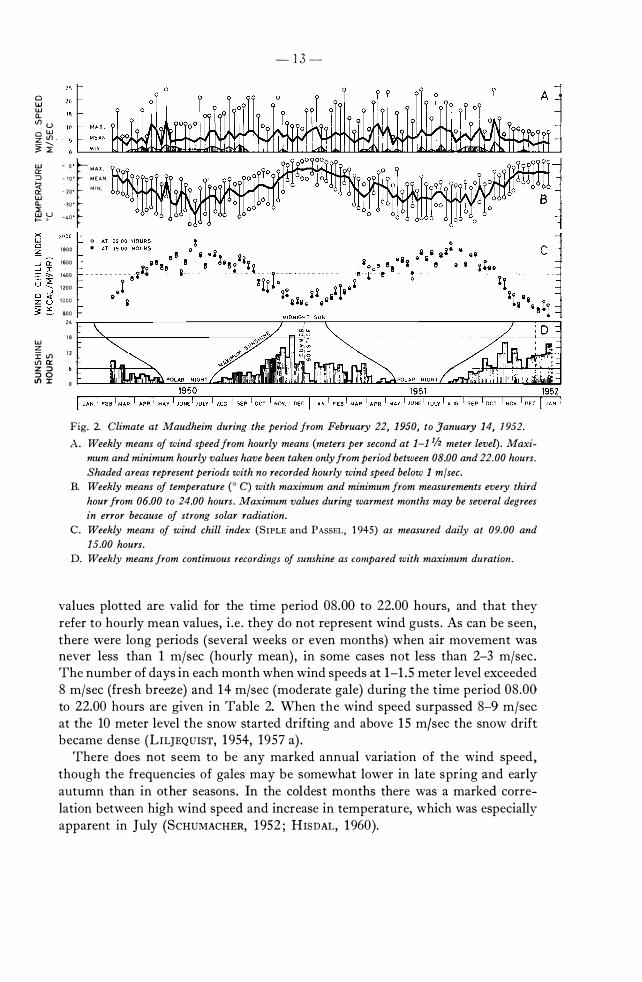
The mean temperature of the year at Maudheim (-1 7. 5 ° C) is comparatively low for a coastal station. Weekly means of the temperature with maximum and minimum for the twa-year period are plotted in Fig. 2. The typical flat winter minimum with large fluctuations is evident. In the summer season the mean temperature does not exceed 00 C, which is associated with the "temperature barrier" at 00 C, created by the extensive snow-fields. This phenomenon also affects the temperature frequency distribution in the summer, which shows a noticeable negative skewness. In temperate regions the frequency distribution of temperature is usually positively skew in the summer season (i. e. langer tail of distribution towards higher temperature values). During the antarctic summer there is a decrease of the temperature dispersion at term-hours, although the re is a marked diurnal variation, but in the winter months, when there is no pronounced regular diurnal temperature variation, the dispersion is great, reflecting the alternation of anticyclonic and cyclonic weather situations (RISDAL, 1 960) .
Wind speed
The mean wind speed of the year is 7.7 m/sec at the 10 meter leve! and 6.1 m/sec at the 1-1 . 5 meter level. vVeekly mean values of the wind speed toget her with maximum and minimum values are plotted in Fig. 2, which well illustrates the windiness of the antarctic continent. Note that the maximum and minimum
a UJ U) Q.. <flu aU) z<fl 3� U) o:: ::J 4 o:: U) Q.. aiu I- o
U) z i:Vl <flO:: z::J ::JO I/'I:r
- "r"A' � 10' MEA.N -20' MIN
JO" -1,0'
o
1800 .
1600 1400 1200 10CO 800
24
18 12
-13-
Fig. 2. Climate at Maudheim during the period from February 22,1950, to January 14, 1952. A. Weekly means of wind speed from hourly means (meters per second at 1-11/2 meter levei). Maxi
mum and minimum hourly values have been taken only from period between 08.00 and 22.00 hours.
Shaded areas represent periods with no recorded hourly wind speed below 1 m/sec.
B. Weekly means of temperature (O C) with maximum and minimum from measurements every third
hour from 06.00 to 24.00 hours. Maximum values during warmest months may be several degrees
in error because of strong solar radiation.
C. Weekly means of wind chill index (SIPLE and PASSEL, 1 945) as measured daily at 09.00 and
15.00 hours.
D. Weekly means from continuous recordings of sunshine as compared with maximum duration.
values plotted are valid for the time period 08.00 to 22.00 hours, and that they refer to hourly mean values, i .e . they do not represent wind gusts. As can be seen, there were lang periods (severai weeks or even months) when air movement was never less than 1 m/sec (hourly mean), in same cases not less than 2-3 m/sec. The number of days in each month when wind speeds at 1-1.5 meter level exceeded 8 m/sec (fresh breeze) and 14 m/sec (moderate gale) during the time period 08 .00 to 22.00 hours are given in Table 2. When the wind speed surpassed 8-9 m/sec at the 10 meter lev el the snow started drifting and above 15 m/sec the snow drift became dense (LIL}EQUIST, 1954, 1957 a).
There does not seem to be any marked annual variation of the wind speed, though the frequencies of gales may be somewhat lower in late spring and early autumn than in at her seasans. In the coldest mo nths there was a marked correlation between high wind speed and increase in temperature, which was especially apparent in July (SCHUMACHER, 1952; HISDAL, 1960).
-14-
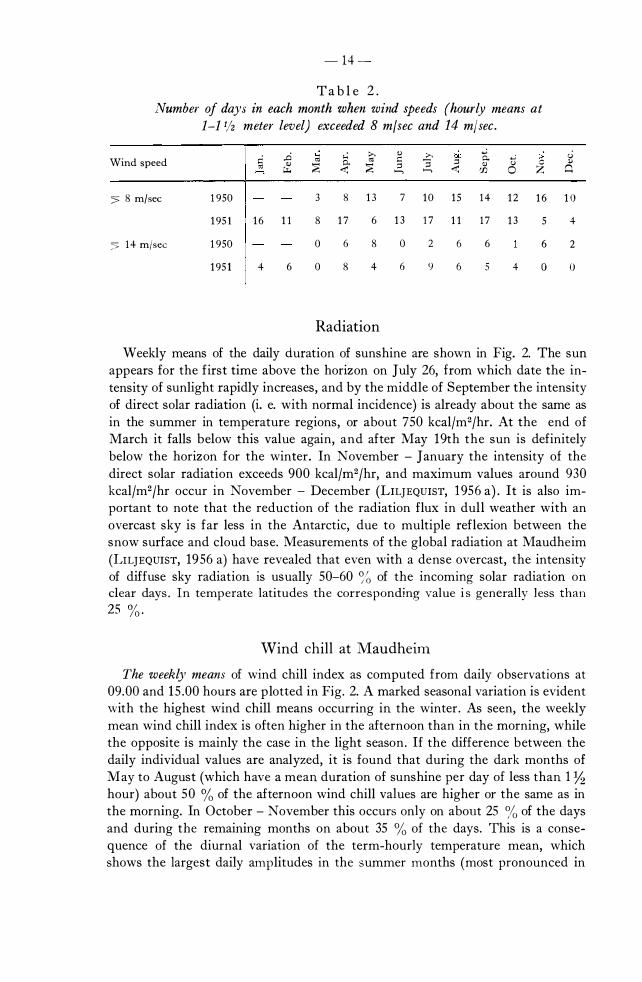
T a b l e 2 . Number of days in each month when wind speeds (hourly means at
1-11/2 meter level) exceeded 8 m/sec and 14 m/sec.
I ci .o ..: ..: > . 'll >. oil o. >- u Wind speed " o- " § -; :l ti i 'll " " � � � 'll Q >--, � � ...... ...... 'lJ O
:> 8 m/sec 1950 3 8 13 7 1 0 1 5 14 1 2 1 6 1 0
1 951 1 6 1 1 8 1 7 6 1 3 17 1 1 17 1 3 5 4
'5 14 m/sec 1950 O 6 8 O 2 6 6 6 2
1 951 4 6 O 8 4 6 9 6 5 4 O O
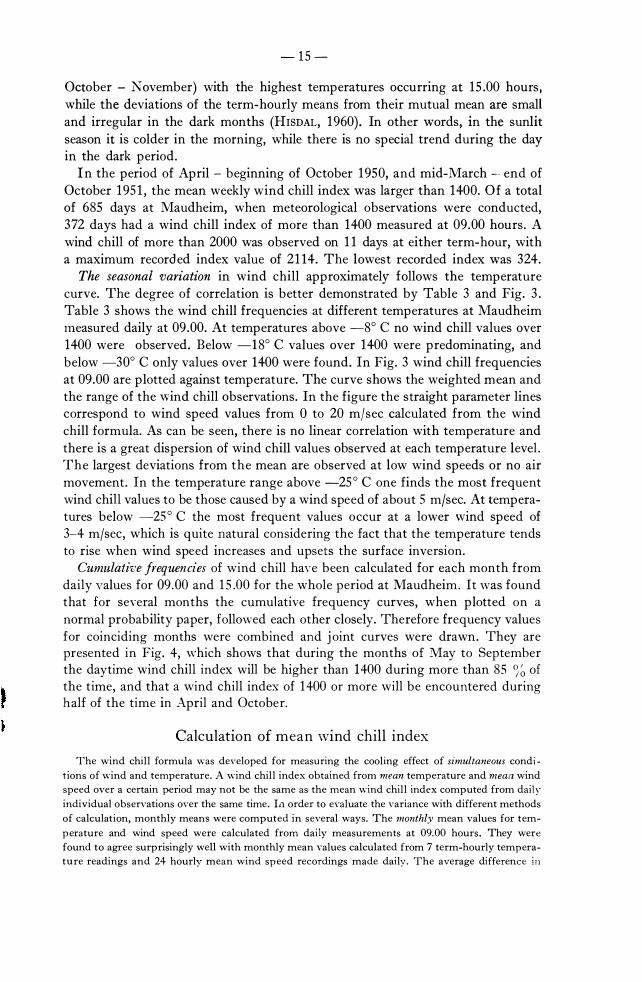
Radiation
Weekly means of the daily duration of sunshine are shown in Fig. 2. The sun appears for the first time above the horizon on July 26, from which date the intensity of sunlight rapidly increases, and by the middle of September the intens it y of direct solar radiation (i. e. with normal incidence) is already about the same as in the summer in temperature regions, or about 750 kcal/m2/hr. At the end of March it falls below this value again, and after May 19th the sun is definitely below the horizon for the winter. In November - January the intensity of the direct solar radiation exceeds 900 kcal/m2/hr, and maximum values around 930 kcal/m2fhr occur in November - December (LILJEQUIST, 1956 a) . It is als o important to note that the reduction of the radiation flux in dull weather with an overeast sky is far less in the Antaretie, due to multiple reflexion between the snow surface and cloud base. Measurements of the global radiation at Maudheim (LIL]EQUIST, 1956 a) have revealed that even with a dense overcast, the intens it y of diffuse sky radiation is usually 50-60 % of the incoming solar radiation on clear days. In temperate latitudes the corresponding value is generally less than
25 %.
Wind chill at Maudheim
The weekly means of wind chill index as computed from daily observations at 09.00 and 15 .00 hours are p lotted in Fig. 2. A marked seasonal variation is evident with the highest wind chill means occurring in the winter . As seen, the weekly mean wind chill index is often higher in the afternoon than in the morning, while the opposite is mainly the case in the light season. If the difference between the daily individual values are analyzed, it is found that during the dark months of ::vray to August (which have a mean duration of sunshine per day of less than 1 Y2 hour) about 50 % of the afternoon wind chill values are higher or the same as in the morning. In October - November this occurs only on about 25 % of the days and during the remaining months on about 35 % of the days. This is a consequenee of the diurnal variation of the term-hourly temperature mean, which shows the largest daily amplitudes in the summer mo nths (most pronounced in
-15-
October - November) with the highest temperatures occurring at 15.00 hours, while the deviations of the term-hourly means from their mutual mean are small and irregular in the dark months (RISDAL, 1960). In other words, in the sunlit season it is colder in the morning, while there is no special trend during the day in the dark period.
In the period of April - beginning of October 1950, and mid-March _ . end of October 195 1 , the mean weekly wind chill index was larger than 1400. Of a total of 685 days at Maudheim, when meteorological observations were conducted, 372 days had a wind chill index of more than 1400 measured at 09.00 hours. A wind chill of more than 2000 was observed on 1 1 days at either term-hour, with a maximum recorded index value of 2114. The lowest recorded index was 324.
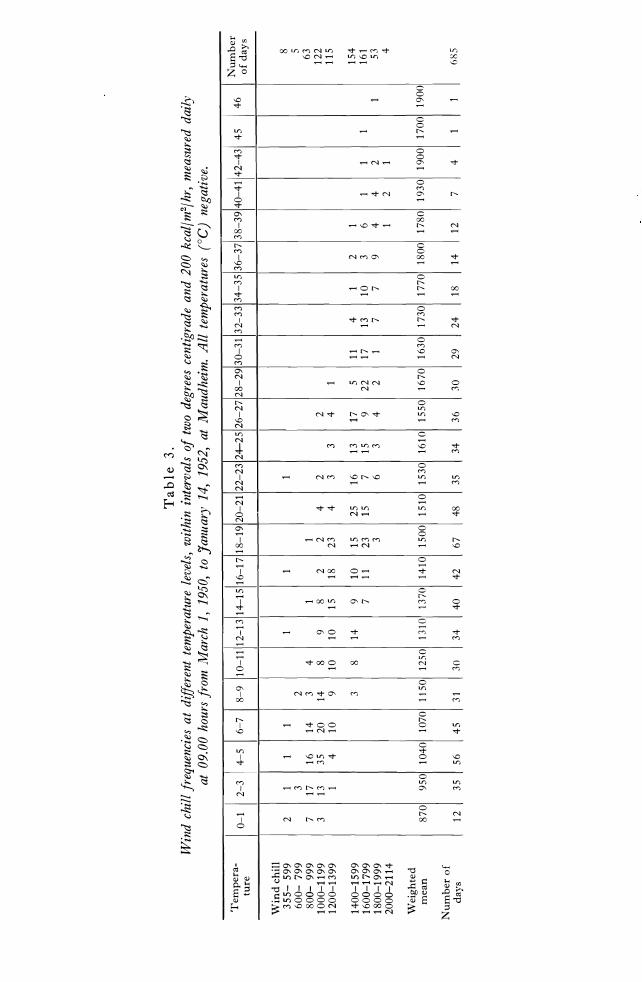
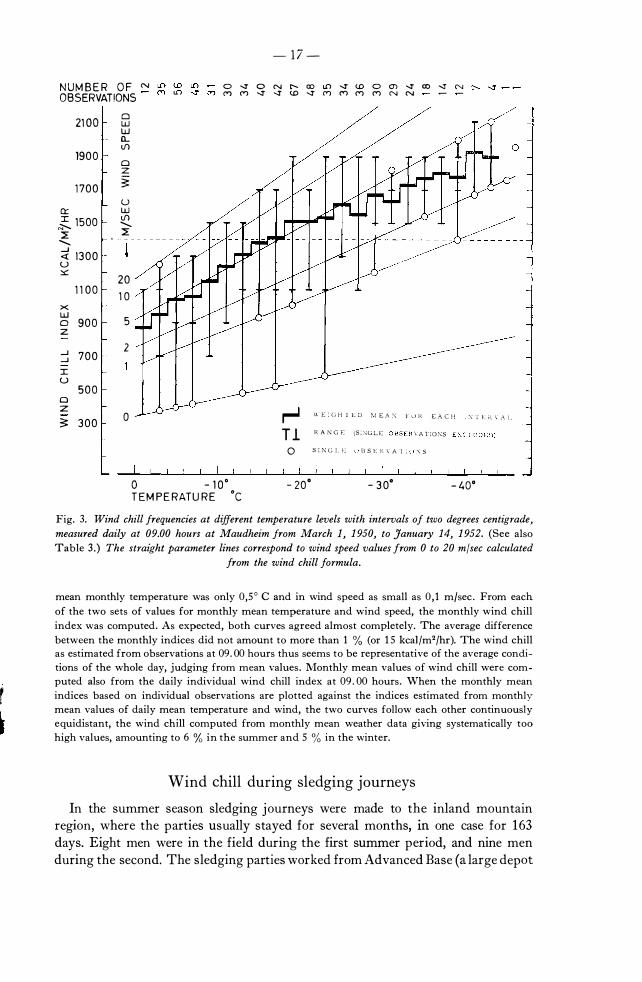
The seasonal variation in wind chill approximately follows the temperature curve. The degree of correlation is better demonstrated by Table 3 and Fig. 3 . Table 3 shows the wind chill frequencies at different temperatures at Maudheim measured daily at 09.00. At temperatures above _80 C no wind chill values over 1400 were observed. Below -180 C values over 1400 were predominating, and below -300 C only values over 1400 were found. In Fig. 3 wind chill frequencies at 09.00 are plotted against temperature. The curve shows the weighted mean and the range of the ",ind chill observations. In the figure the straight parameter lines correspond to wind speed values from O to 20 m/sec calculated from the wind chill formula. As can be seen, there is no linear correlation with temperature and there is a great dispersion of wind chill values observed at each temperature level . The largest deviations from the mean are observed at low wind speeds or no air movement. In the temperature range above -250 C one finds the most frequent wind chill values to be those caused by a wind speed of about 5 m/sec. At temperatures below -250 C the most frequent values occur at a lower wind speed of 3-4 m/sec, which is quite naturai considering the fact that the temperature ten ds to rise when wind speed increases and upsets the surface inversion.
Cumulati,,-"'e frequencies of wind chill haye been calculated for each month from daily Yalues for 09 .00 and 1 5 .00 for the whole period at Maudheim. It was found that for severai mo nths the cumulative frequency curves, when plotted on a
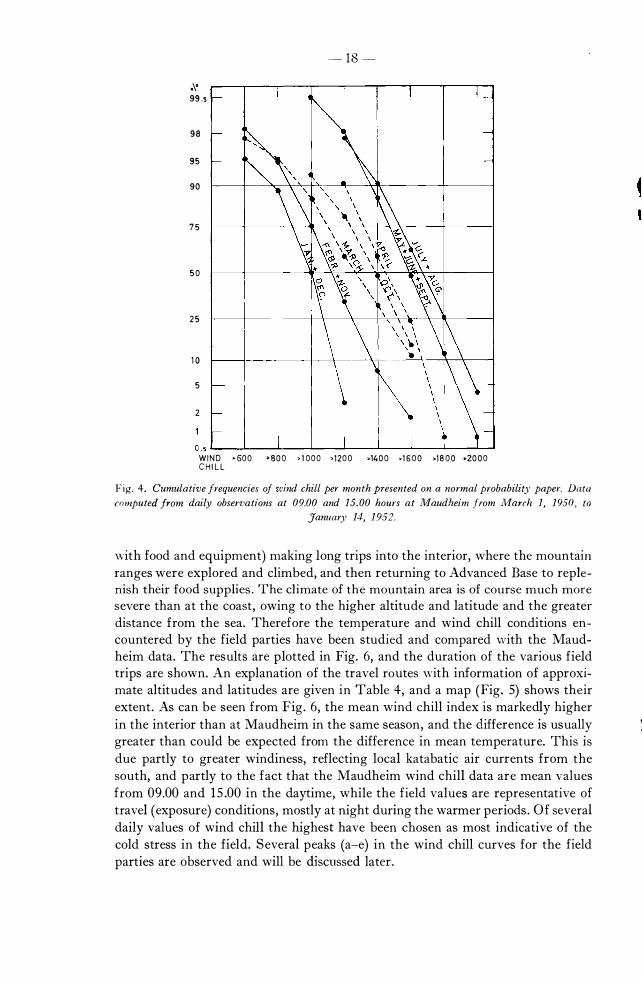
normal probability paper, followed each other closely. Therefore frequency values for coinciding months were combined and joint curves were drawn. They are presented in Fig. 4, \vhich shows that during the months of May to September the daytime wind chill index will be higher than 1400 during more than 85 % of the time, and that a wind chill index of 1400 or more will be encountered during half of the time in April and October.
Calculation of mean wind chill index
The wind chill formula was developed for measuring the cooling effect of simultancous condi
tions of wind and temperature. A wind chill index obtained from mean temperature and meall wind
speed over a certain period may not be the same as the mean wind chill index computed from daily
individual observations over the same time. In order to evaluate the variance with different methods
of calculation, monthly means were computed in severaI ways. The 11lOnthly mean values for tem
perature and wind speed were calculated from daily measurements at 09.00 hours. They were
found to agree surprisingly well with monthly mean values calculated from 7 term-hourly tempera
ture readings and 24 hourly mean wind speed recordings made daily. The average difference in
Tem
per
a-
ture
Win
d c
hil
l 3
55
-5
99
6
00
-7
99
8
00
-9
99
1
00
0-1
19
9
120
0-
13
99
14
00
-1
59
9
16
00
-1
79
9
18
00
-1
99
9
20
00
-2
11
4
Wei
gh
ted
m
ean
Nu
mb
er o
f da
ys
Tab
le 3
. W
ind
chi
ll f
requ
enci
es a
t d
iffer
ent
tem
per
atur
e le
veIs
, w
ithi
n in
ter-v
als
of t
wa
deg
rees
cen
tigra
de
an
d 2
00 k
calJ
m2J
hr,
mea
sure
d d
aily
at
09
.00
hou
rs f
rom
Mar
ch 1
, 19
50,
to J
anu
ary
14
, 19
52,
at M
aud
heim
. A
ll t
emp
era
ture
s t
e)
neg
ativ
e.
1 0-
1 12-3
14-
516-7
8-
9110-1
1
2 7 3 87
0
12
1 1
3 1
7
16
1
3 35
1
4
950
10
40
35
56
1 2
14
3 4
20
1
4
8
10
9 10
3 8
10
70
11
50
1
250
45
31
30
12
-1
3 14
-1
5116-1
7
1
1 9
8 10
15
14
9 7
13
101 1m
34
40
1 2 18
10
1
1
14
10
42
18-
19 2
0-
21
22
-2
3
1
1 2 4
2
23
4
3
15
2
5
16
2
3 1
5
7 3
6
150
0
1510
15
30
67
48
35
24-
-25
26-
27
28
-2
9 3
0-
31132-3
3 3
4-
35136-3
7138-3
914
0-
41142-4
314
5
146
2 3
4
1
13
1
7
5
11
4
1 2
1 15
9
22
1
7
13
10
3
6 1
1
1
3 4
2
1
7 7
9 4
4
2
1 1
2 1
1610
15
50
16
70
16
30
17
30
17
70
18
00
1
780
1
93
0
19
00
17
00
1
90
0
34
36
3
0
29
2
4
18
14
1
2
7 4
1
1
Nu
mb
er
of
day
s
8 5 6
3
12
2
115
154
1
61
53
4
6�5
r
•
-17-
NUM BER OF � 08SERVATJONS
O -.J"O Nt"-- aJ LO -.J" lO Ocn -.J"aJ -.J"N C"") C"") -.J" -.J" lO -.J" C"") C"") C"") C"") N N
2100
1900
1700
Cl::: � 1500 �
........ ...J
1300 <t U ::.:::
1100 x L.LJ o 900 z
...J 700 ...J :r: u
500 Cl z � 300
o L.LJ L.LJ IL lf)
Cl z 3:
U L.LJ lf) ........ �
20 10
5
2
O
O -lO· TEMPERATURE 'c
,.-l Tl
\\- 1.:: (; H l i:: D M E A � FU]{ E A C H :\ ';' r: R \-.'\ l. RA:";CF: (S;XGLE OHSEIZ \'AT:O:-\S EXCLLDI':D)
o S I l' ei I. l'� l) B S I:.: I'� \' A l ; l) " S
- 20' - 30' -40'
Fig. 3. Wind chill frequencies at different temperature levels with intervals of two degrees centigrade,
measured daily at 09.00 hours at Maudheim from March 1, 1950, to January 14, 1952. (See also
Table 3.) The straight parameter lines correspond to wind speed values from O to 20 m/sec calculated
from the wind chill formula.
mean monthly temperature was only 0,50 C and in wind speed as small as 0 , 1 m/sec. From each
of the two sets of values for monthly mean temperature and wind speed, the monthly wind chill
index was computed. As expected, both curves agreed almost completely. The average difference
between the monthly indices did not amount to more than 1 % (or 1 5 kcal/m2/hr). The wind chill
as estimated from observations at 09.00 hours thus seems to be representative of the average condi
tions of the whole day, judging from mean values . Monthly mean values of wind chill were com
puted also from the daily individual wind chill index at 09.00 hours. When the monthly mean
indices bas ed on individual observations are plotted against the indices estimated from monthly
mean values of daily mean temperature and wind, the two curves follow each other continuously
equidistant, the wind chill computed from monthly mean weather data giving systematically too
high values, amounting to 6 % in the summer and 5 % in the winter.
Wind chill during sledging journeys
In the summer season sledging j ourneys were made to the inland mountain region, where the parties usually stayed for severai months, in one case for 163 days. Eight men were in the field during the first summer period, and nine men during the second. The sledging parties worked from Advanced Base (a large depot
,\' 99.s
98
95
90
75
50
25
10
5
2
-18-
O.sL-__ _L ____ � __ _L ____ � __ _L ____ L_ __ � __ �� WIND -600 >800 >1000 >1200 >1400 -1600 >1800 .2000 CHILL
Fig. 4. Cumulative frequencies of u'ind chill per month pl'esented on a normal probability papel'. Data
cmnputed from daily observations at 09.00 and 15.00 hours at iVIaudheim from lVIarch 1, 1950, to Januar)' 14, 1952.
\"ith food and equipment) making long trips into the interior, where the mountain ranges were explored and climbed, and then returning to Advaneed Base to rep lenish their food supplies. The climate of the mountain area is of eourse much more severe than at the eaast, owing to the higher altitude and latitude and the greater distance from the sea. Therefore the temperature and wind chill eonditions encountered by the field parties have been studied and compared with the Maudheim data. The results are plotted in Fig. 6, and the duration of the various field trips are shown. An explanation of the travel routes with information of approximate altitudes and latitudes are given in Table 4, and a map (Fig. 5) shows their extent . As can be seen from Fig. 6, the mean wind ehill index is markedly higher in the interior than at Maudheim in the same season, and the difference is usually 1 greater than could be expected from the differenee in mean temperature. This is due partly to greater windiness, reflecting loeal katabatic air currents from the south, and partly to the faet that the Maudheim wind ehill data are mean values from 09.00 and 1 5 .00 in the daytime, while the field values are representative of travel (exposure) conditions, mostly at night during the warmer periods. Of severai daily values of wind chill the highest have been ehosen as most indieative of the eold stress in the field. Severai peaks (a-e) in the wind ehill curves for the field parties are observed and will be diseussed later .
-19-
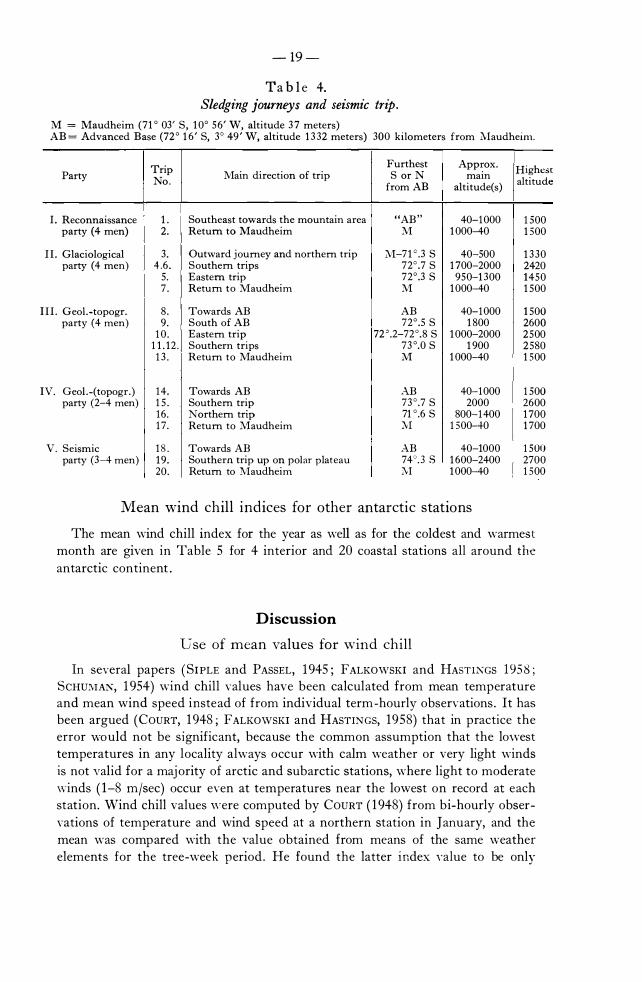
Table 4. Sledging journeys and seismie trip.
M = Maudheim (71 ° 03' S, 1 0° 5 6' W, altitude 3 7 meters) AB= Advanced Base (72° 1 6' S, 3° 49' W, altitude 1 3 32 meters) 300 kilometers from Maudheim.
Trip Furthest Approx.
Highest Party Main direction of trip S orN main
No. from AB altitude(s)
altitude
I. Reconnaissance 1 . Southeast towards the mountain area "AB" 40-1000 1500 party (4 men) 2. Retum to Maudheim :vI 1 000-40 1500
Il. Glaciological 3. Outward joumey and northem trip :\'1-71 °.3 S 40-500 1 330 party (4 men) 4.6. Southem trips 72°.7 S 1 700-2000 2420
5. Eastem trip 72°.3 S 950-1 300 1450 7. Retum to �Vlaudheim :vI 1 000-40 1 500
Ill. Geo!. -topogr. 8. Towards AB AB 40-1000 1 500 party (4 men) 9. South of AB 72°.5 S 1 800 2600
10. Eastem trip 72'.2-72°.8 S 1 000-2000 2500 11 .12 . Southern trips 73°.0 S 1 900 2580 13. Retum to Maudheim M 1 000-40 1 500
IV. Geo!. -( topogr.) 14. Towards AB AB 40-1000 1500 party (2-4 men) 15. Southem trip 73°.7 S 2000 2600
16. N orthem trip 71 °.6 S 800-1400 1 700 17. Retum to Maudheim ;VI 1500-40 1 700
V. Seismie 1 8 . Towards AB AB 40-1000 1500 party (3-4 men) 1 9. Southern trip up on polar plateau 74".3 S 1 600-2400 2700
20. Retum to Maudheim ;VI 1 000-40 1500
lVIean wind chill indices for other antarctic stations
The mean wind chill index for the year as well as for the coldest and warmest month are given in Table 5 for 4 interior and 20 coastal stations all around the antarctic continent .
Discussion
u se of mean values for wind chill In severai papers (SIPLE and PASSEL, 1945; FALKOWSKI and HASTIKGS 1958;
SCHUl\IAK, 1954) wind chill values have been calculated from mean temperature and mean wind speed instead of from individual term-hourly observations . It has been argued (COURT, 1 948; FALKOWSKI and HASTINGS, 1958) that in practice the error \'iOuld not be significant, because the common assumption that the lo,vest temperatures in any locality always occur with calm weather or very light winds is not valid for a majority of arctic and subarctic stations, where light to moderate winds ( 1-8 m/sec) occur even at temperatures ne ar the lowest on record at each station. Wind chill values \Yere computed by COURT ( 1 948) from bi-hourly observations of temperature and wind speed at a northern station in January, and the mean was compared with the value obtained from means of the same weather elements for the tree-week period . He found the latter index nlue to be only
-- 20 �
- WE ST E RN D R O NN ING MAUD
l e E S H E L F
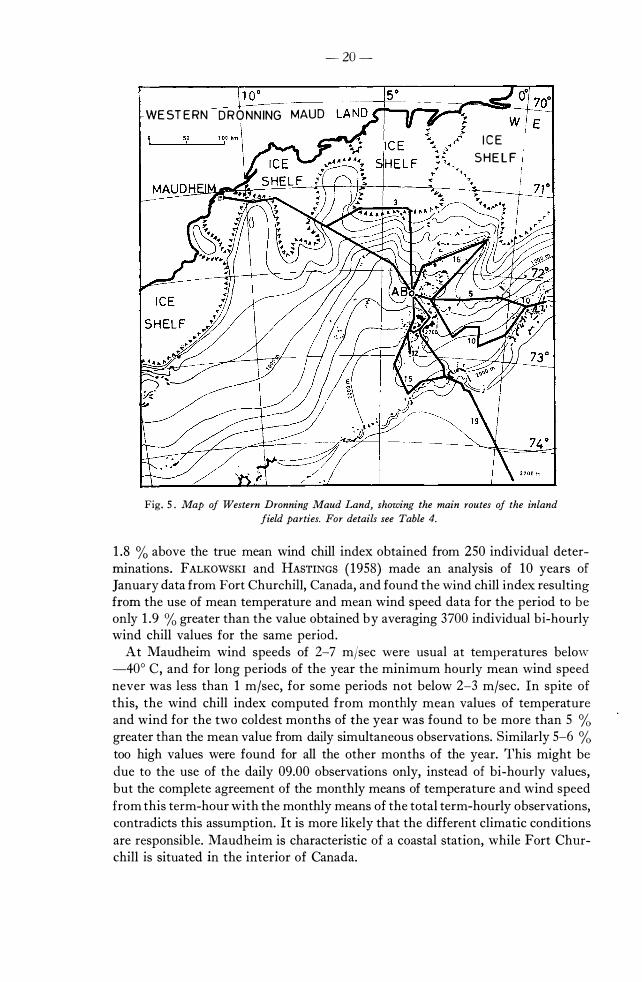
Fig. S . Map of Western Dronning Maud Land, showing the main routes of the in land
field parties. For details see Table 4.
1.8 % above the true mean wind chill index obtained from 250 individual determinations. FALKOWSKI and HASTINGS ( 1958) made an analysis of 10 years of J anuary data from Fort Churchill, Canada, and found the wind chill index resulting from the use of mean tempe ra ture and mean wind speed data for the period to be only 1 .9 % greater than the value obtained by averaging 3700 individual bi-hourly wind chill values for the same period.
At Maudheim wind speeds of 2-7 m/sec were usual at temperatures below �40° C, and for long periods of the year the minimum hourly mean wind speed never was less than 1 m/sec, for some periods not below 2-3 m/sec. In spite of this, the wind chill index computed from monthly mean values of temperature and wind for the two coldest months of the year was found to be more than 5 % greater than the mean value from daily simultaneous observations. Similarly 5-6 % too high values were found for all the other months of the year. This might be due to the use of the daily 09.00 observations only, instead of bi-hourly values, but the complete agreement of the monthly means of temperature and wind speed from this term-hour with the monthly means of the total term-hourly observations, contradiets this assumption. It is more likely that the different climatic conditions are responsible. Maudheim is characteristic of a coastal stat ion, while Fort Churchill is situated in the interior of Canada.
- 2 1 -
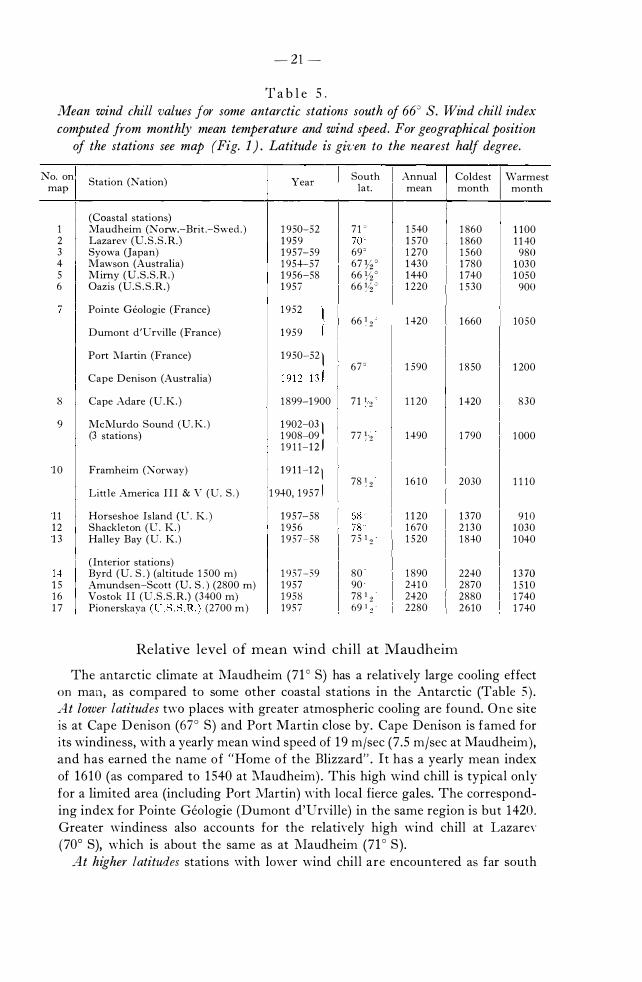
'r a b l e 5 . il1ean wind chill values for same antaretie stations south of 66° S. Wind chill index
computed from monthly mean temperature and wind speed. For geographical positiofl of the stations see map (Fig. 1) . Latitude is gh'en to the nearest half degree.
::-.Jo. on Station (Nation) I Year
South I Annual I Coldest I \Varmest map lat. mean month month
(Coastal stations) 1 ::Vlaudheim (Norw.-Brit .-Swed . ) 1 950-52 7 1 c 1 540 1 860 1 1 00 2 Lazarev (U. S . S . R.) 1 95 9 70 ' 1 5 70 1 860 1 1 40 3 Syowa (Japan) 1 95 7-59 69' 1 270 1 560 980 4 Mawson (Australia) 1 954-57 67 W 1 43 0 1 780 1 03 0 5 Mirny (U .S .S .R . ) 1 956-58 66 �/2 .:) 1 440 1 740 1 050 6 Oazis (U. S . S .R.) 1 957 66 %C 1 220 1 5 30 900
7 Pointe Geologie (France) 1 9 52 l 66 ; 2 1 420 1 660 1 0 5 0 Dumont d'Urville (France) 1 95 9 1 Port :.vlartin (France) 1 9 50-52 )
67 ' 1 590 1 8 50 1 200 Cape Denison (Australia) 1 9 1 2-1 3 1
li Cape Adare (U .K) 1 899-1 900 7 1 1 2 1 1 20 1 420 8 30
9 McMurdo Sound (U. K ) 1 902-03 1 (3 stations ) 1 908-09 77 ) 2 1 490 1 790 1 000
1 9 1 1-1 2 1 1 0 Framheim (:'\orway) 1 9 1 1 -1 2 \
1 940, 1 95 7 1 78 � 2 1 6 1 0 2030 1 1 1 0
Litt J e America I I I & \' (U. S . )
1 1 Horseshoe Island (l'. K . ) 1 9 57-58 68 ' 1 1 20 1 3 70 9 1 0 1 2 Shackleton (C. K) 1 95 6 78 ' 1 670 2 1 3 0 1 030 1 3 Halley Bay (C. K) 1 9 57-58 7 3 l � 1 5 20 1 840 1 040
( Intcrior stations) 1 4 Byrd (U. S . ) (altitude 1 500 m) 1 957-59 80 1 890 2240 1 3 70 1 5 Amundsen-Scott (U. S . ) (2800 m) 1 957 90 241 0 2870 1 5 1 0 1 6 Vostok I l ( U . S . S . R.) (3400 m) 1 95 8 78 1 2 I 2420
I 2880 1 740
1 7 Pionerskaya (lT S . S . R . ) (2700 m ) 1 9 5 7 69 1 2 . I 2280 2610 1 740 I
Relative level of mean wind chill at lVIaudheim
The antarctic climate at l\Iaudheim (71 o S) has a relativ-ely large cooling effect on man, as compared to some at her coastal stations in the Antarctic (Table 5 ) . At lower latitudes twa places with greater atmospheric cooling are found. One site is at Cape D enison (670 S) and Port Martin dose by. Cape Denison is famed for its windiness, with a yearly mean wind speed of 1 9 m/sec (7 .5 m/sec at Maudheim), and has earned the name of "Home of the Blizzard" . It has a yearly mean index of 1 6 10 (as compared to 1 540 at Maudheim) . This high \vind chill is typical only for a limit ed area (induding Port l\Iartin) \yith loeal fieree gales. The eorresponding index for Pointe Geologie (Dumont d'L'n:ille) in the same region is but 1420 . Greater \vindiness also aeeounts for the relatinly high wind ehill at Lazarey (700 S), whieh is about the same as at Maudheim (71 0 S) .
At higher latitudes stations with lower wind ehill are eneountered as far south
- 22 -
as 77 Y2° S . The yearly mean wind chill index of 3 stations in McMurdo Sound (77 Y2° S) amounted to 1490. Halley Bay (75 Y2° S) had 1520, while Cape Adare (71 Y2 ° S) at about the same latitude as Maudheim, had only 1 120.
The stations in the interior of the continent, of course, show considerably higher wind chill values, which partly is due to higher altitude. The South Pole has a yeady mean index of 2410, which, however, is exceeded by Vostok Il (78 Y2° S ) with an index of 2420. Although positioned much further to the north this station is situated in an intensely cold area near the "Pole of Cold" .
It must be noted that all these values are based on monthly mean temperature and monthly mean wind speed at standard anemometer height (8-10 meters) . VINJE ( 1962) has made corresponding calculations for the dry-kata cooling power at these antarctic stations , but as earlier mentioned, this cooling power does not represent the power of the environment to cool the human body (BEDFoRD, 1948) .
The considerably higher wind chill values found for the intra-continental stations, however, do not represent a correspondingly higher cooling power of the atmosphere . At the altitudes prevalent in the interior, the density of the air is much lower, which means a decrease in the heat-carrying capacity of the air. The term representing convective heat loss must therefore be multiplied by the square root of the ratio of dens it y at altitude to that at sea level (BURTON and EDHOLM, 1 955 ) . At the South Pole Station (altitude 2800 meters), as compared to Little America (sea level) where the wind chill formula was developed, this factor would be about 0 .83 for the coldest as well as for the warmest month. This means that the cooling effect of the atmosphere at a wind chill index of about 1 700 at the South Pole would be equivalent to an index of 1400 at the coast . This agrees with the observation that men at the South Pole are able to tolerate very high wind chill values and work outside even in the wind at temperatures below -60° C (SIPLE, 1958) . On one occasion two men at the South Pole Station (SIPLE, 1960) spent 3-4 hours out of doors in a wind chill of 3 100-3200 (about -71 ° C and 6-8 m/sec) by the normal compution method, which would be equal to an index of about 2600 at sea level. A wind chill value of this order has actually occurred at Little Ameriea (SIPLE and PASSEL, 1945 ) .
In the Northern Hemisphere comparable wind chill conditions are only found in the winter in the coldest regions of the Arctic . The mean wind chill index of the coldest month at Maudheim (about 1 875 in July) is generally found only well into the North Polar Basin at considerably higher latitudes, along part of the northern coast of Siberia (700 N), on the inland ice of Greenland, and in Central Arctic Canada north of Fort Churchill (F ALKOWSKI and HASTINGS, 1958) . This latter area, however, extends as far south as 60° �. The wind chill index of the \Varmest months at Maudheim (about 1 100 in December-January) is comparable to values for the coldest months in Northern Sweden and Norway, Central Iceland and on the coast of South Greenland . It must be remembered, however, that in this comparison the strong solar radiation at Maudheim in the summer has not been taken into account . It contributes greatly to lessening the effect of atmospheric cooling during this season.
- 23 -
Contribution of solar radiation
Due to the exceptional purity of the air and the 10\''- water vapour content, the direct solar radiation in the Antarctic even at a sun elevation of 3 5 ° reaches values, which are otherwise only observed in the mountains at an altitude of 2000-3000 meters and at a sun elevation of 50° in temperate regions (LILJEQUlST, 1956 a) . To this must be added the fact that the sun is in perihelion during the antarctic summer, but in aphelion in the northern summer. Under the same atmospheric eonditions and with the same solar altitude one will therefore observe about 6 % higher solar intensity values in summer in the Antarctic than in the corresponding season in the Arctic. For comparison can be mentioned that in the European Alps
(HANN and SURING, 1939) the intensity of the direct solar radiation at a sun elevation of 50° in the middle of June at Davos ( 1 600 m) is definitely lower, \vhile those from Zugspitze (2962 m) are about the same as at YIaudheim at sea level . The highest solar altitude at l\Taudheim is 42° .4 .
It has been estimated (GOLD, 1935 . SIPLE and PASSEL 1 945 ) , that the effect of bright sunlight is equal to a decrease in wind chill index of about 200, \vhile light doud conditions are equal to a reduction of about 1 00. The contribution of solar radiation in Antarctica in terms of heat gain for the human body has been studied by CHRE:\'KO and PUGH ( 1961 ) using radiation values from Maudheim. Their results show that the solar heat gain in the Antarctic at the height of summer is from two to four times greater than the heat gain in the desert regions . Because of the high albedo of snow, the heat gain continues to rise with increase in solar altitude. The total sol ar heat gain in kcal /m2jhr was found to be 200 at a solar altitude of 10° up to almost 400 at 40° . The contribution of solar radiation to warming the body may be considered as equivalent to elevating the air temperature by an amount designated by BURTO� (BuRTo::-.r and EDHOL!\I, 1 955 ) the « thermal radiation increment" . This increment varies with wind speed and solar altitude, and at a solar altitude of 40° may be 1 5 ° C at 2 m/sec and 1 1 0 C at 6 m/sec. In exceptionally cairn weather in the height of the summer a thermal radiation increment of 25° C may occur. This would be equivalent to raising an ambient temperature of _5 ° C to +20° C, which makes it possible for men to work stripped to the waist in subzero air temperatures . Even with higher \Vind speeds the increment nries bet\Veen 5 ° C and 10° C, and also considering the more severe inland eonditions it is often about 10° C.
During sledging inland in Dronning Maud Land a t the height o f summer the thermal radiation inerement was ot sueh magnitude that travelling was mostly done at night to spare the dogs from the heat load. The rate of heat absorbtion by the dark doth of the double-walled pyramidal tent due to solar radiation was at times sa high that when sleeping during the daytime ane eould lie praetieally naked on top of the sleeping-bag with the tent-entranee wide apen in air temperatures well below freezing. Investigations in the Antarctie by PUGH and CHRENKO ( 1962) have shO\vn that the effeet of intense solar radiation on man inside a
tent of this type may be equivalent to raising the external temperature by about 19° C. In overcast weather the solar heat gain from reflected radiation is also remarkable, as previously mentioned . The ",ind chill is tims cons iderably modified by radiation in the summer season.
- 2-1- -
Wind chill conditions during sledging
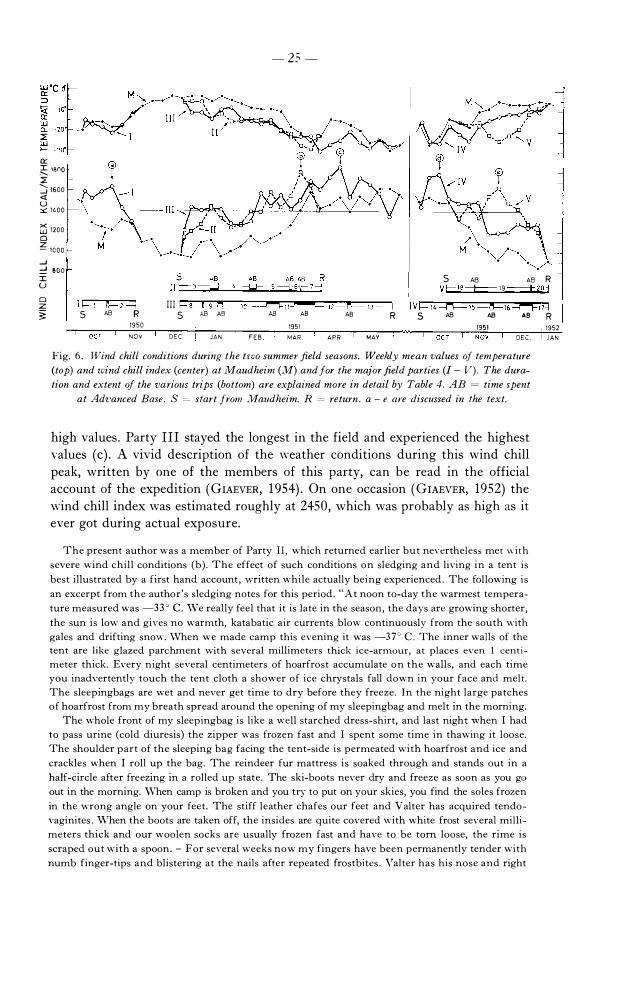
Wind chill conditions on sledging j ourneys have been briefly diseussed by 8IPLE and PASSEL ( 1 945) in connection with relative comfort estimations . In Fig. 6 the weekly mean wind chill index is plotted for the major field parties in Dronning Maud Land. As seen in Table 4 the altitude varied considerably during sledging, ranging from 40 meters (ice shelf) to 2700 meters (polar plateau) . This implies that the wind chill values in the field should be corrected for altitude. However, this correction has in fact already been applied by using estimated wind speeds . The speed of the wind, when estimated, is obtained from the dynamic pressure exerted by the wind (e. g . the Beaufort scale), which is proportional to the density of the air and the wind speed. Therefore the estimated wind speed values in the field have been judged according to the density of the air prevalent at the loe al altitude in agreement with the decreased cooling power of the air, making a correction unneeessary. Some of the changes in wind chill for the field parties are worth discussing.
Party I made the first major sledging trip into the interior and started early in the season (October) . The wind chill (a) encountered on the trip was markedly high er than at Maudheim, mainly due to greater wind speeds (mean 9 m/sec) . Even higher wind chill values (d) were encountered by Party IV in the same month (October) next season with similar wind speeds. Characteristic of the early approach to the interior is traveIling against downhill air currents at relatively 10\" temperatures . A later approach will meet much more favourable conditions as shown by the index values of Party Il and IlI . Their diverging wind chill curves for the outward journey to Advanced Base (AB) also illustrate the effect of different routes (Fig. 5 ) . Party III took the straight course southeastward to AB, quickly reaching a higher altitude and latitude. Party Il departed from the main track at a low elevation and descended again to an ice shelf, traveIling eastward to a point about 100 kilometers due north of AB before turning south and ascending to AB (trip 3 , Fig. 5). At this paint the twa wind chill curves meet again, the index being relatively high for the season, because both parties travelled mainly by night . Otherwise the wind chill indices during the main part of the summer (mid�avember to mid-February) were moderate and should be even further greatly reduced because of the high intens it y of solar radiation during this periad.
Only Party V experienced wind chill values well above 1400 at the height of the summer. This was because they travelled furthest to the south and ascended the polar plateau (trip 19 , Fig. 5 ) . The party spent one week (e) at 74° . 3 S at an altitude of 2700 meters with a mean wind chill index of 1 650 .
A member of this party has described t h e weather conditions a s follows (GIAEVEH, 1 954) :
" During these six days on the ice plateau the weather showed an uncanny regularity. Each day the
t emperature at noon had been close to -1 70 C and each night a minimum thermometer laid on
the snow registered -320 C. In the mornings a fresh easterJy breeze would chill the camp, but
things would begin to feel warmer as the wind gradually dropped and as the sun, whieh shone
each day, climbed in the sky . "
As the summer came to an end, considerably more rigid weather conditions ensued with low temperatures and frequent gales, and the wind chill increased to
fr: I ,sno :-... ::;: :::; 1600 « U ::!: 1[.00
i:;:] 1200 O Z - 1000 --'
- 25 -
== 8 0 0 I U 5 AS AS R
v c 1 8 --+--------: 1 9 ==::± 2 0 " O Z �
I �n 1 =11= 2 =1 5 AS R
1 950
I I I C:: 8 =+9 :rc - 1 C -�!"""1=' H ;:::: ' 2 -=n== 1 3 -� I V f= 1 4 =n= ' 5 ==n= 1 6 =n:' 7� 5 hS AS AB AB AS R 5 AS AS AB R
1951 1951 N O V D E C J A N F E B M A R A P R MAV oeT NOV DEC
Fig. 6 . Wind chill conditions during the tzco summer field seasans. Weekly mean values of temperature
(tap) and wind chill index (center) at J"'laudheim (J'W") and for the major field parties (1 - V) . The dura
lian and extent of the various trips (bottom) are explained more in detail by Table 4. A.B = time spent
at A.dz'anced Base . S � start from J"'laudheim. R � return . a - e are discussed in the text.
high values . Party I I I stayed the longest in the fie1d and experienced the highest values (c) . A vivid description of the weather conditions during this wind chill peak, written by one of the members of this party, can be re ad in the official account of the expedition (GIAEVER, 1 954) . On one occasion (GIAEVER, 1952) the ,vind chill index ,vas estimated roughly at 2450, which was probably as high as it ever got during actual exposure.
The present author was a member of Party Il , which returned earlier but nevcrtheless met with
severe wind chi l l conditions (b) . The effect of such conditions on sledging and living in a tent is
best illustrated by a first hand account , \\Titten while actually being experienced . The following i s
an excerpt from the author's sledging notes for this period . "At noon to-day the warmest tempera
ture measured was -3 3 0 C . "Ve really feel that it is late in the season , the days are growing shorter,
the sun is low and gives no warmth, katabatic air currents blow continuously from the south with
gales and drifting snow. \Vhen we made camp this evening it was -3 7 0 C . The inner walls of the
tent are like glazed parchment with severaI millimeters thick ice-armour, at places even 1 cent i
meter thick. Every night severaI centimeters of hoarfrost accumulate on the walls, and each time
you inadvertently touch the tent cloth a shower of ice chrystals fall down in your face and mell.
The sleepingbags are wet and never get time to dry before they freeze. In the night large patches
of hoarfrost from my breath spread around the opening of my sleepingbag and melt in the morning.
The whole front of my sleepingbag is like a well starched dress-shirt, and last night when I had
to pass urine (cold diuresis) the zipper was frozen fast and I spent some time in thawing it loose .
The shoulder part of the sleeping bag facing the tent-side i s permeated with hoarfrost and ice and
crackles when I roll up the bag. The reindeer fur mattress is soaked through and stands out in a
half-circle after freezing in a rolled up state . The ski-boots never dry and freeze as soon as you go
out in the morning. When camp is broken and you try to put on your skies, you find the soles frozen
in the wrong angle on your feet. The stiff leather chafes our feet and Valter has acquired tendo
vaginites . \\'hen the boots are taken off, the insides are quite covered with white frost severaI milli
meters thick and our woolen socks are usually frozen fast and have to be torn loose, the rime is
scraped out with a spoon, - For severaI weeks now my fingers have been permanently tender with
numb finger-tips and blistering at the nails after repeated frostbites . Valter has his nose and right
1 952 JAN
- 26 -
cheek frostbitten. - All food is frozen to ice, ham, butter, tins, etc . , and it takes ages to thaw out
everything before being able to eat . At the depot we could not cut the ham, but had to chop it in pieces with a spade and threw ourselves hungrily at the chunks and chewed with the ice crackling
between our teeth. Y ou have to be careful with what you put in your mouth. The other day I put
a piece of chocolate from an outer pocket directly in my mouth and promptly got a frostbite with
bl istering of the palate. "
Frostbites
Selection of cases
Freezing of the skin can be taken as an indicator of the degree of cooling. While it is true that injurious effects of frostbite are less common than expected in very cold regions (because of the experience of the residents) it is certainly not true that freezing of the skin is uncommon, on the contrary it is continuously experienced . Of the many occasions of frost bite experienced by the seventeen members of the NBSX, a fair number have been recorded accurately enough to allow calculation of the wind chill index at the time of occurrence. Only incidents of frostbite affecting exposed (or insufficiently protected) skin have been considered in this connexion, such as face, ears, neck, wrists and hands. Thus the 3-4 cases involving freezing of toes and penis have been excluded, as well as cold injury caused by touching cold objects, such as ice, metal instruments, tools, motor parts, etc. As a frostbite has been considered every case of freezing of the skin - even without resultant injury. Accordingly included are als o temporarily frozen spots, characterized by a white, circumscribed area, hard to the touch and usually preceded by a sting, which left no lasting injury when thawed out within a few minutes (except for peeling skin) . This definition has been adopted (cf. SCHUMAN, 1 954) for the present study, because mostly it is only a question of duration until such a superficial frostbite will cause a more extensive injury, the longer time the more severe the effect . Therefore no attempt has been made here to classify the cases of frostbite according to the degree of injury, nor have frostbites occurring simultaneous1y at severai sites or repeated1y during a prolonged period of the day in the same person been regarded as more than one case. But if two persons were affected at the same time, it has been recorded as two separate incidents.
l'sually no injury resulted from these frequently occurring superficial frostbites, but now and
then, when the freezing went unnoticed or when adverse circumstances did not permit immediate
thawing-out, more persisting injuries ensued with blistering and loss of skin. About 20 cases of
second degree co Id injuries of face , ears, and fingers were observed, but it is certain that there were
incidents of blistering finger-tips which never were reportcd to the author. \Vith the exception of a frozen toe, which had been frostbitten during a previous stay in Antaretica, there were no thire!
degree injuries .
Wind chill and frostbite
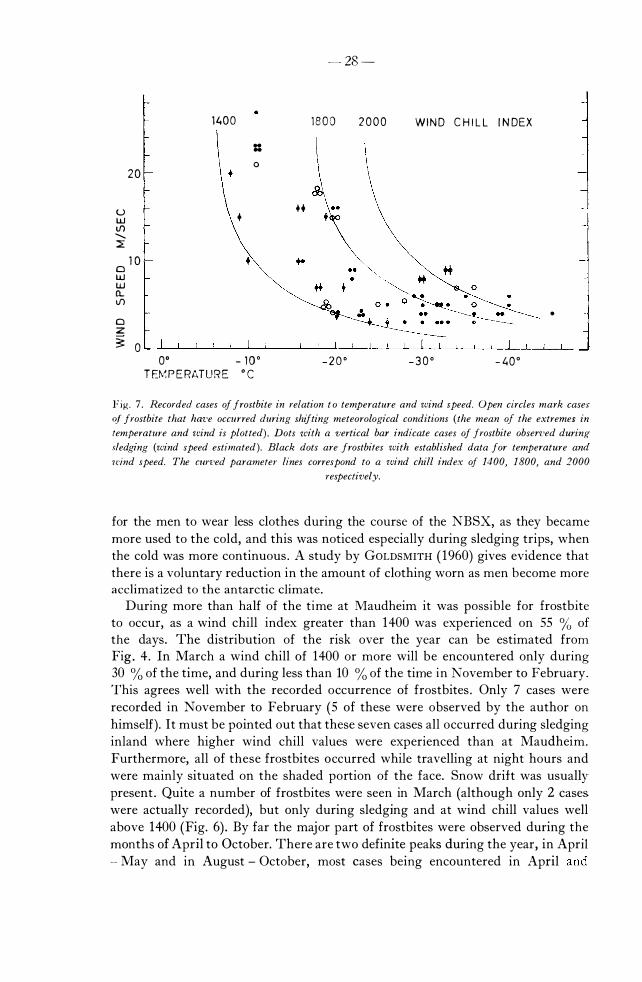
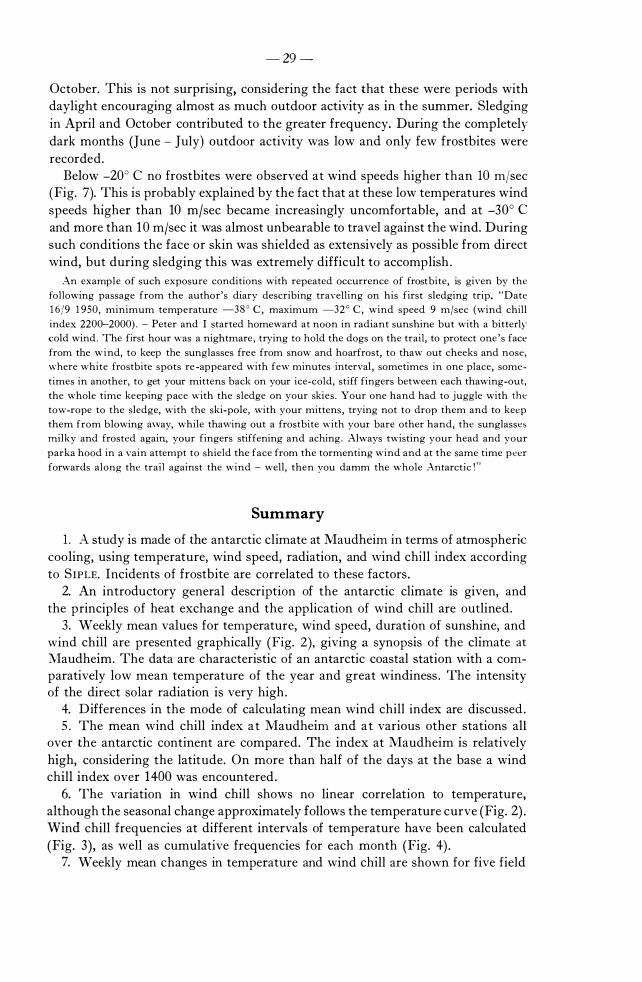
Sixty-nine cases of frost bite recorded on the NBSX, ranging from the blanchingof temporarily frozen skin to second degree injuries, have been plotted in relation to temperature and wind speed in Fig. 7. The curved parameter lines in the figure correspond to \Vind chill indices of 1400, 1 ROO and 2000, computed from the wind chill formula .
- 27 -
It must be pointed out that the temperature and wind observations for these cases have not been made simultaneously with the occurrence of frostbite. For 37 of the cases accurate temperature and wind speed data are available for the time at which they occurred . In 15 other cases shift ing weather conditions have made necessary the use of means of the extremes in temperature or wind at the time of occurrence. The remaining 17 cases were recorded in the field and for these accurate temperatures are available, but the wind speed was estimated . The error in the estimation of wind speed will be larger at higher wind speeds, but the differences between the wind chill values als o diminish with increasing wind speed . The error in the estimation of wind speed was probably not much more than about ± 10 %, but to be on the safe side it will be regarded as ± 20 %. The error of the calculated wind chill values would in this case amount to ± 5 . 8 % at 4 m/sec to ± 1.6 % at 20 m/sec at any temperature. An error of I O C in temperature would mean an error of l . S - 2.5 % in wind chill, depending on the wind speed. The presence of drifting snow probably contributed to the risk of freezing. Experiments by MASSEY ( 1959) in the Antarctic have shown that the added cooling factor of drift snow of ten results in frostbite .
From Fig. 7 it is evident that no frostbites occurred at temperatures above _8° C, and Table 3 shows that no wind chill values over 1400 were observed above this temperature. All cases of frostbite have occurred at wind chill values between 1400 and 2100, with the exception of one borderline case at 1 380. This case occurred during sledging against the wind (described as "bitterly cold" ) . The results are strongly in evidence of SIPLE'S assumption (Tab le 1 ) that exposed flesh begins to freeze at an index of 1400. Accepting this value, one will find from Table 3 and Fig. 3 that apparently there was no risk of frostbite at temperatures above _8e C at Maudheim, while below -30° C the hazard was permanently present . In the intermediate zone the chance of acquiring a frost b ite depended entirely upon the wind speed conditions.
Rate of occurrence
In the beginning of the soj ourn at Maudheim , careful note was made of all occasions of freezing of the skin . But as one became used to the conditions, less notice was paid to the continuous occurrence of frost marks . When a slight stinging sensation gave warning of a freezing spot, or ,vhen admonished by a companion, ane regularly thawed out the frostbite by the application of the warm, naked hand, or went indoors. One's face, ears, and finger-tips were constantly peeling from these small, iterated frostbites, especially during the winter season. :vIASSEY ( 1 959) found that after 6 weeks in the Antarctic there was an increased resistance to numbing of fingers exposed to wind and low temperature. He also found indications of greater immunity to frost b ite under experimental conditions in men staying a second consecutiye year. Although nearly three times as many frost bites were recorded during the first year of the �BSX, this cannot be taken as definite evidence of a successive decrease in the occurrence, but rather a tendency to report only the more marked cases . .-\t the same time as one learned by experience to protect oneself better, more exposure was also tolerated. There was an inclinatioJl
u UJ Il) ........ ::E
2 0
1 0 o UJ UJ CL Il)
o z
3: O
1 4 0 0
= o
+
+
0° - 1 0 ° T F::r-.� P E RA T U R E O (
- 28 -
1 8 0 0 2 0 0 0 W I N D ( H I L L I N D E X
+ +
•
_ 2 0 0 - 3 0 0 - 4 0 °
Fig . 7 . Recorded cases of frostbite in relation t o temperature and wind speed. Open circles mark cases
of frostbite that hm'e occurred during shi/ting meteorological conditions ( the mean of the extremes in
!emperature and zcind is plotted) . Dots with a �'ertical bar indicate cases of frostbite obsen'ed during
.\/edging (wind speed estimated). Black dots are frostbites with established data for tempemture and
zeind speed. The Cllrved parameter lines correspond to a zvind chill index of 1400, 1 800, and 2000
respectively.
for the men to wear less dothes during the course of the NBSX, as they became more used to the cold, and this was noticed especially during sledging tri ps, when the cold was more continuous . A study by GOLDSMITH ( 1 960) gives evidence that there is a voluntary reduction in the amount of dothing worn as men become more acclimat ized to the antaretie climate.
During more than half of the time at �1audheim it was possible for frost bite to occur, as a wind ehill index greater than 1400 was experienced on 55 % of the days. The distribution of the risk over the year can be estimated from Fig . 4 . In March a wind ehill of 1400 or more will be encountered only during 30 % of the time, and during less than 10 % of the time in Kovember to February. 'fhis agrees well with the recorded oecurrence of frostbites . Only 7 cases were reeorded in November to February (5 of these were observed by the author on himself) . It must be pointed out that these seven cases all occurred during sledging inland where high er wind chill values were experienced than at Maudheim. Furthermore, all of these frostbites occurred while travelling at night hours and were mainly situated on the shaded portion of the face. Snow drift was usually present . Quite a number of frostbites were seen in March (although only 2 eases were actually recorded), but on ly during sledging and at wind chill values well above 1400 (Fig. 6) . By far the major part of frostbites were observed during the mo nths of April to October. There are two definite peaks during the year, in April - May and in August - October, most eases being encountered in April and
- 29 -
October. This is not surprising, considering the fact that these were periods with daylight encouraging almost as much outdoor activity as in the summer. Sledging in April and October contributed to the greater frequency. During the completely dark months (June - July) outdoor activity was low and only few frostbites were recorded.
Below _200 C no frost bites were observed at wind speeds higher than 10 m/sec (Fig. 7). This is probably explained by the fact that at these low temperatures wind speeds higher than 10 m/sec became increasingly uncomfortable, and at -300 C and more than 1 0 m/sec it was almost unbearable to travel against the wind. During such conditions the face or skin was shielded as extensively as possible from direct wind, but during sledging this was extremely difficult to accomplish .
An example of such exposure conditions with repeated occurrence of frost bite, is given by the
following passage from the author's diary describing traveIling on his first sledging trip. "Date
1 6 /9 1 950, minimum temperature -3 8 0 C, maximum _3 2 ° C, wind speed 9 m/sec (wind chill
index 2200--2000) . - Peter and I started homeward at noon in radiant suns hine but with a bitterl)"
cold wind . The first ho ur was a nightmare, trying to hold the dogs on the trail, to protect one ' s face
from the wind, to keep the sunglasses free from snow and hoarfrost, to thaw out cheeks and nose,
where white frostbite spots re -appeared with few minutes interval , sometimes in one place, some
times in another, to get your mittens back on your ice-cold, stiff fingers between each thawing-out,
the whole time keeping pace with the sledge on your skies . Y our one hand had to juggle with the tow-rope to the sledge, with the ski-pole, with your mittens , trying not to drop them and to keep
them from blowing a,vay, while thawing out a frostbite with your bare other hand, the sunglasses
rnilky and frosted again, your fingers stiffening and aching. Always twisting your head and your
parka hood in a vain atternpt to shield the face from the tormenting wind and at the same time peer
forwards along the trail against the wind - well, then you damm the whole Antaretie ! "
Summary
1. A study is made of the antarctic climate at Maudheim in terms of atmospherie cooling, using temperature, wind speed, radiation, and wind chill index according to SIPLE. Incidents of frostbite are correlated to these factors .
2. An introductory general description of the antarctic climate is given, and the principles of heat exchange and the application of wind chill are outlined.
3 . Weekly mean values for temperature, wind speed, duration of sunshine, and wind chill are presented graphically (Fig. 2), giving a synopsis of the climate at :\1audheim. The data are characteristic of an antarctic coastal station with a comparatively low mean temperature of the year and great windiness . The intensity of the direct solar radiation is very high .
4. Differences in the mode of calculating mean wind chill index are discussed . 5 . The mean wind chill index a t Maudheim and a t various other stations all
over the antarctic continent are compared. The index at Maudheim is relatively high, considering the latitude. On more than half of the days at the base a wind chill index over 1400 was encountered .
6. The variation in wind chill shows no linear correlation to temperature, although the seasonal change approximately follows the temperature curve (Fig. 2) . Wind chill frequencies at different intervals of temperature have been calculated (Fig. 3) , as well as cumulative frequencies for each month (Fig. 4) .
7. Weekly mean changes in temperature and wind chill are shown for five field
- 30 -
parties travelling inland (Fig. 6) , with a description of travel routes. The higher wind chill indices encountered in the field are compared to those at Maudheim, and the deviations are diseussed.
8 . Factors influencing wind chill, as solar radiation and snow drift , are considered.
9 . The 69 incidents of freezing of exposed skin at Maudheim, for which meteorological data are available, are studied in relation to temperature, wind speed, and wind chill index. It is found that all the cases (Fig. 7) have occurred at wind chill values between 1400 and 2100 (at temperatures ranging from _8° C to ---46° C), which confirms the assumption of SIPLE that exposed flesh begins to freeze at a wind chill index of 1400.
10. The rate of occurrence of frostbite in different seasons and at different temperatures is als o diseussed.
Acknowledgements To my comrades, ALAN REECE (who so unfortunately lost his life in the Arctic, after two sojourns
in the Antarctic), FRED RooTs, and CHARLES SWITHINBANK, I wish to express my gre at appreciation
of their perseverance in carrying out the meteorological observations in the field during sledging
under adverse circumstances. I gratefully acknowledge the invaluable criticism and kind help of Professor HANS RONGE, Head of the Department of Hygiene, University of Lund. I als o wish to
thank Professor COSTA LILJEQUIST, meteorologist of our expedition, and Docent VALTER SCHYTT,
my sledging companion during twa field seasons, for critically reading the manuscript and offering
their advice. My work has been carried out with the aid of a grant from Norsk Polarinstitutt, for
which I express my sincere gratitude.
References BEDFORD, T . , 1 948 : Basic Principles of Ventilation and Heating. H. K. Lewis & Co . Ltd . , London.
45, 90.
BOD MAN, G., 1 908 : Das Klima als eine Funktion von Temperatur und Windgeschwindigkeit .
Wissensch. Ergebn. der Schwedischen Siidpolar-Expedition 1901-1903. Il, lief. 1 . Stockholm.
BREBBIA, D . R, R. F. GOLDMAN, and E. R. BUSKIRK, 1 957 : Water vapor loss from the respiratory
tract during outdoor exercise in the cold. U. S. Army Quartermaster Research and Dezoel
opment Center. Environ. Protect. Res. Div. Tech. Rep. EP-57 . Natick, Mass.
BRECKENRIDGE, J . R , and A. H. WOODCOCK, 1 950 : Effects of wind on insulation of arctic clothing.
Quartermaster Climatic Research Laboratory. Environ. Protect. Section Rep. �o. 1 64.
Lawrence, lVIass.
BURTON, A. C . , and O. G. EDHOLM, 1 9 5 5 : -'I.fan in a Cold Environment. Edward Arnold Ltd . ,
London ; Williams and Wilkins, Baltimore.
CHRENKO, F. A. , and L. G. C. E. PUGH, 1 961 : The contribution of solar radiation to the thermal .
environment of man in Antaretica. Proc. roy. SOC. 155 B, 243-265 . London.
COVRT, A. , 1 948 : Wind chill . Bull. Amer.met. Soc. 29, 487-493 . Easton, Pa.
FALKOWSKI, S. J . , and A. D. HASTINGS JR . , 1958 : Windchill m the Northern Hemispherc .
U. S. Army Quartermaster Research and Engineering Center. Environ. Protect. Res. Dit, .
Tech. Rep. EP-82. Natick, Mass.
GIAEVER, J . , 1 952 : Maudheim. To år i Antarktis. Gyldendal Norsk Forlag, Oslo. 257-258 .
1 954 : The White Desert. The Official Account of the Norwegian-British-Swedish
Antaretie Expedition. Chatto and Windus, London. 269-272, 291 . Clarke, Irwin and Co . ,
Toronto ; Dutton, New York (1 955) .
GOLD, E . , 1 93 5 : The effect of wind, temperature, humidity, and sunshine on the loss of heat of a
body at temperature 98° F. Quart. J. roy. met. SOC. 61, 3 1 6-343 . London .
GOLDS:\HTH, R . , 1 960 : Use of clothing records to demon st rate acclimatization to cold in man .
J. appl. Physiol. 15, 776-780. Washington, D. C .
HAN:s', J . and R SORING, 1 9 3 9 : Lehrbueh der J;feteorologie. I. 5 . Auf!. \Yillibald Keller,
Leipzig. 5 1 .
HISDAL, V., 1 958 : \Vind. Surface Observations . 1Vorwegian-British-Su'edish Antaretie Expedition,
1949-52. Sei. Res. I, Part 2 B. Norsk Polarinstitutt, Oslo.
1 960 : Temperature . Surface Observations. Ibid. Part 2 C.
O. AMBLE, and N. J . SCHUMACHER, 1 956 : Air Pressure . Surface Observations. Ibid.
Part 2 A.
LILJEQUlST, G. H. , 1 954 : Radiation, and wind and temperature profiles over an antaretie snow
field - a preliminary note. Proe. Toronto lVIet. Conj. , 1953. Roy. Met. Soc . , London. 78-87.
1 956 a: Short-Wave Radiation. Energy Exchange of an Antaretie Snow-Field.
Norwegian-British-Swedish Antaretie Expedition, 1949-52. Sei. Res. Il, Part 1 A. Norsk
Polarinstitutt, Oslo.
1 956 b : Long-Wave Radiation and Radiation Balance. Energy Exchange of an Antaretie
Snow-Field. Ibid. Part 1 B .
1 957 a : Wind Structure i n the Low Layer. Energy Exchange o f an Antaretie Snow- Field .
Ibid. Part 1 C.
- 32 -
LILJEQUIST, G. H . , 1 957 b : Surface Inversions and Turbulent Heat Transfer. Energy Exchange
of an Antarctic Snow-Field. Ibid. Part 1 D .
1958 : Long-wave radiation and turbulent heat transfer i n the antarctic winter. Polar
Atmosphere Symposium, Part I, lvIeteorology Section. Pergamon Press, Oxford, London,
.t-;ew York, Paris, Los Angeles. 1 67-1 81 .
�L�SSEY, P. M. O . , 1 959 : Finger numbness and temperature in Antarctica . J. appl. Physiol. 14, 61 6-620. Washington, D. C.
lVIoLKAR, G . W. , 1 960 : An evaluation of wind chill . In : Cold Injury ( 5 . ;VI. HORvATH, editor) .
Trans. Sixth Conf. , 1 958, Fort Knox. Josiah Macy Jr. Foundation , .t-;ew York . 1 7 5-221 .
PUGH , L. G. C. E . , and F. A. CHRE='KO, 1962 : Observations of the effects of solar radiation on
the thermal environment inside tents in Antaretica. Ann. occup . Hyg. 5, 1-5 . Oxford, Engl .
RUBll', M. J . . 1 962 : The Antaretie and the weather. Sei. Amer. 207 (3) , 84-94 . )Jew York.
SAPIl'-JALOUSTRE, J . . 1 9 5 5 : Contribution it l ' etude de l ' acclimation de l ' homme et des vertebres
superieurs dans l 'Antarctique et plus specialement en Terre AdClie . Biol. med. 44 , 1 5-72 .
Paris .
SCHC\IACHER, �. J . . 1 952 : The JVlaudheim Expedition, 1 949-52. Part I & Il . Weather 7, 3 1 4-3 1 9 ,
327-3 34 . London .
SCHUMA:-I, L. M . , 1 954 : Epidemiology of co Id injury in man . In : Cold Injllry (lvI. I . FERREH,
editor) . Trans. Second Conf. , 1 952, New York. Josiah Macy Jr. Foundation, New York .
1 1 -84 .
S J PLE, P. A . , 1 945 : General principles gO\'erning selection of clothing for cold climates. Proc .
Amer. phil. Soc. 89, 200-234. Philadelphia.
1 958 : Man ' s first winter at the 50uth Pole. Nat. Geogr. jl;]ag. 113 , 43 9-478 .
Washington, D . C .
1 960 : Living o n the South Polar Ice Cap. In : Cold Injllry (5 . I\L HORvATH, editor) .
Trans. Sixth Conf. , 1 958, Fort Knox. Josiah Macy Jr . Foundation, New York. 89-1 1 5 .
and C . F . PASSEL, 1 945 : Measurements o f dry atmospheric cooling in subfreezing
temperatures . Proc. Amer. phil. Soc. 89, 1 77-1 99 . Philadelphia.
STONE, R. G., 1 943 : On the practical evaluation and interpretation of the cooling power in bioclimatology ( I & Il) . Bull. Amer. met . Soc. 24, 295-305 , 3 27-339 . Easton, Pa.
VJ='JE, T., 1 962 : The cooling power in Antarctica. Norsk Polarinstitutt Arbok 1 961 . 7-22. Oslo .
\\'EBB, P. , 1955 : Heat loss from the respiratory tract in cold. A rctic Aeromed. Lab. Rep. )io . 3 , Proj . No. 7-795 1 . Ladd Air Force Base, Alaska.
\VEXLER, H., and M. J . RUBIN, 1 96 1 : Antarctic meteorology. In : Science in Antaretica, Part Il. The Physical Sciences in Antaretica. A Rep . by the Committee on Polar Res. Publ. 878 .
Nat. Acad . Sei . - )Jat . Res . Council , Washington, D . C .
S K R I FTER Skrifter Nr. 1-99, see numbers of Skrifter previous to Nr. 100.
Nr. 1 00. PADGET, PETER : Notes on some Corals from Late Paleozoic Rocks of Inner Isfjorden, Spits
bergen. 1 954. Kr. 1 .00. 1 0 1 . MATHISEN, TRYGVE : Svalbard in International Politics 1871-1925. 1 954. Kr. 1 8.00. 1 02. RODAHL, KÅRE : Studies on the Blood and Blood Pressure in the Eskimo, and the Significanee
of Ketosis uTIder Arctic Conditions. 1 954. Kr. 1 0.00. 103. LØVENSKIOLD, H. L. : Studies on the Avifauna of Spitsbergen. 1 954. Kr. 1 6.00. 1 04. HORNBÆK, HELGE : Tidal Observations in the Arctic 1946-52. 1 954. Kr. 2.50. 105 ABS, OTTO und HANS WALTER SCHMIDT : Die arktische Trichinose und ihr Verbreitungsweg.
1 954. Kr. 4.00. 1 06. MAJOR, HARALD and THORE S. WINSNES : Cambrian and Ordovician Fossils from Sørkapp
Land, Spitsbergen. 1 95 5 . Kr. 4.00. 1 07. FEYLING-HANSSEN, ROLF W. : Stratigraphy of the Marine Late-Pleistocene of Billefjorden,
Vestspitsbergen. 1 95 5 . Kr. 22.00. 108. FEYLING-HANSSEN, ROLF W. : Late-Pleistocene Deposits at Kapp Wijk, Vestspitsbergen.
1 95 5 . Kr. 3.00. 109. DONNER, J. J. and R. G. WEST : The Quaternary Geology of Brageneset, Nordaustlandet,
Spitsbergen. 1 957. Kr. 5.00. 1 1 0. LUNDQUIST, KAARE Z. : Magnetie Observations in Svalbard 1596-1953. 1 957. Kr. 6 .00. 1 1 1 . SVERDRUP, H. U. : The Stress of the Wind on the lee of the Polar Sea. 1 957. Kr. 2.00. 1 1 2. ORVIN, ANDERS K. : Supplement l to the Place-names of Svalbard. Dealing with new Names
1935-55. 1 958. Kr. 1 3 . 00. 1 1 3 . SOOT-RYEN, TRON : Pelecypods from East-Greenland. 1 958. Kr. 4.00. 1 14. HOEL, ADOLF and WERNER WERENSKIOLD : Glaeiers and Snowfields in Norway. 1 962.
Kr. 40.00. 1 1 5 . GROOM, G. E. and M. M. SWEETING : Valleys and Raised Beaches in Bunsow Land,
Central Vestspitsbergen. 1 958. Kr. 3 .00. 1 1 6. SVENDSEN, PER : The Algal Vegetation of Spitsbergen. 1 959. Kr. 7.00. 1 1 7. HEINTZ, NATASCHA : The Downtonian and Devonian Vertebrates of Spitsbergen. X. Two
new Speeies of the Genus Pteraspisfrom the Wood Bay Series in Spitsbergen. 1 960. Kr. 3 .00. 1 1 8. RODAHL, KÅRE : Nutritional Requirements under Arctic Conditions. 1 960. Kr. 8.00. 1 1 9. RApp, ANDERS : Talus Slopes and Mountain Walls at Tempelfjorden, Spitsbergen. 1 960.
Kr. 25.00. 1 20. ORVIN, ANDERS K. : The Place-names of Jan Mayen. 1 960. Kr. 1 4.00. 1 2 1 . CARSTENS, HARALD : Cristobalite- Trachytes of Jan Mayen. 1 96 1 . Kr. 3 .00. 1 22. HOLLAND, MICHAEL FRANK WILLIAM : The Geology of Certain Parts of Eastern Spits-
bergen. 1 96 1 . Kr. 12.00. 123. LUNDE, TORBJØRN : On the Snow Accumulation in Dronning Maud Land. 1 961 . Kr. 9.00. 1 24. RØNNING, OLAF 1 . : Some New Contributions to the Flora of Svalbard. 1 961 . Kr. 3 .00. 125 . MANUM, SVEIN : Studies in the Tertiary Flora of Spitsbergen, with Notes on Tertiary Floras
of Ellesmere Island, Greenland, and leeland. A Palynological investigation. 1 962. Kr. 26.00. 126. HOEL, ADOLF and JOHANNES NORVIK : Glaciological Bibliography of Norway. 1 962. Kr. 30.00. 1 27. GOBBETT, DEREK JOHN : CarboTliferous and Permian Brachiopods of Svalbard. Kr. 32.50. 1 28. WILSON, OVE : Cooling Effect of an Antaretie Climate on Man. 1963. Kr. 4.00.
C HARTS
501 Bjørnøya • . . . . . . . . • . • • . . • • • . . . . . . . • . . . . . • . . . . . . . . . • . • . • .
502 Bjørnøyfarvatnet . . . . . . . . . . . . . . . . . . . . . . . . • . . . . . . . . . . . • . • .
503 Frå Bellsund til Forlandsrevet med Isfjorden . . . . . . . • . . . . . . . .
504 Frå Sørkapp til Bellsund . . . . . . . . . . . . . . . . . . . . . . . . • • • . . . • . • .
505 Norge-Svalbard, northern sheet • • . . . . . • . . . . . . . • • . . . . . . . . • .
506 . & southern & • • • • • • • • • • • • • • • • • • • • • • • • • • •
507 Nordsvalbard . . . . . . . . . . . . . . . . . . . . . . . . . . . . . . . . . . • . . . . . . . .
508 Kongsfjorden og Krossfjorden . . . . . . . . . . . . . . • . . . . . • . . • • . • •
509 Frå Storfjord renna til Forlandsrevet med Isfjorden . . • . . . . . • .
5 1 0 Frå Kapp Linne med Isfjorden til Sorgfjorden . . . . . . . . . . . . • .
5 1 1 østgrønland, fra Liverpool Kyst til Store Koldeweys ø (rev. 1 958) . . . . . . . . . . . . . . . • . . . . . . . . . . . . . . . . . . . . . . . . . . . . .
5 1 2 Jan Mayen . . . . . . . . . . . . . . . • . • . • . • . . . • . . . . . • . . . . . . . . . . . • •
5 1 3 Svalbard-Havner • . . . . . . . • • • • . . • • • • . . . . . . . . . . . . • . • • • . • . . .
5 1 4 Barentshavet . . . . . • . . . . . . . • . • • • . • . • . . . • • . . . . • . . . . • • . . . . .
5 1 5 Svalbard-Grønland . . . . . . . . • . • • . • . . . . . . • . . . . • . . . . • • • • • • • .
The charts are distributed by Norges Sjøkartverk, Stavanger.
1 : 40,000 1 :3 50,000 1 :200,000 1 :200,000 1 :750,000 1 :750,000 1 :600,000 1 : 100,000 1 :3 50,000 1 :350,000
1 :600,000 1 : 100,000
various 1 :2,000,000 1 :2,000,000
1 932 1 937 1 932 1 934 1 933 1 933 1 934 1 934 1 946 1 946
1 937 1955 1 959 1 960 1 962
Kr. 1 0.00 1 0.00 10.00 1 0.00 10 .00 1 0.00 1 0.00 1 0.00 1 0.00 1 0.00
1 0.00 1 0.00 10.00 1 0.00 1 0.00
MAPS General, geographical, topographica1, and technica1 maps :
D R O N N I N G M A U D L A N D Kr. Giæverryggen . . . . . . . . . . . . . F 5 Borgmassivet . . . . . . • • • . • . . . F 6 Kirwanveggen • . . . . . . . . • . . . F 7 Ahlmannryggen • . • . • . . . . . . . G 5 Jutulstraumen . . . . . . • . . . . . . G 6 Neumayerskarvet . . . . . . . . . . G 7 Jutulgryta . . . . . . . . . . . . . . . . H 5 H. U. SverdrupfjelJa . . . . . . . H 6 MiihJig-Hofmannfjella Sør . . . J 6 Filchnerfjella Sør . . . . . . . . . . . K 6 Sør-Rondane . . . . . . . . . . . . . . . . . . .
G R Ø N L A N D , Austgrønland
Eirik Raudes Land frå Sofiasund til Youngsund
Claveringøya . . . . . . . . . . . . . . . . . . .
Geographical Society-øya Jordan Hill . . . . . . . • • • . • . • . . . . . •
J A N M A Y E N
Jan Mayen . . . . . . . . . . . . . . . . . . . . .
Sør-Jan . . . . . . . . . . . . . . . . . Sheet 1 Nord-Jan . . . . . . . . . . . . . . . • 2
S V A L B A R D
Svalbard . . . . . . . . . . • • . . . . . . . . . . .
Kongsfjorden • . • . . . . . . . . . . . A 7 Prins Karls Forland . . . . . . . . A 8 Isfjorden . . . . . . . . . . . . . . . . • . B 9 Van Mijenfjorden . . . . • . . . . . B 1 0 Van Keulenfjorden . • . . . . . . . B 1 1 Torellbreen . . . . . • . . . . . . . . . B 1 2 Adventdalen . . . • • . . . . . . . . . C 9 Markhambreen . . . . . . . . . . . . C 1 2 Sørkapp . . . . . . . . . . . . . . . . . . C 1 3 Adventfjorden-Braganzavågen Hopen . . . . . . . . . . . . . . . . . . . . . . . . •
The Claims to Land in Svalbard . . . . . . . . . . . . . . . . . .
Bjørnøya . . . . . . . . . . . . . . . . . . . . • • .
Bjørnøya • • . . . . • . . . . . . . . . . . . . . . .
1 :250,000 1 :250,000 1 :250,000 1 :250,000 1 :250,000 1 :250,000 1 :250,000 1 :250,000 1 :250,000 1 :250,000 1 :250,000
1 :200,000 1 :1 00,000 1 : 100,000 1 :1 00,000
1 :1 00,000 l : 50,000 l : 50,000
1 :2,000,000 1 : 1 00,000 1 : 100,000 1 :1 00,000 1 :1 00,000 1 : 100,000 1 :1 00,000 1 : 1 00,000 1 :1 00,000 1 : 100,000 1 : 100,000 1 :100,000
1 : 50,000 l : 25,000
l : 10,000
1 962 1 962 1 961 1 961 1 961 1 961 1 961 1 961 1 962 1 962 1 957
1 932 1 937 1 937 1937
1 955 1 959 1 959
1 958 1 962 1 959 1 955 1 948 1 952 1 953 1 950 1 957 1 947 1 941 1 949
1 927 1 925
1 925
5.55 5.55 5.55 5.55 5.55 5.55 5.55 5.55 5 . 5 5 5.55 5.55
2.20
. . . . } Published by NSIU 1 937.
. . . . Limited stock, not for sale.
2.20 Preliminary msp. 5.55 } Also as supplement to Skrifter 5.55 Nr. 120.
2.20 Latest edition. 5.55 5.55 5.55 5.55 5.55 5.55 5.55 5.55 5.55 2.20 2.20 Preliminary msp.
2.20 esch. Nos. 1 -33. 5.55 New ed. 1 944 and 1955. Also • •
supplement to Skrifter Nr. 86. 6 sheets. Out of print.
The msps are distributed by Norges Geografiske Oppmåling, St. Olavs gt. 32, Oslo.
Wall map : Norden og Norskehavet . . • . • • • . . . 1 :2,500,000 1 959 Revised edition.
Obtainable through H. Aschehoug & Co. (W. Nygaard) AlS, 0.10.
A.VI. BR0GGEllS BOKTll YKKERI AlS - OSLO