Embed Size (px)
Citation preview
Cool communities: Urban trees, climate and health
Helen Brown, Dianne Katscherian, May Carter, Jeff Spickett
ii
Acknowledgements This report emanated from a workshop held at the Department of Planning on 14 March 2013. The workshop formed part of a PhD study being undertaken at Curtin University by Helen Brown. A more in-depth analysis of the workshop and other aspects of the research will be contained in the resulting thesis and publications. The purpose of this report is to convey the key messages from the workshop and encourage further collaborative action on the issue. The research is part of Project 7 of the Urbanism, Climate Adaptation and Health Cluster funded by the CSIRO Climate Adaptation Flagship. Project 7 is focused on improving our understanding of interactions between climate and health in urban areas. Effective climate adaptation requires a better awareness of how these interactions influence behaviour in the area of interest. The expertise and contribution by workshop attendees is gratefully acknowledged. These participants are listed in Appendix Two. Expertise provided by members of Project 7 – Tony Capon, Katrina Proust and Barry Newell, is also gratefully acknowledged. Helen Brown, Dianne Katscherian, May Carter and Jeff Spickett prepared this document. The report can be downloaded from http://ehia.curtin.edu.au/projects/climatechange.cfm Correspondence regarding the document should be sent to [email protected]
iii
Executive Summary
Climate and health: Urban environments and trees
Our warming climate has the potential to have adverse effects on our health and wellbeing. People who live in urban environments are particularly susceptible as Urban Heat Islands (UHI) can be created in built up areas through storage and reflection of the solar radiation from building and construction materials. The effects of UHI can be reduced by green spaces and vegetation, which can cool local environments and provide other aesthetic and environmental advantages. Trees have been shown to provide the greatest benefits to people and the environment, and international and national support for the retention and replacement of urban trees is strong. Directions 2031 and Beyond, Perth’s current state planning framework, emphasises the need to limit peri-urban greenfield development through urban infill. The policy also endorses development of a green vibrant Perth and Peel region. Management processes for urban infill have been established but there are few clearly developed processes for management of trees. A workshop was held to consider issues relating to tree canopy management in the metropolitan area. The outcomes of the workshop demonstrate potential directions and strategies to achieve cooler and healthier environments for Perth’s communities.
Recommendations
The recommendations arising from the workshop include:
Initiation of mechanisms to understand Perth’s UHI vulnerabilities through
appropriate studies and monitoring
Setting targets and measuring progress toward agreed tree canopy target
Accounting for health, environmental and social costs of tree removal
Increasing knowledge and communicating information about tree canopy effects
Establishing a cross-sector working group with key stakeholders from planning,
development, environment, health and community sectors
Considering the value and importance of an Urban Forest Management Strategy for
the Perth and Peel region
Establishing central government support for tree canopy management strategies to
be developed at a local government level

iv
Table of Contents
Executive Summary ............................................................................................................... iii Climate and health: Urban environments and trees ......................................................... iii Recommendations ............................................................................................................ iii
Part A: Climate and health: Urban environments and trees ................................................... 2 Introduction ....................................................................................................................... 2
Urban form and heat ...................................................................................................... 3 Heat and Health ............................................................................................................. 5 UHI and Trees ................................................................................................................. 6 Urban Planning and Health: The Role of Trees ................................................................ 6 Current urban planning in Perth ..................................................................................... 7 Tree Canopy Management and Urban Consolidation ...................................................... 8 Retaining and Restoring Perth’s Trees........................................................................... 11
Part B: The Workshop .......................................................................................................... 12 Pre-workshop ................................................................................................................... 12
Benefits of tree canopy ................................................................................................. 12 Barriers to planting or retaining trees ........................................................................... 14 Strategies ..................................................................................................................... 14
Workshop ........................................................................................................................ 16 Individual and pair-blended influence diagrams ............................................................ 16 Identification of key variables ....................................................................................... 19 Key variable opportunities and conflicts ....................................................................... 20 Urban Design ................................................................................................................ 22 Market Value and Drivers ............................................................................................. 22 Economic Value of Trees ............................................................................................... 23
Discussion ............................................................................................................................ 24 Urbanisation Policies - the impact on tree canopy and Perth’s Vision ............................. 24 The key role of community awareness ............................................................................. 25 Economic and market considerations .............................................................................. 26
Final Statement .................................................................................................................... 28
Appendices ........................................................................................................................... 29 Appendix 1: Pre-Workshop Survey................................................................................... 29 Appendix 2: Participants .................................................................................................. 33
References ........................................................................................................................... 34

2
Part A: Climate and health: Urban environments and trees
Introduction
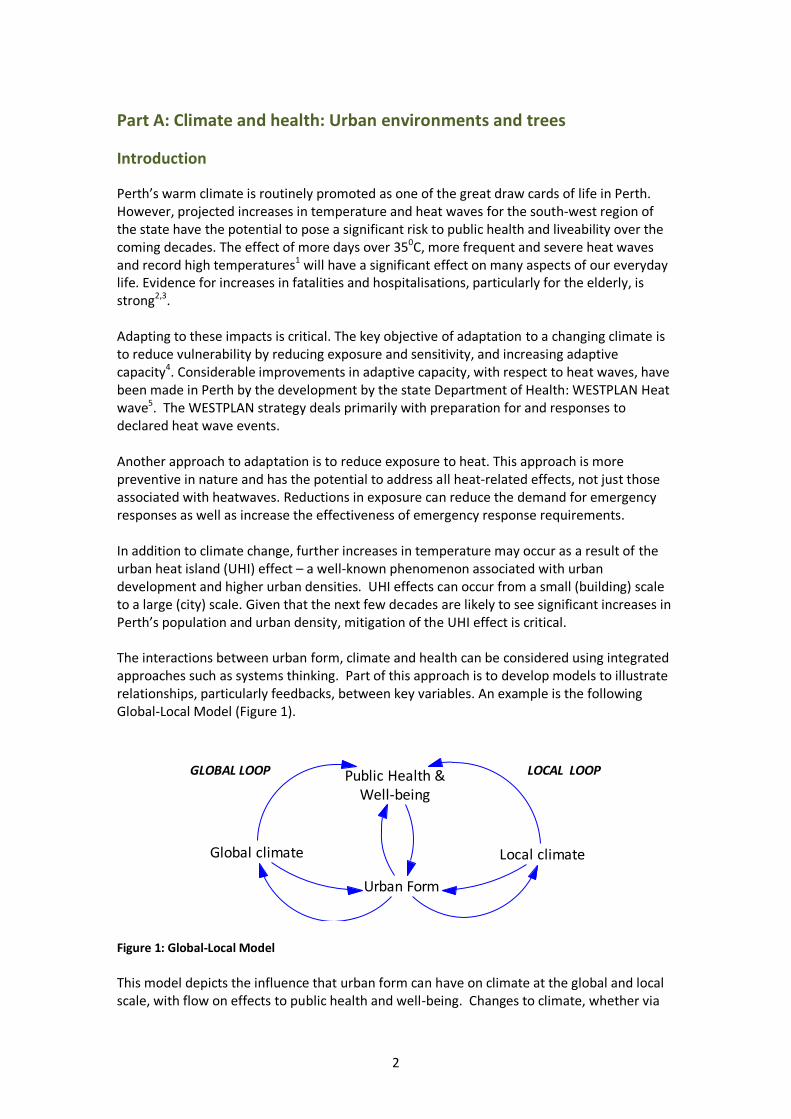
Perth’s warm climate is routinely promoted as one of the great draw cards of life in Perth. However, projected increases in temperature and heat waves for the south-west region of the state have the potential to pose a significant risk to public health and liveability over the coming decades. The effect of more days over 350C, more frequent and severe heat waves and record high temperatures1 will have a significant effect on many aspects of our everyday life. Evidence for increases in fatalities and hospitalisations, particularly for the elderly, is strong2,3. Adapting to these impacts is critical. The key objective of adaptation to a changing climate is to reduce vulnerability by reducing exposure and sensitivity, and increasing adaptive capacity4. Considerable improvements in adaptive capacity, with respect to heat waves, have been made in Perth by the development by the state Department of Health: WESTPLAN Heat wave5. The WESTPLAN strategy deals primarily with preparation for and responses to declared heat wave events. Another approach to adaptation is to reduce exposure to heat. This approach is more preventive in nature and has the potential to address all heat-related effects, not just those associated with heatwaves. Reductions in exposure can reduce the demand for emergency responses as well as increase the effectiveness of emergency response requirements. In addition to climate change, further increases in temperature may occur as a result of the urban heat island (UHI) effect – a well-known phenomenon associated with urban development and higher urban densities. UHI effects can occur from a small (building) scale to a large (city) scale. Given that the next few decades are likely to see significant increases in Perth’s population and urban density, mitigation of the UHI effect is critical. The interactions between urban form, climate and health can be considered using integrated approaches such as systems thinking. Part of this approach is to develop models to illustrate relationships, particularly feedbacks, between key variables. An example is the following Global-Local Model (Figure 1).
Figure 1: Global-Local Model
This model depicts the influence that urban form can have on climate at the global and local scale, with flow on effects to public health and well-being. Changes to climate, whether via
Public Health &Well-being
Global climate
Urban Form
Local climate
GLOBAL LOOP LOCAL LOOP
3
the global or local loops, will influence urban form. The model also demonstrates the connections between urban form and public health. This conceptual model can help to direct work aimed at developing a better understanding of the urban health-climate system. The next step is to reduce this broad model to more specific issues of interest within the urban health-climate system. In this case, the interest is the management of tree canopy within the ‘local loop’. Vegetation, particularly trees, play a fundamental role in UHI mitigation. Given the foreseeable pressures that are expected to affect tree canopy levels in Perth over the coming decades, it is important that urban consolidation occurs alongside effective management of trees and other vegetation. In response to the need for a multi-disciplinary approach to management of tree canopy in urban areas, a workshop was held in March 2013 with 34 participants from health, planning, development, horticulture and environment sectors. Attendees included representatives from state and local government and the private sector. The workshop focused on tree canopy management in areas targeted for urban infill. This report has been produced to provide:
An overview of current research and management strategies relating to trees, heat and health;
A record of the workshop activities and outcomes; and
A summary of key recommendations for further action.
Urban form and heat
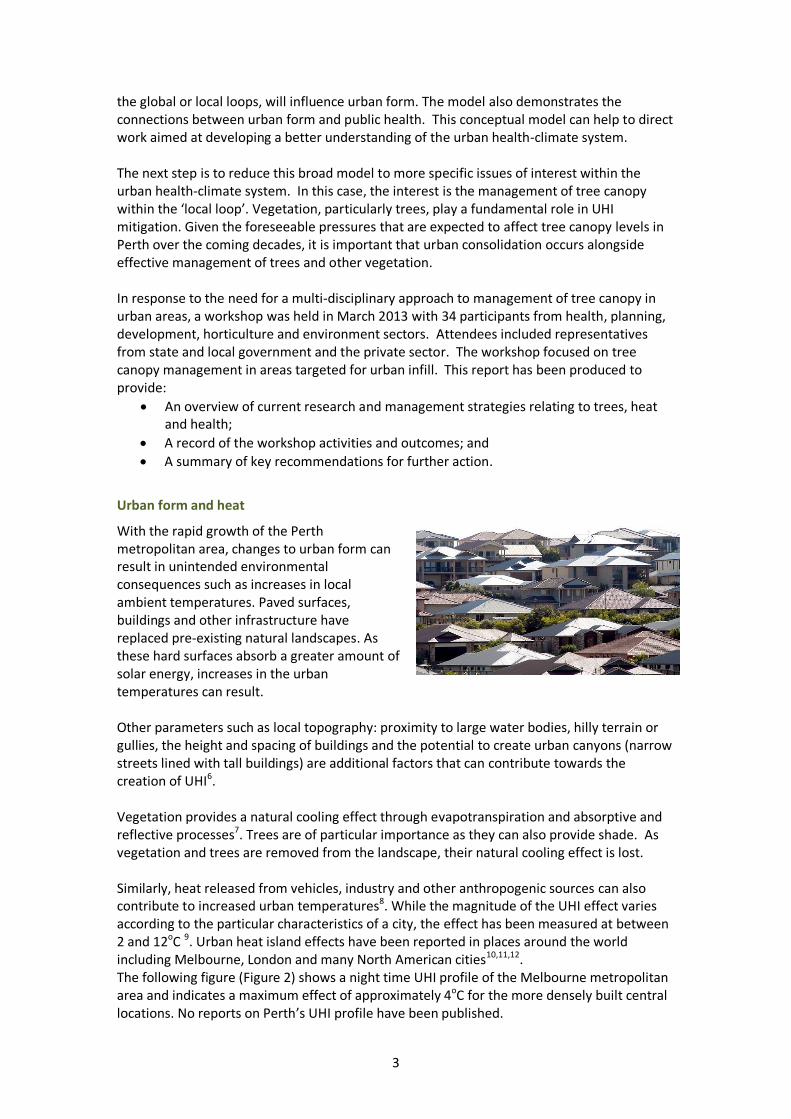
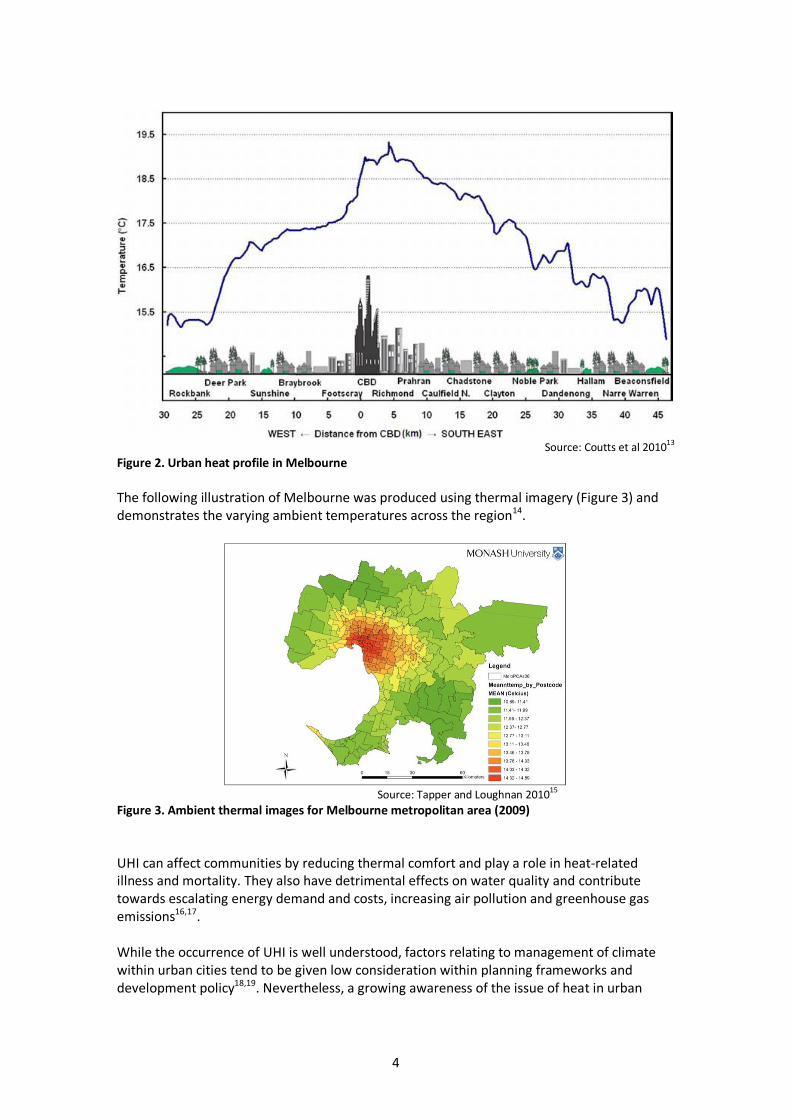
With the rapid growth of the Perth metropolitan area, changes to urban form can result in unintended environmental consequences such as increases in local ambient temperatures. Paved surfaces, buildings and other infrastructure have replaced pre-existing natural landscapes. As these hard surfaces absorb a greater amount of solar energy, increases in the urban temperatures can result. Other parameters such as local topography: proximity to large water bodies, hilly terrain or gullies, the height and spacing of buildings and the potential to create urban canyons (narrow streets lined with tall buildings) are additional factors that can contribute towards the creation of UHI6. Vegetation provides a natural cooling effect through evapotranspiration and absorptive and reflective processes7. Trees are of particular importance as they can also provide shade. As vegetation and trees are removed from the landscape, their natural cooling effect is lost. Similarly, heat released from vehicles, industry and other anthropogenic sources can also contribute to increased urban temperatures8. While the magnitude of the UHI effect varies according to the particular characteristics of a city, the effect has been measured at between 2 and 12oC 9. Urban heat island effects have been reported in places around the world including Melbourne, London and many North American cities10,11,12. The following figure (Figure 2) shows a night time UHI profile of the Melbourne metropolitan area and indicates a maximum effect of approximately 4oC for the more densely built central locations. No reports on Perth’s UHI profile have been published.
4
Source: Coutts et al 201013
Figure 2. Urban heat profile in Melbourne
The following illustration of Melbourne was produced using thermal imagery (Figure 3) and demonstrates the varying ambient temperatures across the region14.
Source: Tapper and Loughnan 201015
Figure 3. Ambient thermal images for Melbourne metropolitan area (2009)
UHI can affect communities by reducing thermal comfort and play a role in heat-related illness and mortality. They also have detrimental effects on water quality and contribute towards escalating energy demand and costs, increasing air pollution and greenhouse gas emissions16,17. While the occurrence of UHI is well understood, factors relating to management of climate within urban cities tend to be given low consideration within planning frameworks and development policy18,19. Nevertheless, a growing awareness of the issue of heat in urban
5
areas – particularly as a result of the European heatwaves of 2003 and climate change projections, suggests that it is an emerging issue. Perth’s Capital City Framework released in early 2013, recognises the role that urban design can play in terms of influencing climate: “….a healthier city…where the city’s climate is ameliorated by natural spaces, tree canopy and innovative building design”20.
Heat and Health
Temperature and humidity influence thermal comfort and for most people the optimal range for air temperature is between 20°C and 27°C and when relative humidity is from 35 to 60%. The body has coping mechanisms for additional heat but placing these under stress can lead to a variety of serious and possibly fatal conditions. Table 1 summarises some of the health effects that can arise from increasing temperatures21. Table 1. Problems and symptoms caused by hot temperatures
Temperature Range (°C) Effects Potential outcomes
20 - 27°C Comfort Zone Maximum efficiency
As temperature increases
Discomfort:
Increased irritability
Loss of concentration
Loss of efficiency in mental tasks
Mental Problems
Increase of errors:
Loss of efficiency in mental tasks
More incidents
Psycho-physiological problems
Increase of performance of heavy work:
Disturbed water and electrolyte balance
Heavy load on heart and circulation
Fatigue and threat of exhaustion
Physiological problems
35 - 40°C Limit of high temperature tolerance
Source: CCOHS 201322
The direct impacts of heat exposure are well documented and include the heat-related illnesses of heat fatigue, exhaustion, heat rash, cramps and oedema, as well as heat stroke and sunstroke23. Vulnerable groups within the community that face increased risks to health from heat include older people, very young children, people with disabilities, indigenous communities, homeless people and those whose health is already compromised by other conditions24. Heat-related illnesses place additional stress on health infrastructure and can cause significant economic costs. Prolonged periods of high temperatures can interfere with daily activities and increase the potential for mistakes or injuries, reduce productivity, cause sleep deprivation and reduce physical performance. Motivation and general well-being can be detrimentally affected and studies have shown increases in aggressive and violent behaviour25. Studies have also shown that men are generally more tolerant to heat than women, especially under dry conditions26.
6
The 2009 heatwave in Victoria resulted in an additional 374 deaths and a 25% increase in emergency ambulance dispatches27. The National Health and Medical Research Council has estimated that Australian deaths attributed to heat could reach 2500 per year by 202028. People living in areas where the propensity to create UHI is increased due to the physical characteristics of the natural and built local environment, may face additional vulnerabilities.
UHI and Trees
Adaptation actions to reduce the effects of adverse climatic effects such as heat events and high temperatures should include consideration of the role of trees in urban environments. Trees can have a direct effect on the regulation of local temperatures through evapotranspiration and shading.
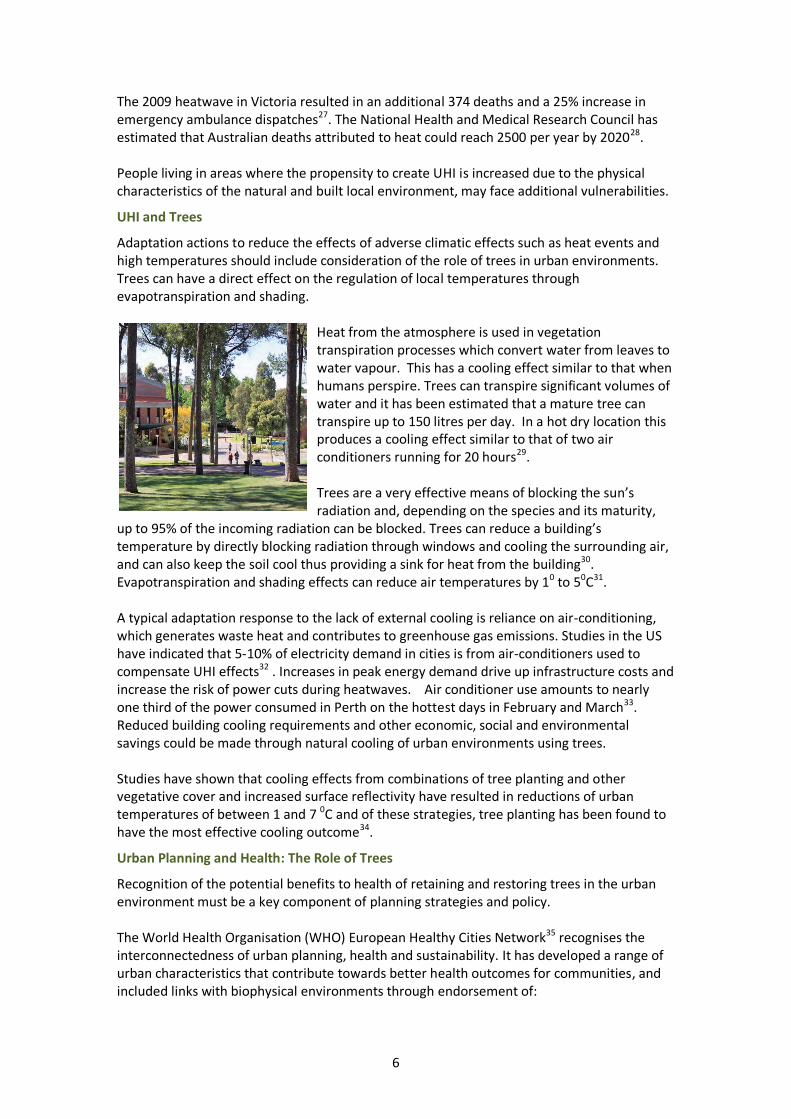
Heat from the atmosphere is used in vegetation transpiration processes which convert water from leaves to water vapour. This has a cooling effect similar to that when humans perspire. Trees can transpire significant volumes of water and it has been estimated that a mature tree can transpire up to 150 litres per day. In a hot dry location this produces a cooling effect similar to that of two air conditioners running for 20 hours29. Trees are a very effective means of blocking the sun’s radiation and, depending on the species and its maturity,
up to 95% of the incoming radiation can be blocked. Trees can reduce a building’s temperature by directly blocking radiation through windows and cooling the surrounding air, and can also keep the soil cool thus providing a sink for heat from the building30. Evapotranspiration and shading effects can reduce air temperatures by 10 to 50C31. A typical adaptation response to the lack of external cooling is reliance on air-conditioning, which generates waste heat and contributes to greenhouse gas emissions. Studies in the US have indicated that 5-10% of electricity demand in cities is from air-conditioners used to compensate UHI effects32 . Increases in peak energy demand drive up infrastructure costs and increase the risk of power cuts during heatwaves. Air conditioner use amounts to nearly one third of the power consumed in Perth on the hottest days in February and March33. Reduced building cooling requirements and other economic, social and environmental savings could be made through natural cooling of urban environments using trees. Studies have shown that cooling effects from combinations of tree planting and other vegetative cover and increased surface reflectivity have resulted in reductions of urban temperatures of between 1 and 7 0C and of these strategies, tree planting has been found to have the most effective cooling outcome34.
Urban Planning and Health: The Role of Trees
Recognition of the potential benefits to health of retaining and restoring trees in the urban environment must be a key component of planning strategies and policy. The World Health Organisation (WHO) European Healthy Cities Network35 recognises the interconnectedness of urban planning, health and sustainability. It has developed a range of urban characteristics that contribute towards better health outcomes for communities, and included links with biophysical environments through endorsement of:
7
A clean, safe physical environment of high quality
Stable and sustainable ecosystems
Access to a wide variety of experiences and social and cultural resources
Enabling connections with the cultural and biological heritage of the various urban inhabitants
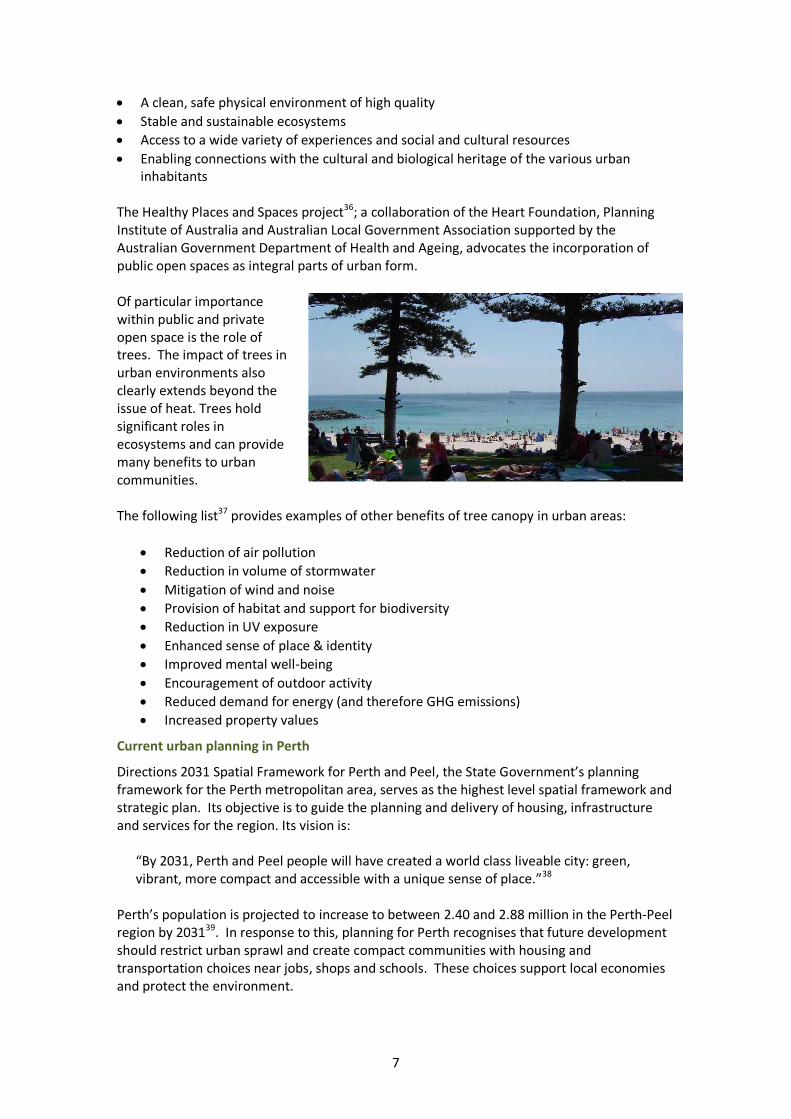
The Healthy Places and Spaces project36; a collaboration of the Heart Foundation, Planning Institute of Australia and Australian Local Government Association supported by the Australian Government Department of Health and Ageing, advocates the incorporation of public open spaces as integral parts of urban form. Of particular importance within public and private open space is the role of trees. The impact of trees in urban environments also clearly extends beyond the issue of heat. Trees hold significant roles in ecosystems and can provide many benefits to urban communities. The following list37 provides examples of other benefits of tree canopy in urban areas:
Reduction of air pollution
Reduction in volume of stormwater
Mitigation of wind and noise
Provision of habitat and support for biodiversity
Reduction in UV exposure
Enhanced sense of place & identity
Improved mental well-being
Encouragement of outdoor activity
Reduced demand for energy (and therefore GHG emissions)
Increased property values
Current urban planning in Perth
Directions 2031 Spatial Framework for Perth and Peel, the State Government’s planning framework for the Perth metropolitan area, serves as the highest level spatial framework and strategic plan. Its objective is to guide the planning and delivery of housing, infrastructure and services for the region. Its vision is:
“By 2031, Perth and Peel people will have created a world class liveable city: green, vibrant, more compact and accessible with a unique sense of place.”38
Perth’s population is projected to increase to between 2.40 and 2.88 million in the Perth-Peel region by 203139. In response to this, planning for Perth recognises that future development should restrict urban sprawl and create compact communities with housing and transportation choices near jobs, shops and schools. These choices support local economies and protect the environment.
8
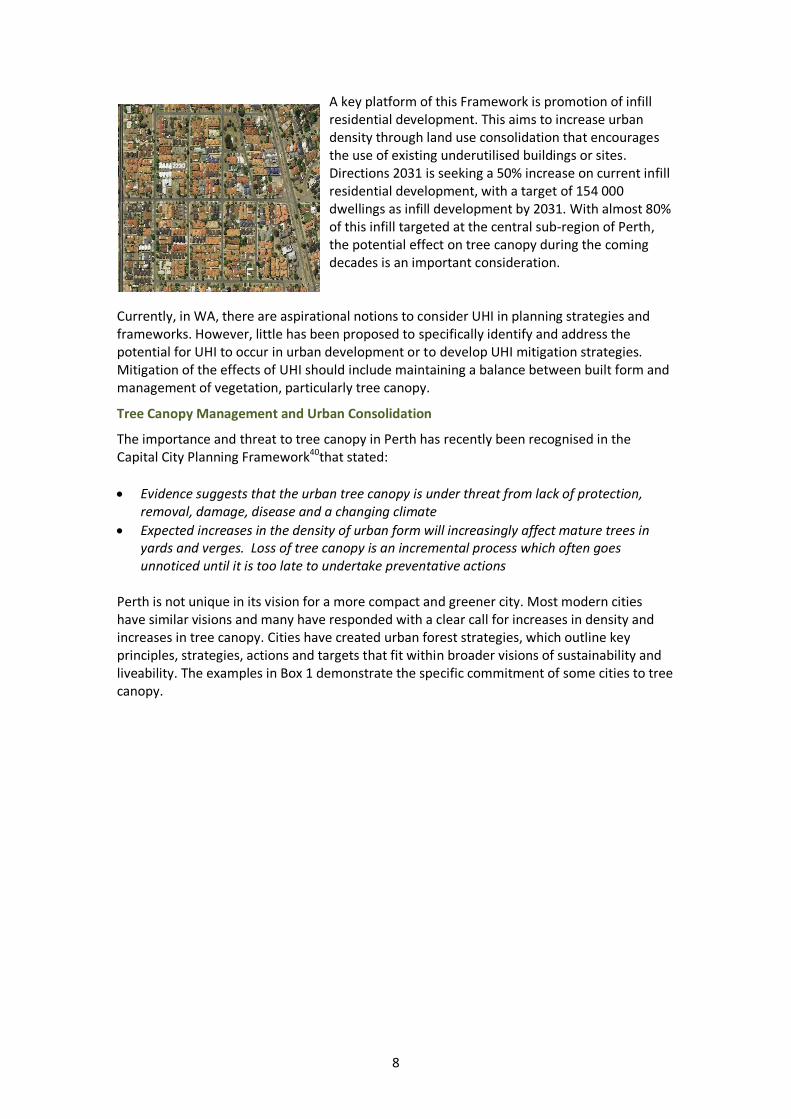
A key platform of this Framework is promotion of infill residential development. This aims to increase urban density through land use consolidation that encourages the use of existing underutilised buildings or sites. Directions 2031 is seeking a 50% increase on current infill residential development, with a target of 154 000 dwellings as infill development by 2031. With almost 80% of this infill targeted at the central sub-region of Perth, the potential effect on tree canopy during the coming decades is an important consideration.
Currently, in WA, there are aspirational notions to consider UHI in planning strategies and frameworks. However, little has been proposed to specifically identify and address the potential for UHI to occur in urban development or to develop UHI mitigation strategies. Mitigation of the effects of UHI should include maintaining a balance between built form and management of vegetation, particularly tree canopy.
Tree Canopy Management and Urban Consolidation
The importance and threat to tree canopy in Perth has recently been recognised in the Capital City Planning Framework40that stated:
Evidence suggests that the urban tree canopy is under threat from lack of protection, removal, damage, disease and a changing climate
Expected increases in the density of urban form will increasingly affect mature trees in yards and verges. Loss of tree canopy is an incremental process which often goes unnoticed until it is too late to undertake preventative actions
Perth is not unique in its vision for a more compact and greener city. Most modern cities have similar visions and many have responded with a clear call for increases in density and increases in tree canopy. Cities have created urban forest strategies, which outline key principles, strategies, actions and targets that fit within broader visions of sustainability and liveability. The examples in Box 1 demonstrate the specific commitment of some cities to tree canopy.
9
Box 1: Strategies to address tree canopy loss
Melbourne Urban Forest Strategy The City of Melbourne has identified that the challenges of climate change, urban growth and natural attrition due to droughts, extreme heat and water restrictions, are having negative effects on its current tree stock. To manage these changes and to protect against future vulnerabilities, the City has developed the Melbourne Urban Forest Strategy. This Strategy has an explicit target of increasing canopy cover from 22 per cent to 40 per cent by 2040
1.
“This strategy sets out the priorities to guide future decisions whilst responding to the three overarching themes of resilient landscapes, community health and wellbeing, and liveability and sustainability.”2
City of Sydney Urban Forest Strategy The City of Sydney has identified the important role trees play in urban environments and has commenced a tree-planting program aimed at doubling the canopy area and potentially reducing local temperatures by up to 2 degrees. Through programs for trees located in streets, parks and private property, targets have been established which will increase the average total canopy cover from the current 15.5% to 23.25% by 2030, and then to 27.13% by 2050
3.
“A thriving urban forest can provide cleaner air, filtered stormwater and lower city temperatures. Trees shrubs and other plants create important habitat for birds, insects and reptiles and make beautiful city streets. Streets filled with trees and landscaping can also have psychological benefits in reducing stress and providing spaces for relaxation and contact with nature. This Urban Forest Strategy works to provide healthy and diverse landscaping in our streets and parks and create beautiful streets and public spaces that contribute to the health and wellbeing of everyone.”4
Other strategies affecting tree canopy
As part of an overall strategy to protect residents from climate change, particularly extreme heat, the City of New York is planting additional trees4. Tree canopy can also be incorporated into other existing policies. For example, the Clean Air Act in the US recognises tree canopy management plans as part of State air quality management plans, primarily because of the link between trees, ambient temperature and ozone levels. In recognition of the role that shade trees play in reducing peak energy load and therefore capital expenditure, the State electricity company in Sacramento provide free shade trees for customers5. 1. City of Melbourne. 2013. Melbourne’s Urban Forest Strategy – making a great city greener. (online)
https://www.melbourne.vic.gov.au/Sustainability/UrbanForest/Pages/About.aspx Accessed March 2013. 2. City of Melbourne. Urban forest strategy. (online)
https://www.melbourne.vic.gov.au/Sustainability/UrbanForest/Documents/Urban_Forest_Strategy.pdf. Accessed March 2013.
3. City of Sydney. 2013. Greening the city. (online). http://www.cityofsydney.nsw.gov.au/vision/sustainability/sustainable-city-
living/greening-the-city. Accessed March 2013. 4. New Scientist. 25 May 2013: No2918. p.5 5. City of Sydney. 2013. Urban forest strategy. (online)
http://www.cityofsydney.nsw.gov.au/__data/assets/pdf_file/0003/132249/Urban-Forest-Strategy-Adopted-Feb-2013.pdf Accessed March 2013.
6. USEPA. 2008. Reducing Urban Heat Islands: Compendium of Strategies. (online) http://www.epa.gov/heatisld/resources/compendium.htm Accessed March 2013.
10
In the USA, planning policy and development incentives include41:
Incorporation of trees in new and infill developments
Strategic placement of trees to provide optimal benefits for cooling and shade
Integration of energy saving techniques into land use and zoning activities
Encouragement of community-wide programs for tree planting in urban settings
Promotion of the benefits of trees through community education programs
Incentives for developers to retain and restore trees in subdivision plans
Promotion of specific UHI mitigation strategies by Local Governments and other public service sectors
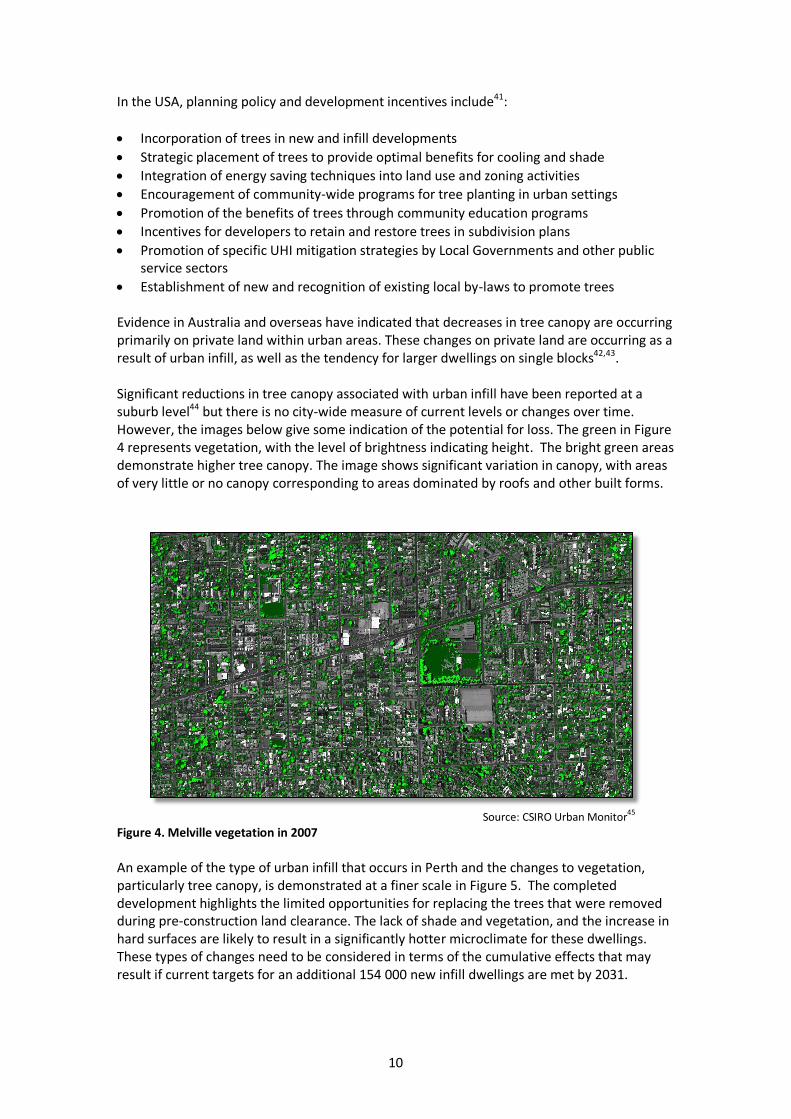
Establishment of new and recognition of existing local by-laws to promote trees Evidence in Australia and overseas have indicated that decreases in tree canopy are occurring primarily on private land within urban areas. These changes on private land are occurring as a result of urban infill, as well as the tendency for larger dwellings on single blocks42,43. Significant reductions in tree canopy associated with urban infill have been reported at a suburb level44 but there is no city-wide measure of current levels or changes over time. However, the images below give some indication of the potential for loss. The green in Figure 4 represents vegetation, with the level of brightness indicating height. The bright green areas demonstrate higher tree canopy. The image shows significant variation in canopy, with areas of very little or no canopy corresponding to areas dominated by roofs and other built forms.
Source: CSIRO Urban Monitor45
Figure 4. Melville vegetation in 2007
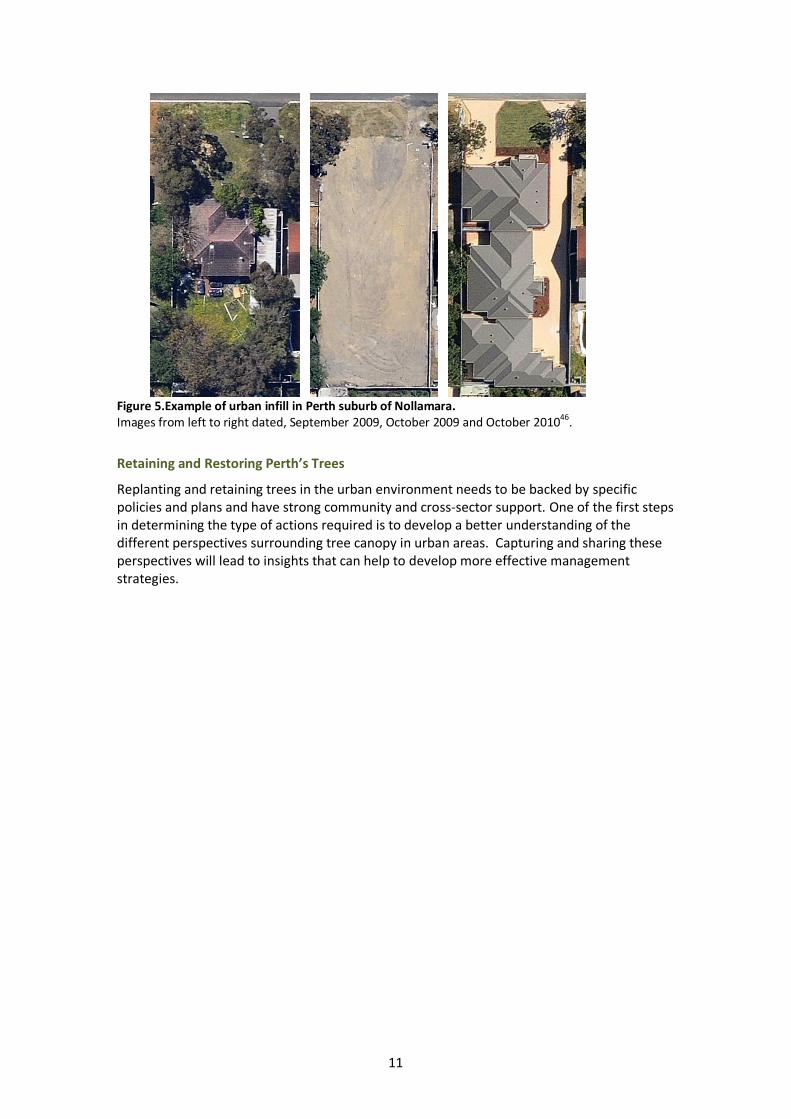
An example of the type of urban infill that occurs in Perth and the changes to vegetation, particularly tree canopy, is demonstrated at a finer scale in Figure 5. The completed development highlights the limited opportunities for replacing the trees that were removed during pre-construction land clearance. The lack of shade and vegetation, and the increase in hard surfaces are likely to result in a significantly hotter microclimate for these dwellings. These types of changes need to be considered in terms of the cumulative effects that may result if current targets for an additional 154 000 new infill dwellings are met by 2031.
11
Figure 5.Example of urban infill in Perth suburb of Nollamara. Images from left to right dated, September 2009, October 2009 and October 2010
46.
Retaining and Restoring Perth’s Trees
Replanting and retaining trees in the urban environment needs to be backed by specific policies and plans and have strong community and cross-sector support. One of the first steps in determining the type of actions required is to develop a better understanding of the different perspectives surrounding tree canopy in urban areas. Capturing and sharing these perspectives will lead to insights that can help to develop more effective management strategies.
12
Part B: The Workshop
A workshop with 34 participants with expertise in health, planning, development, horticulture and environment was held in March 2013. Attendees included representatives from state and local government and the private sector. The aims of the workshop were to:
Identify key variables linked to tree canopy and the relationships between them
Establish an integrated view of the issues surrounding tree canopy
Increase understanding of system behaviour to inform effective management of trees as part of the vision for a compact, green and liveable city
Input and responses from participants were obtained in two ways:
Pre-workshop information and survey
Workshop activities While tree canopy management is an important issue for the whole of Perth, the focus of the activities was on tree canopy management in areas targeted for urban infill.
Pre-workshop
Pre-workshop information was distributed to invitees the week prior to the workshop. Brief background information was provided on the:
Health impacts of heatwaves
Urban heat island effect, and
Urban tree management Attendees were asked to complete a pre-workshop survey to provide expert opinion on a series of issues associated with areas targeted for urban infill, which considered: 1. The benefits of tree canopy 2. The barriers to retaining or replacing trees 3. Potential strategies to be adopted The outcomes of these surveys provide an important insight into the range of opinions from key stakeholders.(See Appendix I. Urban Consolidation and Management of Tree Canopy Survey).
Benefits of tree canopy
Participants were provided with a list of known benefits of tree canopy and asked to rank the level of importance as: 1- Low; 2 – Medium; 3 – High; 4 – Very High; or 5 – Essential. Participants were asked to give a personal ranking, based on their own expertise, and a ‘sector’ ranking based on the level of importance implied by current practices in participants own sector or profession. The benefits of tree canopy specified were to:
Provide shades and cooling
Reduce air pollution
Provide habitat and support biodiversity
Reduce volume of stormwater
Reduce heat-related illnesses
13
Reduce sun exposure
Provide sense of place & identity
Improve mental well-being
Encourage outdoor activity
Increase property values
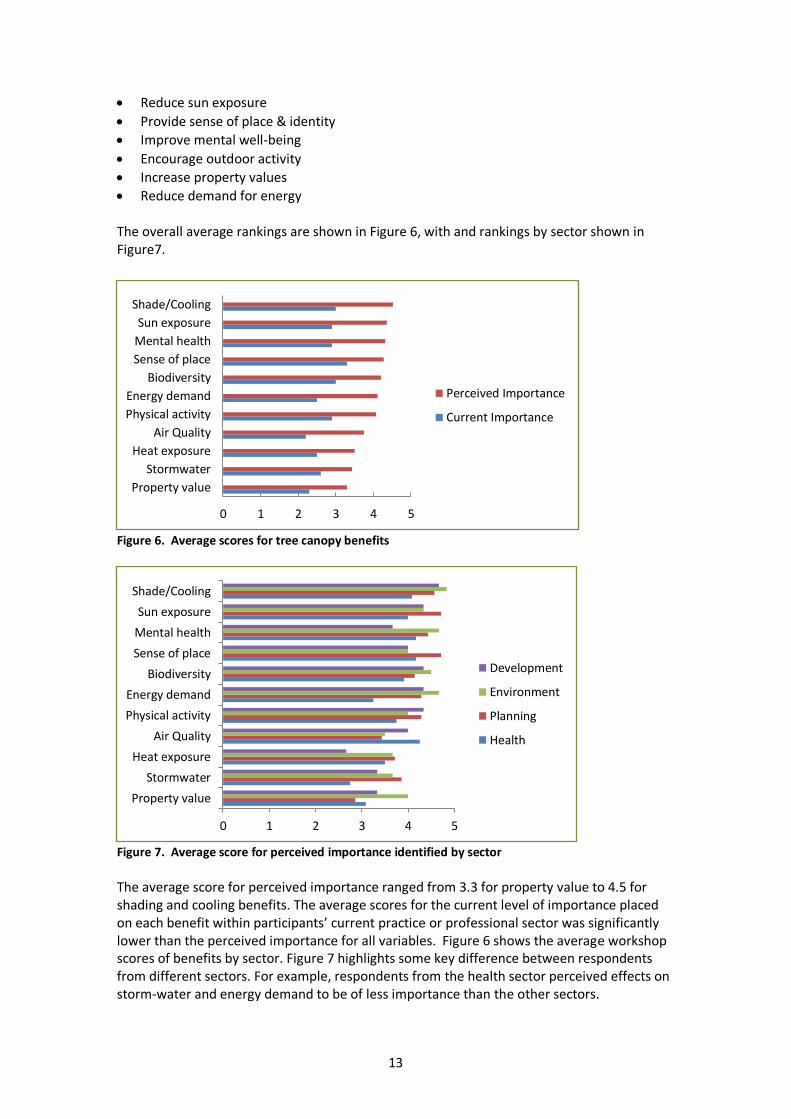
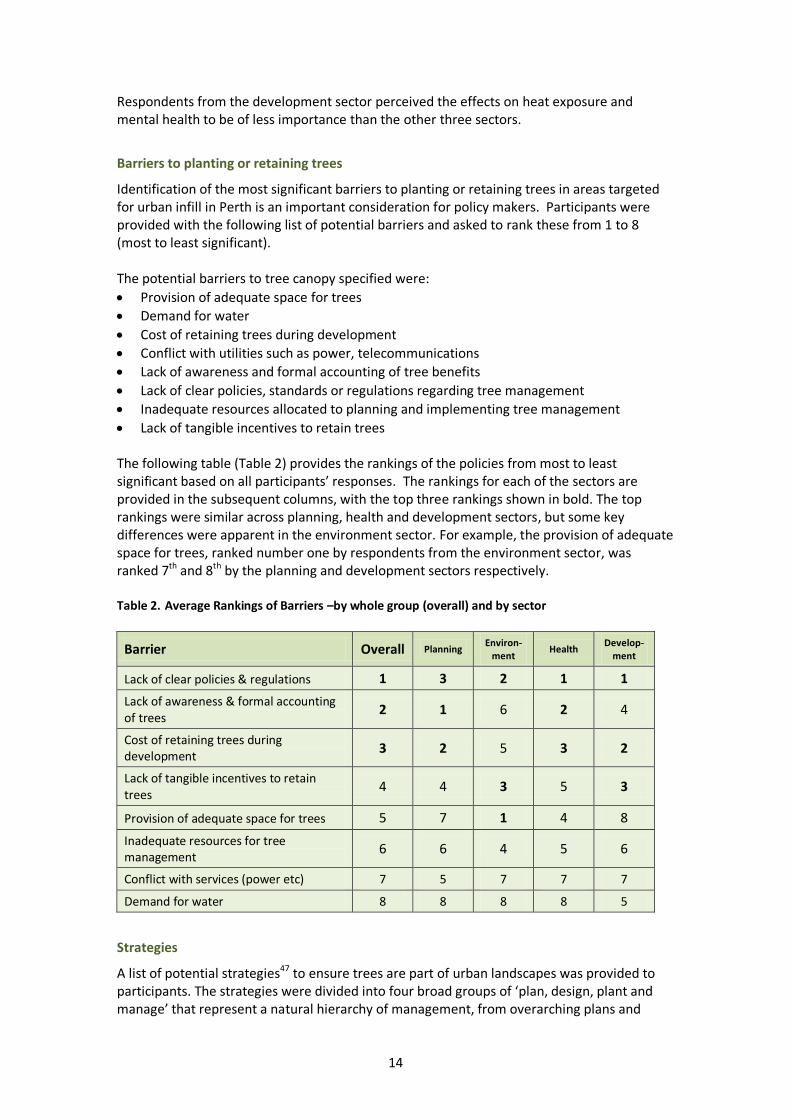
Reduce demand for energy The overall average rankings are shown in Figure 6, with and rankings by sector shown in Figure7.
Figure 6. Average scores for tree canopy benefits
Figure 7. Average score for perceived importance identified by sector
The average score for perceived importance ranged from 3.3 for property value to 4.5 for shading and cooling benefits. The average scores for the current level of importance placed on each benefit within participants’ current practice or professional sector was significantly lower than the perceived importance for all variables. Figure 6 shows the average workshop scores of benefits by sector. Figure 7 highlights some key difference between respondents from different sectors. For example, respondents from the health sector perceived effects on storm-water and energy demand to be of less importance than the other sectors.
0 1 2 3 4 5
Property value
Stormwater
Heat exposure
Air Quality
Physical activity
Energy demand
Biodiversity
Sense of place
Mental health
Sun exposure
Shade/Cooling
Perceived Importance
Current Importance
0 1 2 3 4 5
Property value
Stormwater
Heat exposure
Air Quality
Physical activity
Energy demand
Biodiversity
Sense of place
Mental health
Sun exposure
Shade/Cooling
Development
Environment
Planning
Health
14
Respondents from the development sector perceived the effects on heat exposure and mental health to be of less importance than the other three sectors.
Barriers to planting or retaining trees
Identification of the most significant barriers to planting or retaining trees in areas targeted for urban infill in Perth is an important consideration for policy makers. Participants were provided with the following list of potential barriers and asked to rank these from 1 to 8 (most to least significant). The potential barriers to tree canopy specified were:
Provision of adequate space for trees
Demand for water
Cost of retaining trees during development
Conflict with utilities such as power, telecommunications
Lack of awareness and formal accounting of tree benefits
Lack of clear policies, standards or regulations regarding tree management
Inadequate resources allocated to planning and implementing tree management
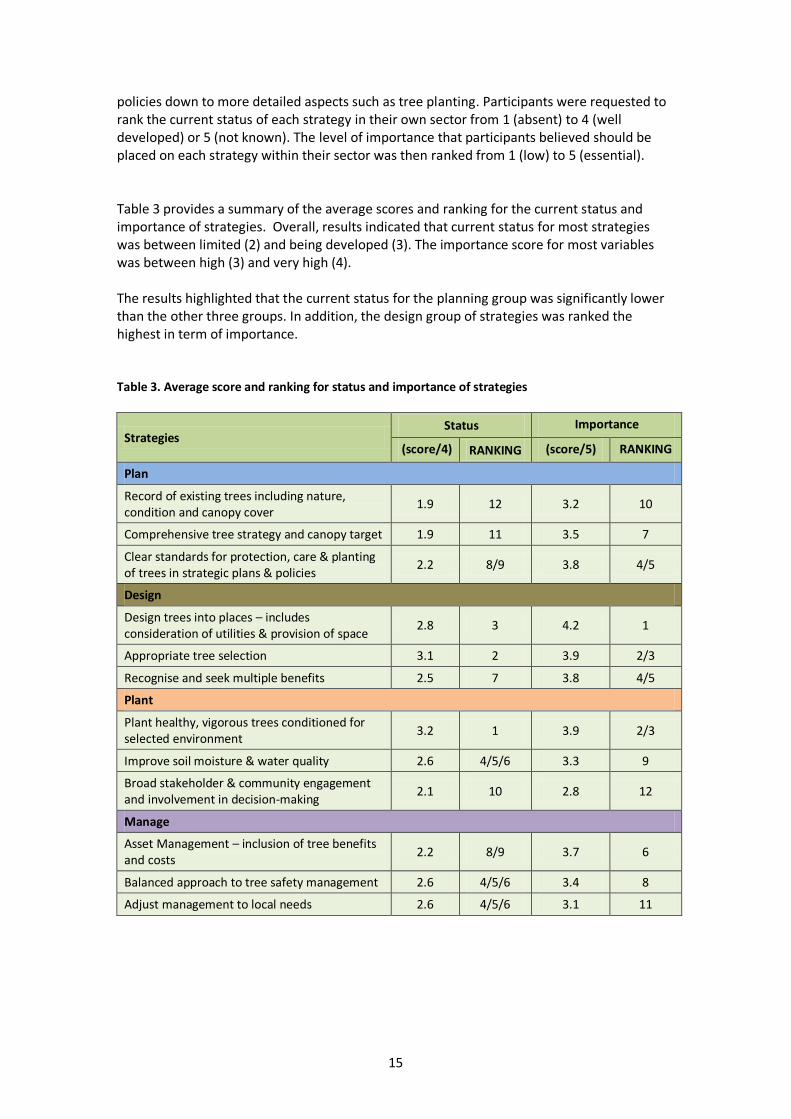
Lack of tangible incentives to retain trees The following table (Table 2) provides the rankings of the policies from most to least significant based on all participants’ responses. The rankings for each of the sectors are provided in the subsequent columns, with the top three rankings shown in bold. The top rankings were similar across planning, health and development sectors, but some key differences were apparent in the environment sector. For example, the provision of adequate space for trees, ranked number one by respondents from the environment sector, was ranked 7th and 8th by the planning and development sectors respectively. Table 2. Average Rankings of Barriers –by whole group (overall) and by sector
Barrier Overall Planning Environ-
ment Health
Develop-ment
Lack of clear policies & regulations 1 3 2 1 1
Lack of awareness & formal accounting of trees
2 1 6 2 4
Cost of retaining trees during development
3 2 5 3 2
Lack of tangible incentives to retain trees
4 4 3 5 3
Provision of adequate space for trees 5 7 1 4 8
Inadequate resources for tree management
6 6 4 5 6
Conflict with services (power etc) 7 5 7 7 7
Demand for water 8 8 8 8 5
Strategies
A list of potential strategies47 to ensure trees are part of urban landscapes was provided to participants. The strategies were divided into four broad groups of ‘plan, design, plant and manage’ that represent a natural hierarchy of management, from overarching plans and
15
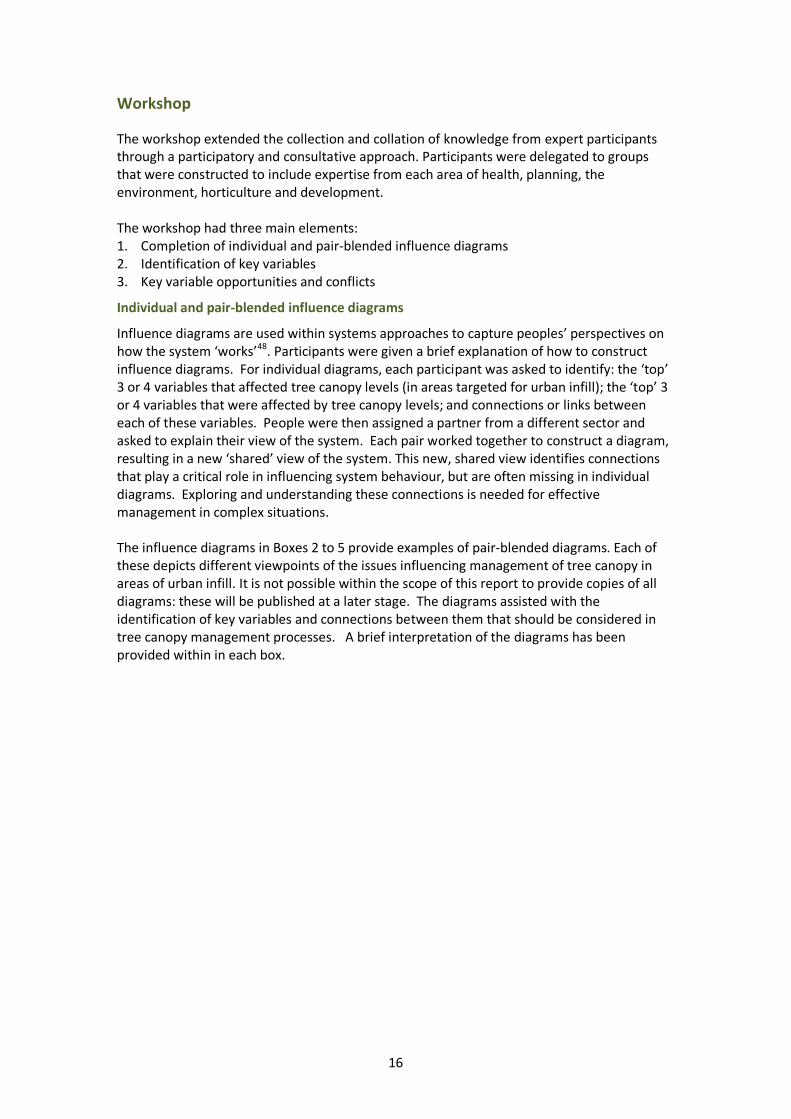
policies down to more detailed aspects such as tree planting. Participants were requested to rank the current status of each strategy in their own sector from 1 (absent) to 4 (well developed) or 5 (not known). The level of importance that participants believed should be placed on each strategy within their sector was then ranked from 1 (low) to 5 (essential). Table 3 provides a summary of the average scores and ranking for the current status and importance of strategies. Overall, results indicated that current status for most strategies was between limited (2) and being developed (3). The importance score for most variables was between high (3) and very high (4). The results highlighted that the current status for the planning group was significantly lower than the other three groups. In addition, the design group of strategies was ranked the highest in term of importance. Table 3. Average score and ranking for status and importance of strategies
Strategies Status Importance
(score/4) RANKING (score/5) RANKING
Plan
Record of existing trees including nature, condition and canopy cover
1.9 12 3.2 10
Comprehensive tree strategy and canopy target 1.9 11 3.5 7
Clear standards for protection, care & planting of trees in strategic plans & policies
2.2 8/9 3.8 4/5
Design
Design trees into places – includes consideration of utilities & provision of space
2.8 3 4.2 1
Appropriate tree selection 3.1 2 3.9 2/3
Recognise and seek multiple benefits 2.5 7 3.8 4/5
Plant
Plant healthy, vigorous trees conditioned for selected environment
3.2 1 3.9 2/3
Improve soil moisture & water quality 2.6 4/5/6 3.3 9
Broad stakeholder & community engagement and involvement in decision-making
2.1 10 2.8 12
Manage
Asset Management – inclusion of tree benefits and costs
2.2 8/9 3.7 6
Balanced approach to tree safety management 2.6 4/5/6 3.4 8
Adjust management to local needs 2.6 4/5/6 3.1 11
16
Workshop
The workshop extended the collection and collation of knowledge from expert participants through a participatory and consultative approach. Participants were delegated to groups that were constructed to include expertise from each area of health, planning, the environment, horticulture and development. The workshop had three main elements: 1. Completion of individual and pair-blended influence diagrams 2. Identification of key variables 3. Key variable opportunities and conflicts
Individual and pair-blended influence diagrams
Influence diagrams are used within systems approaches to capture peoples’ perspectives on how the system ‘works’48. Participants were given a brief explanation of how to construct influence diagrams. For individual diagrams, each participant was asked to identify: the ‘top’ 3 or 4 variables that affected tree canopy levels (in areas targeted for urban infill); the ‘top’ 3 or 4 variables that were affected by tree canopy levels; and connections or links between each of these variables. People were then assigned a partner from a different sector and asked to explain their view of the system. Each pair worked together to construct a diagram, resulting in a new ‘shared’ view of the system. This new, shared view identifies connections that play a critical role in influencing system behaviour, but are often missing in individual diagrams. Exploring and understanding these connections is needed for effective management in complex situations. The influence diagrams in Boxes 2 to 5 provide examples of pair-blended diagrams. Each of these depicts different viewpoints of the issues influencing management of tree canopy in areas of urban infill. It is not possible within the scope of this report to provide copies of all diagrams: these will be published at a later stage. The diagrams assisted with the identification of key variables and connections between them that should be considered in tree canopy management processes. A brief interpretation of the diagrams has been provided within in each box.
17
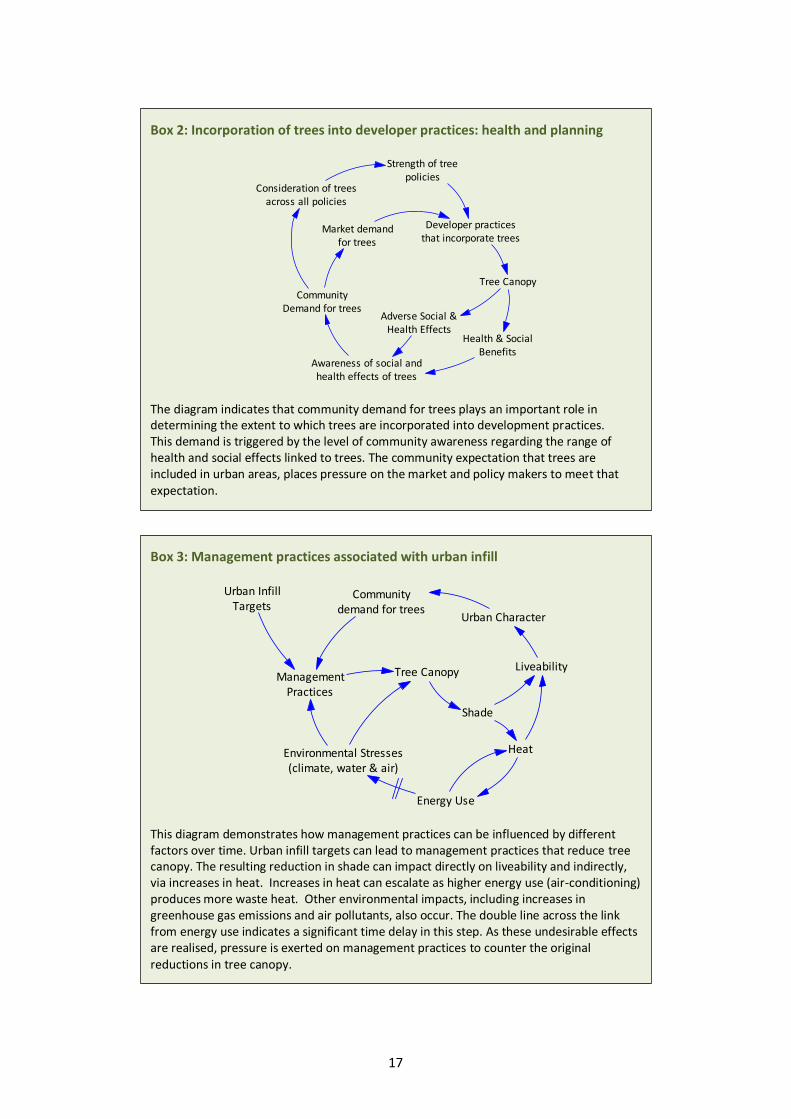
Box 2: Incorporation of trees into developer practices: health and planning
The diagram indicates that community demand for trees plays an important role in determining the extent to which trees are incorporated into development practices. This demand is triggered by the level of community awareness regarding the range of health and social effects linked to trees. The community expectation that trees are included in urban areas, places pressure on the market and policy makers to meet that expectation.
Tree Canopy
Health & SocialBenefits
Adverse Social &Health Effects
Awareness of social andhealth effects of trees
CommunityDemand for trees
Market demandfor trees
Developer practicesthat incorporate trees
Consideration of treesacross all policies
Strength of treepolicies
Box 3: Management practices associated with urban infill
This diagram demonstrates how management practices can be influenced by different factors over time. Urban infill targets can lead to management practices that reduce tree canopy. The resulting reduction in shade can impact directly on liveability and indirectly, via increases in heat. Increases in heat can escalate as higher energy use (air-conditioning) produces more waste heat. Other environmental impacts, including increases in greenhouse gas emissions and air pollutants, also occur. The double line across the link from energy use indicates a significant time delay in this step. As these undesirable effects are realised, pressure is exerted on management practices to counter the original reductions in tree canopy.
Tree Canopy
Environmental Stresses(climate, water & air)
ManagementPractices
Shade
Liveability
Urban Character
Energy Use
Communitydemand for trees
Heat
Urban InfillTargets
18
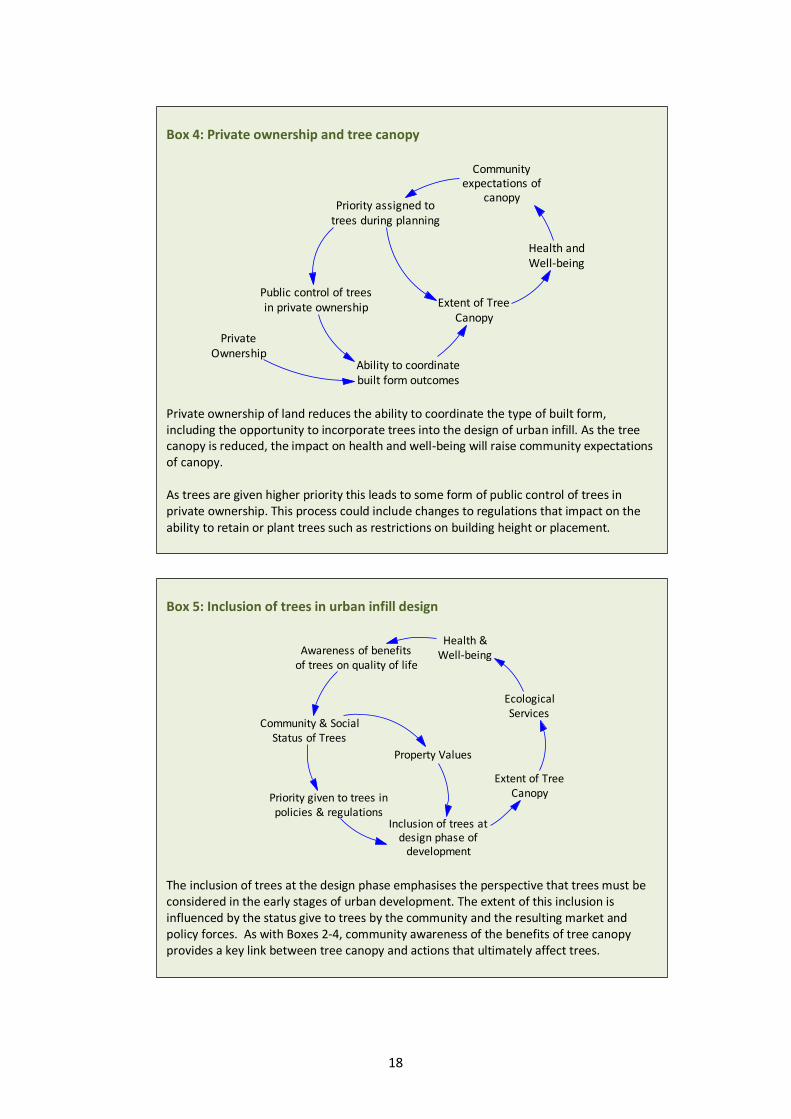
Box 4: Private ownership and tree canopy
Private ownership of land reduces the ability to coordinate the type of built form, including the opportunity to incorporate trees into the design of urban infill. As the tree canopy is reduced, the impact on health and well-being will raise community expectations of canopy. As trees are given higher priority this leads to some form of public control of trees in private ownership. This process could include changes to regulations that impact on the ability to retain or plant trees such as restrictions on building height or placement.
Extent of TreeCanopy
PrivateOwnership
Communityexpectations of
canopyPriority assigned to
trees during planning
Ability to coordinatebuilt form outcomes
Health andWell-being
Public control of treesin private ownership
Box 5: Inclusion of trees in urban infill design
The inclusion of trees at the design phase emphasises the perspective that trees must be considered in the early stages of urban development. The extent of this inclusion is influenced by the status give to trees by the community and the resulting market and policy forces. As with Boxes 2-4, community awareness of the benefits of tree canopy provides a key link between tree canopy and actions that ultimately affect trees.
Extent of TreeCanopy
Community & SocialStatus of Trees
Priority given to trees inpolicies & regulations
Property Values
EcologicalServices
Inclusion of trees atdesign phase of
development
Health &Well-beingAwareness of benefits
of trees on quality of life
19
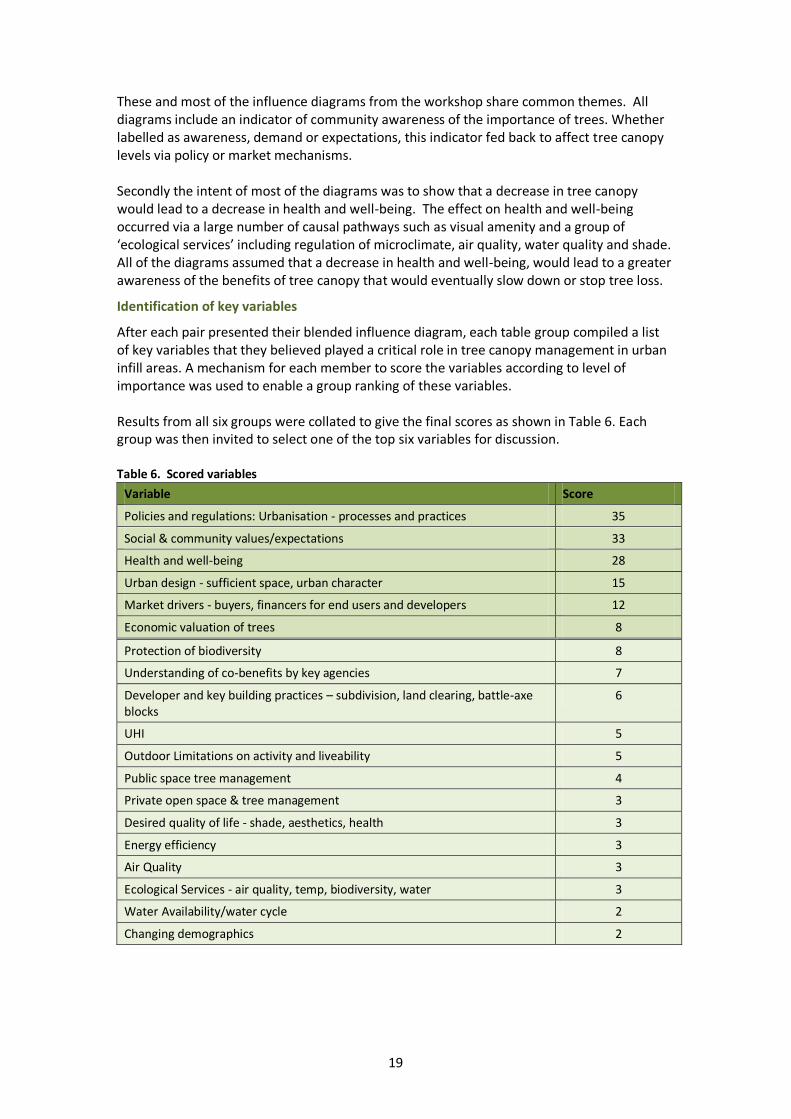
These and most of the influence diagrams from the workshop share common themes. All diagrams include an indicator of community awareness of the importance of trees. Whether labelled as awareness, demand or expectations, this indicator fed back to affect tree canopy levels via policy or market mechanisms. Secondly the intent of most of the diagrams was to show that a decrease in tree canopy would lead to a decrease in health and well-being. The effect on health and well-being occurred via a large number of causal pathways such as visual amenity and a group of ‘ecological services’ including regulation of microclimate, air quality, water quality and shade. All of the diagrams assumed that a decrease in health and well-being, would lead to a greater awareness of the benefits of tree canopy that would eventually slow down or stop tree loss.
Identification of key variables
After each pair presented their blended influence diagram, each table group compiled a list of key variables that they believed played a critical role in tree canopy management in urban infill areas. A mechanism for each member to score the variables according to level of importance was used to enable a group ranking of these variables. Results from all six groups were collated to give the final scores as shown in Table 6. Each group was then invited to select one of the top six variables for discussion. Table 6. Scored variables
Variable Score
Policies and regulations: Urbanisation - processes and practices 35
Social & community values/expectations 33
Health and well-being 28
Urban design - sufficient space, urban character 15
Market drivers - buyers, financers for end users and developers 12
Economic valuation of trees 8
Protection of biodiversity 8
Understanding of co-benefits by key agencies 7
Developer and key building practices – subdivision, land clearing, battle-axe blocks
6
UHI 5
Outdoor Limitations on activity and liveability 5
Public space tree management 4
Private open space & tree management 3
Desired quality of life - shade, aesthetics, health 3
Energy efficiency 3
Air Quality 3
Ecological Services - air quality, temp, biodiversity, water 3
Water Availability/water cycle 2
Changing demographics 2
20
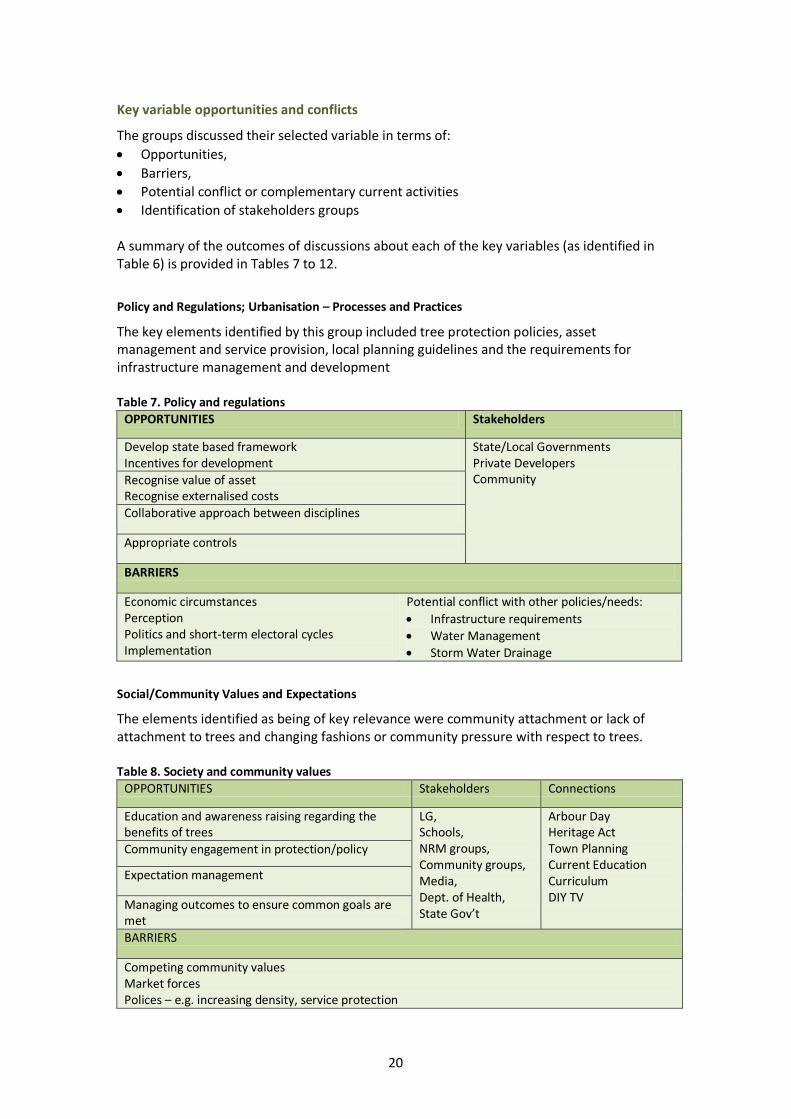
Key variable opportunities and conflicts
The groups discussed their selected variable in terms of:
Opportunities,
Barriers,
Potential conflict or complementary current activities
Identification of stakeholders groups A summary of the outcomes of discussions about each of the key variables (as identified in Table 6) is provided in Tables 7 to 12.
Policy and Regulations; Urbanisation – Processes and Practices
The key elements identified by this group included tree protection policies, asset management and service provision, local planning guidelines and the requirements for infrastructure management and development Table 7. Policy and regulations
OPPORTUNITIES Stakeholders
Develop state based framework Incentives for development
State/Local Governments Private Developers Community Recognise value of asset
Recognise externalised costs
Collaborative approach between disciplines
Appropriate controls
BARRIERS
Economic circumstances Perception Politics and short-term electoral cycles Implementation
Potential conflict with other policies/needs:
Infrastructure requirements
Water Management
Storm Water Drainage
Social/Community Values and Expectations
The elements identified as being of key relevance were community attachment or lack of attachment to trees and changing fashions or community pressure with respect to trees. Table 8. Society and community values
OPPORTUNITIES Stakeholders Connections
Education and awareness raising regarding the benefits of trees
LG, Schools, NRM groups, Community groups, Media, Dept. of Health, State Gov’t
Arbour Day Heritage Act Town Planning Current Education Curriculum DIY TV
Community engagement in protection/policy
Expectation management
Managing outcomes to ensure common goals are met
BARRIERS
Competing community values Market forces Polices – e.g. increasing density, service protection
21
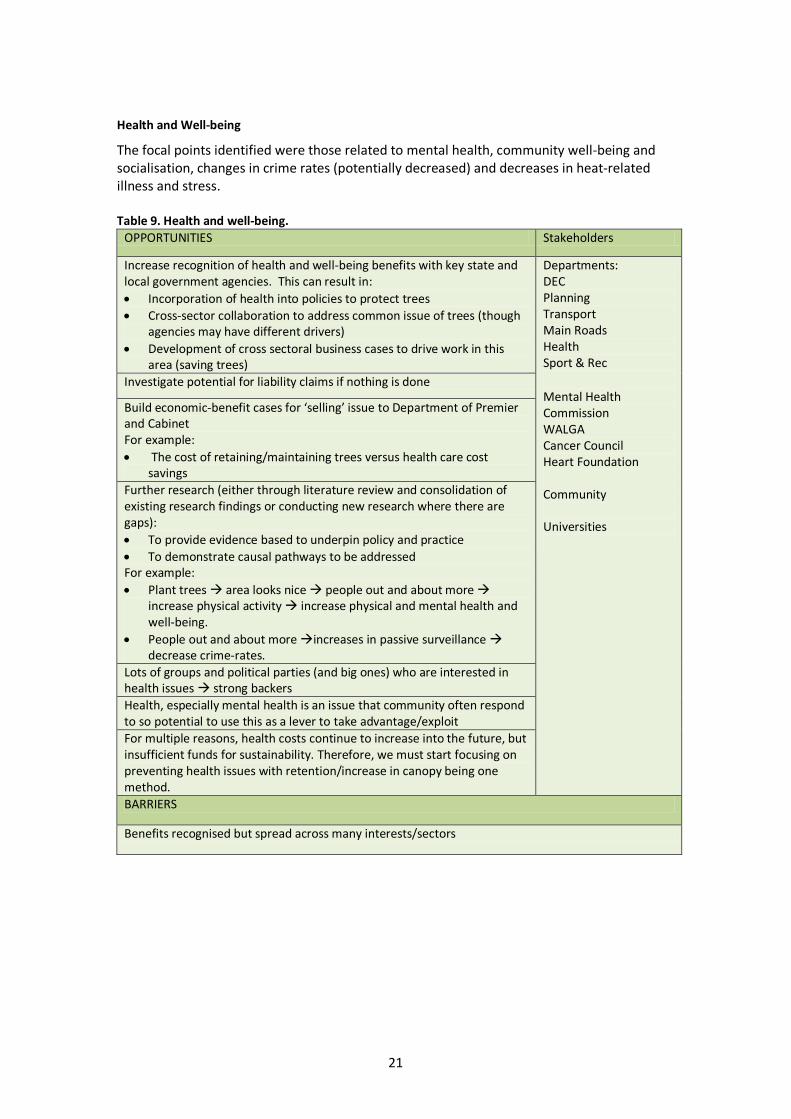
Health and Well-being
The focal points identified were those related to mental health, community well-being and socialisation, changes in crime rates (potentially decreased) and decreases in heat-related illness and stress. Table 9. Health and well-being.
OPPORTUNITIES Stakeholders
Increase recognition of health and well-being benefits with key state and local government agencies. This can result in:
Incorporation of health into policies to protect trees
Cross-sector collaboration to address common issue of trees (though agencies may have different drivers)
Development of cross sectoral business cases to drive work in this area (saving trees)
Departments: DEC Planning Transport Main Roads Health Sport & Rec
Mental Health Commission WALGA Cancer Council Heart Foundation Community Universities
Investigate potential for liability claims if nothing is done
Build economic-benefit cases for ‘selling’ issue to Department of Premier and Cabinet For example:
The cost of retaining/maintaining trees versus health care cost savings
Further research (either through literature review and consolidation of existing research findings or conducting new research where there are gaps):
To provide evidence based to underpin policy and practice
To demonstrate causal pathways to be addressed For example:
Plant trees area looks nice people out and about more increase physical activity increase physical and mental health and well-being.
People out and about more increases in passive surveillance decrease crime-rates.
Lots of groups and political parties (and big ones) who are interested in health issues strong backers
Health, especially mental health is an issue that community often respond to so potential to use this as a lever to take advantage/exploit
For multiple reasons, health costs continue to increase into the future, but insufficient funds for sustainability. Therefore, we must start focusing on preventing health issues with retention/increase in canopy being one method.
BARRIERS
Benefits recognised but spread across many interests/sectors
22
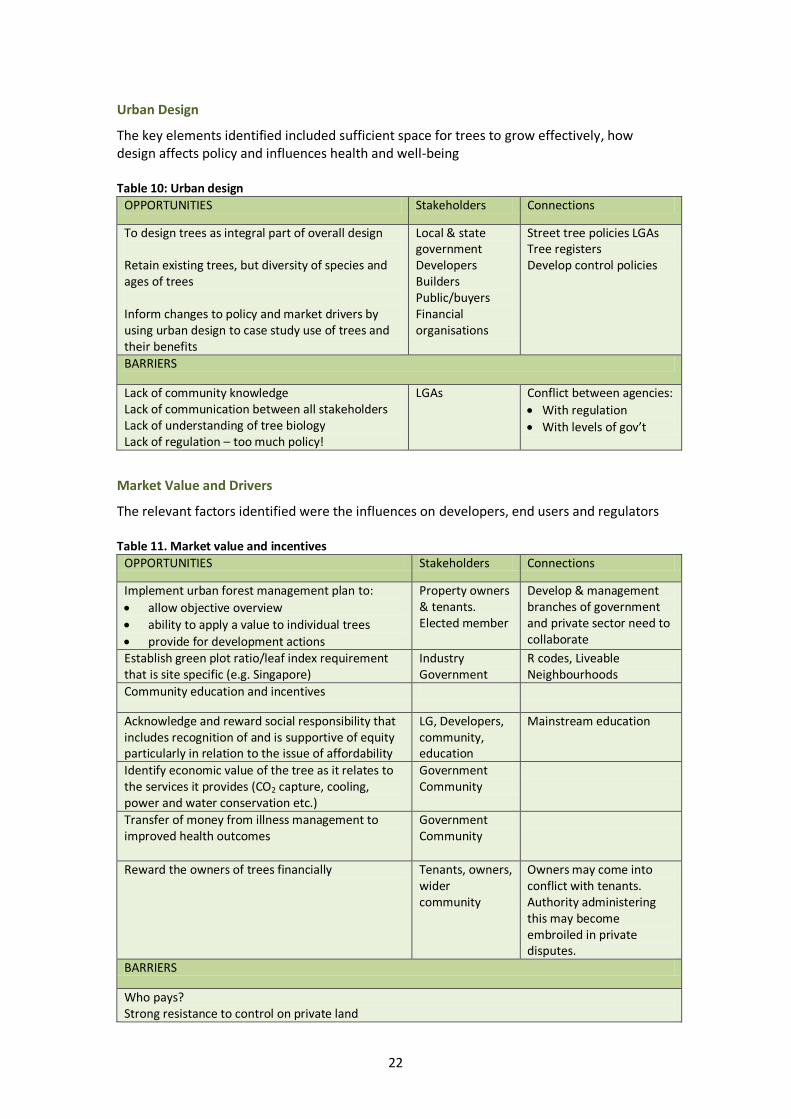
Urban Design
The key elements identified included sufficient space for trees to grow effectively, how design affects policy and influences health and well-being
Table 10: Urban design
OPPORTUNITIES Stakeholders Connections
To design trees as integral part of overall design Retain existing trees, but diversity of species and ages of trees Inform changes to policy and market drivers by using urban design to case study use of trees and their benefits
Local & state government Developers Builders Public/buyers Financial organisations
Street tree policies LGAs Tree registers Develop control policies
BARRIERS
Lack of community knowledge Lack of communication between all stakeholders Lack of understanding of tree biology Lack of regulation – too much policy!
LGAs Conflict between agencies:
With regulation
With levels of gov’t
Market Value and Drivers
The relevant factors identified were the influences on developers, end users and regulators
Table 11. Market value and incentives
OPPORTUNITIES Stakeholders Connections
Implement urban forest management plan to:
allow objective overview
ability to apply a value to individual trees
provide for development actions
Property owners & tenants. Elected member
Develop & management branches of government and private sector need to collaborate
Establish green plot ratio/leaf index requirement that is site specific (e.g. Singapore)
Industry Government
R codes, Liveable Neighbourhoods
Community education and incentives
Acknowledge and reward social responsibility that includes recognition of and is supportive of equity particularly in relation to the issue of affordability
LG, Developers, community, education
Mainstream education
Identify economic value of the tree as it relates to the services it provides (CO2 capture, cooling, power and water conservation etc.)
Government Community
Transfer of money from illness management to improved health outcomes
Government Community
Reward the owners of trees financially Tenants, owners, wider community
Owners may come into conflict with tenants. Authority administering this may become embroiled in private disputes.
BARRIERS
Who pays? Strong resistance to control on private land
23
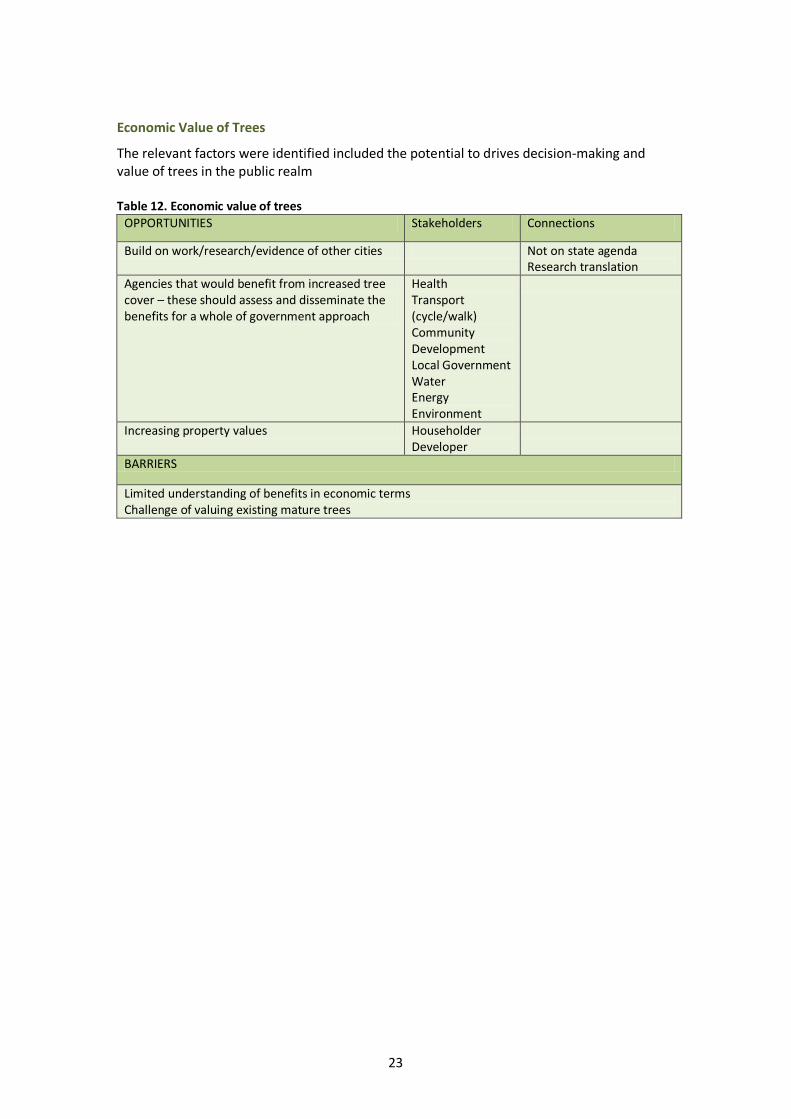
Economic Value of Trees
The relevant factors were identified included the potential to drives decision-making and value of trees in the public realm
Table 12. Economic value of trees
OPPORTUNITIES Stakeholders Connections
Build on work/research/evidence of other cities Not on state agenda Research translation
Agencies that would benefit from increased tree cover – these should assess and disseminate the benefits for a whole of government approach
Health Transport (cycle/walk) Community Development Local Government Water Energy Environment
Increasing property values Householder Developer
BARRIERS
Limited understanding of benefits in economic terms Challenge of valuing existing mature trees
24
Discussion
It is apparent that trees in urban environments are being placed under increasing pressure from population growth, development patterns and climate change. At the same time, these pressures also suggest an increasingly important role for trees in Perth. Given these tensions, effective management of trees is not a simple task. The range of stakeholders identified during the workshop highlights the broad spectrum of government and society that are, in some way, connected to the issue. Understanding each of these connections will be crucial if we are to arrive at solutions that ensure the best outcome for the population and environment of Perth. Key aspects of that understanding, as captured by the workshop, are discussed below.
Urbanisation Policies - the impact on tree canopy and Perth’s Vision
Policies and regulations relating to urbanisation were nominated as the most important group of variables affecting tree canopy levels in areas of urban infill. A ‘lack of clear policies and regulations’ was recorded in the top two barriers for planting or retaining trees by over 80% of all participants. In addition, almost all influence diagrams included policy as a key variable. The outcome of urbanisation in Perth will to a large extent depend on how the process is managed over the coming decades. This management is partly directed by the vision for Perth as stated in Directions 2031: “By 2031, Perth and Peel people will have created a world class liveable city: green, vibrant, more compact and accessible with a unique sense of place.” While the vision for Perth is for the creation of a world-class liveable city, the evidence suggests that this vision is being measured primarily through the ‘compact’ perspective, as indicated by: “Directions 2031 seeks a 50% improvement on current infill residential development trends of 30 and 35%; and, has set a target of 47% or 154,000 of the required 328,000 dwellings as infill development.”49 The above statement highlights two important aspects of urban infill: a summary of where we are now and a clear goal of where we want to be by the year 2031. The gap between these drives actions to increase urban density. The process is reinforced by on-going monitoring and reporting of urban density which provides regular information about progress toward the urban infill target. This sustains and strengthens actions towards the infill goal. An immediate impact of increases in urban density is also to increase tree removal and reduce tree canopy. No tree canopy target and no clear measurement of tree canopy levels exist for Perth. The absence of this information combined with the strong targets and monitoring of infill, contribute to tree canopy loss in areas targeted for infill. Where tree management plans are in place, urban infill strategies may be limiting their effectiveness. This situation has been recognised in the Capital City Framework that states that a lack of data and an integrated strategic approach is hampering efforts to prevent loss of tree canopy.
25
The use of urban infill targets to measure the vision of a compact city for Perth is a sensible one. However, care needs to be taken that the vision of a liveable city is not narrowly defined through a singular goal of a more compact one. This is not an incorrect goal, but rather an incomplete one. Consideration must also be given to goals and indicators that address the other elements of the liveable city. Given the broad nature of these elements, defining and setting these goals and indicators is challenging and will require extensive input from a wide range of sectors and the community. There was a strong perception at the workshop that the true value of trees was not properly accounted for in current systems. It was considered that trees are relegated ‘down the pecking order’ in relation to other policies on ‘hard’ infrastructure The development of strong urban tree management policies, such as a clear urban canopy target would help to place a value on tree canopy and a greater priority during development activities. It is apparent that changes in tree canopy have the potential to impact on the future liveability of Perth. Urban tree canopy should be an important indicator of Perth’s vision for a liveable city.
The key role of community awareness
Community and social awareness of the benefits of tree canopy was identified as the second most important variable affecting tree canopy management at the workshop. Most influence diagrams indicated that community awareness provided a link between tree canopy effects and tree management, either through increased pressure on policy-makers or the market place. The implication is that if community and social awareness is low, pressure on policy-makers and the market place to preserve and promote tree canopy will be weak. At present, there are numerous factors that are likely to limit the strength and extent of this awareness. The incremental nature of tree canopy loss is likely to conceal the extent of losses over time and limit or at least delay, the level of community awareness regarding the loss. In addition, without clearly communicated guidelines about what constitutes a ‘good’ tree canopy or a measure of existing canopy levels in their own community, awareness on the issue is limited. The influence diagrams suggested that awareness of tree canopy benefits arose as a result of experiencing the effects of tree canopy loss. For some effects, such as visual amenity and shade, this connection between trees and benefit is readily observed or experienced by the individual. This may be reflected in the high benefit score given to these elements by workshop participants. However, other effects such as changes in microclimate, air quality, storm-water management, physical activity, biodiversity, energy consumption and heat-related health impacts are not as readily recognised and linked to tree canopy. These factors suggest that there are likely to be significant delays and limitations to the influence that community awareness of tree benefits has on policy makers or the market place. These delays are particularly problematic because urbanisation and tree removal result in long-term physical changes to the environment that are difficult to reverse. For example, if urban development is undertaken in such a way that trees are ‘designed out’ of the physical environment, the opportunity to re-incorporate trees is limited. In addition, there will always be delays in replacing tree canopy when mature trees are replaced with young trees.
26
For all of these reasons, waiting for tree canopy loss to proceed to such an extent that community awareness ‘kicks in’ to influence policy and market responses that will slow down or prevent the loss, is highly undesirable. The solution to overcome these delays is to create awareness with appropriate information and education. This will need to take place across all levels and areas of society. Getting the community, developers and government to think about alternative future scenarios, for example urban infill with varying levels of tree canopy, can be a strong motivator for behaviour change. The importance of strategies to increase awareness in the community and among decision-makers across all sectors was strongly endorsed at the workshop. Specific examples from the discussion of key variables included:
Education and awareness-raising regarding benefits of trees
Incorporation of health into policies to protect trees
Provide evidence to underpin policy and practice
Further research to demonstrate causal pathways
Urban design case studies on tree benefits
Identify, consolidate and communicate benefits/costs associated with trees Developing and effectively communicating the range of information required will require a collaborative approach. Different perspectives and priorities will need to be taken into account. For example, the health sector will need to take the lead in assessing, costing and communicating the range of health effects related to tree canopy loss and UHI effect. Likewise, the environment sector needs to assess, cost and communicate the potential effects on air quality, GHG emissions, water quality and biodiversity. The economic sector needs to consider the total of all of these costs, the impacts on development and on land affordability. The planning sector needs to consider how these viewpoints can be incorporated to meet their stated vision for a world-class liveable city. Other important stakeholders/sectors include transport, water, energy, sport and recreation and local government. Last, but not least, the key role of the community, as identified in the workshop, must be acknowledged and promoted by extensive community consultation and involvement.
Economic and market considerations
Costs related to the retention, maintenance and removal of trees was a common theme throughout the workshop. While the immediate economic benefits of removing trees in the urban landscape (the provision of developable land), is captured efficiently in dollar terms, the disparate costs of removing trees accumulate over a long time period. In addition these costs are not constrained to the persons who reap the initial benefit of tree removal. If these costs are to be captured, the key question of ‘who pays?’ needs to be addressed. There is a range of potential solutions to overcome this. One management solution to this problem is to introduce a mechanism that captures the true cost of tree canopy removal and imposes this cost on those removing the tree. Typical solutions in this case are regulatory systems or a fee that is imposed on removal of trees. For example, several Melbourne councils use tree valuation programs such as i-trees to place values on street trees. The removal of street trees valued at more than $5000 is prohibited. If a permit for removal of the tree under this value is provided, the landowner must pay for the equivalent of the tree value, plus the cost of removal and the cost of two replacement trees50. A number of local governments in Perth are trialling the use of tree valuation software. Several councils also
27
have stringent local laws protecting trees on private land. This protection is typically related to the size of the tree and extends to removal and pruning. Economic incentives can also occur through the growing recognition that urban canopy can contribute to market value. However, there is a potential that this incentive may be limited to areas of higher market value. If market forces are not as effective in lower socio-economic areas, other mechanisms should be considered to avoid inequity in terms of canopy. Residents in these areas, who may already be vulnerable to a range of health effects, would be further disadvantaged by the loss of benefits that urban trees provide. The impact of land-use and ownership on tree management was also a key issue at the workshop. Workshop responses and other evidence51,52 suggest that;
canopy loss in urban areas occurs primarily on private residential land
some losses are inevitable with urban infill
there is likely to be strong resistance to control over private land. If control over private residential land is limited and losses are likely, management of tree canopy in other areas such as street trees, public open space, road reserves, commercial and light industrial areas, schools, hospitals, universities and business parks, becomes increasingly important.
28
Final Statement
This workshop and the review of activities elsewhere have demonstrated strong support for trees. There was consistency across sector participants that trees are an integral part of the urban environment and that more should be done to ensure that their presence is included in planning strategies for urban infill. Participants acknowledged the value to better health outcomes of providing trees that can meet the needs of all community members. The long term implications of gradual tree reduction under current processes include hotter environments, reduced ability to participate in outdoor activities, reduced visual amenity, higher energy costs and reductions in physical and mental health. These implications traverse a range of environmental, economic and social elements that potentially weaken progress toward a sustainable and healthy future. The advantages of a compact city can be undermined if unintended consequences, such as tree canopy reduction, are not adequately managed. In the long run, this can result in urban areas that fall short of our stated vision and ultimately discourage participation in compact urban forms. Over the coming decades the effects of climate change will be imposed upon us. A critical part of adapting amidst a period of urban consolidation is to ensure that the situation is not exacerbated by the creation of urban heat island effects. This requires a greater recognition of the impact that planning decisions have on local climate. The combined effects of global and local climate change are uncertain, but the possibility of passing thresholds, beyond which adaptation will become increasingly difficult and costly, highlights the importance of the issue and the need for action. The effective management of issues at a local level represents an opportunity to increase our resilience with respect to high temperatures. Part of the solution requires effective management of tree canopy. The economic, environmental and social benefits of effective tree canopy management warrant immediate action and inclusion in design elements of urban areas. The positive response of all invited stakeholders to the workshop and the tree canopy issue, suggests there is a significant amount of good will and a strong platform for continued collaboration. Finally, while it is acknowledged that a great deal more work is required on this issue, the preliminary recommendations provided in the executive summary may help to direct future discussions.
29
Appendices
Appendix 1: Pre-Workshop Survey
Urban Consolidation and the Management of Tree Canopy Management of trees in urban areas targeted for consolidation is a complex issue with implications for community, infrastructure and services. This workshop aims to capture the knowledge and perspectives of different stakeholders on the role and management of tree canopy, in the context of urban infill in Perth. This understanding can contribute to effective management of the issue. Some important issues that have been identified include:
Projected increases in temperature and heatwaves in Perth pose a significant risk
to public health and liveability over the coming decades.
Exposure to heat in urban areas can be exacerbated by the creation of urban heat
islands.
Loss of vegetation, particularly tree canopy is a significant contributor to urban
heat islands.
Tree canopy is linked to other variables that impact on public health, liveability &
sustainability.
Urban development, particularly urban infill, places significant pressure on tree
canopy.
Useful Links (For your interest) Health Impacts of Heatwaves Urban Heat Island Effect Melbourne Urban Forest Strategy Urban Tree Management Principles Pre-Workshop Activity Please complete the following 3 tables prior to attending to the workshop. These tables ask your opinion about trees in urban environments. They will be collected at the workshop and be discussed in the first activity of the morning. Given the differing backgrounds of workshop participants you may not be able to complete all sections of the activity. Please enter n/a for any incomplete sections.
30
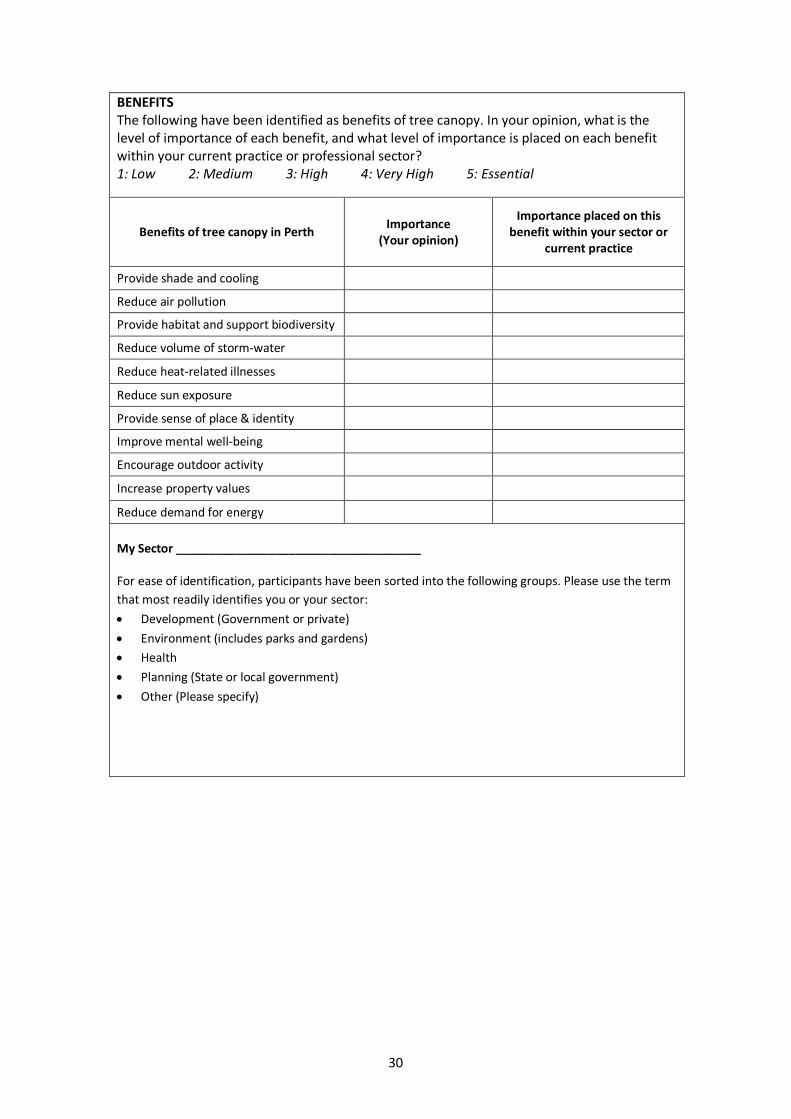
BENEFITS The following have been identified as benefits of tree canopy. In your opinion, what is the level of importance of each benefit, and what level of importance is placed on each benefit within your current practice or professional sector? 1: Low 2: Medium 3: High 4: Very High 5: Essential
Benefits of tree canopy in Perth Importance
(Your opinion)
Importance placed on this benefit within your sector or
current practice
Provide shade and cooling
Reduce air pollution
Provide habitat and support biodiversity
Reduce volume of storm-water
Reduce heat-related illnesses
Reduce sun exposure
Provide sense of place & identity
Improve mental well-being
Encourage outdoor activity
Increase property values
Reduce demand for energy
My Sector _____________________________________ For ease of identification, participants have been sorted into the following groups. Please use the term
that most readily identifies you or your sector:
Development (Government or private)
Environment (includes parks and gardens)
Health
Planning (State or local government)
Other (Please specify)
31
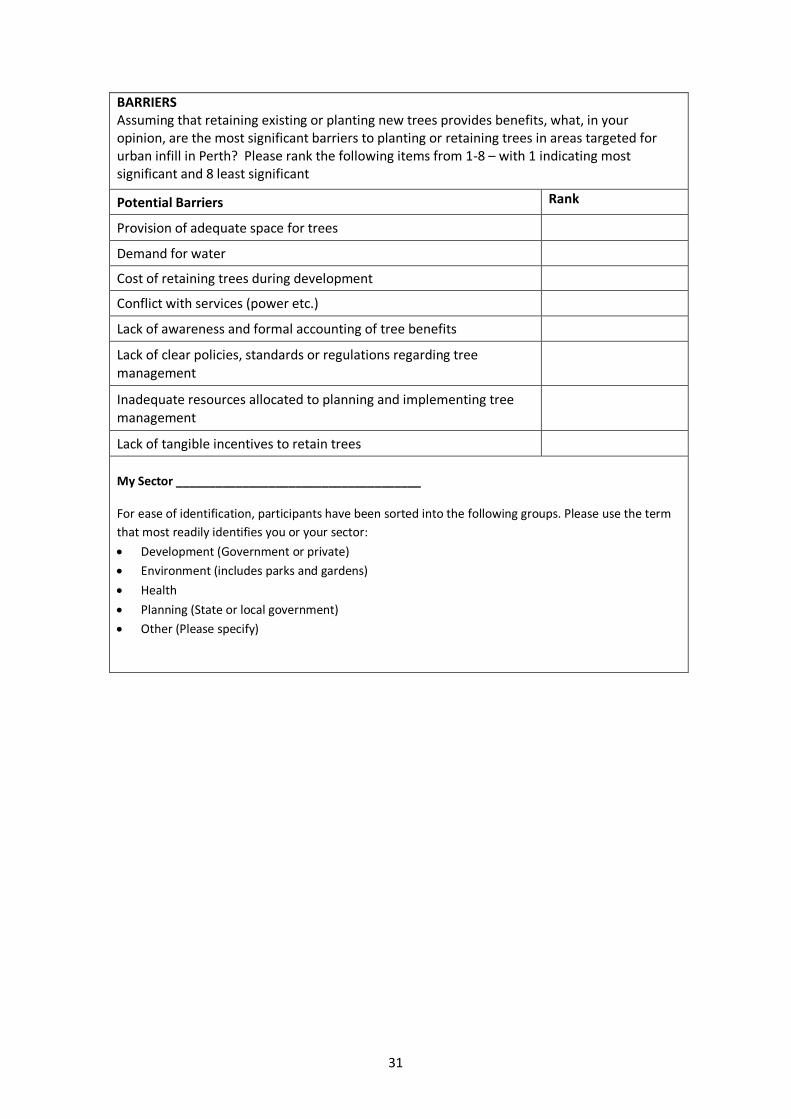
BARRIERS Assuming that retaining existing or planting new trees provides benefits, what, in your opinion, are the most significant barriers to planting or retaining trees in areas targeted for urban infill in Perth? Please rank the following items from 1-8 – with 1 indicating most significant and 8 least significant
Potential Barriers Rank
Provision of adequate space for trees
Demand for water
Cost of retaining trees during development
Conflict with services (power etc.)
Lack of awareness and formal accounting of tree benefits
Lack of clear policies, standards or regulations regarding tree management
Inadequate resources allocated to planning and implementing tree management
Lack of tangible incentives to retain trees
My Sector _____________________________________ For ease of identification, participants have been sorted into the following groups. Please use the term
that most readily identifies you or your sector:
Development (Government or private)
Environment (includes parks and gardens)
Health
Planning (State or local government)
Other (Please specify)
32
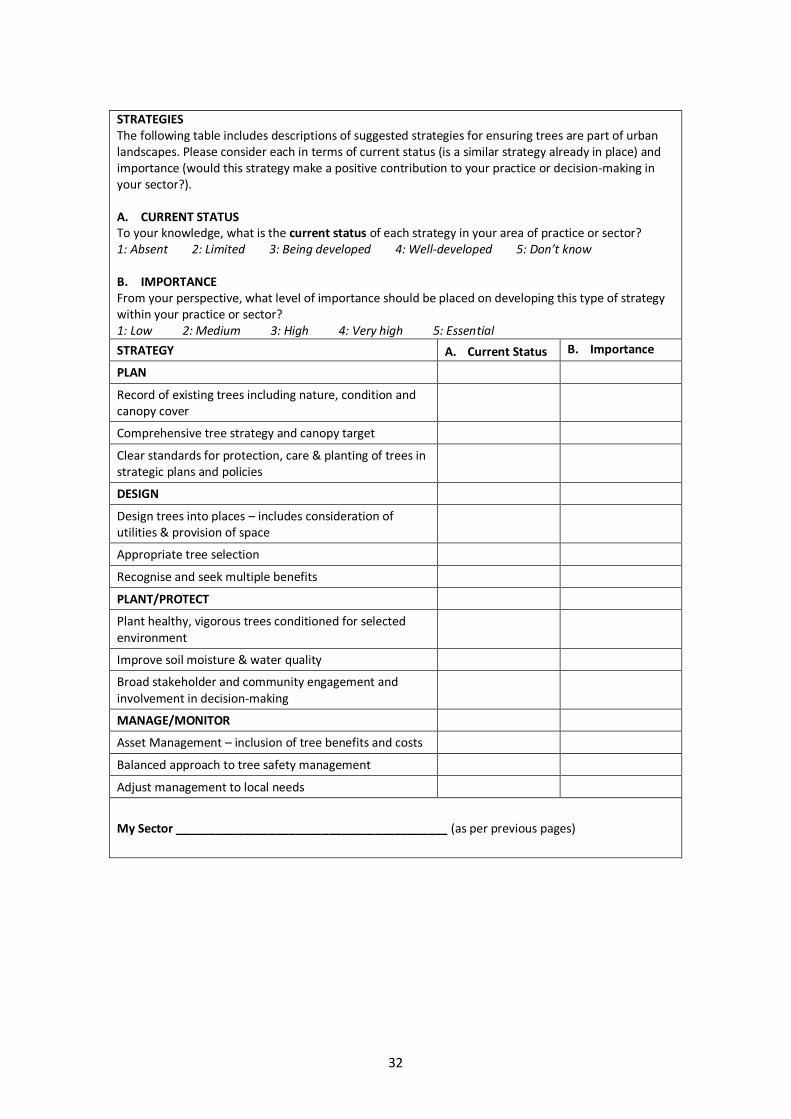
STRATEGIES The following table includes descriptions of suggested strategies for ensuring trees are part of urban landscapes. Please consider each in terms of current status (is a similar strategy already in place) and importance (would this strategy make a positive contribution to your practice or decision-making in your sector?). A. CURRENT STATUS To your knowledge, what is the current status of each strategy in your area of practice or sector? 1: Absent 2: Limited 3: Being developed 4: Well-developed 5: Don’t know B. IMPORTANCE From your perspective, what level of importance should be placed on developing this type of strategy within your practice or sector? 1: Low 2: Medium 3: High 4: Very high 5: Essential
STRATEGY A. Current Status B. Importance
PLAN
Record of existing trees including nature, condition and canopy cover
Comprehensive tree strategy and canopy target
Clear standards for protection, care & planting of trees in strategic plans and policies
DESIGN
Design trees into places – includes consideration of utilities & provision of space
Appropriate tree selection
Recognise and seek multiple benefits
PLANT/PROTECT
Plant healthy, vigorous trees conditioned for selected environment
Improve soil moisture & water quality
Broad stakeholder and community engagement and involvement in decision-making
MANAGE/MONITOR
Asset Management – inclusion of tree benefits and costs
Balanced approach to tree safety management
Adjust management to local needs
My Sector _________________________________________ (as per previous pages)
33
Appendix 2: Participants
Sector Participant Organisation
State Government Teresa Ballestas Department of Health
Melanie Bradley Department of Planning
Tia Byrd Department of Planning
James Duggie Department Environment and Conservation
Dan Ellis-Jones Building Commission
Catherine Garlick Environmental Protection Authority
Deborah Munroe Department of Planning
Erin Tuckwell Department of Water
Peta Turner Department of Health
Lisl van Aarde Department of Planning
Local Government Chris Beaton City of Cockburn
Brad Bowden City of Subiaco
Greg Bowering City of Cockburn
Marcello Druck City of Cockburn
Marius Brand City of Bayswater
Jenni Harrison City of Cockburn
Andy Jarman City of Cockburn
Sue Judd City of Cockburn
Nicki Ledger City of Melville
Michael Leers City of Fremantle
William Schaefer City of Melville
Industry Associations
Karen Barlow WA Local Government Association
Peter Ciemitis Planning Institute of Australia (PIA)
George Crisp Doctors for Environment
Debra Goostrey Urban Development Institute of Australia (WA)
Esther Ngang Nursery and Garden Industry WA
Universities Julie Brunner Curtin University
Dave Hedgecock Curtin University
Dianne Katscherian Curtin University
Jana Soderlund Curtin University
Other Marc Drexel ARCeden
Jane Elton Stockland
Sabrina Hahn Gardens with Soul
Bret Hart Public Health Physician
Francis Kotai Place Laboratory
Brendan Oversby Town Management Engineering
May Carter (Facilitator) PlaceScape
34
References
1 CSIRO, Australian Bureau of Meteorology. 2007. Climate change in Australia: technical report 2007. CSIRO. 148
pp 2 McMichael A. Woodruff R.Whetton P. Hennessy K. Nicholls N. Hales S. Woodward A. and Kjellstom T. 2002.
Human health and climate change in Oceania: a risk assessment. Commonwealth of Australia 3 Bambrick H. Dear, K. Woodruff R. Hanigan I. and McMichael A. 2008. Garnaut climate change review. The
impacts of climate change on three health outcomes: temperature-related mortality and hospitalisations, salmonellosis and other bacterial gastroenteritis, and population at risk from dengue
4 Intergovernmental Panel on Climate Change (IPCC). 2007: Climate Change 2007: Synthesis Report. Contribution of Working Groups I, II and III to the Fourth Assessment Report of the Intergovernmental Panel on Climate Change [Core Writing Team, Pachauri, R.K and Reisinger, A. (eds.)]. IPCC, Geneva, Switzerland, 104 pp.
5 Department of Health. 2012. Disaster Preparedness Management Unit. State emergency management plan for heatwave.WESTPLAN – heatwave. Government of Western Australia
6 US EPA. Undated. Reducing Urban Heat Islands: Compendium of Strategies (online) http://www.epa.gov/heatisland/resources/pdf/BasicsCompendium.pdf Accessed May 2103.
7 United States Environmental Protection Agency (US EPA) (Content Source);Cutler J. Cleveland (Topic Editor) "Environmental effects of urban trees and vegetation". In: Encyclopedia of Earth. Eds. Cutler J. Cleveland (Washington, D.C.: Environmental Information Coalition, National Council for Science and the Environment). [First published in the Encyclopaedia of Earth April 26, 2007 (online) http://www.eoearth.org/article/Environmental_effects_of_urban_trees_and_vegetation Accessed April, 2013
8 Oke T.R. 1982. The energetic basis of the urban heat island. Quarterly Journal of the Royal Meteorological Society104 (455): 1-24
9 Stone B, Vargo J, and Habeeb D. 2012. Managing climate change in cities: Will climate action plans work? Landscape and Urban Planning 107: 263– 271
10 Ibid 11
Coutts A. Beringer J and Tapper N. 2010. Changing Urban Climate and CO2 Emissions: Implications for the Development of Policies for Sustainable Cities, Urban Policy and Research 28:1, 27-47
12 Greater London Authority. 2006. London’s Urban Heat Island: A Summary for Decision Makers (online) http://static.london.gov.uk/mayor/environment/climate-change/docs/UHI_summary_report.pdf Accessed
April 2013 13
CouttsA.BeringerJ and TapperN. 2010. Changing Urban Climate and CO2 Emissions: Implications for the Development of Policies for Sustainable Cities, Urban Policy and Research 28:1, 27-47
14 Tapper N and Loughnan. 2010. Towards Management of Urban Heat Stress in Urban Environments: Recent
Developments in Melbourne, Victoria. Presentation (online) http://www.crepatientsafety.org.au/seminars/heatwave/session1_tapper_heatwaves.pdf Accessed May 2103.
15 Ibid 16
United States Environmental Protection Agency (US EPA). 2013. Heat island effect. (online) http://www.epa.gov/hiri/index.htmAccessed April 2013
17 Rizwan A.M. Dennis L. and Liu Y.C. 2007.A review on the generation, determination and mitigation of Urban Heat Island. Journal of Environmental Sciences 20:120–128
18 Coutts A.M. Beringer J. and Tapper N.J. 2007. Impact of increasing Urban Density on Local Climate: Spatial Variations in the Surface Energy Balance in Melbourne. Journal of Applied Meteorology and Climatology 46:477-492
19 Fehrenbach U. Scherer D. and Parlow E. 2001. Automated classification of planning objectives for the consideration of climate and air quality in urban and regional planning for the example of the region of Basel/Switzerland. Atmospheric Environment 35: 5605-5615
20 Department of Planning 2013. Capital City Planning Framework - February 2013(online)
http://www.planning.wa.gov.au/publications/2632.asp Accessed April 2013.
21 Canadian Centre for Occupational Health and Safety. 2013. Hot environments: health effects. (online) http://www.ccohs.ca/oshanswers/phys_agents/heat_health.html Accessed May 2013.
22 Ibid 23 Natural Resources Canada 2013. Health Effects of Climate Change and Climate Variability. (online)
http://www.nrcan.gc.ca/earth-sciences/products-services/publications/climate-change/climate-change-impacts-adaptation/237 Accessed April 2013
35
24 Spickett J. Brown H. Katscherian D. 2007. Health impacts of climate change: Adaptation strategies for Western
Australia. Department of Health. 25 Tawatsupa B. Yiengprugsawan V. Kjellstrom T. Seubsman S. and Sleigh A. 2012. Heat stress, health and well-
being: findings from a large national cohort of Thai adults. BMJ Open 2012;2:e001396doi:10.1136/bmjopen-2012-001396 Accessed May 2013.
26 Canadian Centre for Occupational Health and Safety (CCOHS). 2013. Hot environments: health effects. (online) http://www.ccohs.ca/oshanswers/phys_agents/heat_health.html. Accessed May 2013.
27 January 2009 Heatwave in Victoria: an Assessment of Health Impacts. Published by the Victorian Government Department of Human Services Melbourne, Victoria, 2009 www.health.vic.gov.au Accessed Feb 2012
28 National Health and Medical Research Council 2013. Climate change. Australian Government. (online)http://www.nhmrc.gov.au/your-health/climate-change Accessed April 2013
29 US EPA 1992.Cooling our communities: a guidebook on tree planting and light coloured surfacing. 30 Ibid. 31 Williams N. 2008. Climate change strategies for urban environments and opportunities for the horticulture
industry. Melbourne University Presentation at the NGIV Landscape Expo August 2008 32 Akbari, H. Pomerantz, M. Taha, H. 2001. Cool surfaces and shade trees to reduce energy use and improve air
quality in urban areas. Solar Energy. 70 (3) 295-310 33 Western Power. 2013. Reducing peak demand. (online)
http://www.westernpower.com.au/aboutus/save_electricity/Reducing_peak_demand.html Accessed April 2013.
34 Stone B. Vargo J. and Habeeb D. 2012.Managing climate change in cities: Will climate action plans work? Landscape and Urban Planning 107 (2012) 263– 271
35 Barton H. MitchamC. and Tsourou C. 2003 Healthy urban planning in practice: experience of European cities. World Health Organisation Europe.
36 Healthy Places and Spaces. 2013. (online) http://www.healthyplaces.org.au/site/index.phpAccessed April 2013.
37 Pandit R. Polyakov M. Tapsuwan S. and Moran T. 2013. The effect of street trees on property value in Perth, Western Australia. Landscape and Urban Planning 110:134–142. http://dx.doi.org/10.1016/j.landurbplan.2012.11.001
38 Western Australian Planning Commission and Department of Planning. 2010. Directions 2031 and beyond: metropolitan planning beyond the horizon. Government of Western Australia.
39 Department of Planning 2010, Directions 2031 and beyond: directions 2031: metropolitan planning beyond the horizon (online) http://www.planning.wa.gov.au/dop_pub_pdf/plan_directions2031_Part1.pdf Accessed April 2013
40 Department of Planning 2013. Capital City Planning Framework - February 2013(online) http://www.planning.wa.gov.au/publications/2632.asp Accessed April 2013.
41 US EPA 1992.Cooling our communities: a guidebook on tree planting and light coloured surfacing. 42
Department of Sustainability and Environment Victoria. 2011. Urban Forestry Background Issues Paper 43 Hall, T, 2010. The Life and Death of the Australian Backyard, CSIRO Publishing 44 Brunner J and Cozens P. 2012: ‘Where Have All the Trees Gone?’ Urban Consolidation and the Demise of
Urban Vegetation: A Case Study from Western Australia, Planning Practice & Research. DOI:10.1080/02697459.2012.733525 Accessed Nov 2012
45 Caccetta P. 2013. Personal communication. Urban Monitor Project.CSIRO. 2013. 46 Nearmap.com. 2011. (online) http://www.nearmap.com/ Accessed Oct 2011. 47 Trees and Design Action Group.2013 Trees in the townscape: a guide for decision makers. (online)
www.tdag.org.uk Accessed Feb 2013. 48 Newell B. and Proust K. 2012, Introduction to Collaborative Conceptual Modelling, Working Paper, ANU Open
Access Research. https://digitalcollections.anu.edu.au/handle/1885/9386 49 Western Australian Planning Commission and Department of Planning. 2010. Directions 2031 and beyond:
metropolitan planning beyond the horizon. Government of Western Australia. 50 Department of Sustainability and Environment. 2011 Victorian Local Sustainability Accord – Urban Forestry
Background Issues Paper Published by the Victorian Government, Department of Sustainability and Environment (now Department of Environment and Primary Industries), Melbourne (online) www.dse.vic.gov.au Accessed September 2011.
51 City of Melbourne.Urban forest strategy. (online)
https://www.melbourne.vic.gov.au/Sustainability/UrbanForest/Documents/Urban_Forest_Strategy.pdf. Accessed March 2013.
52 City of Sydney. 2013. Urban forest strategy. (online)
http://www.cityofsydney.nsw.gov.au/__data/assets/pdf_file/0003/132249/Urban-Forest-Strategy-Adopted-Feb-2013.pdf Accessed March 2013.

36

37