Embed Size (px)
Citation preview

lable at ScienceDirect
LWT - Food Science and Technology 55 (2014) 301e307
Contents lists avai
LWT - Food Science and Technology
journal homepage: www.elsevier .com/locate/ lwt
Cookie making behavior of wheatebarley flour blends and effects onantioxidant properties
Paras Sharma, Hardeep Singh Gujral*
Department of Food Science and Technology, Guru Nanak Dev University, Amritsar 143005, India
a r t i c l e i n f o
Article history:Received 6 September 2012Received in revised form23 May 2013Accepted 27 August 2013
Keywords:CookiesWater activityTotal flavonoids contentAntioxidant activityPolyphenol oxidase
* Corresponding author. Tel.: þ91 1832258802.E-mail address: [email protected] (H.S. Gujra
0023-6438/$ e see front matter � 2013 Elsevier Ltd.http://dx.doi.org/10.1016/j.lwt.2013.08.019
a b s t r a c t
Refined wheat flour was replaced with whole barley flour at varying levels and the blends were eval-uated for their cookie making behavior. The spread factor of cookies decreased as the proportion ofbarley flour increased while snap force and water activity increased significantly upto 114.7 N and 0.397in only barley flour cookies. Increasing levels of barley flour lead to a significant decrease in L* and b*
values of cookie dough. Peak viscosity (PV) and final viscosity (FV) increased significantly as the levels ofbarley flour increased. A significant increase in antioxidant activity (AOA), total phenolic content (TPC),metal chelating activity (MCA), reducing power (RP) and total flavonoid content (TFC) was observed asthe proportion of barley flour increased. Baking lead to a significant decrease in TPC and TFC whereasAOA, MCA and RP increased. Baking lead to a significant increase in the non-enzymatic browning indexof cookies.
� 2013 Elsevier Ltd. All rights reserved.
1. Introduction
Barley (Hordeum vulgare L.) is considered as a functional grainbecause it contains b-glucan, B-complex vitamins, tocotrienols,tocopherols and has significant antioxidant potential (Madhujith,Izydorczyk, & Shahidi, 2006; Sharma & Gujral, 2010a). It is mainlyutilized in malting and brewing and as animal feed however thesedays it is gaining popularity as a human food in different baked andextruded foods such as cookies, chapattis, breads and extrudedsnacks etc. (Gill, Vasanthan, Ooarikul, & Rossnagel, 2002; Gujral &Gaur, 2002; Sharma & Gujral, 2013).
Barley has higher amount of phenolic compounds and antioxi-dant activity as compared to the more widely consumed cerealswheat and rice (Sharma, Gujral, & Singh, 2012). The phenoliccompounds in barley include; benzoic and cinnamic acid de-rivatives, proanthocyanidins, quinines, flavonols, chalcones, fla-vones, flavanones, and amino phenolic compounds (Goupy,Hugues, Boivin, & Amiot, 1999). The risk imposed by the con-sumption of free radicals and oxidation products could be loweredby the intake of dietary phenolics (Gujral, Sharma, Bajaj, & Solah,2012). The thermal processing of food may have either increasingor lowering effect on phenolic compounds and antioxidant activity(Randhir, Kwon, & Shetty, 2008).
l).
All rights reserved.
The supply of barley bioactive compounds through bakedproducts like cookies may be an effective way (Frost, Adhikari, &Lewis, 2011) to supply the bioactive compounds in barley.Cookies are a low specific volume product and generally requiresoft wheats having lower protein contents as compared to breadwhere gluten content is more important and has a major influenceon bread volume. Replacing wheat flour with barley flour willdefinitely dilute the wheat gluten proteins but since high glutencontent is not a requirement for cookies barley flour could be apotential raw material for cookie making having improved bioac-tive value. Limited studies have been reported on cookie makingbehavior of barley flour and effects of baking on antioxidantproperties. The objectives of the present investigation were tostudy the physicochemical properties, color, pasting and cookiemaking behavior of the wheatebarley flour blends and the effectsof baking on the antioxidant properties.
2. Materials and methods
2.1. Milling of hulled barley and wheat
From our previous study carried out on eight different hulledbarley cultivars (Sharma, Gujral, & Rosell, 2011) we selected thebarley cultivar PL-172 for cookie making because it containedhigher amount of total b-glucan (5.3� 0.1 g/100 g flour) and is mostcommonly grown in North India. Barley was dehusked as describedby Sharma and Gujral (2010b) and milled in a stone mill (AmarIndustries, Amritsar, India) to obtain whole barley flour. Wheat

P. Sharma, H.S. Gujral / LWT - Food Science and Technology 55 (2014) 301e307302
cultivar PBW-343 was subjected to roller milling (BrabenderQuadrument Junior, Germany) to obtain refined flour having anextraction rate of 72 g/100 g flour. The wheat flour was replacedwith whole barley flour from PL-172 and the blends were reportedas control (100 parts of wheat flour), WBF-25% (wheatebarley flourblend with 25 parts barley flour and 75 parts of wheat flour), WBF-50% (wheatebarley flour blend with 50 parts barley flour and 50parts of wheat flour) andWBF-75% (wheatebarley flour blend with75 parts barley flour and 25 parts of wheat flour), WBF-100% (100parts of barley flour).
2.2. Reagents
Standard ferulic acid, 2,2-diphenyl-1-picrylhydrazyl (DPPH),ferrozine, protease (from Streptomyces griseus) and catechin wereprocured from SigmaeAldrich (Steinheim, Germany). L-Ascorbicacid, potassium ferricyanide, ferric chloride, ferrous chloride, tri-chloroacetic acid, sodium carbonate and FolineCiocalteu’s reagentwere procured from Loba Chemie, Mumbai, India. All chemicalswere of analytical grade. Each test was performed in triplicates ondry weight basis. The Milli Q water (Millipore, France) was used forall analytical tests.
2.3. Water absorption capacity, water solubility index and oilabsorption capacity
Water absorption capacity and water solubility index of wheatebarley flour blends were measured as described by Sharma andGujral (2010b). The oil absorption capacity was determined ac-cording to method of Lin, Humbert, and Sosulski. (1974).
2.4. Cookies preparation
The cookies were prepared by AACC method (10-50D) using thefollowing ingredientse flour (225 g,14%moisture basis) shortening(vegetable ghee, Dalda, India) (64 g), sugar (130 g), salt (2.1 g),sodium bicarbonate (2.5 g), distilled water (16 ml) and 33 ml ofdextrose solution (5.93 g dextrose/100 ml water). The width,diameter and spread factor were calculated as described in AACCmethod (10-50D). The bake loss of cookies was calculated byweighing five cookies before and after baking. The difference inweight was noticed, averaged and reported as percent bake loss.
2.5. Preparation of dough and cookie sample for analysis
A portion of the cookie dough was freeze dried in a freeze dryer(Heto, Switzerland). The freeze dried dough was ground in a lab-oratory grinder (Sujata, India). Similarly, the cookies were alsoground and resulting flour was stored at �20 �C until furtheranalysis. The powder sample produced after grinding the cookie ishereafter reported to as cookie flour.
2.6. Water activity
Water activity of cookies was measured using a water activitymeter (AquaLab, Model 3TE, Decagon Devices Inc., Pullman, WA).
2.7. Color characteristics
Color measurement of flours, flour blends, cookies surface andground cookies was carried out using a Hunter Colorimeter fittedwith optical sensor (Hunter Associates Laboratory Inc., Reston, VA,USA) on the basis of CIE L*, a*, b* color system.
2.8. Pasting properties
Pasting properties of flours, flour blends and freeze dried cookiedough were studied using a Rapid Visco Analyzer (Newport Sci-entific Pty Ltd., Australia) using the Standard profile 1.
2.9. Texture analysis
The fracture force of cookies was determined on a TextureAnalyzer (Model TA-HDi Stable Microsystem, Surrey, UK). Thecookies were placed on a bridge with a 44 mm gap between theridges. A blunt edge knife probe having a thickness of 4 mmattached to a 50 kg load cell and traveling at a pre, post and testspeed of 1.5, 10 and 1mm s�1, respectively was used. The peak forceto snap the cookies was reported as fracture force in Newton.
2.10. Sensory evaluation of cookies
A semi-trained panel of 15 members comprising of staff andstudents from the department, evaluated the sensory properties ofthe cookies. A nine-point hedonic scale with 1, dislike extremely; 5,neither like nor dislike and 9, like extremely was used (Ajila,Leelavathi, & Prasada-Rao, 2008). Water was provided to rinse themouth between evaluations.
2.11. Total phenolic content (TPC)
The total phenolic content (TPC) was determined according theFolineCiocalteu spectrophotometric method (Gao, Wang, Oomah,& Mazza, 2002). The results were expressed as mg of ferulic acidequivalents (FAE)/g of sample.
2.12. Antioxidant activity (DPPH radical scavenging activity)
Antioxidant activity (AOA) was measured using the methoddescribed by Brand-Williams, Cuvelier, and Berset (1995).
Antioxidant activity was calculated as percent discoloration.
DPPHradical scavengingactivity ð%Þ ¼ð1�ðAof sample t ¼ 30=Aof control t ¼ 0ÞÞ�100
where A is absorbance.
2.13. Reducing power
The reducing power was measured as described by Zhao et al.(2008). A standard curve was prepared using various concentra-tion of ascorbic acid and results were reported as ascorbic acidequivalents (AAE)/g of sample.
2.14. Total flavonoid content (TFC)
The total flavonoid content (TFC) was determined as previouslydescribed by Jia, Tang, and Wu (1998). Catechin was used as stan-dard and results were reported as microgram catechin equivalent(CE)/g of sample.
2.15. Metal chelating (Feþ2) activity
The metal chelating activity of samples was measured as re-ported by Dinis, Madeira, and Almeidam (1994). The chelating ac-tivity of the extract for Feþ2 was calculated as follows:

Iron�Feþ2
�chelating activity ð%Þ ¼ f1� ðAbsorbance of sample at 562 nm=Absorbance of control at 562 nmÞg � 100
P. Sharma, H.S. Gujral / LWT - Food Science and Technology 55 (2014) 301e307 303
2.16. Non-enzymatic browning (NEB) index
Non-enzymatic browning index (NEB) of the samples wasdetermined as previously reported by Sharma and Gujral (2011).The browning index (DA) was calculated as follows:
DA ¼ Absorbance at 420 nm� Absorbance at 550 nm
2.17. Polyphenol oxidase (PPO) activity
Polyphenol oxidase activity was determined using the standardmethod 22-85 of the AACC (2000).
2.18. Statistical analysis
Analysis of variance (ANOVA) was carried out using MicrosoftExcel software and Fishers least significant difference (LSD) testwas used to describe means with 95% (p < 0.05) confidence. All thetests were carried out in triplicate on dry weight basis.
3. Results and discussions
3.1. Physicochemical properties of wheatebarley flour blends
Replacement of wheat flour with barley flour significantly(p � 0.05) increased the water absorption capacity and water sol-ubility index (Table 1) which is attributed to increased levels of b-glucan in the blends (Bhatty, 1986). Increasing the levels of barleyflour inwheat flour blend insignificantly (p> 0.05) increased the oilabsorption capacity of the blends, the increase may be attributed tothe higher fiber content of the blends and the surface of fiber has ahigh capacity to hold oil by a mechanical process.
3.2. Physical characteristics of cookies
The width of the cookies decreased and thickness increased asthe levels of barley flour in the blends increased as a result thespread factor of the cookies decreased by upto 31.0% when wheatflour was completely replaced by barley flour (Table 1). Gujral,Mehta, Samra, and Goyal (2003) and Sudha, Vetrimani, andLeelavathi (2007) reported a similar decrease in spread factorupon incorporation of barley, rice and wheat bran to wheat flour.Lee, Warner, and Inglett (2005) reported that the spread factor forcookies decreased upon addition of oat b-glucan inwheat flour. Theincreased level of fiber and b-glucan absorb more water, the waterin the cookie formulation is already limited as a result the doughremained harder consequently less spread ratio (Ajila et al., 2008).
Table 1Physicochemical properties of wheatebarley flour blends and physical characteristics of
Parts of whole barley flour in 100parts of wheatebarley flour blend
Water absorptioncapacity (g/100 g)
Water solubilityindex (g/100 g)
Oil acapa
0 113a � 0.05 7.75a � 0.07 1.2225 126b � 0.01 8.30b � 0.02 1.2350 141c � 0.02 8.85 c� 0.07 1.2775 155d � 0.01 9.20d � 0.04 1.28100 163e � 0.01 10.00e � 0.14 1.53
Values represent mean � standard deviation. Superscripts a, b, c, d and e differ significa
Surface characteristics of cookies are also an important qualityparameter. Incorporation of barley flour upto 50 percent to wheatflour increased the surface cracks however, further replacementdecreased the number of surface cracks but depth of cracksincreased (figure not shown). This might be attributed to increasedlevels of soluble fiber that lead to increased number of hydrophilicsites available that compete for the limited free water in cookiedough and dilution of gluten protein (McWatters, 1978). The snapforce of cookies increased with increasing levels of barley flour andwas significantly highest at 75 percent. Frost et al. (2011) and Sudhaet al. (2007) reported that replacement of wheat flour with barleyflour significantly increased the breaking strength of cookies.Similar results were also reported by Lee and Inglett (2006) forcookies prepared by replacing wheat flour by oat bran.
Increasing the proportion of barley flour in the blends signifi-cantly (p � 0.05) increased the water activity of cookies which maybe attributed to higher levels of fiber including b-glucanwhich holdmore water (Lebesi & Tzia, 2011; Lee & Inglett, 2006). Decrease inbake loss upon replacement of wheat flour with barley flour mayagain be attributed to the higher water retention ability of solubleand insoluble fibers present in barley flour as compared to thewheat flour (Ajila et al., 2008).
3.3. Color characteristics
The cookie dough color significantly decreased for lightness L*
and b* values while a significant (p � 0.05) increase in redness (a*)was observed that is attributed to the color changes being broughtabout by the whole barley flour replacing the refined wheat flour(Table 2). The cookie surface color increased for lightness from 60.7to 68.7, whereas a* and b* values decreased from 9.6 to 6.1 and 23.4to 18.0, respectively.
Baking of the dough into cookies lead to a significant decrease inL* (lightness) whereas a significant increase in a* (redness) and b*
(yellowness) was observed as compared to their correspondingdough. Maillard browning and caramelization of sugar is consid-ered to produce brown pigments during baking (Laguna, Salvador,Sanz, & Fiszman, 2011). These browning reactions are influenced bymany factors such as water activity, pH, temperature, sugars, typeand ratio of amino compounds (Sharma & Gujral, 2013; Stojceska,Ainsworth, Plunkett, & Ibanoglu, 2009).
3.4. Pasting properties
Peak, breakdown, setback and final viscosity of whole barleyflour was significantly higher than that of wheat flour (Table 3)however the pasting temperature (PT) of wheat flour was signifi-cantly higher than that of barley flour. When proportion of barley
cookies prepared from wheatebarley flour blends.
bsorptioncity (g/100 g)
Bake loss(g/100 g)
Snap force(N)
Water activity(aw)
Spreadfactor
a � 0.13 11.3c � 0.3 96.1a � 0.5 0.354a � 0.002 7.1d � 0.1a � 0.08 10.7b � 0.1 100.2a � 1.1 0.368b � 0.003 6.0c � 0.1a � 0.02 10.4b � 0.2 101.9a � 0.6 0.372b � 0.002 5.5b � 0.1a � 0.11 10.5b � 0.1 132.3b � 1.2 0.384c � 0.002 5.1a � 0.1b � 0.06 10.0a � 0.4 114.7a � 1.2 0.397d � 0.003 4.9a � 0.1
ntly (p � 0.05) column wise among the blends.

Table 2Color characteristics of cookies dough, cookies surface and ground cookies prepared from wheatebarley flour blends.
Parts of whole barley flour in 100parts of wheatebarley flour blend
Cookie dough Cookies surface Ground cookies
L* a* b* L* a* b* L* a* b*
0 83.5dr � 0.2 �0.33aj � 0.04 19.4ex � 0.2 60.7aq � 0.2 9.6ek � 0.1 23.4ey � 0.1 51.7ap � 0.3 13.5dl � 0.1 30.0dz � 0.225 81.9cr � 0.1 �0.03aj � 0.02 17.5dx � 0.1 62.7bq � 0.1 8.2dk � 0.1 22.6dy � 0.1 56.6bp � 0.1 11.1cl � 0.3 29.1cz � 0.250 81.0br � 0.2 0.24bj � 0.06 16.5cx � 0.1 63.9cq � 0.5 7.4ck � 0.1 20.6cy � 0.1 57.6cp � 0.3 9.5bl � 0.2 27.2bz � 0.375 80.0ar � 0.3 0.39cj � 0.01 15.5bx � 0.2 64.9dq � 0.1 6.6bk � 0.2 19.3by � 0.3 57.7cp � 0.4 9.4bl � 0.1 27.0bz � 0.1100 80.1ar � 0.1 0.74dj � 0.02 14.6ax � 0.1 68.7eq � 0.2 6.1ak � 0.1 18.0ay � 0.1 60.8dp � 0.1 8.1al � 0.1 24.4az � 0.1
Values represent mean� standard deviation. Superscripts a, b, c, d and e differ significantly (p� 0.05) columnwise among different blends. Superscripts p, q, r (for L*) and j, k, l(for a*) and x, y, z (for b*) show significant (p � 0.05) differences after baking of the dough into cookies.
P. Sharma, H.S. Gujral / LWT - Food Science and Technology 55 (2014) 301e307304
flour in wheat flour increased a progressive increase in peak, finaland breakdown viscosity (PV) was observed, which may beattributed to the soluble fibers in the barley flour. The peak andfinal viscosities of the wheatebarley flour blends showed a corre-lation coefficient of 0.63 and 0.79 respectively with the cookie snapforce.
The cookie dough after freeze drying exhibited very low peakviscosity which increased with increasing levels of barley flour. Thefinal viscosities were also very low as compared to the flour blendsand this may be attributed to the low level of flour in the doughformulation and to the pasting in the presence of sugar that resultsin lower peak and final viscosity. Also, fat/shortening lower thepasting viscosity (Zhou, Robards, Glennie-Holmes, & Helliwell,1999).
3.5. Total phenolic content
The TPC increased significantly as the proportion of barley flourin the blends increased (Table 4). It has been reported that wheathas less phenolic content as compared to barley (Stratil, Klejdus, &Kuban, 2007). Whole barley flour was used in this study andphenolic compounds are known to be more concentrated in theouter fractions as compared to inner parts of the grain (Madhujithet al., 2006). Liyana-Pathirana and Shahidi (2007) reported a totalphenolic content of 769 mg FAE/g in defatted wheat flour.Holtekjolen, Baevere, Rodbotten, Berg, and Knutsen (2008) re-ported that replacement of wheat flour with barley flour lead to asignificant increase in total phenolic content.
Baking lead to a significant (p � 0.05) decrease of upto 19.2% intotal phenolic content. Holtekjolen et al. (2008) reported that thebaking of bread containing barley flour exhibited decrease in TPC.The decrease in TPC may be attributed to alteration in the chemicalstructure of the phenolic compounds, possible polymerizationleading to reduced extractability and oxidation (Altan, McCarthy, &Maskan, 2009; Sharma & Gujral, 2011).
3.6. Antioxidant activity (DPPH free radical scavenging activity)
Increasing the level of barley flour in the wheatebarley blendsprogressively increased the antioxidant activity from 8.8 to 17.0%(Table 4) and this is attributed to the higher antioxidant activity of
Table 3Pasting properties of wheatebarley four blends and their corresponding cookie dough.
Parts of whole barley flour in 100parts of wheatebarley flour blend
Flour blends
0 25 50 75
Peak viscosity (cP) 1343a � 13 1577b � 11 1759c � 9 1819Breakdown viscosity (cP) 352a � 4 423b � 5 529c � 2 671Final viscosity (cP) 1964a � 7 2043b � 3 2115c � 5 2251Setback viscosity (cP) 973b � 5 889a � 2 885a � 5 1103Pasting temperature (�C) 95.5d � 0.2 94.7c � 0.3 94.5c � 0.3 93.5
Values represent mean � standard deviation. Superscripts a, b, c, d and e differ significa
the whole barley flour as compared to wheat flour. Baking furtherincreased the antioxidant activity upto 22.3%. Holtekjolen et al.(2008) also reported similar results upon baking for bread pre-pared by incorporating barley flour. Vitali, Dragojevic, and Sebecic(2009) observed that the baking of fiber incorporated biscuitslead to a significant (p � 0.05) increase in antioxidant activity. Theincrease in antioxidant activity may be attributed to formation ofdark color pigments (brown color) during the baking process due tothe Maillard browning and these pigments have been reported tohave antioxidant activity (Manzocco, Calligaris, Mastrocola, Nicoli,& Lerici, 2000; Xu & Chang, 2008).
3.7. Metal chelating activity
Metal chelating activity of cookie dough prepared from onlywheat and only barley flour was 15.8 and 48.2%, respectively. Asignificant increase was observed upon incorporation of barleyflour inwheat flour (Table 4) which is attributed to the highermetalchelating and antioxidant activity of barley flour as compared towheat flour (Kahkonen et al., 1999).
Baking of the dough into cookies lead to a significant (p � 0.05)increase of upto 54.5% in metal chelating activity. Filipcev et al.(2011) reported similar results for biscuits prepared by incorpo-rating buckwheat and rye flour to wheat flour. The increase may beattributed to Maillard browning, the soluble part of these com-pounds is known to have metal chelating activity (Rufian-Henares& Delgado-Andrade, 2009) and the formation of these compoundsdepends upon different factors such as chemical composition ofraw material, process conditions and water activity. It has beenwidely reported that thermal processing of food material generatesMaillard browning pigments which are known to have greaterantioxidant activity and these compounds have antioxidant po-tential greater than their precursors (Nicoli, Anese, Parpinel,Franceschi, & Lerici, 1997).
3.8. Reducing power
The oxidized intermediates of the lipid peroxidation reactionscan be reduced by electron donor compounds therefore they areconsidered as reducing agents and thus as primary or secondaryantioxidants (Sharma & Gujral, 2011). The reducing power of an
Cookie dough
100 0 25 50 75 100
d � 11 2068e � 10 2a � 0.3 16b � 2 35c � 3 43d � 1 62e � 2d � 4 823e � 3 1a � 0 11c � 1 2a � 1 4b � 1 2a � 0d � 6 2326e � 1 174a � 2 313b � 3 315c � 2 346d � 4 369e � 2d � 7 1077c � 10 173a � 1 308c � 8 278b � 7 307c � 7 309c � 3b � 0.3 81.6a � 0.4 ND ND ND ND ND
ntly (p � 0.05) row wise among different blends. ND e not detected.
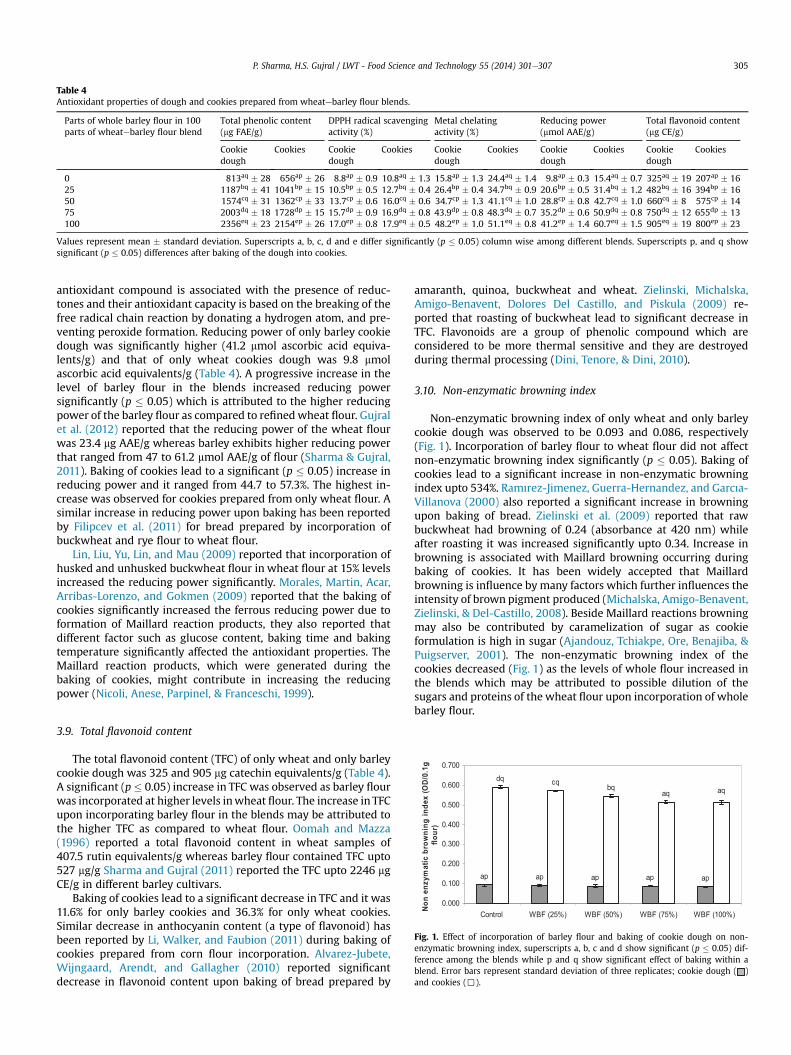
Table 4Antioxidant properties of dough and cookies prepared from wheatebarley flour blends.
Parts of whole barley flour in 100parts of wheatebarley flour blend
Total phenolic content(mg FAE/g)
DPPH radical scavengingactivity (%)
Metal chelatingactivity (%)
Reducing power(mmol AAE/g)
Total flavonoid content(mg CE/g)
Cookiedough
Cookies Cookiedough
Cookies Cookiedough
Cookies Cookiedough
Cookies Cookiedough
Cookies
0 813aq � 28 656ap � 26 8.8ap � 0.9 10.8aq � 1.3 15.8ap � 1.3 24.4aq � 1.4 9.8ap � 0.3 15.4aq � 0.7 325aq � 19 207ap � 1625 1187bq � 41 1041bp � 15 10.5bp � 0.5 12.7bq � 0.4 26.4bp � 0.4 34.7bq � 0.9 20.6bp � 0.5 31.4bq � 1.2 482bq � 16 394bp � 1650 1574cq � 31 1362cp � 33 13.7cp � 0.6 16.0cq � 0.6 34.7cp � 1.3 41.1cq � 1.0 28.8cp � 0.8 42.7cq � 1.0 660cq � 8 575cp � 1475 2003dq � 18 1728dp � 15 15.7dp � 0.9 16.9dq � 0.8 43.9dp � 0.8 48.3dq � 0.7 35.2dp � 0.6 50.9dq � 0.8 750dq � 12 655dp � 13100 2356eq � 23 2154ep � 26 17.0ep � 0.8 17.9eq � 0.5 48.2ep � 1.0 51.1eq � 0.8 41.2ep � 1.4 60.7eq � 1.5 905eq � 19 800ep � 23
Values represent mean � standard deviation. Superscripts a, b, c, d and e differ significantly (p � 0.05) column wise among different blends. Superscripts p, and q showsignificant (p � 0.05) differences after baking of the dough into cookies.
P. Sharma, H.S. Gujral / LWT - Food Science and Technology 55 (2014) 301e307 305
antioxidant compound is associated with the presence of reduc-tones and their antioxidant capacity is based on the breaking of thefree radical chain reaction by donating a hydrogen atom, and pre-venting peroxide formation. Reducing power of only barley cookiedough was significantly higher (41.2 mmol ascorbic acid equiva-lents/g) and that of only wheat cookies dough was 9.8 mmolascorbic acid equivalents/g (Table 4). A progressive increase in thelevel of barley flour in the blends increased reducing powersignificantly (p � 0.05) which is attributed to the higher reducingpower of the barley flour as compared to refinedwheat flour. Gujralet al. (2012) reported that the reducing power of the wheat flourwas 23.4 mg AAE/g whereas barley exhibits higher reducing powerthat ranged from 47 to 61.2 mmol AAE/g of flour (Sharma & Gujral,2011). Baking of cookies lead to a significant (p � 0.05) increase inreducing power and it ranged from 44.7 to 57.3%. The highest in-crease was observed for cookies prepared from only wheat flour. Asimilar increase in reducing power upon baking has been reportedby Filipcev et al. (2011) for bread prepared by incorporation ofbuckwheat and rye flour to wheat flour.
Lin, Liu, Yu, Lin, and Mau (2009) reported that incorporation ofhusked and unhusked buckwheat flour in wheat flour at 15% levelsincreased the reducing power significantly. Morales, Martin, Acar,Arribas-Lorenzo, and Gokmen (2009) reported that the baking ofcookies significantly increased the ferrous reducing power due toformation of Maillard reaction products, they also reported thatdifferent factor such as glucose content, baking time and bakingtemperature significantly affected the antioxidant properties. TheMaillard reaction products, which were generated during thebaking of cookies, might contribute in increasing the reducingpower (Nicoli, Anese, Parpinel, & Franceschi, 1999).
ap ap ap ap ap
dq cqbq
aq aq
0.000
0.100
0.200
0.300
0.400
0.500
0.600
0.700
Control WBF (25%) WBF (50%) WBF (75%) WBF (100%)
No
n e
nz
ym
atic
b
ro
wn
in
g in
de
x (O
D/0
.1
g
flo
ur)
Fig. 1. Effect of incorporation of barley flour and baking of cookie dough on non-enzymatic browning index, superscripts a, b, c and d show significant (p � 0.05) dif-ference among the blends while p and q show significant effect of baking within ablend. Error bars represent standard deviation of three replicates; cookie dough ( )and cookies (,).
3.9. Total flavonoid content
The total flavonoid content (TFC) of only wheat and only barleycookie dough was 325 and 905 mg catechin equivalents/g (Table 4).A significant (p � 0.05) increase in TFC was observed as barley flourwas incorporated at higher levels inwheat flour. The increase in TFCupon incorporating barley flour in the blends may be attributed tothe higher TFC as compared to wheat flour. Oomah and Mazza(1996) reported a total flavonoid content in wheat samples of407.5 rutin equivalents/g whereas barley flour contained TFC upto527 mg/g Sharma and Gujral (2011) reported the TFC upto 2246 mgCE/g in different barley cultivars.
Baking of cookies lead to a significant decrease in TFC and it was11.6% for only barley cookies and 36.3% for only wheat cookies.Similar decrease in anthocyanin content (a type of flavonoid) hasbeen reported by Li, Walker, and Faubion (2011) during baking ofcookies prepared from corn flour incorporation. Alvarez-Jubete,Wijngaard, Arendt, and Gallagher (2010) reported significantdecrease in flavonoid content upon baking of bread prepared by
amaranth, quinoa, buckwheat and wheat. Zielinski, Michalska,Amigo-Benavent, Dolores Del Castillo, and Piskula (2009) re-ported that roasting of buckwheat lead to significant decrease inTFC. Flavonoids are a group of phenolic compound which areconsidered to be more thermal sensitive and they are destroyedduring thermal processing (Dini, Tenore, & Dini, 2010).
3.10. Non-enzymatic browning index
Non-enzymatic browning index of only wheat and only barleycookie dough was observed to be 0.093 and 0.086, respectively(Fig. 1). Incorporation of barley flour to wheat flour did not affectnon-enzymatic browning index significantly (p � 0.05). Baking ofcookies lead to a significant increase in non-enzymatic browningindex upto 534%. Ramırez-Jimenez, Guerra-Hernandez, and Garcıa-Villanova (2000) also reported a significant increase in browningupon baking of bread. Zielinski et al. (2009) reported that rawbuckwheat had browning of 0.24 (absorbance at 420 nm) whileafter roasting it was increased significantly upto 0.34. Increase inbrowning is associated with Maillard browning occurring duringbaking of cookies. It has been widely accepted that Maillardbrowning is influence by many factors which further influences theintensity of brown pigment produced (Michalska, Amigo-Benavent,Zielinski, & Del-Castillo, 2008). Beside Maillard reactions browningmay also be contributed by caramelization of sugar as cookieformulation is high in sugar (Ajandouz, Tchiakpe, Ore, Benajiba, &Puigserver, 2001). The non-enzymatic browning index of thecookies decreased (Fig. 1) as the levels of whole flour increased inthe blends which may be attributed to possible dilution of thesugars and proteins of the wheat flour upon incorporation of wholebarley flour.

eq
dqcq
bqaq
epdp
cpbp
ap
0.000
0.050
0.100
0.150
0.200
0.250
0.300
Control WBF (25%) WBF (50%) WBF (75%) WBF (100%)
PP
O a
ctiv
ity
(Δ
47
5/m
in
g
flo
ur)
Fig. 2. Effect of incorporation of barley flour and their dough making on polyphenoloxidase (PPO) activity, superscripts a, b, c, d and e show significant (p � 0.05) differ-ence among the blends while p and q show significant effect of cookie dough makingwithin a blend. Error bars represent standard deviation of three replicates; flour blends( ) and cookie dough (,).
P. Sharma, H.S. Gujral / LWT - Food Science and Technology 55 (2014) 301e307306
3.11. Polyphenol oxidase activity
Polyphenol oxidase (PPO) activity of only wheat and only barleyflour was 0.161 and 0.261 D475/min g (Fig. 2). Incorporation ofbarley flour to wheat flour lead to a progressive and significantincrease in PPO activity. Fuerst, Anderson, and Morris (2006) re-ported that the PPO activity ranged from 0.0018 to 0.0089 D475/min g in refined flour of different wheat cultivars. Quinde-Axtell,Powers, and Baik (2006) reported that the whole barley flour hadPPO activity ranging from 94.6 to 171.4 unit/g. PPO is concentratedin outer layers of the grain thus degree of milling or pearling havepronounced effect on its activity (Hatcher & Kruger, 1997). Therefined wheat flour was replaced with whole barley therefore; in-crease in PPO activity was noticed. It is important to measure thePPO activity of the cookie dough because during dough makinghydration of flour can activate the PPO enzyme that may increasediscoloration especially on the surface of dough that is exposed toair and the extent of the discoloration will depend on the durationfor which the dough remains standing on the baking line.
3.12. Sensory characteristics of cookies
Incorporation of barley flour in wheat flour significantly(p � 0.05) affected the sensory characteristics of cookies (data notshown). The highest surface color score was achieved by cookiesprepared from blend containing barley flour at 25 percent level,however further increase in barley flour lowered the surface colorscores. The score for surface appearance also decreasedwhen barleyflourwas incorporated at over 25percent level. The scores for texturedecreased as the level of barley flour increased. The aroma scoreinitially showed a decrease and then an increase with increasinglevel of barley flour however they were not statistically significant.The overall acceptability of the cookies decreased with increasinglevel of barley flour incorporation however, the cookies made from100 percent barley flour remained acceptable receiving a score of 7.1by the panel. Frost et al. (2011) reported that cookies prepared fromincorporation of barley flour at level of 70 percentwere acceptable tothe consumer. Skrbic and Cvejanov (2011) also reported similar re-sults for cookies prepared from incorporation of barley flour. Sudhaet al. (2007) reported that 20 percent incorporation of barley braninwheatflourdidnot affect the sensoryqualityof biscuits but furtherincrease in level of barley brandecreased theacceptabilityof biscuits.
4. Conclusions
The physicochemical properties of the blends and color char-acteristics of the cookies were significantly influenced by the
incorporation of barley flour. The final pasting viscosity of theblends correlated with the cookie snap force. Barley flour incor-poration increased the polyphenol oxidase activity and a reductionin the browning reactions was observed that correlated well withthe reduction in the Hunter color values. Antioxidant activity, totalphenolic content, metal chelating activity and flavonoid contentincreased as the proportion of barley flour increased. Baking ofdough into cookies lowered the total phenolic content significantlybut the overall antioxidant potential of cookies increased.
Acknowledgment
We are thankful to the Council of Scientific and IndustrialResearch (CSIR), New Delhi for providing the Senior ResearchFellowship (SRF) to Mr. Paras Sharma.
References
American Association of Cereal Chemists. (2000). Approved methods of the AACC.Method 22-85. St. Paul, MN, USA (10th ed.).
Ajandouz, E. H., Tchiakpe, L. S., Ore, F. D., Benajiba, A., & Puigserver, A. (2001). Effectsof pH on caramelization and Maillard reaction kinetics in fructoseelysinemodel systems. Journal of Food Science, 66, 926e931.
Ajila, C. M., Leelavathi, K., & Prasada-Rao, U. J. S. (2008). Improvement of dietaryfiber content and antioxidant properties in soft dough biscuits with theincorporation of mango peel powder. Journal of Cereal Science, 48, 319e326.
Altan, A., McCarthy, K. L., & Maskan, M. (2009). Effect of extrusion process onantioxidant activity, total phenolics and b-glucan content of extrudates devel-oped from barleyefruit and vegetable by-products. International Journal of FoodScience and Technology, 44, 1263e1271.
Alvarez-Jubete, L., Wijngaard, H. H., Arendt, E. K., & Gallagher, E. (2010). Polyphenolcomposition and in vitro antioxidant activity of amaranth, quinoa and buck-wheat as affected by sprouting and bread baking. Food Chemistry, 119, 770e778.
Bhatty, R. S. (1986). Physicochemical and functional (bread making) properties ofhull-less barley fractions. Cereal Chemistry, 63, 31e35.
Brand-Williams, W., Cuvelier, M. E., & Berset, C. (1995). Use of a free radicalmethod to evaluate antioxidant activity. Lebensmittel Wissenschaft Tech-nologie, 28, 245e251.
Dinis, T. C. P., Madeira, V. M. C., & Almeidam, L. M. (1994). Action of phenolic de-rivatives (acetaminophen, salicylate, and 5-aminosalicylate) as inhibitors ofmembrane lipid peroxidation and peroxyl radicals scavengers. Archives ofBiochemistry and Biophysics, 315, 161e169.
Dini, I., Tenore, G. C., & Dini, A. (2010). Antioxidant compound contents and anti-oxidant activity before and after cooking in sweet and bitter Chenopodiumquinoa seeds. LWT e Food Science and Technology, 43, 447e451.
Filipcev, B., Smurina, O., Sakac, M., Sedej, I., Jovanov, P., Pestoric, M., et al. (2011).Feasibility of use of buck-wheat flour as an ingredient in ginger nut biscuitformulation. Food Chemistry, 125, 164e170.
Frost, D. J., Adhikari, K., & Lewis, D. S. (2011). Effect of barley flour on the physicaland sensory characteristics of chocolate chip cookies. Journal of Food Science andTechnology, 48, 569e576.
Fuerst, E. P., Anderson, J. V., & Morris, C. F. (2006). Polyphenol oxidase in wheatgrain: whole-kernel and bran assays for total and soluble activity. CerealChemistry, 83, 10e16.
Gao, L., Wang, S., Oomah, B. D., & Mazza, G. (2002). Wheat quality: antioxidantactivity of wheat millstreams. In P. Ng, & C. W. Wrigley (Eds.), Wheat qualityelucidations (pp. 219e233). St Paul, MN: AACC International.
Gill, S., Vasanthan, T., Ooarikul, B., & Rossnagel, B. (2002). Wheat bread quality asinfluenced by the substitution of waxy and regular barley flours in their nativeand extruded forms. Journal of Cereal Science, 36, 219e237.
Goupy, P., Hugues, M., Boivin, P., & Amiot, M. J. (1999). Antioxidant composition andactivity of barley (Hordeum vulgare) and malt extracts and of isolated phenoliccompounds. Journal of the Science of Food and Agriculture, 79, 1625e1634.
Gujral, H. S., & Gaur, S. (2002). Effects of barley flour, wet gluten and liquidshortening on the texture and storage characteristics of chapatti. Journal TextureStudies, 33, 461e469.
Gujral, H. S., Mehta, S., Samra, I. S., & Goyal, P. (2003). Effect of wheat bran, coarsewheat flour, and rice flour on the instrumental texture of cookies. InternationalJournal of Food Properties, 2, 329e340.
Gujral, H. S., Sharma, P., Bajaj, R., & Solah, V. (2012). Effects of incorporatinggerminated brown rice on the antioxidant properties of wheat flour chapatti.Food Science and Technology International, 18, 47e54.
Hatcher, D. W., & Kruger, J. E. (1997). Simple phenolic acids in flours prepared fromCanadian wheat: relationship to ash content, color, and polyphenol oxidaseactivity. Cereal Chemistry, 74, 337e343.
Holtekjolen, A. K., Baevere, A. B., Rodbotten, M., Berg, H., & Knutsen, S. H. (2008).Antioxidant properties and sensory profiles of breads containing barley flour.Food Chemistry, 110, 414e421.

P. Sharma, H.S. Gujral / LWT - Food Science and Technology 55 (2014) 301e307 307
Jia, Z., Tang, M., & Wu, J. (1998). The determination of flavonoids content in mul-berry and their scavenging effects on superoxide radicals. Food Chemistry, 64,555e559.
Kahkonen, M. P., Hopia, A. I., Vuorela, H. J., Rauha, J.-P., Pihlaja, K., Kujala, T. S., et al.(1999). Antioxidant activity of plant extracts containing phenolic compounds.Journal of Agricultural and Food Chemistry, 47, 3954e3962.
Laguna, L., Salvador, A., Sanz, T., & Fiszman, S. M. (2011). Performance of a resistantstarch rich ingredient in the baking and eating quality of short-dough biscuits.LWT e Food Science and Technology, 44, 737e746.
Lebesi, D. M., & Tzia, C. (2011). Effect of the addition of different dietary fiber andedible cereal bran sources on the baking and sensory characteristics of cup-cakes. Food and Bioprocess Technology, 4, 710e722.
Lee, S., & Inglett, G. E. (2006). Rheological and physical evaluation of jet-cooked oatbran in low calorie cookies. International Journal of Food Science and Technology,41, 553e559.
Lee, S., Warner, K., & Inglett, G. E. (2005). Rheological properties and baking per-formance of new oat b-glucan-rich hydrocolloids. Journal of Agricultural andFood Chemistry, 53, 9805e9809.
Li, J., Walker, C. E., & Faubion, J. M. (2011). Acidulant and oven type affect totalanthocyanin content of blue corn cookies. Journal of the Science of Food andAgriculture, 91, 38e43.
Lin, M. J. Y., Humbert, E. S., & Sosulski, F. W. (1974). Certain functional properties ofsunflower meal products. Journal of Food Science, 39, 368e370.
Lin, L.-Y., Liu, H.-M., Yu, Y.-W., Lin, S.-D., & Mau, J.-L. (2009). Quality and anti-oxidant property of buckwheat enhanced wheat bread. Food Chemistry, 112,987e991.
Liyana-Pathirana, C. M., & Shahidi, F. (2007). The antioxidant potential ofmilling fractions from bread wheat and durum. Journal of Cereal Science, 45,238e247.
Madhujith, T., Izydorczyk, M., & Shahidi, F. (2006). Antioxidant activity of pearledbarley fractions. Journal of Agricultural and Food Chemistry, 54, 3283e3289.
Manzocco, L. S., Calligaris, S., Mastrocola, D., Nicoli, M. C., & Lerici, C. R. (2000).Review of non-enzymatic browning and antioxidant capacity in processedfoods. Trends in Food Science and Technology, 11, 340e346.
McWatters, K. H. (1978). Cookie baking properties of defatted peanut, soybean, andfield pea flours. Cereal Chemistry, 55, 853e863.
Michalska, A., Amigo-Benavent, M., Zielinski, H., & Del-Castillo, M. D. (2008). Effectof bread making on formation of Maillard reaction products contributing to theoverall antioxidant activity of rye bread. Journal of Cereal Science, 48, 123e132.
Morales, F. J., Martin, S., Acar, O. C., Arribas-Lorenzo, G., & Gokmen, V. (2009).Antioxidant activity of cookies and its relationship with heat-processing con-taminants: a risk/benefit approach. European Food Research and Technology, 228,345e354.
Nicoli, M. C., Anese, M., Parpinel, M. T., & Franceschi, S. (1999). Influence of pro-cessing on the antioxidant properties of fruits and vegetables. Trends in FoodScience and Technology, 10, 94e100.
Nicoli, M. C., Anese, M., Parpinel, M., Franceschi, S., & Lerici, C. R. (1997). Loss and/orformation of antioxidants during food processing and storage. Cancer Letter, 114,71e74.
Oomah, B. D., & Mazza, G. (1996). Flavonoids and antioxidative activities in buck-wheat. Journal of Agricultural and Food Chemistry, 44, 1746e1750.
Quinde-Axtell, Z., Powers, P., & Baik, B. K. (2006). Retardation of discolouration inbarley flour gel and dough. Cereal Chemistry, 83, 385e390.
Ramırez-Jimenez, A., Guerra-Hernandez, E., & Garcıa-Villanova, B. (2000). Browningindicators in bread. Journal of Agricultural and Food Chemistry, 48, 4176e4181.
Randhir, R., Kwon, Y.-I., & Shetty, K. (2008). Effect of thermal processing on phenolics,antioxidant activity and health-relevant functionality of select grain and sproutsand seedling. Innovative Food Science & Emerging Technologies, 9, 355e364.
Rufian-Henares, J. A., & Delgado-Andrade, C. (2009). Effect of digestive process onMaillard reaction indexes and antioxidant properties of breakfast cereals. FoodResearch International, 42, 394e400.
Sharma, P., & Gujral, H. S. (2010a). Antioxidant and polyphenols oxidase activity ofgerminated barley and its milling fractions. Food Chemistry, 120, 673e678.
Sharma, P., & Gujral, H. S. (2010b). Milling behavior of hulled barley and its thermaland pasting properties. Journal of Food Engineering, 97, 329e334.
Sharma, P., & Gujral, H. S. (2011). Effect of sand roasting and microwave cooking onantioxidant activity of barley. Food Research International, 44, 235e240.
Sharma, P., & Gujral, H. S. (2013). Extrusion of hulled barley affecting b-glucan andproperties of extrudates. Food and Bioprocess Technology, 6, 1374e1389.
Sharma, P., Gujral, H. S., & Rosell, C. M. (2011). Effects of roasting on barley b-glucan,thermal, textural and pasting properties. Journal of Cereal Science, 53, 25e30.
Sharma, P., Gujral, H. S., & Singh, B. (2012). Antioxidant activity of barley as affectedby extrusion cooking. Food Chemistry, 131, 1406e1413.
Skrbic, B., & Cvejanov, J. (2011). The enrichment of wheat cookies with high-oleicsunflower seed and hull-less barley flour: impact on nutritional composition,content of heavy elements and physical properties. Food Chemistry, 124, 1416e1422.
Stojceska, V., Ainsworth, P., Plunkett, A., & Ibanoglu, S. (2009). The effect of extru-sion cooking using different water feed rates on the quality of ready-to-eatsnacks made from food by-products. Food Chemistry, 114, 226e232.
Stratil, P., Klejdus, B., & Kuban, V. (2007). Determination of phenolic compounds andtheir antioxidant activity in fruits and cereals. Talanta, 71, 1741e1751.
Sudha, M. L., Vetrimani, R., & Leelavathi, K. (2007). Influence of fibre from differentcereals on the rheological characteristics of wheat flour dough and on biscuitquality. Food Chemistry, 100, 1365e1370.
Vitali, D., Dragojevic, I. V., & Sebecic, B. (2009). Effects of incorporation of integralraw materials and dietary fiber on the selected nutritional and functionalproperties of biscuits. Food Chemistry, 114, 1462e1469.
Xu, B., & Chang, S. K. C. (2008). Total phenolics, phenolic acids, isoflavones, andanthocyanins and antioxidant properties of yellow and black soybeans asaffected by thermal processing. Journal of Agricultural and Food Chemistry, 56,7165e7175.
Zhao, H., Fan, W., Dong, J., Lu, J., Chen, J., Shan, L., et al. (2008). Evaluation of anti-oxidant activities and total phenolic contents of typical malting barley varieties.Food Chemistry, 107, 296e304.
Zhou, M. X., Robards, K., Glennie-Holmes, M., & Helliwell, S. (1999). Effects of oatlipids on groat meal pasting properties. Journal of the Science of Food andAgriculture, 79, 585e592.
Zielinski, H., Michalska, A., Amigo-Benavent, M., Dolores Del Castillo, M., &Piskula, M. K. (2009). Changes in protein quality and antioxidant properties ofbuckwheat seeds and groats induced by roasting. Journal of Agricultural andFood Chemistry, 57, 4771e4776.