Embed Size (px)
Citation preview
Reducing Emissions from Deforestation andforest Degradation and the Role of Conservation,Sustainable Management of Forests and Enhancement
COOKBOOKANNEX
MASAYOSHI TAKAHASHI
Research achievement of the 4th mid-term plan 18 (Forest Management Technology-15)
Research Manual Vol. 4Ground Truth Survey
ISBN:978-4-905304-96-8


Preface
The basic concept of REDD-plus is to provide economic incentives such as funding or credits to developing countries for REDD activities (reducing emissions from deforestation and forest degradation) and "plus" activities (reducing CO2 emissions and CO2 levels in the atmosphere by carbon sequestration). Thus, in order to estimate the changes in the amount of carbon stored in forests, monitoring using scienti c approach is essential.
The REDD Research and Development Center, Forestry and Forest Products Research Institute compiled “REDD-plus Cookbook” in 2012; an easy-to-understand technical manual which provide basic knowledge and techniques required for REDD-plus with the main focus on the forest carbon monitoring methods. Knowledge and techniques required for REDD-plus are compiled in units called “Recipe” in this REDD-plus Cookbook. This REDD-plus Cookbook is intended for the policy makers working for the introduction of REDD-plus and the practitioners and experts working on the REDD-plus activities.
As REDD-plus Cookbook focuses on basic knowledge and techniques required for REDD-plus, the experts working on the REDD-plus activities will need further detailed information in the eld. Thus, we compiled “REDD-plus Cookbook Annex” to provide the experts with more detailed and practical information in each “Recipe”. In this manual, speci c measuring methods are explained. Also, this manual is intended to be used as a textbook for building capacity. In order to have a better technological understanding on these topics, it is recommended to read this manual in conjunction with REDD-plus Cookbook.
We hope this manual will contribute to the promotion of REDD-plus in many parts of the world.
March, 2019 The REDD Research and Development Center Forestry and Forest Products Research Institute

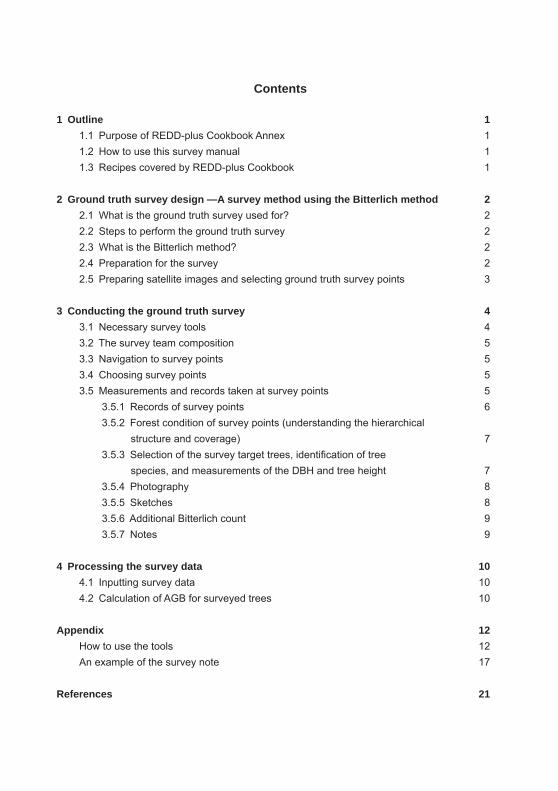
Contents
1 Outline 1 1.1 Purpose of REDD-plus Cookbook Annex 1 1.2 How to use this survey manual 1 1.3 Recipes covered by REDD-plus Cookbook 1
2 Ground truth survey design —A survey method using the Bitterlich method 2 2.1 What is the ground truth survey used for? 2 2.2 Steps to perform the ground truth survey 2 2.3 What is the Bitterlich method? 2 2.4 Preparation for the survey 2 2.5 Preparing satellite images and selecting ground truth survey points 3
3 Conducting the ground truth survey 4 3.1 Necessary survey tools 4 3.2 The survey team composition 5 3.3 Navigation to survey points 5 3.4 Choosing survey points 5 3.5 Measurements and records taken at survey points 5 3.5.1 Records of survey points 6 3.5.2 Forest condition of survey points (understanding the hierarchical structure and coverage) 7 3.5.3 Selection of the survey target trees, identi cation of tree species, and measurements of the DBH and tree height 7 3.5.4 Photography 8 3.5.5 Sketches 8 3.5.6 Additional Bitterlich count 9 3.5.7 Notes 9
4 Processing the survey data 10 4.1 Inputting survey data 10 4.2 Calculation of AGB for surveyed trees 10
Appendix 12 How to use the tools 12 An example of the survey note 17
References 21
REDD-plus COOKBOOK ANNEX
■ 1.1 Purpose of REDD-plus Cookbook AnnexThe “REDD-plus Cookbook,” published by the Forestry and Forest Products Research Institute
in 2012, is a technical manual that simply explains the basic knowledge and techniques for REDD+ with a focus on forest carbon monitoring. This survey manual explains the survey method with a focus on the ground truth survey, which is necessary to estimate forest area using remote sensing techniques shown in the REDD-plus Cookbook.
This manual was prepared with technologists in mind, who conduct ground truth surveying in the eld. We hope that it also provides useful information to students studying forestry and forest remote sensing, and organizations, such as NGOs, that are interested in REDD+.
■ 1.2 How to use this survey manualThe ground truth survey is performed to collect ground information necessary for analysis us-
ing satellite imagery, so multiple survey plots are usually set, which all must be accurately mea-sured. In addition, the surveying is often performed by multiple teams to improve the ef ciency; thus, survey methods should be con rmed ahead of time. When planning and conducting a ground truth survey, this manual should be referred to so that all surveyors understand the steps of the survey and measurement methods.
This manual explains the methods of ground truth surveying using the Bitterlich method (Chapter 2), followed by an explanation of the speci c steps for an actual survey (Chapter 3). Finally, steps and methods to calculate carbon stock for each of the survey points, from measurement data collected in the eld survey, are speci cally explained (Chapter 4).
Please refer to TIPS as this is where we offer useful knowledge and cautionary recommenda-tions from past experiences with ground truth survey.
■ 1.3 Recipes covered by REDD-plus CookbookRecipes covered by REDD-plus Cookbook are shown in [ ]. Please refer to REDD-plus
Cookbook.REDD-plus Cookbook can be downloaded from the sites below.http://redd.ffpri.affrc.go.jp/pub_db/publications/cookbook/index_en.html
1 Outline
1
Vol.4 Ground Truth Survey
■ 2.1 What is the ground truth survey used for?Ground truth refers to the actual information of the target on the ground and is neces-
sary for land cover classi cations using remote sensing data and for verifying classi cation results [Recipe-T08]. It is also necessary for estimating land area based on remote sensing [Recipe-P08], which is used to calculate changes in carbon stock with the stock change method [Recipe-P07].
■ 2.2 Steps to perform the ground truth surveyThe ground truth survey (also called the GT survey) is performed in the order of: survey
preparation, eld surveying, and then data processing. First, preparation of the survey is necessary. Satellite images of the survey target area are
prepared [Recipe-T08], and the survey candidate sites are determined. Then, the various preparations necessary for the completion of the survey are made. Once the preparation is completed, the eld survey is conducted, tree measurements are performed, and so on. In addition, from the obtained eld survey data, information including above-ground biomass is calculated, which will be used for the analysis for the satellite images.
In this manual, we present speci c steps for ground truth surveying using the Bitterlich meth-od as an example.
■ 2.3 What is the Bitterlich method?The Bitterlich method, also called angular count sampling or angle count sampling, is a
method of measuring a forest by estimating the total basal area per unit area by counting the standing trees. The trees used for counting are determined by a predetermined angle. There is no need to set a plot for the survey, which is the reason it is sometimes called plotless sampling.
TIPS Simple explanation of the Bitterlich method is on page 13.
■ 2.4 Preparation for the surveyFirst, the pretreatment of satellite images of the target site and the selection of the ground truth
survey candidate points are performed. At the same time, the ground truth survey is planned with considerations given to climate, weather conditions, traf c access, accommodations, and cost necessary for the staff and survey. To conduct the survey, permission from the landowner may be necessary. In such a case, the necessary permission by landowners must be acquired
2 Ground truth survey design —A survey method using the Bitterlich method
2
REDD-plus COOKBOOK ANNEX
beforehand.
■ 2.5 Preparing satellite images and selecting ground truth survey pointsPretreatment of satellite images, including the target site, is performed [Recipe-T06]. When
using the object-based classi cation method, pretreated satellite images are used to perform the object-based classi cation. Statistically appropriate numbers of survey points are selected, and the candidate survey points are selected on the images [Recipe-T08].
When using object-based classi cation, the survey points avoid the edge of objects, so that the ground truth survey candidate points are set within a certain distance inside the object boundary (at least 2 to 3 pixels).
Position information of the candidate survey points is summarized in a list. Smart devices that are able to display spatial information (smartphone, tablets, etc.) would be useful if the position information of the candidate survey points are stored.
3
Vol.4 Ground Truth Survey
3 Conducting the ground truth survey
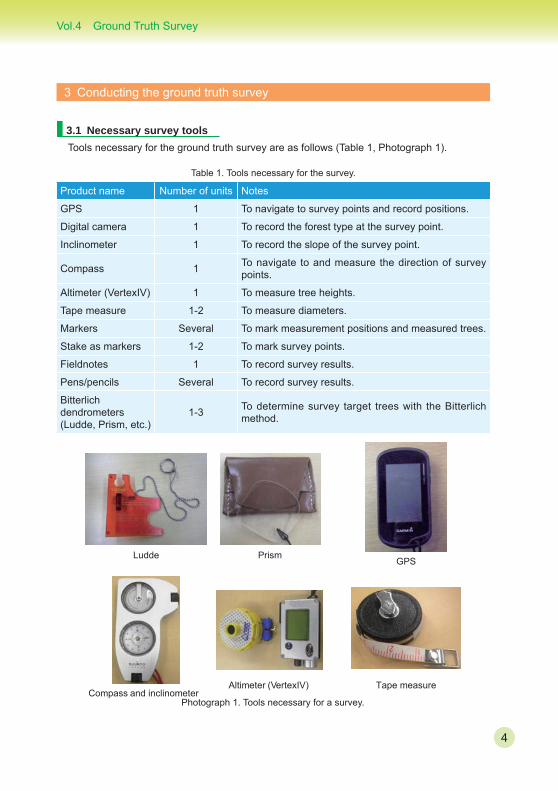
■ 3.1 Necessary survey toolsTools necessary for the ground truth survey are as follows (Table 1, Photograph 1).
Table 1. Tools necessary for the survey.
Product name Number of units Notes
GPS 1 To navigate to survey points and record positions.
Digital camera 1 To record the forest type at the survey point.
Inclinometer 1 To record the slope of the survey point.
Compass 1 To navigate to and measure the direction of survey points.
Altimeter (VertexIV) 1 To measure tree heights.
Tape measure 1-2 To measure diameters.
Markers Several To mark measurement positions and measured trees.
Stake as markers 1-2 To mark survey points.
Fieldnotes 1 To record survey results.
Pens/pencils Several To record survey results.
Bitterlich dendrometers (Ludde, Prism, etc.)
1-3 To determine survey target trees with the Bitterlich method.
Photograph 1. Tools necessary for a survey.
Ludde PrismGPS
Compass and inclinometer Altimeter (VertexIV) Tape measure
4
REDD-plus COOKBOOK ANNEX
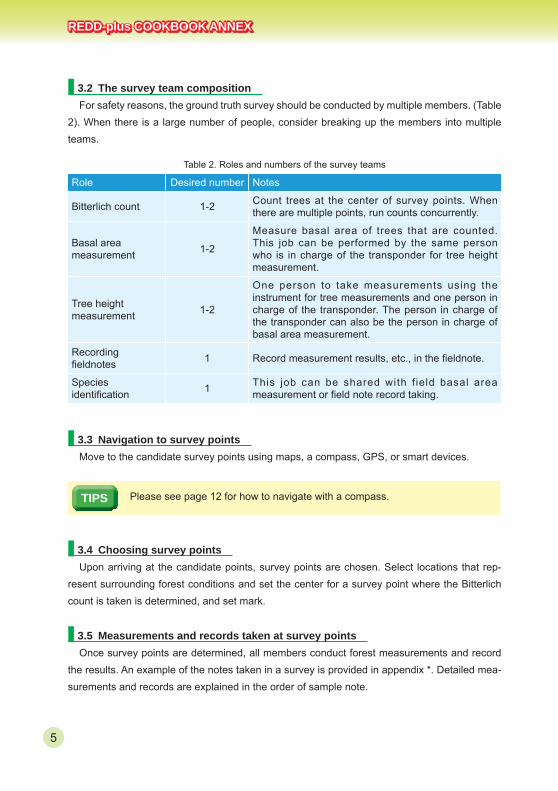
■ 3.2 The survey team compositionFor safety reasons, the ground truth survey should be conducted by multiple members. (Table
2). When there is a large number of people, consider breaking up the members into multiple teams.
Table 2. Roles and numbers of the survey teams
Role Desired number Notes
Bitterlich count 1-2 Count trees at the center of survey points. When there are multiple points, run counts concurrently.
Basal area measurement 1-2
Measure basal area of trees that are counted. This job can be performed by the same person who is in charge of the transponder for tree height measurement.
Tree height measurement 1-2
One person to take measurements using the instrument for tree measurements and one person in charge of the transponder. The person in charge of the transponder can also be the person in charge of basal area measurement.
Recording eldnotes 1 Record measurement results, etc., in the eldnote.
Species identi cation 1 This job can be shared with f ield basal area
measurement or eld note record taking.
■ 3.3 Navigation to survey pointsMove to the candidate survey points using maps, a compass, GPS, or smart devices.
TIPS Please see page 12 for how to navigate with a compass.
■ 3.4 Choosing survey pointsUpon arriving at the candidate points, survey points are chosen. Select locations that rep-
resent surrounding forest conditions and set the center for a survey point where the Bitterlich count is taken is determined, and set mark.
■ 3.5 Measurements and records taken at survey pointsOnce survey points are determined, all members conduct forest measurements and record
the results. An example of the notes taken in a survey is provided in appendix *. Detailed mea-surements and records are explained in the order of sample note.
5
Vol.4 Ground Truth Survey
3.5.1 Records of survey pointsGround Survey Note: Used to record information obtained from a eld survey. One sheet per
survey point. Here, we explain the contents per item.General Information: All items related to the summary of the survey point.Crew Member: Record all members of the survey team.Date (DD/MM/YY): Record the survey date.Plot ID: Record the ID to identify the survey point.
TIPS An example of a plot ID is three letters and two numbers, and a rule should be prepared so that there are no duplicate IDs.
Province: Note the name of the Province.District: Note the name of the District.Time of Survey: Note the time of the survey.Start Time: Note the start time of the survey with the 24-hour clock.End Time: Note the end time of the survey with the 24-hour clock.Plot Information: Describe the selected survey points.Plot Location WGS84: Note the GPS measurements for the position of the survey point.
TIPS If using a Garmin GPS, use the Waypoint Averaging function, and record the measurements for the center of the survey point.
TIPS When saving measured values on the GPS, recommended point name is the Plot ID. This makes easier to reference at a later time.
Latitude: Record the latitude of the survey point in the WGS84 format.Longitude: Record the longitude of the survey point in the WGS84 format.Altitude: Record the altitude of the survey point in meters.GPS Receiver: Record the name of the GPS receiver used.Topography: Record the topography of the survey point. Slope Direction: Examine the direction of the slope using the compass, and record it down
to eight directions.
TIPS If there is no slope, cross out the item.
Slope Angle: The slope is measured with an inclinometer and recorded by degrees. If there is no slope, note 0 degrees.
6
REDD-plus COOKBOOK ANNEX
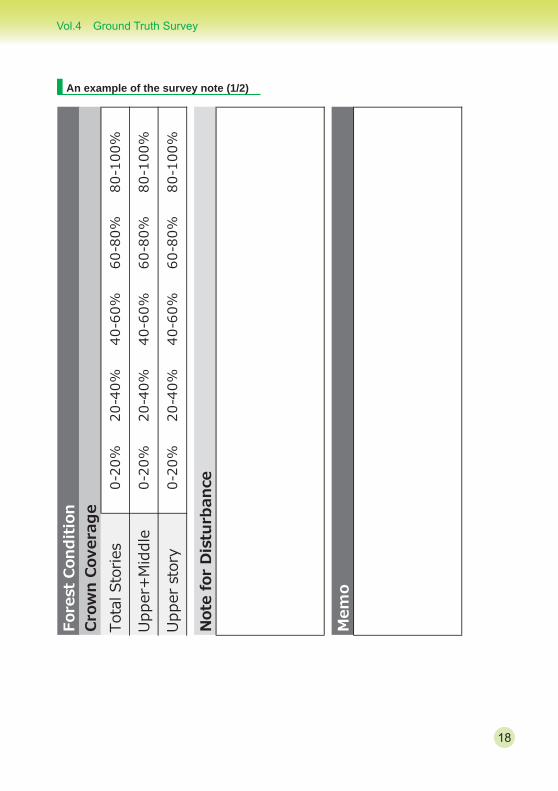
3.5.2 Forest condition of survey points (understanding the hierarchical structure and coverage) Forest Condition: Record the state of the forest.Crown Coverage: Crown coverage is recorded as one of ve stages (0-20 , 20-40 , 40-
60 , 60-80 , and 80-100 ).Total Stories: Coverage of the overall forest is evaluated and recorded.Upper + Middle: Coverage of the upper and middle stories is evaluated and recorded.Upper story: Coverage of the upper story, with the middle story excluded, is evaluated and
recorded.
TIPS Coverage is determined and evaluated by all members of the team.
Note for Disturbance: Note the information related to the disturbance of the forest. For exam-ple, comments such as “there are new/old stumps” and “there are pioneer species observed after disturbance”.
3.5.3 Selection of the survey target trees, identi cation of tree species, and measurements of the DBH and tree height
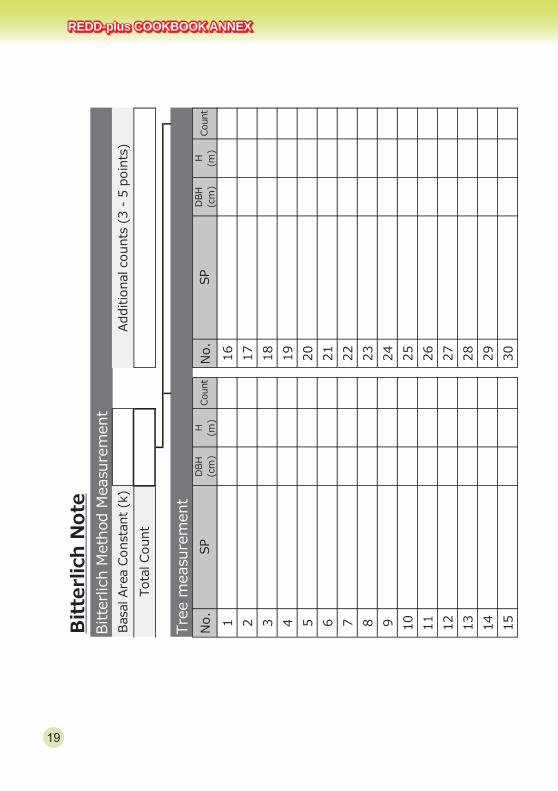
Bitterlich Note: Record items according to the Bitterlich method.Bitterlich Method Measurement: Measurements with the Bitterlich method.Basal Area Constant (k): Record basal area constant (k).
TIPS When using a Ludde, the basal area constant is 1.
Total Count: Record the Bitterlich count.
TIPS Explanation of the Bitterlich method is on page 13.
TIPS Total Count is equal to the sum of the survey tree count.
Tree Measurement: For target trees of the Bitterlich method, measurement information is recorded as 1 or 0.5.
No.: Number of the tree being surveyed.SP: Record the species name or a common name.
7
Vol.4 Ground Truth Survey
DBH(cm): Record the diameter at breast height.
TIPS The standard height for DBH measurement is 130 cm from the ground surface.
TIPS DBH is measured for all counted trees by the Bitterlich method. However, if tree
trunks branch apart or are deformed due to a knot or rot at 130 cm, the diameter is measured above or below at the closest height.
TIPS The measurement method for DBH is explained in detail in [Cookbook Annex Vol.1].
H(m): Tree height is measured with an altimeter and results are recorded.Count: Record the Bitterlich count (1 or 0.5).
TIPS Usage of a Ludde is explained on page 13.
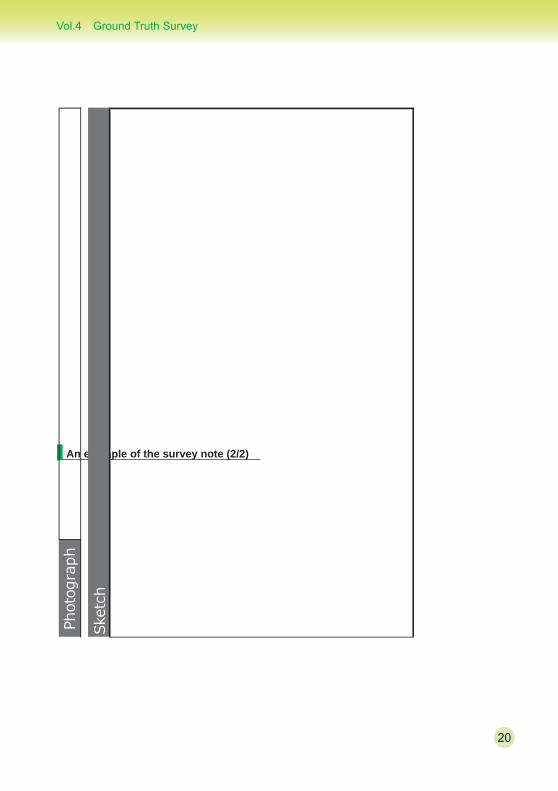
3.5.4 PhotographyPhotog raph ( lename): Take photographs of the forest at the survey point. At the center of the
survey point, take photographs in all four cardinal directions and record the le name of photographs.
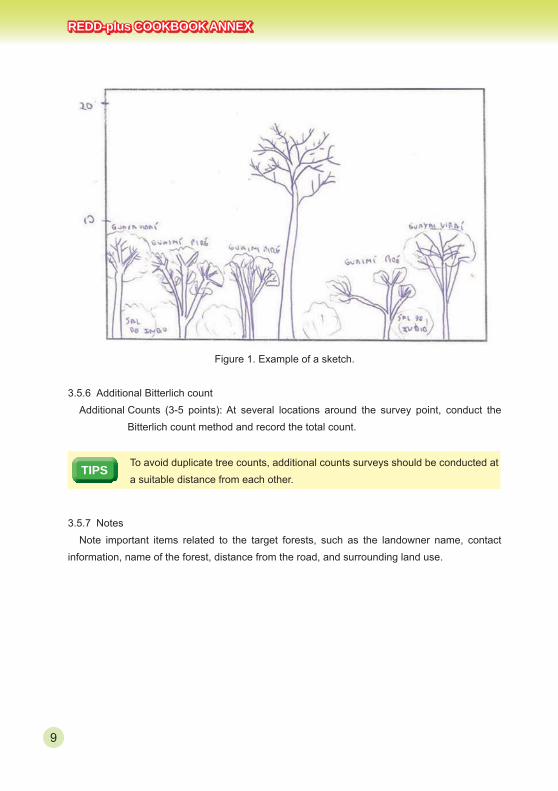
3.5.5 Sketches Sketch of the Fo rests Condition:Sketch the cross section of the forest around the survey
point. At this time, it would be useful to record a scale for rough tree heights and species names (abbreviations are acceptable) so that the hierarchical structure and condition of the forest oor would be clear.
8
REDD-plus COOKBOOK ANNEX
Figure 1. Example of a sketch.
3.5.6 Additional Bitterlich countAdditional Counts (3-5 points): At several locations around the survey point, conduct the
Bitterlich count method and record the total count.
TIPS To avoid duplicate tree counts, additional counts surveys should be conducted at a suitable distance from each other.
3.5.7 NotesNote important items related to the target forests, such as the landowner name, contact
information, name of the forest, distance from the road, and surrounding land use.
9
Vol.4 Ground Truth Survey
4 Processing the survey data
The ground truth survey data collected in Section 3 are processed, and above-ground bio-mass (AGB) is calculated using an allometry method. Here, let us introduce an example of a survey conducted in a tropical forest in South America.
TIPS Please refer to [Cookbook Annex Vol. 1] for the calculation of AGB using the allometry method.
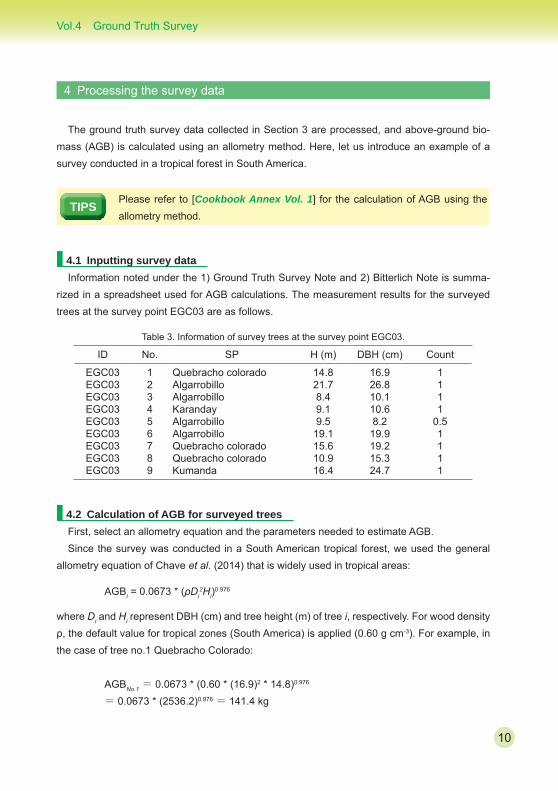
■ 4.1 Inputting survey dataInformation noted under the 1) Ground Truth Survey Note and 2) Bitterlich Note is summa-
rized in a spreadsheet used for AGB calculations. The measurement results for the surveyed trees at the survey point EGC03 are as follows.
Table 3. Information of survey trees at the survey point EGC03.
ID No. SP H (m) DBH (cm) Count
EGC03EGC03EGC03EGC03EGC03EGC03EGC03EGC03EGC03
123456789
Quebracho coloradoAlgarrobilloAlgarrobilloKarandayAlgarrobilloAlgarrobilloQuebracho coloradoQuebracho coloradoKumanda
14.821.78.49.19.5
19.115.610.916.4
16.926.810.110.68.219.919.215.324.7
1111
0.51111
■ 4.2 Calculation of AGB for surveyed treesFirst, select an allometry equation and the parameters needed to estimate AGB.Since the survey was conducted in a South American tropical forest, we used the general
allometry equation of Chave et al. (2014) that is widely used in tropical areas:
AGBi = 0.0673 * ( i2Hi)
0.976
where i and Hi represent DBH (cm) and tree height (m) of tree i, respectively. For wood density , the default value for tropical zones (South America) is applied (0.60 g cm-3). For example, in
the case of tree no.1 Quebracho Colorado:
AGBNo.1 = 0.0673 * (0.60 * (16.9)2 * 14.8)0.976
= 0.0673 * (2536.2)0.976 = 141.4 kg
10
REDD-plus COOKBOOK ANNEX
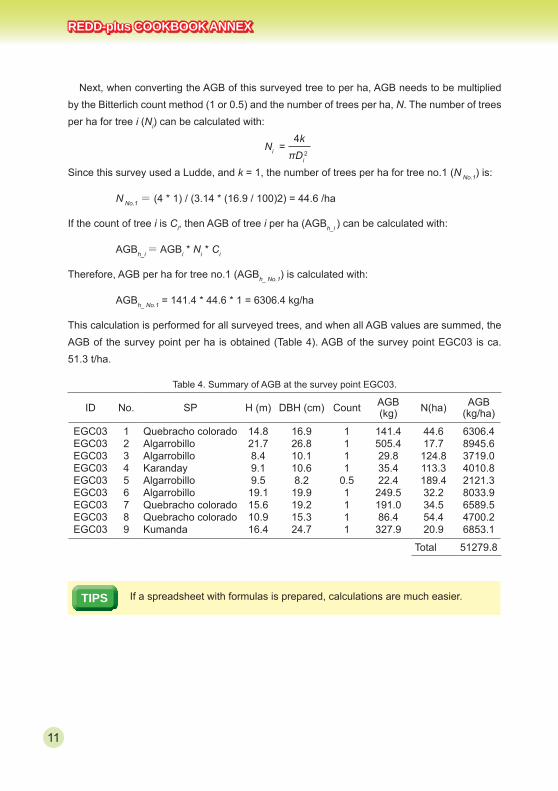
Next, when converting the AGB of this surveyed tree to per ha, AGB needs to be multiplied by the Bitterlich count method (1 or 0.5) and the number of trees per ha, N. The number of trees per ha for tree i (Ni) can be calculated with:
Ni = 4k
i2
Since this survey used a Ludde, and k = 1, the number of trees per ha for tree no.1 (N No.1) is:
N No.1 = (4 * 1) / (3.14 * (16.9 / 100)2) = 44.6 /ha
If the count of tree i is Ci, then AGB of tree i per ha (AGBh_i ) can be calculated with:
AGBh_i = AGBi * Ni * Ci
Therefore, AGB per ha for tree no.1 (AGBh_ No.1) is calculated with:
AGBh_ No.1 = 141.4 * 44.6 * 1 = 6306.4 kg/ha
This calculation is performed for all surveyed trees, and when all AGB values are summed, the AGB of the survey point per ha is obtained (Table 4). AGB of the survey point EGC03 is ca. 51.3 t/ha.
Table 4. Summary of AGB at the survey point EGC03.
ID No. SP H (m) DBH (cm) Count AGB(kg) N(ha) AGB
(kg/ha)
EGC03EGC03EGC03EGC03EGC03EGC03EGC03EGC03EGC03
123456789
Quebracho coloradoAlgarrobilloAlgarrobilloKarandayAlgarrobilloAlgarrobilloQuebracho coloradoQuebracho coloradoKumanda
14.821.78.49.19.5
19.115.610.916.4
16.926.810.110.68.2
19.919.215.324.7
1111
0.51111
141.4505.429.835.422.4249.5191.086.4327.9
44.617.7124.8113.3189.432.234.554.420.9
6306.48945.63719.04010.82121.38033.96589.54700.26853.1
Total 51279.8
TIPS If a spreadsheet with formulas is prepared, calculations are much easier.
11
Vol.4 Ground Truth Survey
Appendix
■ How to use the tools1) Compass A compass is affected by magnetism; therefore, when using a compass, objects with mag-
netism, such as a magnet or electronic devices (e.g., cell phones), must be kept at a distance.
・Measurement methods for the slope direction (1) Face the direction of the steepest slope. (2) Hold the compass in front of your body. (3) When the magnetic needle and the bezel (usually red and black) match, the number
outside of the bezel indicates the angle of the direction.
・Measurement method for the slope angle (only with measurement function) (1) Face the direction of the steepest slope. (2) Determine a position that is the height of your eyes and take a measurement using the
slope function. At this time, if an item (person, stick, etc.) is used to indicate the height of your eyes, measurements would be more accurate.
・A method to walk straight in the determined direction. (1) Face the direction into which you intend to walk. (2) Hold the compass in front of your body. (3) Match the magnetic needle and the bezel (usually red and black). (4) Pick a marker at a distance in the direction in which you intend to walk (tree, branch, etc.). (5) Walk towards the marker. (6) Hold the compass in front of your body and face the direction in which the needle and the
bezel match. (7) Repeat steps (4) to (6).
・A method to guide toward the predetermined direction. (1) Face the direction in which you intend to walk. (2) Hold the compass in front of your body. (3) Match the magnetic needle and the bezel (normally red and black). (4) Pick a marker at a distance in the direction in which you intend to walk (tree, branch, etc.). (5) Let the person walk forward and if he/she veers off, guide them into the right direction. (6) When there is so much distance that the guide and the walker cannot con rm the direction,
12
REDD-plus COOKBOOK ANNEX
stop walking. (7) The guide joins the walker. (8) The guide holds the compass in front of his/her body, and faces the direction in which the
needle and the bezel match. (9) Repeat steps (4) to (8). Make sure to read the instruction manual thoroughly before use.
2) Ludde A Ludde is the tool for a Bitterlich count.
TIPS Tools for Bitterlich count include the Bitterlich prism and Relascope, in addition to the Ludde.
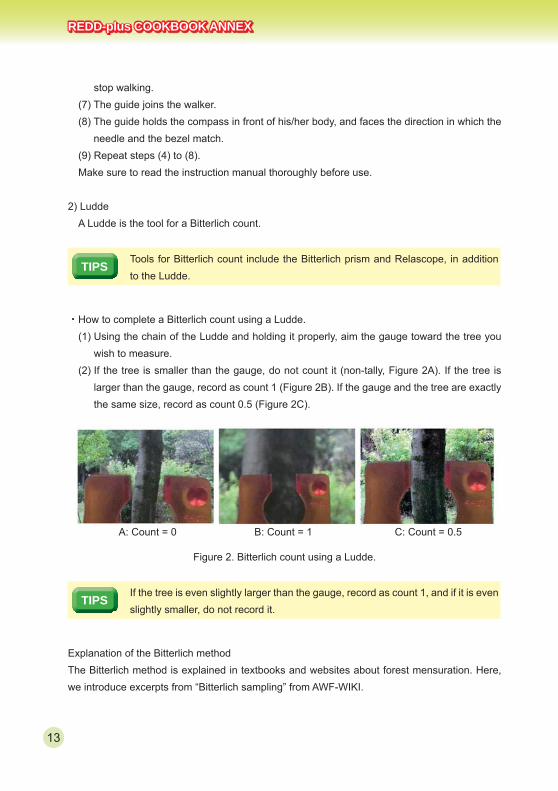
・How to complete a Bitterlich count using a Ludde. (1) Using the chain of the Ludde and holding it properly, aim the gauge toward the tree you
wish to measure. (2) If the tree is smaller than the gauge, do not count it (non-tally, Figure 2A). If the tree is
larger than the gauge, record as count 1 (Figure 2B). If the gauge and the tree are exactly the same size, record as count 0.5 (Figure 2C).
A: Count = 0 B: Count = 1 C: Count = 0.5
Figure 2. Bitterlich count using a Ludde.
TIPS If the tree is even slightly larger than the gauge, record as count 1, and if it is even slightly smaller, do not record it.
Explanation of the Bitterlich methodThe Bitterlich method is explained in textbooks and websites about forest mensuration. Here, we introduce excerpts from “Bitterlich sampling” from AWF-WIKI.
13
Vol.4 Ground Truth Survey
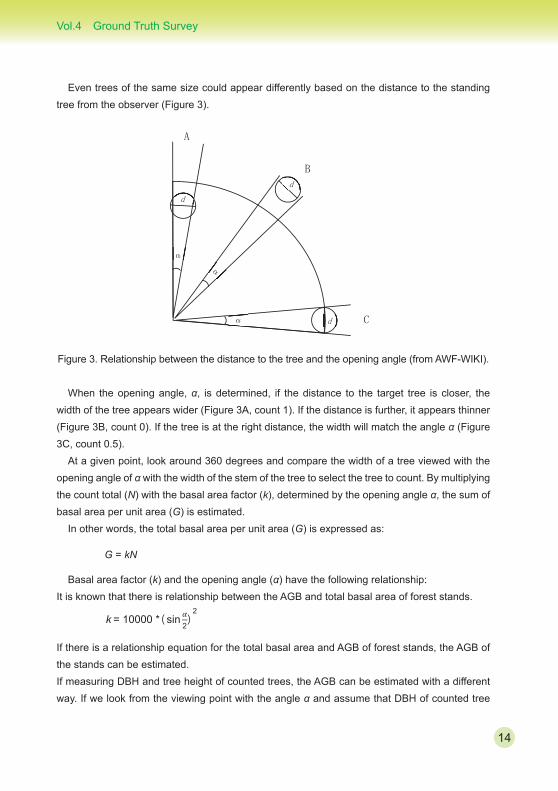
Even trees of the same size could appear differently based on the distance to the standing tree from the observer (Figure 3).
Figure 3. Relationship between the distance to the tree and the opening angle (from AWF-WIKI).
When the opening angle, , is determined, if the distance to the target tree is closer, the width of the tree appears wider (Figure 3A, count 1). If the distance is further, it appears thinner (Figure 3B, count 0). If the tree is at the right distance, the width will match the angle (Figure 3C, count 0.5).
At a given point, look around 360 degrees and compare the width of a tree viewed with the opening angle of with the width of the stem of the tree to select the tree to count. By multiplying the count total (N) with the basal area factor (k), determined by the opening angle , the sum of basal area per unit area (G) is estimated.
In other words, the total basal area per unit area (G) is expressed as:
G = kN
Basal area factor (k) and the opening angle ( ) have the following relationship:It is known that there is relationship between the AGB and total basal area of forest stands.
k = 10000 * ( sin2)
2
If there is a relationship equation for the total basal area and AGB of forest stands, the AGB of the stands can be estimated.If measuring DBH and tree height of counted trees, the AGB can be estimated with a different way. If we look from the viewing point with the angle and assume that DBH of counted tree
14
REDD-plus COOKBOOK ANNEX
i, counted as 0.5, is di, it must be on the circumference of a circle with the radius of R from the view point. In other words, it can be assumed that there is one standing tree i with DBH di in the area R2 of a circle with radius R. If we assume that there are standing trees with the same diameter as the standing tree i (di) at the same area ratio, the number of standing trees with the same basal area per unit area (usually 1 ha) is:
where R is:
and:
thus:
therefore, N is:
210000
RN =
1002sin k=
R =2 sin 2
R=50
2
di
di
k
N =4
2k
di
if the AGB of the standing tree i (AGBi) can be estimated using the measured values, such as DBH and tree height, along with the allometry equation, the AGB per unit area of AGBi (AGBh_i) with the same DBH di is:
AGBh_i = c * AGBi * N
If we assume that the standing tree i with count 1 is within the area ( R2) of a circle with a radius of R, and the area ratio is the same, the number of standing trees N with the basal area of di and the AGB per unit area (Vi), are also calculated with the same equation.If AGB per unit area (AGBh_i), calculated for each standing tree counted is summed, AGB per unit area for the survey point (AGBh) can be obtained:
AGBh = AGBh_i
15

Vol.4 Ground Truth Survey
16
REDD-plus COOKBOOK ANNEX
17
Vol.4 Ground Truth Survey
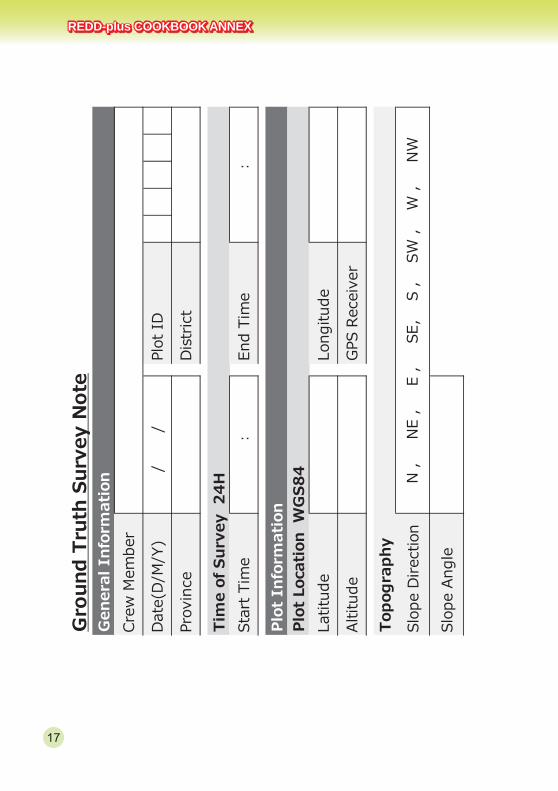
■ An example of the survey note (1/2)
18
REDD-plus COOKBOOK ANNEX
19
Vol.4 Ground Truth Survey
■ An example of the survey note (2/2)
20

REDD-plus COOKBOOK ANNEX
21
References
Chave , R jou-M chain M, B rquez A, Chidumayo E, Colgan MS, Delitti WBC, Duque A, Eid T, Fearnside PM, Goodman RC, Henry M, Mart nez-Yr zar A, Mugasha WA, Muller-Landau HC, Mencuccini M, Nelson BW, Ngomanda A, Nogueira EM, Ortiz-Malavassi E, P lissier R, Ploton P, Ryan CM, Saldarriaga JG, Vieilledent G (2014) Improved allometric models to estimate the aboveground biomass of tropical trees. Global Change Biology 20: 3177-3190.
Sato T, Miyamoto K (2016) REDD-plus Cookbook Annex. Research Manual Vol. 1 Ground-Based Inventory. REDD Research and Development Center, Forestry and Forest Products Research Institute Japan, 23pp.
AWF-WIKI : Bitterlich sampling. http://wiki.awf.forst.uni-goettingen.de/wiki/index.php/Bitterlich_sampling (Jan. 4 2017)

Authors Masayoshi Takahashi (Forestry and Forest Products Research Institute)Editors Tamotsu Sato & Masayoshi TakahashiVersion 1.01enCitation This document may be cited as: Takahashi M (2019) REDD-plus Cookbook Annex. Vol. 4 Ground Truth Survey. REDD Research and Development Center, Forestry and Forest Products Research Institute Japan, 21pp.
![01234, - ffpri.affrc.go.jp · nopS % ! stabuvP)ÉÊ, ! Ë%ÌÍ&'( ]Î()´Ï, "ÐÑÒ%ÓÔÕÖ/ Â×ÕÖ/ " @CØ5ÙÚÛ7%ÓÔÕÖ/ Ü / " @CØ5ÝqÛ7%Ü / Þßà/ "](https://img.pdfslide.us/doc/110x75/5be657c109d3f28a428dbbe8/01234-ffpriaffrcgo-nops-stabuvpee-eii-ii-dnoooooe.jpg)