Embed Size (px)
DESCRIPTION
Transform analysis
Citation preview
2.7 Convolution
BEE 3113 S1-2007/08 2
2.7 Convolution Convolution means folding. Convolution helps to determine the effect a system has on an input signal. It provides a means of viewing and characterizing physical systems. A convolution is an integral that expresses the amount of overlap of one
function g as it is shifted over another function f
The convolution of two signals consists of time-reversing one of the signals, shifting it, and multiplying it point by point with the second signal, and integrating the product.

BEE 3113 S1-2007/08 3
It is used in finding the response y(t) of a system to an excitation x(t), knowing the system impulse response h(t). This can be defined using :
or simply
dtxhdthxty )()()()()(
)(*)()(*)()( txththtxty
2.8.2 Convolution Integral
BEE 3113 S1-2007/08 4
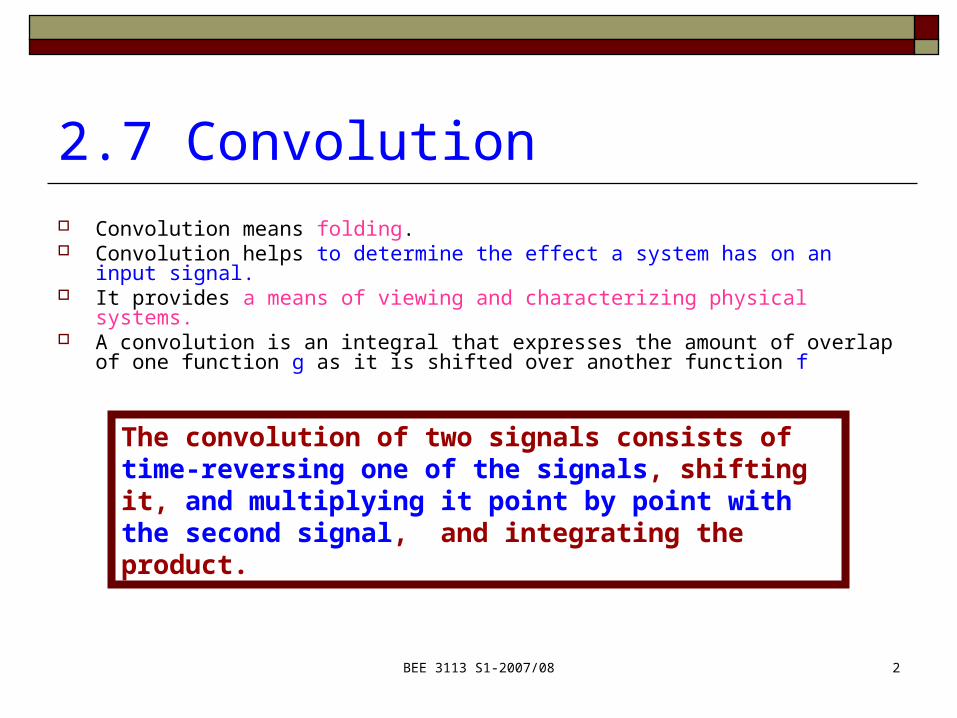
We can establish link between LT and convolution integral. Eg: Given two functions f1(t) and f2(t) with LT of F1(s) and F2(s). The convolution will be:
dtfftftftft
)()()(*)()( 20
121 )()()](*)([)( 2121 sFsFtftfLsF
Eg: Given that and . Thus, the convolution will be :tetx 4)( teth 25)(
0)(202
201
20
14
25
)]()([)(*)(
21
1
1
tforeess
L
ssL
sXsHLtxth
tt
Example 2.8
BEE 3113 S1-2007/08 5
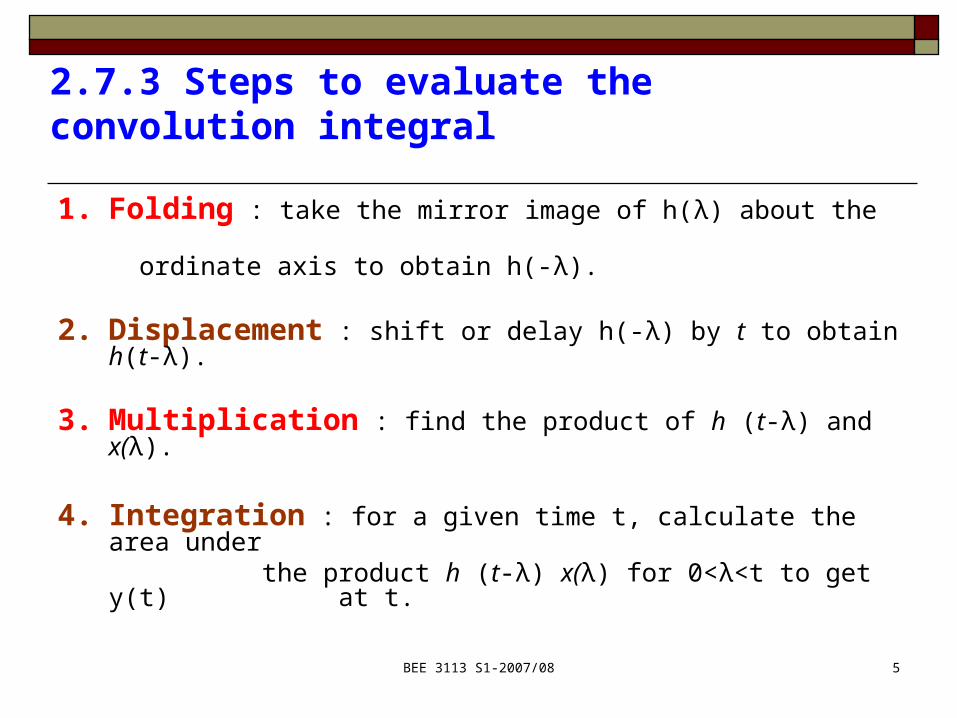
2.7.3 Steps to evaluate the convolution integral
1. Folding : take the mirror image of h(λ) about the ordinate axis to obtain h(-λ).
2. Displacement : shift or delay h(-λ) by t to obtain h(t-λ).
3. Multiplication : find the product of h (t-λ) and x(λ).
4. Integration : for a given time t, calculate the area under the product h (t-λ) x(λ) for 0<λ<t to get
y(t) at t.

BEE 3113 S1-2007/08 6
CONVOLUTION PROCESS
BEE 3113 S1-2007/08 7
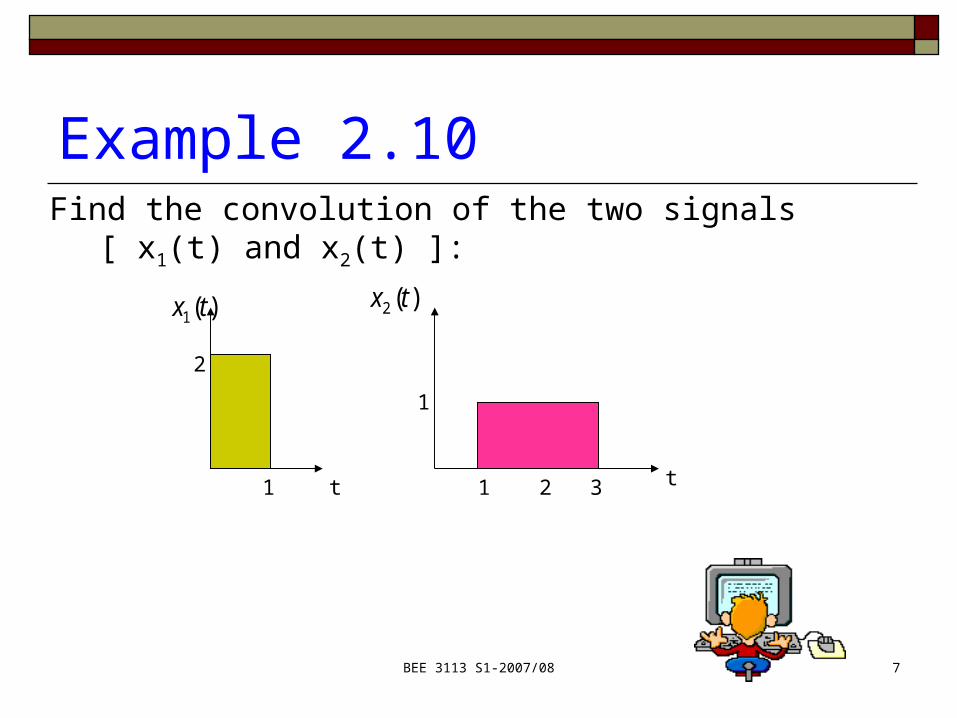
Example 2.10 Find the convolution of the two signals [ x1(t) and x2(t) ]:
)(2 tx
1 2 3 t
1
)(1 tx
t
2
1
BEE 3113 S1-2007/08 8
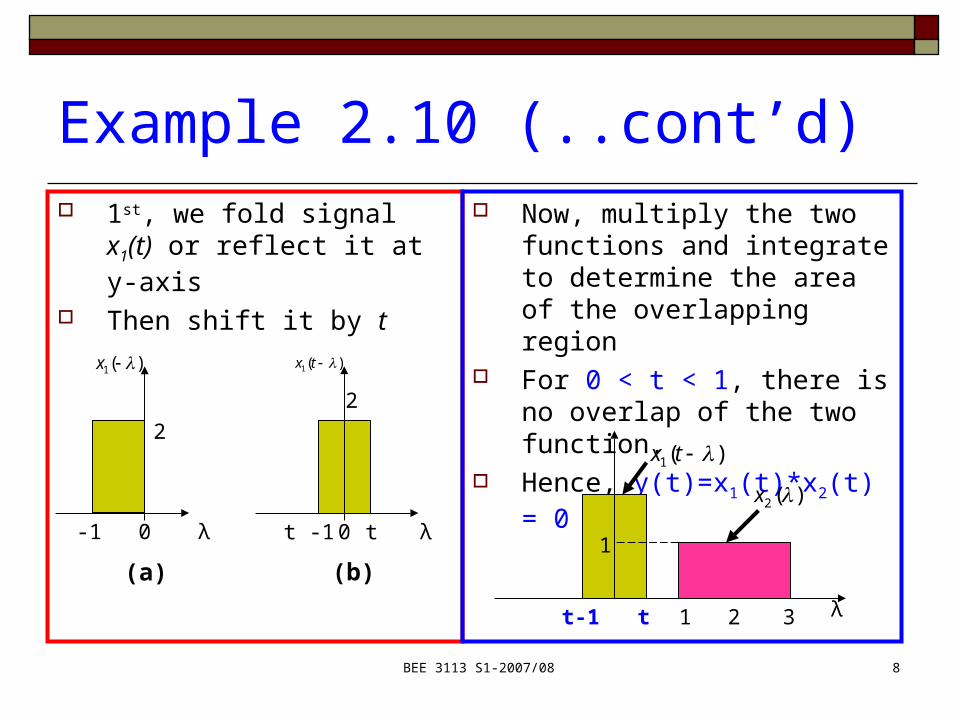
Example 2.10 (..cont’d) 1st, we fold signal x1(t) or reflect
it at y-axis Then shift it by t
λ
)(1 x
2
0-1
(a)
λ
)(1 tx
2
0t -1 t
(b)
Now, multiply the two functions and integrate to determine the area of the overlapping region
For 0 < t < 1, there is no overlap of the two function.
Hence, y(t)=x1(t)*x2(t) = 0
)(1 tx
1 2 3 λ
1
)(2 x
tt-1
BEE 3113 S1-2007/08 9
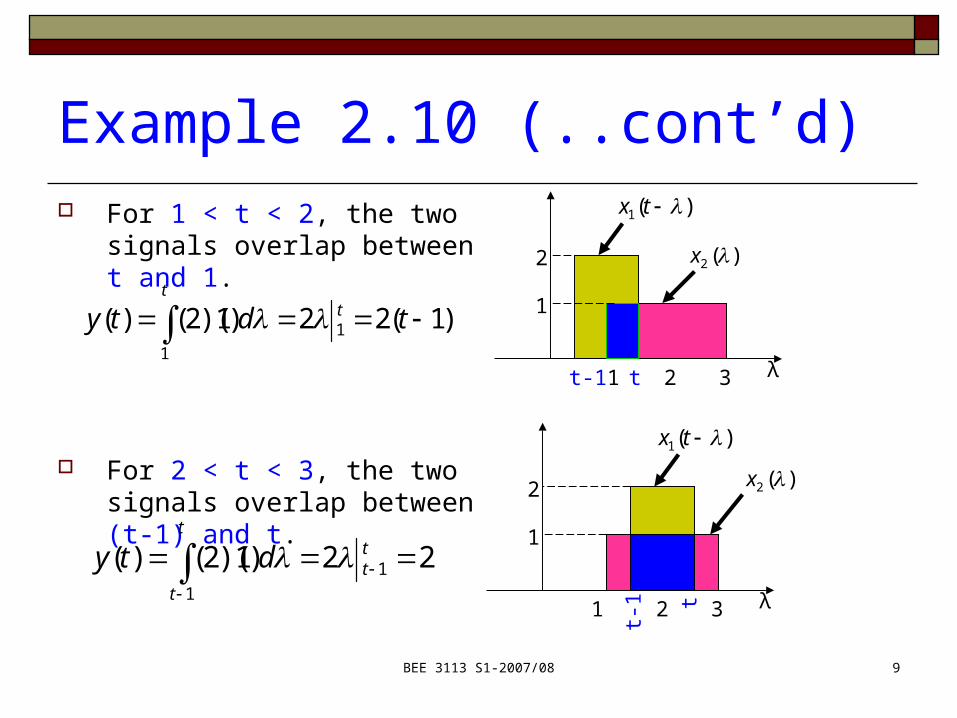
Example 2.10 (..cont’d)
)1(22)1)(2()(1
1 tdtyt
t
For 1 < t < 2, the two signals overlap between t and 1.
For 2 < t < 3, the two signals overlap between (t-1) and t.
22)1)(2()(1
1
t
t
ttdty
)(1 tx
1 2 3 λ
1
)(2 x
t-1
2
t
)(1 tx
1 2 3 λ
1
)(2 x
t-1
2
t
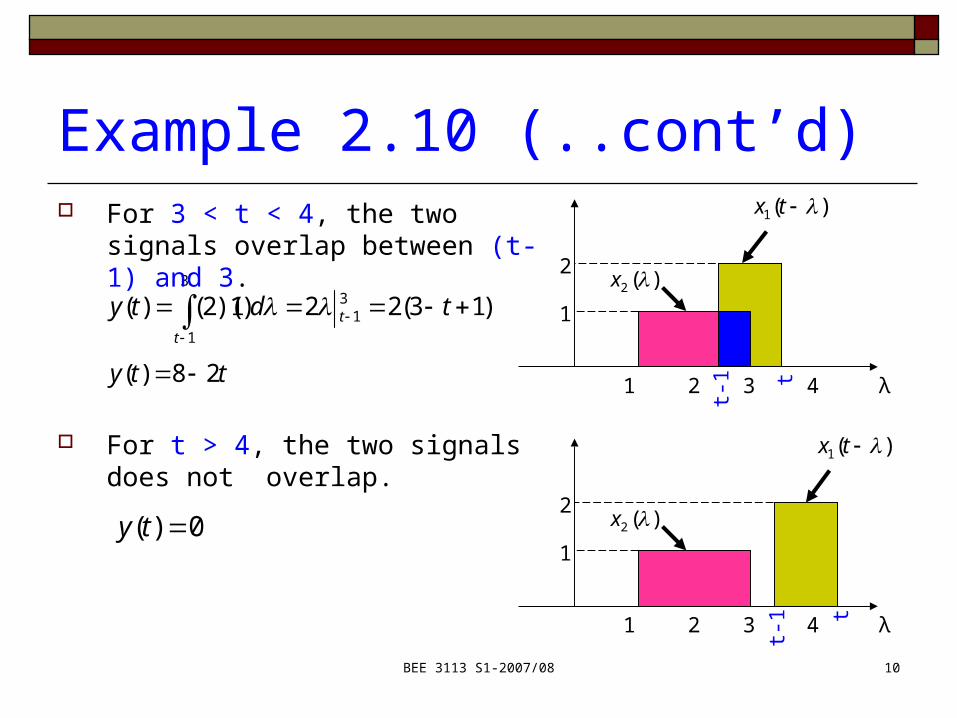
BEE 3113 S1-2007/08 10
Example 2.10 (..cont’d)
)13(22)1)(2()(3
1
31
tdty
tt
tty 28)(
For 3 < t < 4, the two signals overlap between (t-1) and 3.
1 2 3 λ
1
t-1
)(1 tx
2 )(2 x
t 4
For t > 4, the two signals does not overlap.
1 2 3 λ
1
t-1
)(1 tx
2 )(2 x
t4
0)( ty
BEE 3113 S1-2007/08 11
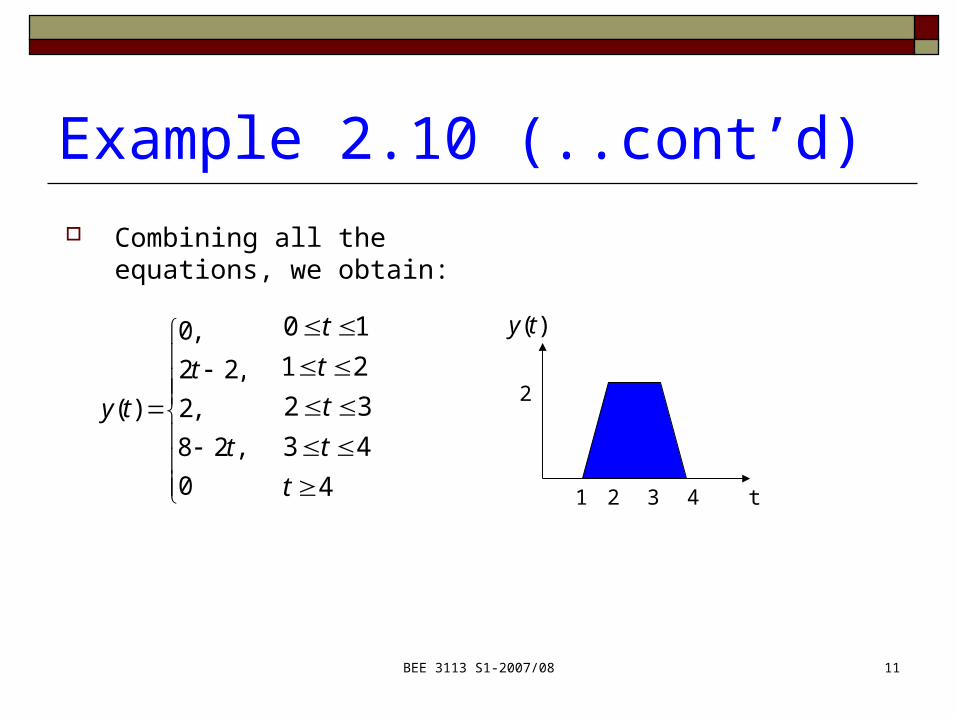
Example 2.10 (..cont’d)
0,28
,2,22
,0
)(t
tty
Combining all the equations, we obtain:
443322110
ttttt )(ty
t
2
1 2 3 4
BEE 3113 S1-2007/08 12
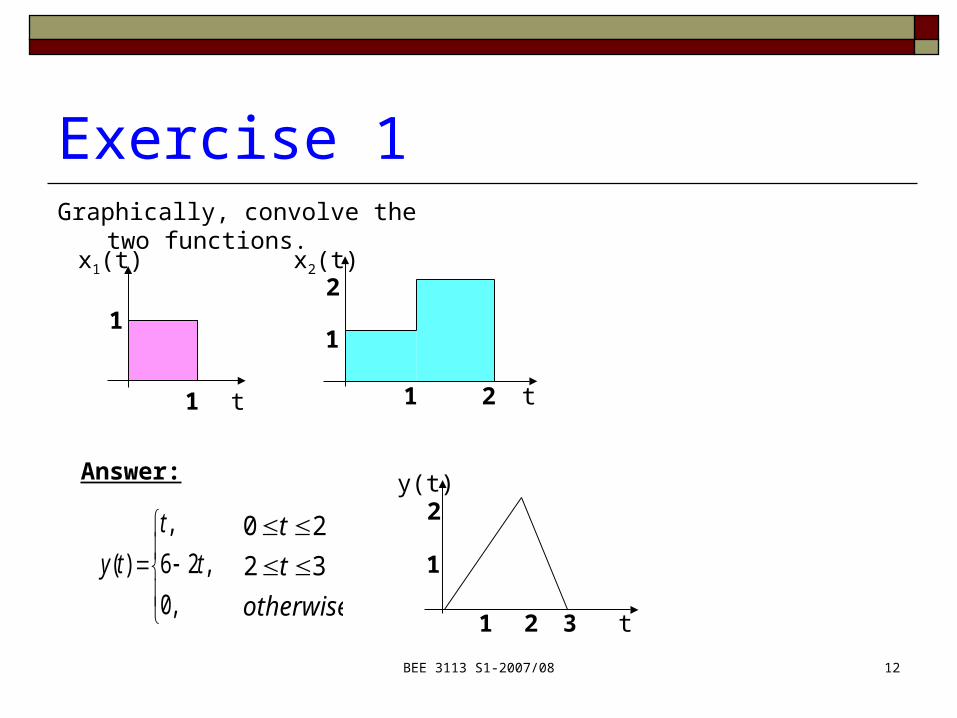
Exercise 1Graphically, convolve the two functions.
,0
,26,
)( tt
ty
x1(t)
t
1
1
x2(t)
t
1
1 2
2
Answer:
otherwisett
3220
y(t)
t
1
1 2
2
3
BEE 3113 S1-2007/08 13
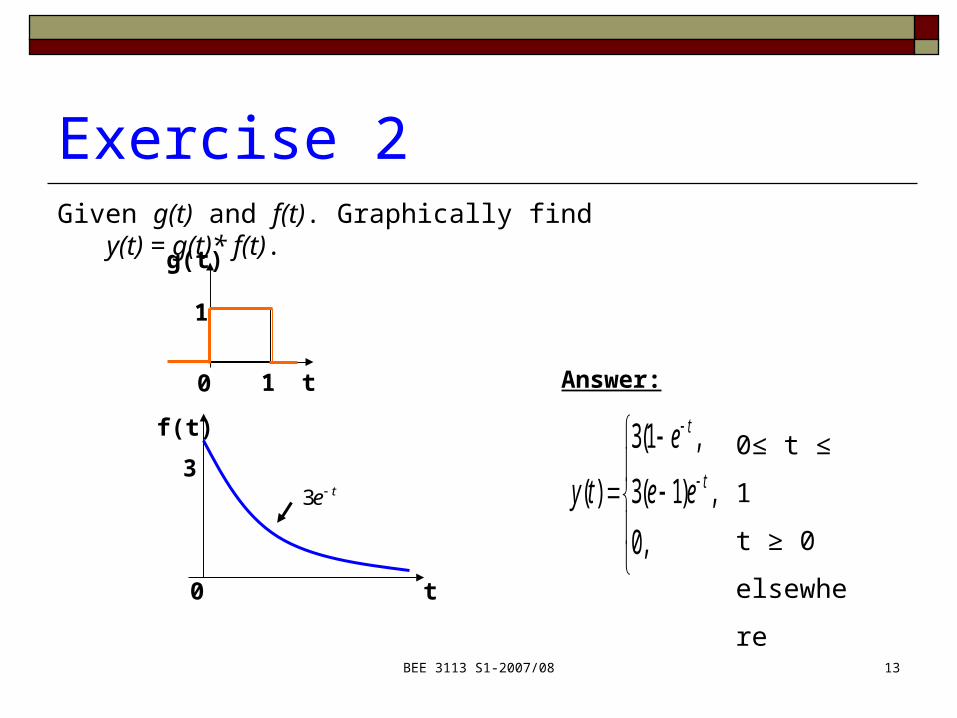
Exercise 2Given g(t) and f(t). Graphically find y(t) = g(t)*
f(t). g(t)
t
1
10
f(t)
t
3
0
te3
,0,)1(3
,1(3
)( t
t
ee
e
ty
Answer:
0≤ t ≤ 1
t ≥ 0
elsewhere


![circular shift and convolution [وضع التوافق]site.iugaza.edu.ps/.../2010/02/circular_shift_and_convolution_.pdf · The circular convolution is very similar to normal convolution](https://img.pdfslide.us/doc/110x75/5af31c9c7f8b9a4d4d8bac6f/circular-shift-and-convolution-site-circular-convolution.jpg)