Embed Size (px)
Citation preview
NASA Contractor Report 201705
ICASE Report No. 97-27
/7
th
SARY
CONVEYING THE 3D SHAPE OF TRANSPARENT
SURFACES VIA TEXTURE
Victoria Interrante
Henry Fuchs
Stephen Pizer
NASA Contract No. NAS1-19480
June 1997
Institute for Computer Applications in Science and Engineering
NASA Langley Research Center
Hampton, VA 23681-0001
Operated by Universities Space Research Association
National Aeronautics and
Space Administration
Langley Research Center
Hampton, Virginia 23681-0001
https://ntrs.nasa.gov/search.jsp?R=19970025235 2018-06-15T20:36:01+00:00Z

Conveying the 3D Shape of Transparent Surfaces via Texture
Victoria Interrante*, Henry Fuchs* and Stephen Pizer*
"Institute for Computer Applications in Science and Engineering (ICASE)
*University of North Carolina at Chapel Hill
Abstract
Transparency can be a useful device for depicting multiple overlapping surfaces in asingle image. The challenge is to render the transparent surfaces in such a way that their three-dimensional shape can be readily understood and their depth distance from underlying structuresclearly perceived.
This paper describes our investigations into the use of sparsely-distributed discrete,opaque texture as an "artistic device" for more explicitly indicating the relative depth of atransparent surface and for communicating the essential features of its 3D shape in an intuitivelymeaningful and minimally occluding way. The driving application for this work is thevisualization of layered surfaces in radiation therapy treatment planning data, and the technique isillustrated on transparent isointensity surfaces of radiation dose.
We describe the perceptual motivation and artistic inspiration for defining a stroketexture that is locally oriented in the direction of greatest normal curvature (and in whichindividual strokes are of a length proportional to the magnitude of the curvature in the directionthey indicate), and discuss several alternative methods for applying this texture to isointensitysurfaces defined in a volume.
We propose an experimental paradigm for objectively measuring observers' ability tojudge the shape and depth of a layered transparent surface, in the course of a task relevant to theneeds of radiotherapy treatment planning, and use this paradigm to evaluate the practicaleffectiveness of our approach through a controlled observer experiment based on imagesgenerated from actual clinical data.
This research was supported by NIH grant #POI CA47982 and was partially supported by the National Aeronautics
and Space Administration under NASA contract number NAS1-19480 while the first author was in residence at the
Institute for Computer Applications in Science and Engineering, NASA Langley Research Center, Hampton, VA23681.

1 Introduction
There are many potential advantages in using transparency to simultaneously depict
multiple superimposed layers of information. The complex spatial relationship between two
irregularly-shaped surfaces can be more easily understood when each surface is visible in the
context of the other, and the three-dimensional structure of a scene can be more accurately and
efficiently appreciated when the layered elements are displayed in their entirety, rather than
having to be mentally reconstructed from an iterative sequence of 2D slices. However, in
computer-generated images -- as in photographs and directly viewed objects -- it can often be
difficult to adequately perceive the full three-dimensional shape of an external transparent
surface, or to correctly judge its depth distance from arbitrary points on an underlying opaque
structure. Although photorealism is a worthy goal, it does not, in and of itself, provide a
complete solution to this problem: physically accurate rendering algorithms are difficult to
implement and time-consuming to compute; faithfully depicting such phenomena as refraction
and caustics may do more harm than good by introducing extraneous and distracting detail while
confusing the perception of underlying information; and there is substantial evidence that
photorealism is neither essential nor sufficient for clearly representing layered transparent
surfaces. Transparency perception is only loosely constrained by the laws of optics -- it is
fundamentally achromatic in nature [38], and readily perceived in a number of physically
impossible situations [3, 14] while not perceived under other circumstances when it does exist in
actuality [35]. Perhaps the most compelling argument for the insufficiency of photorealism,
however, is the observation that the disciplines of medical and scientific illustration continue to
flourish today, despite the advent of photography, precisely because it is so often the case that a
photograph cannot adequately convey the necessary information about a subject or scene [32].
Through selective artistic enhancement we have the potential to portray information more clearly
by minimizing extraneous detail and emphasizing important features [21 ].
The driving application for our work with transparent surfaces is radiation therapy, one of
the three principal treatments for the control or cure of cancer. In radiation therapy, physicians
attempt to eliminate cancer or alleviate its symptoms, while maintaining a high quality of life for
the patient, by strategically delivering a high amount of radiation dose to targeted cancerous
tissue while only minimally irradiating uninvolved areas. In planning a treatment, clinicians
strive to define the number, orientation, shape and intensity of the multiple radiation beams to
achieve a dose distribution that optimally balances the competing concerns of maximizing the
probability of tumor control and minimizing the probability of normal tissue complications. This
is a difficult and complicated task, requiring the tradeoff of many factors, both quantifiable and
unquantifiable. We may help facilitate the treatment planning process by devising a means of

moreeffectivelyconveyingthethree-dimensionaldistributionof radiationdosein thecontextoftherelevantpatientanatomy.
2 Shape and Depth Cues on Transparent Surfaces
In determining how to best enhance the comprehensibility of transparent surfaces in
computer-generated images, it is useful to begin by looking at some of the underlying
explanations for the difficulties that we often encounter in perceiving the shapes and relative
depths of layered transparent surfaces in everyday experience.
Figure 1 shows, for reference, some example photographs of actual transparent objects.
Although the shapes of these depicted objects are far more regular and predictable than the shapes
of the isodose surfaces we aim to represent, the lack of naturally-occurring shape and depth cues
on the front-facing portions of these realistically rendered plain and smooth transparent surfaces
is nevertheless quite striking. Specular highlights, environmental reflections and refractive
distortion provide the only potential sources of surface shape information, and surface depth
information is almost completely unavailable.
Figure 1: Photographs of actual transparent objects. Left: a plastic train with see-throughchassis; center: a plastic bear superimposed over an alphabet flashcard; right: a set ofthree nested pumpkins.
2.1 Silhouettes and contours
Most of the shape information available in photographs of clear, transparent surfaces is
contained in the silhouette and contour regions. Silhouettes are important for form perception
because they define the boundary between figure and ground, and contours, defined as the locus
of all points where the surface normal is orthogonal to the viewing direction [25], mark both
internal and external depth discontinuities. Although we are able to infer the nature of the 3D
shape of a closed surface in the vicinity of an occluding contour from the sign of the curvature of
the contour (convex contours indicate areas of positive Gaussian curvature, concave contours
2
indicatehyperbolicregions,andlocallyflat points or inflections indicate a parabolic line or a
region of zero Gaussian curvature [44]), these contour curves provide little indication of depth
distance or surface shape across forward-facing areas. The effects of refraction, which are most
strongly evident where the viewing direction grazes the surface, can sometimes emphasize
silhouettes and contours, and perhaps indirectly indicate some curvature features of an external
transparent surface, but these small gains come at the expense of potentially significant distortion
of interior or rearward structures. Because we aim to communicate the shapes and relative
distances between multiple layered surfaces, it is important to provide as clear a view of each
structure as possible. Therefore we have chosen not to model the effects of refraction but to rely
on luminance or color differences to convey figure/ground discontinuities.
2.2 Shape and depth from shading
Shape- from- diffuse shading cues are minimal at best on clear, transparent surfaces, and
occlusion, normally one of the most powerful indicators of depth order relations, is present only
to the extent that the intensity of a reflected light precludes the discrimination of underlying
entities. Specular highlights and environmental reflections can provide some cues to surface
shape, but, because they are viewpoint-dependent, they cannot provide an accurate indication of
the relative depth of a transparent surface, in either a monocular or binocular view.
As an object is repositioned or the viewing direction changed, the apparent locations of
the specular highlights will shift about. Specular highlights move more slowly over highly
curved regions, tend to cling to ridges [24], and appear or disappear from sight as the viewing
direction crosses the caustic [4]. Although it is possible, in the vicinity of a specular highlight, to
infer the sign of the surface curvature in the direction of known object or observer motion from
the direction of the relative motion of the specular highlight, the extent of this motion can be
reliably perceived only in the presence of fixed surface detail, and the direction of this motion is
primarily useful only for disambiguating convex from concave patches (in convex areas, a
specular highlight will move with a moving observer; in concave regions the directions of these
motions will be opposed; the direction of motion of a specular highlight across a hyperbolic
surface will depend upon the orientation of the surface relative to the direction of the observer
motion [61]). Little depth information is available from the velocity gradients of specular
highlights under conditions of object or observer motion, either with respect to other surface
features or with respect to specific points on an underlying opaque object.
When a shiny object is observed with both eyes, the specular highlights will appear to lie
in different locations on the surface in the view from each eye (it is easiest to see this with a point
light source and an opaque, textured object). Because the retinal disparity of the specular
highlights differs from the retinal disparity of the surface detail in the corresponding views, the
highlight will be perceived to be located at a different distance from the viewpoint. Blake and
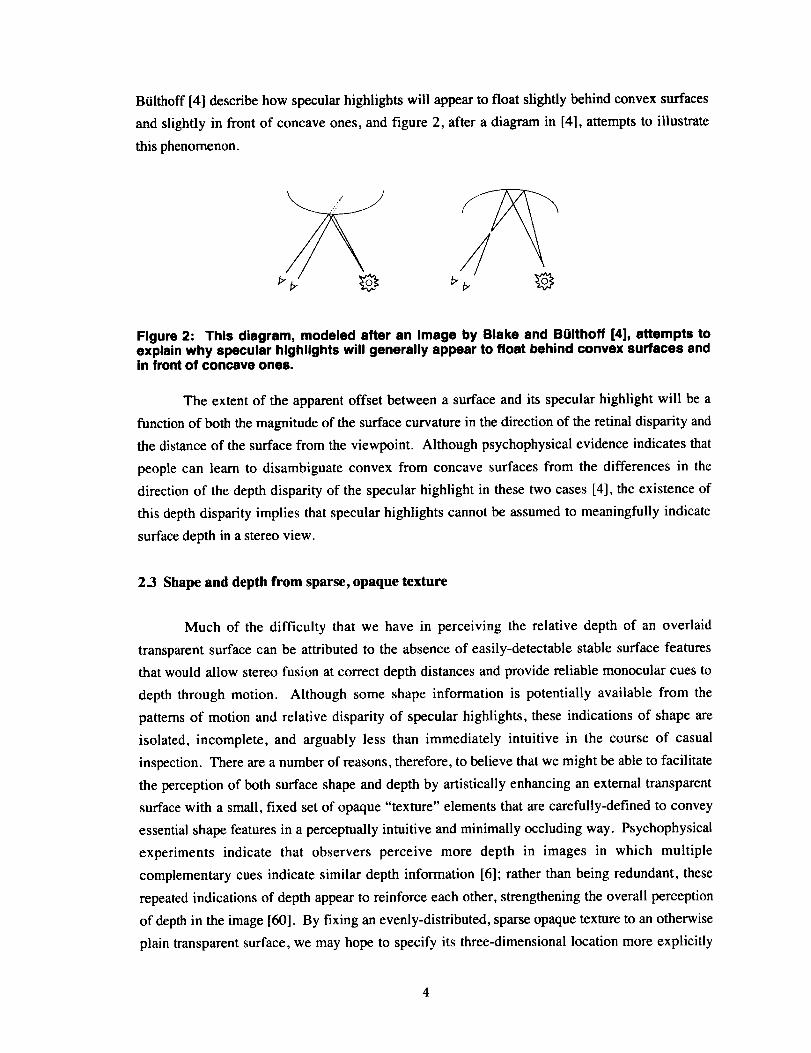
Biilthoff[4] describe how specular highlights will appear to float slightly behind convex surfaces
and slightly in front of concave ones, and figure 2, after a diagram in [4], attempts to illustrate
this phenomenon.
Figure 2: This diagram, modeled after an Image by Blake and BOlthoff [4], attempts toexplain why specular highlights will generally appear to float behind convex surfaces andin front of concave ones.
The extent of the apparent offset between a surface and its specular highlight will be a
function of both the magnitude of the surface curvature in the direction of the retinal disparity and
the distance of the surface from the viewpoint. Although psychophysical evidence indicates that
people can learn to disambiguate convex from concave surfaces from the differences in the
direction of the depth disparity of the specular highlight in these two cases [4], the existence of
this depth disparity implies that specular highlights cannot be assumed to meaningfully indicate
surface depth in a stereo view.
2.3 Shape and depth from sparse, opaque texture
Much of the difficulty that we have in perceiving the relative depth of an overlaid
transparent surface can be attributed to the absence of easily-detectable stable surface features
that would allow stereo fusion at correct depth distances and provide reliable monocular cues to
depth through motion. Although some shape information is potentially available from the
patterns of motion and relative disparity of specular highlights, these indications of shape are
isolated, incomplete, and arguably less than immediately intuitive in the course of casual
inspection. There are a number of reasons, therefore, to believe that we might be able to facilitate
the perception of both surface shape and depth by artistically enhancing an external transparent
surface with a small, fixed set of opaque "texture" elements that are carefully-defined to convey
essential shape features in a perceptually intuitive and minimally occluding way. Psychophysical
experiments indicate that observers perceive more depth in images in which multiple
complementary cues indicate similar depth information [6]; rather than being redundant, these
repeated indications of depth appear to reinforce each other, strengthening the overall perception
of depth in the image [60]. By fixing an evenly-distributed, sparse opaque texture to an otherwise
plain transparent surface, we may hope to specify its three-dimensional location more explicitly
4
andcompletelywhilepreservingthevisibility of underlying structures, provide stable occlusion
cues, facilitate the veridical perception of surface depth from binocular disparity, and enable an
intuitive perception of shape and depth from the velocity gradients of fixed surface points.
3 Previous Work
In an earlier paper [23], we suggested that the essential shape features of certain familiar
transparent objects might be communicated particularly effectively via a rendering approach
intended to approximate the style of a "3D, view-independent sketch", in which the valley lines
and the crests of sharp ridges are selectively emphasized by being displayed with greater opacity
than other, less strategically significant surface regions. Although this approach yielded
promising results on some of the transparent skin surfaces that it was designed to represent, we
immediately recognized that not all of the surfaces in our layered treatment planning data would
easily characterizable by prominent, shape-based features. A different approach was needed for
conveying the shapes and depths of the smoothly undulating, vaguely spherical, layered
isointensity surfaces of radiation dose -- an approach that relied on a more evenly-distributed set
of sparse opaque markings.
It has long been recognized that the slant of a flat plane or the shape of a smoothly
curving surface can be conveyed much more effectively when the surface is textured rather than
left plain [12, 50, 54], and although there appears to be no definitive agreement on the specific
characteristics of a texture pattern that are most instrumental in indicating shape, this question has
been repeatedly broached in the visual perception literature [15 12, 10, 51,55, 56, 9]. The idea of
using opacity-modulating texture to enhance the visibility of layered transparent surfaces is also
not new. The three general approaches have been previously proposed: Dooley and Cohen [11]
suggested using a fixed screen-space pattern to modulate the opacity of a transparent surface after
projection onto the image plane; Levoy et al. [29] used a uniform sampling of finite-width planes
along the three orthogonal axes of a 3D dataset to define a volume opacity mask that can be
applied as a generic "solid texture" [40] during volume rendering; and Rheingams [43] developed
a method for using standard hardware texture-mapping routines to apply a procedurally-defined
2D texture across evenly-distributed points on an arbitrary surface in 3D. Similarly, there is
significant precedent, particularly in applications that use computer graphics for interactive data
display, for representing a continuous transparent or opaque surface by a sparse set of discrete
graphical primitives such as points, lines, spheres, or triangle strips [8, 41,45, 1]. Originally
intended more as a means of improving rendering efficiency than as a device for improving the
comprehensibility of surface shape, it can be argued that the best of these methods serve both
purposes well.
The particular contribution of the work presented in this paper is to suggest that the shape
and depth of a gently curving, layered transparent surface may be communicated particularly
effectively via a relatively evenly-distributed, sparse opaque texture that has been explicitly
designed to convey basic surface shape properties in a perceptually intuitive and minimally
occluding way. The method that we propose was inspired by observations of artist's use of line
to show shape and is based on fundamental concepts from differential geometry.
4 Artists' Use of Texture to Communicate Surface Shape in Line Drawings
Our central premise in this work is that there is a definable art to effectively conveying
shape with line. Although it has been experimentally demonstrated that observers can fairly
accurately recover the local surface orientation at a selected surface point from the apparent slant
and tilt of a circular element at that location [52, 2], medical and scientific illustrators rarely use
such markings in their work. Recent psychophysical research suggests that shape perception is
internally represented as an organization of space, based on local depth order relations, and not
derived from individual estimations of the direction of the normal at distributed points [56, 26].
Artists caution against representing strokes, or any texture elements, in such a way that they take
on a character of their own, noting that when individual texture markings are unduly prominent,
they often do more harm than good, distracting the attention of the observer, confusing the
appearance of the picture and adding visual "noise" that detracts from rather than enhances the
overall effectiveness of the presentation.
When artists and illustrators represent a 3D form in a 2D, static line drawing, they appear
to rely primarily on line width and spacing to specify shape via shading, and on stroke direction
to describe the structural "flow" of the form. Foreseeing a number of potential difficulties with
gracefully depicting changing patterns of surface illumination via continuous texture
modifications under conditions of dynamic viewing, we have chosen to side-step this issue for the
moment and restrict ourselves to the pursuit of a viewpoint-independent texture representation
based on stroke direction, leaving shape-from-shading cues to be provided by the illuminance
distribution across the opaque texture elements.
Artists have repeatedly emphasized the importance of stroke direction in line drawings
[53, 42, 18], and it is popularly recognized that our perception of a surface's form will be
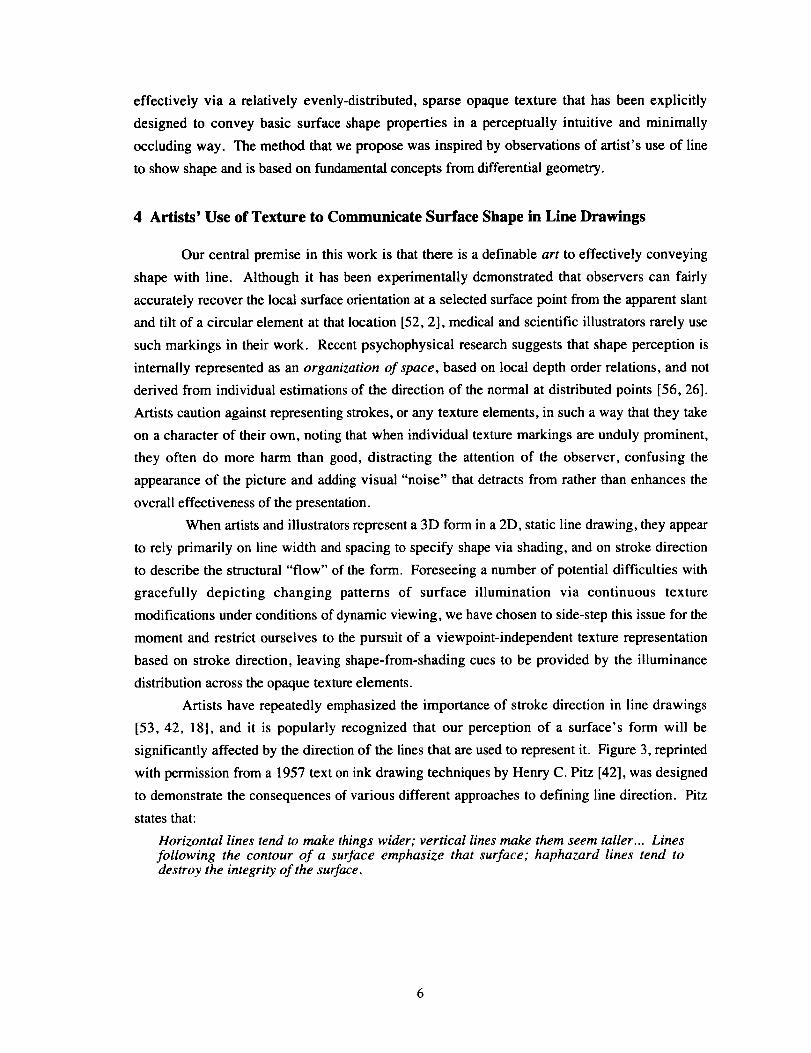
significantly affected by the direction of the lines that are used to represent it. Figure 3, reprinted
with permission from a 1957 text on ink drawing techniques by Henry C. Pitz [42], was designed
to demonstrate the consequences of various different approaches to defining line direction. Pitz
states that:
Horizontal lines tend to make things wider; vertical lines make them seem taller... Linesfollowing the contour of a surface emphasize that surface; haphazard lines tend todestroy the integrity of the surface.
i i!iiif!iii .........
Figure 3: An illustration of the effects of line direction on object appearance. Henry C.Pitz, Ink Drawina TechniQues, ©Watson-Guptill Publications, 1957. Reprinted withpermission.
When strokes are applied in a uniform fashion across an entire image, objects will tend to
appear flattened. Guptill [18] advises that "as a general rule, a subject offers some hint as to a
natural arrangement of lines", but references to specific algorithms for defining a line's direction
so that it follows the form over which is laid prove to be somewhat elusive. In one of the few
texts that offer a detailed treatment of this subject, Sullivan [53], also recommending that "it is a
good general rule to make any group of lines used for the modelling of a surface follow the form,
on some simple scheme", suggests two alternative methods for defining stroke direction. The
simplest of these he describes as "guided by the fall of light upon the object", which can be
represented as the projection of conical arcs or radial lines emanating from a point light source at
close proximity to the subject. However, he cautions that this approach may have a flattening
effect where the orientation of the strokes closely parallels the boundary of the form. The second
method, which he describes as "probably the most difficult .... based more strictly upon the form
itself and demanding the greatest knowledge of it", is to align the strokes at "right angles to the
length of the form". If one assumes that the "length" of a form is described by the direction of
least surface curvature, this can be alternatively interpreted as corresponding to the direction of
the strongest curvature of the surface, or the first principal curvature.
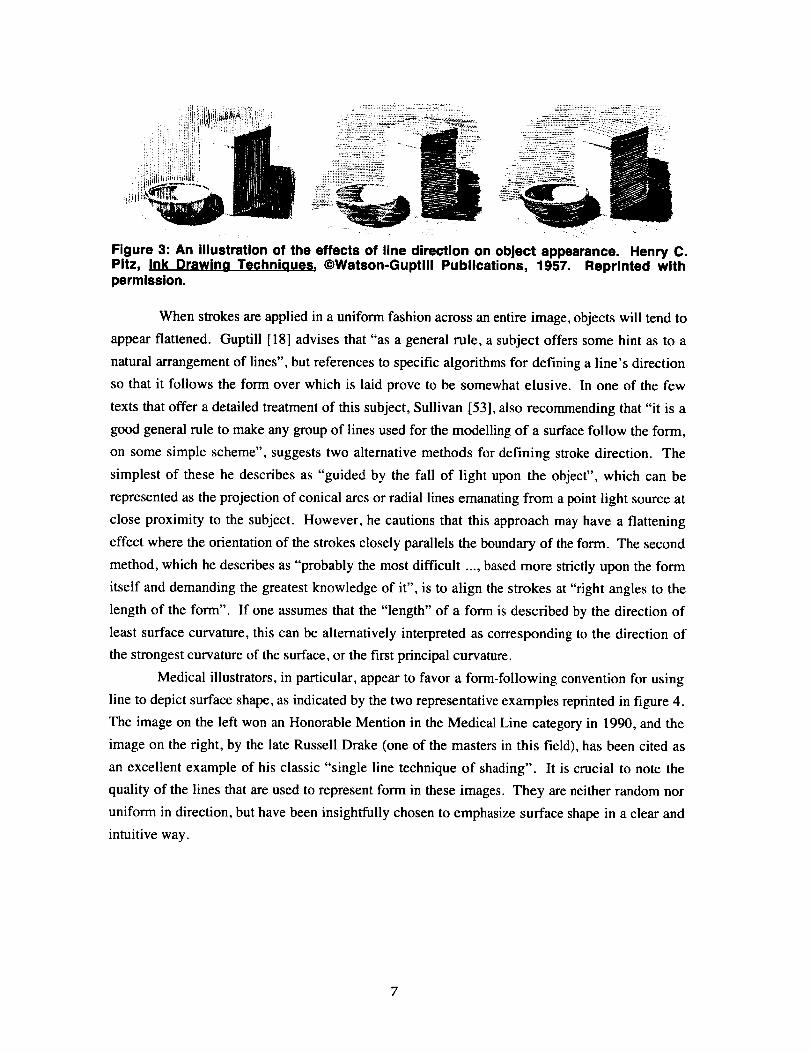
Medical illustrators, in particular, appear to favor a form-following convention for using
line to depict surface shape, as indicated by the two representative examples reprinted in figure 4.
The image on the left won an Honorable Mention in the Medical Line category in 1990, and the
image on the right, by the late Russell Drake (one of the masters in this field), has been cited as
an excellent example of his classic "single line technique of shading". It is crucial to note the
quality of the lines that are used to represent form in these images. They are neither random nor
uniform in direction, but have been insightfully chosen to emphasize surface shape in a clear and
intuitive way.
¸:̧
Figure 4: Representative examples of the use of line In medical illustration. Left: "SurgicalRepair of Septate Uterus, Figure A", by John V. Hagen, in Atlas of G_vnecoloaic Suraer¥.Raymond A. Lee, Saunders, Philadelphia, 1992. Copyright by Mayo Foundation. Bypermission of Mayo Foundation. Right: "Lumbosecral and Sacroiliac Fusion", RussellDrake, medical Illustrator, Mayo Foundation, 1932.
5 Principal Directions and Principal Curvatures
In order to represent the curvature of a form with stroke direction, it is necessary to first
define a means for extracting this geometric information, and to do this we turn to the classic
mathematical descriptions of surface shape provided by differential geometry [20, 25].
At any non-spherical point on a generic, smooth surface there will be a single direction,
orthogonal to the surface normal, in which the normal curvature of the surface is greatest
("normal curvature" is defined in any particular direction by the curvature of the strip of the
surface that intersects the plane spanned by the normal and the specified direction vector.) The
direction of maximum normal curvature is referred to as the first principal direction, and the
curvature in this direction is referred to as the first principal curvature. The second principal
direction, which also lies in the tangent plane and is always orthogonal to the first principal
direction, specifies the direction in which the surface curvature is least. The principal directions
and principal curvatures can be easily computed at arbitrary points on a smoothly curving surface
from the eigenvectors and eigenvalues of the second fundamental form [25, 37]. Monga et al.
I36] describe an efficient algorithm for obtaining principal curvatures on isointensity surfaces in
volume data directly from the first and second derivatives of the intensity information and
without any local surface fitting.
For the particular application described in this paper, we will only need to compute
principal directions and principal curvatures at a relatively small number of predetermined points.
Webeginby defininganorthogonalframe,(el,e2,e3)attheselectedsurfacepointPx,y,z, where
e3 points in the surface normal direction and el and e2 span the tangent plane (we obtain el by
choosing an arbitrary direction in the tangent plane, and then derive _2 by taking the cross
product of _1 and e3). From this orthogonal frame we can determine the second fundamental
form A:L&I3 dj23j, a matrix that describes the local surface shape in terms of the tangent
- i3 specify the component in the @iplanes in the local neighborhood of Px,y,z. The coefficients co1
direction of the rate at which the surface normal tips as you move across the surface in the _1
direction; when i=j these terms have been described as specifying the "'nose-dives" of the frame,
- i3and when iej as specifying the "twists" [25]. We compute c0j in practice by taking the dot
product of _i and the first derivative of the gradient in the _y direction. It is essential to use
floating point values for the gradients, and smoother results are achieved when the data is
prefiltered, or when instead of using simple central differences, a Gaussian-weighted derivative
operator is applied over all of the voxels in the local 3x3x3 neighborhood. The "twist" terms &_3
and &_3 need to be equal. The next step is to rotate the orthogonal frame about _3 so that the
[0'0] rtwist terms disappear by diagonalizing A to obtain D = and P = , whereK'2 L1)1v I)2 v j
A=PDP -1 and I :,W>l 21.The principal directions in 913are given by el =1)iuel + 1)ive2, and the
principal curvatures are specified by t¢I and _¢2- Though all of this may sound a bit complicated,
we have found in practice that it takes only a few seconds to perform a very straightforward
implementation of these calculations on the handful of selected points where we need to know
this information.
6 Related Work
The idea that we might effectively communicate surface shape by explicitly representing
the principal directions and principal curvatures on a surface has precedents. Frobin and
Hierholzer [13] used a local surface-fitting approach to define the principal directions and
principal curvatures at evenly-spaced points on discretely sampled, acquired height data of the
human back, and demonstrated how these quantities could be displayed as a pattern of cross hairs
on a 2D grid. Their goal was to convey position-invariant surface shape information not easily
accessible from the then-standard Moir6 topograms. Researchers in computer vision also pursued
the idea that an intrinsic surface description could be assembled from local differential geometry
measurements computed on surfaces in acquired data. Brady et al. [5] proposed an approach
wherein local estimates of the directions of principal curvature were "linked" across a surface and
planar "lines of curvature" extracted, and Sander and Zucker [49] computed principal direction
vectors on surfaces in three-dimensional data as part of their efforts to derive an analytical surface
representation and to define and categorize its various patches according to the properties of their
Gaussian curvature.
Researchers in computer-aided design, who are working primarily with analytically-
defined surfaces, have developed a number of sophisticated methods, based on concepts from
differential geometry, for detecting and depicting a wide variety of important surface shape
properties [19, 17, 37]. Collectively referred to as "surface interrogation techniques", these
methods include: using lines of constant illumination called "isophotes" to reveal the degree of
curvature continuity across a surface region (if a surface is C r continuous, the isophotes will
have Cr-I continuity); using the pattern of reflection of parallel light lines to reveal irregularities
in surface curvature (a standard technique in auto manufacturing); using color-coded maps of
Gaussian curvature, mean curvature, minimum or maximum principal curvature, and lines of
constant curvature to help define optimal tool sizes and paths for numerically-controlled milling
[34]; computing and displaying offset surfaces, focal surfaces, orthotomics, "contour" curves
formed by the intersection of the surface with a series of planes along an arbitrary axis (this use of
the term contour in this context should not be confused with the use of the same term in section
2.1 to refer to a completely different entity) and more. Guid et al. [17] assert, however, that
"displaying the directions of principal curvatures on a regular grid stretched over the whole
surface...give[s] a user nearly no information", and there are few indications that such an
approach has many followers in this particular field.
The goal of artistically representing surface shape with line has inspired some very fine
techniques for automatically generating line-drawings that bear a remarkable resemblance to the
work of pen-and-ink artists. Although these techniques don't involve principal directions, and are
thus far only applicable on planar or parametrically-defined surface patches, we mention them
here because the results are so very inspiring. Saito and Takahashi [46] did some of the earliest
work in this area, defining a hachuring pattern based on the surface parameterization of a torus
and applying it in proportion to the surface shading indicated by an illumination map. It is
important to note that although in this particular case the lines of the parametric representation
fortuitously coincide with the principal directions, such a correspondence cannot be expected to
hold under general circumstances. Winkenbach and Salesin first described methods for
automatically generating pen-and-ink style renderings of architectural models in which
resolution-independent stroke textures were applied to planar surfaces [58], and then later
extended this work to apply similarly-detailed stroke textures to parametrically-defined surfaces,
10
followingthedirection of the parameterization [59]. Salisbury et al. created an interactive pen-
and-ink style drawing program in which, among other things, the orientation of the individual
elements of a higher-level stroke could be specified to follow the direction of the intensity
gradient in a two-dimensional reference image [47], and then later extended this work by
proposing a resolution-independent technique for storing and reproducing pen-and-ink
illustrations at arbitrary scales and sizes [48].
7 Defining a Principal Direction Texture
There are three principal considerations in defining a texture of distributed, opaque
strokes that can effectively convey the essential shape properties of an external transparent
surface while preserving the visibility of underlying structures. The first, and most important, is
stroke direction, which we define to be aligned with the first principal direction.
A second consideration is stroke placement. Given the needs of our application, we
could foresee several potential pitfalls and no particular advantages to varying the clustering
density of the texture strokes according to either shading or curvature properties, and we therefore
chose to center the strokes at an evenly-distributed subset of the points defined by the vertices of
a marching-cubes [33] triangulation of the isosurface being represented. The algorithm that we
use to select the stroke centerpoints accepts as input a list of triangle vertices and through an
iterative process generates a sublist of vertices in which no two entries are closer than a user-
specified Euclidean distance in three-space. Although standard solid texturing algorithms, which
employ textures that are defined independently of any particular surface, do not require such a
step and can be somewhat simpler to define, easier to render and more flexible in terms of being
applicable to an arbitrary number of different level surfaces in a given volume, it is difficult to
explicitly portray specific surface shape features using such methods.
The third issue is the definition of stroke length and width. Although line width, as well
as spacing, might potentially be used to reinforce shape-from-shading information, adopting such
an approach would mean sacrificing the viewpoint-independence of the texture representation.
We have therefore elected to use a single, common value for stroke width across an entire surface
in this implementation. Appropriately selecting the stroke length, however, turns out to be of
suprisingly crucial importance. The reason for this is that not all of the principal directions that
we have computed are equally important for shape understanding. Where a surface is relatively
fiat, tiny irregularities can have an unduly large influence on the computed direction of locally
maximum surface curvature, and small errors in surface normal calculations, due for example to
inadequate smoothness in the implicit reconstruction of the discretely sampled data, can have a
magnified deleterious impact on the accuracy and consistency of the computed principal
directions at those points. Because the length of each stroke directly determines the visual impact
of the direction that it defines, it is essential to define stroke length in such a way that specific
11
directions are most strongly indicated in the surface regions where their particular values are of
greatest perceptual importance. By tying the length of a stroke to the magnitude of the first
principal curvature, we ensure that stroke length is minimal in particularly flat areas, where there
is less justification for emphasizing one particular direction over all others, and while at the same
time allowing directional information to be prominently represented across strongly curved
surface regions. Although it can be argued that directional ambiguity is potentially as much of a
problem in locally spherical areas as it is in places where the surface is locally flat, the use of
longer strokes may be more easily justified in the former case, where the longer lines seem more
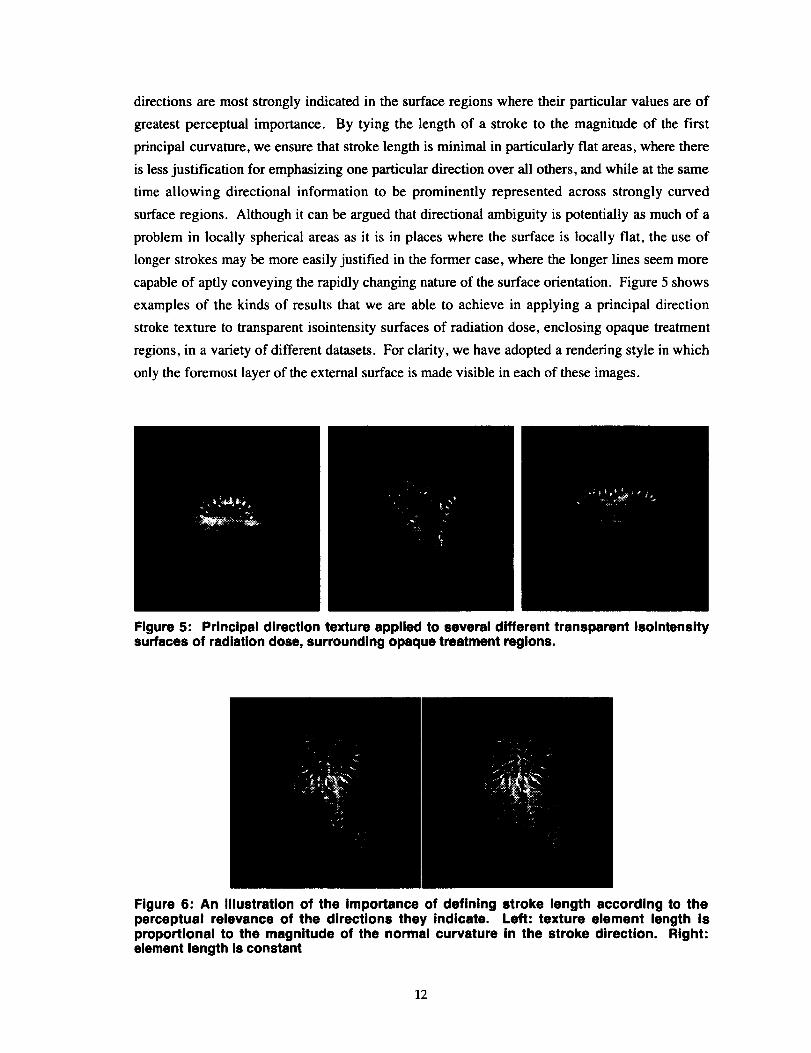
capable of aptly conveying the rapidly changing nature of the surface orientation. Figure 5 shows
examples of the kinds of results that we are able to achieve in applying a principal direction
stroke texture to transparent isointensity surfaces of radiation dose, enclosing opaque treatment
regions, in a variety of different datasets. For clarity, we have adopted a rendering style in which
only the foremost layer of the external surface is made visible in each of these images.
Figure 5: Principal direction texture applied to several different transparent Isolntensitysurfaces of radiation dose, surrounding opaque treatment regions.
Figure 6: An Illustration of the Importance of defining stroke length according to theperceptual relevance of the directions they indicate. Left: texture element length isproportional to the magnitude of the normal curvature in the stroke direction. Right:element length is constant
12
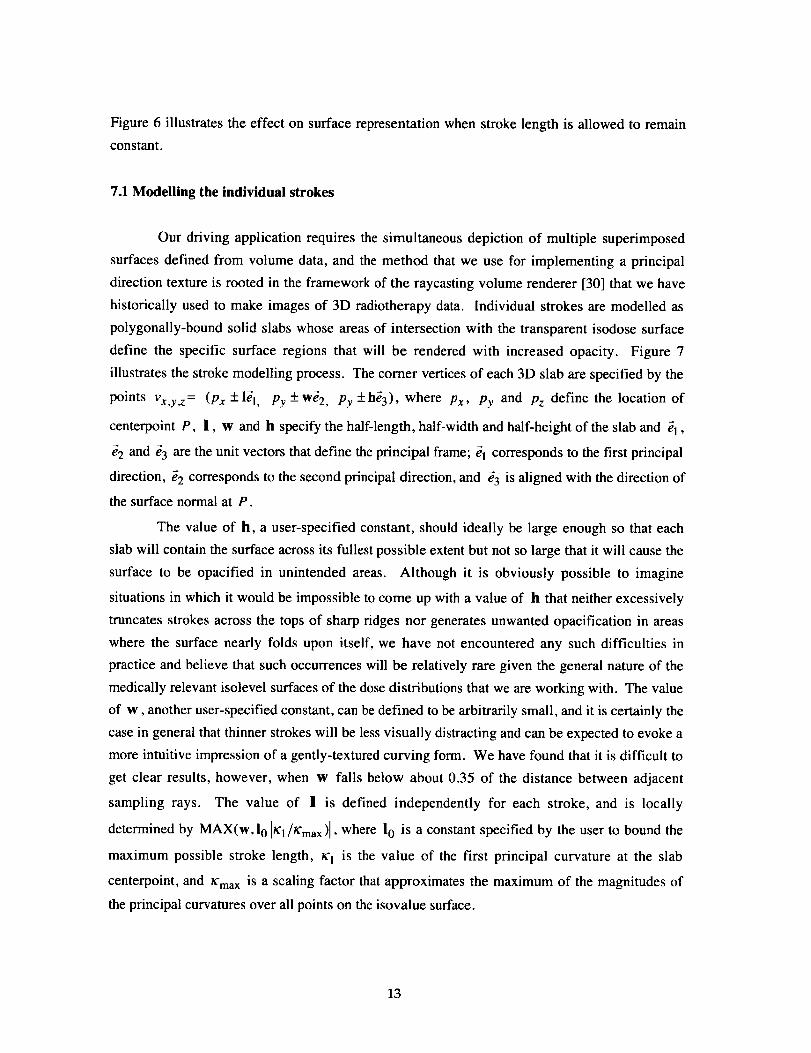
Figure 6 illustrates the effect on surface representation when stroke length is allowed to remain
constant.
7.1 Modelling the individual strokes
Our driving application requires the simultaneous depiction of multiple superimposed
surfaces defined from volume data, and the method that we use for implementing a principal
direction texture is rooted in the framework of the raycasting volume renderer [30] that we have
historically used to make images of 3D radiotherapy data. Individual strokes are modelled as
polygonally-bound solid slabs whose areas of intersection with the transparent isodose surface
define the specific surface regions that will be rendered with increased opacity. Figure 7
illustrates the stroke modelling process. The comer vertices of each 3D slab are specified by the
points Vx,y,z = (Px + lel, Py + W_a, Py + hi'3), where Px, Py and Pz define the location of
centerpoint P, |, w and h specify the half-length, half-width and half-height of the slab and _'1,
_2 and e3 are the unit vectors that define the principal frame; el corresponds to the first principal
direction, e2 corresponds to the second principal direction, and _3 is aligned with the direction of
the surface normal at P.
The value of h, a user-specified constant, should ideally be large enough so that each
slab will contain the surface across its fullest possible extent but not so large that it will cause the
surface to be opacified in unintended areas. Although it is obviously possible to imagine
situations in which it would be impossible to come up with a value of h that neither excessively
truncates strokes across the tops of sharp ridges nor generates unwanted opacification in areas
where the surface nearly folds upon itself, we have not encountered any such difficulties in
practice and believe that such occurrences will be relatively rare given the general nature of the
medically relevant isolevel surfaces of the dose distributions that we are working with. The value
of w, another user-specified constant, can be defined to be arbitrarily small, and it is certainly the
case in general that thinner strokes will be less visually distracting and can be expected to evoke a
more intuitive impression of a gently-textured curving form. We have found that it is difficult to
get clear results, however, when w falls below about 0.35 of the distance between adjacent
sampling rays. The value of | is defined independently for each stroke, and is locally
determined by MAX(w, 10 IK'l/K'max)l, where 10 is a constant specified by the user to bound the
maximum possible stroke length, t¢1 is the value of the first principal curvature at the slab
centerpoint, and K'max is a scaling factor that approximates the maximum of the magnitudes of
the principal curvatures over all points on the isovalue surface.
13
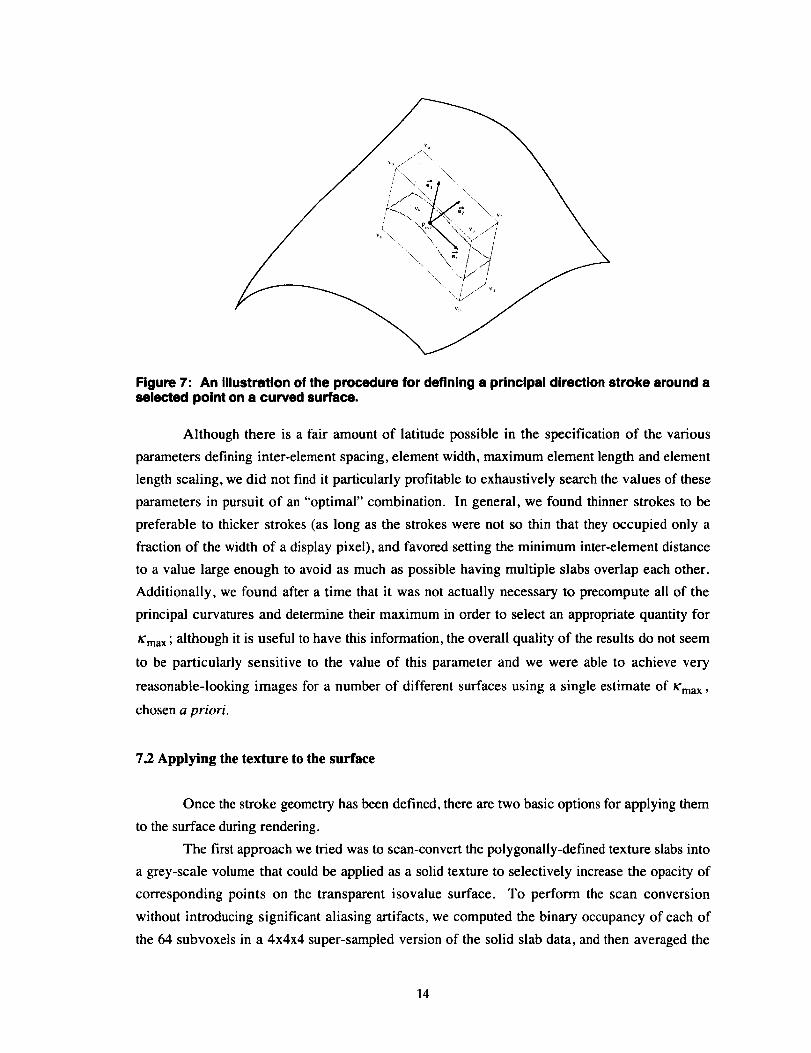
Figure 7: An Illustration of the procedure for defining a principal direction stroke around aselected point on a curved surface.
Although there is a fair amount of latitude possible in the specification of the various
parameters defining inter-element spacing, element width, maximum element length and element
length scaling, we did not find it particularly profitable to exhaustively search the values of these
parameters in pursuit of an "optimal" combination. In general, we found thinner strokes to be
preferable to thicker strokes (as long as the strokes were not so thin that they occupied only a
fraction of the width of a display pixel), and favored setting the minimum inter-element distance
to a value large enough to avoid as much as possible having multiple slabs overlap each other.
Additionally, we found after a time that it was not actually necessary to precompute all of the
principal curvatures and determine their maximum in order to select an appropriate quantity for
tCmax ; although it is useful to have this information, the overall quality of the results do not seem
to be particularly sensitive to the value of this parameter and we were able to achieve very
reasonable-looking images for a number of different surfaces using a single estimate of lCmax ,
chosen a priori.
7.2 Applying the texture to the surface
Once the stroke geometry has been defined, there are two basic options for applying them
to the surface during rendering.
The first approach we tried was to scan-convert the polygonally-defined texture slabs into
a grey-scale volume that could be applied as a solid texture to selectively increase the opacity of
corresponding points on the transparent isovalue surface. To perform the scan conversion
without introducing significant aliasing artifacts, we computed the binary occupancy of each of
the 64 subvoxels in a 4x4x4 super-sampled version of the solid slab data, and then averaged the
14
resultsto geta bytevaluecapableof adequatelyrepresentingpartialoccupancy. The primary
advantage to this technique was that, after the expensive overhead of the scan conversion, we
were able to reuse the volume opacity mask to quickly generate multiple images of a particular
textured surface from different orientations. The primary disadvantage to this approach, and the
reason that we eventually chose not to use it, was that the fidelity with which we were able to
represent fine stroke textures was fundamentally limited by the relatively coarse resolution of the
volume data. In subsequent side-by-side comparisons with the alternative approach described
below, it became apparent that the crispness of the individual strokes in the final renderings was
being compromised by this intermediate discretization step.
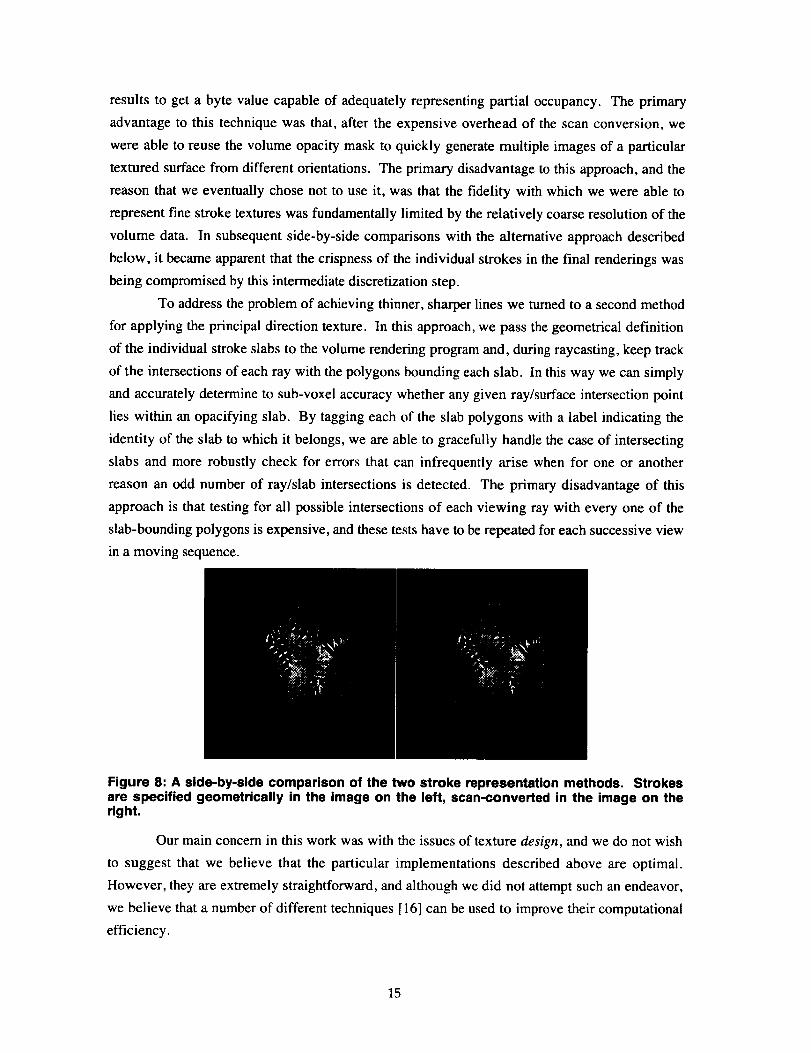
To address the problem of achieving thinner, sharper lines we turned to a second method
for applying the principal direction texture. In this approach, we pass the geometrical definition
of the individual stroke slabs to the volume rendering program and, during raycasting, keep track
of the intersections of each ray with the polygons bounding each slab. In this way we can simply
and accurately determine to sub-voxel accuracy whether any given ray/surface intersection point
lies within an opacifying slab. By tagging each of the slab polygons with a label indicating the
identity of the slab to which it belongs, we are able to gracefully handle the case of intersecting
slabs and more robustly check for errors that can infrequently arise when for one or another
reason an odd number of ray/slab intersections is detected. The primary disadvantage of this
approach is that testing for all possible intersections of each viewing ray with every one of the
slab-bounding polygons is expensive, and these tests have to be repeated for each successive view
in a moving sequence.
Figure 8: A side-by-side comparison of the two stroke representation methods. Strokesare specified geometrically in the image on the left, scan-converted in the image on theright.
Our main concern in this work was with the issues of texture design, and we do not wish
to suggest that we believe that the particular implementations described above are optimal.
However, they are extremely straightforward, and although we did not attempt such an endeavor,
we believe that a number of different techniques [16] can be used to improve their computational
efficiency.
15
8 Results
8.1 The visual impact of principal direction textures
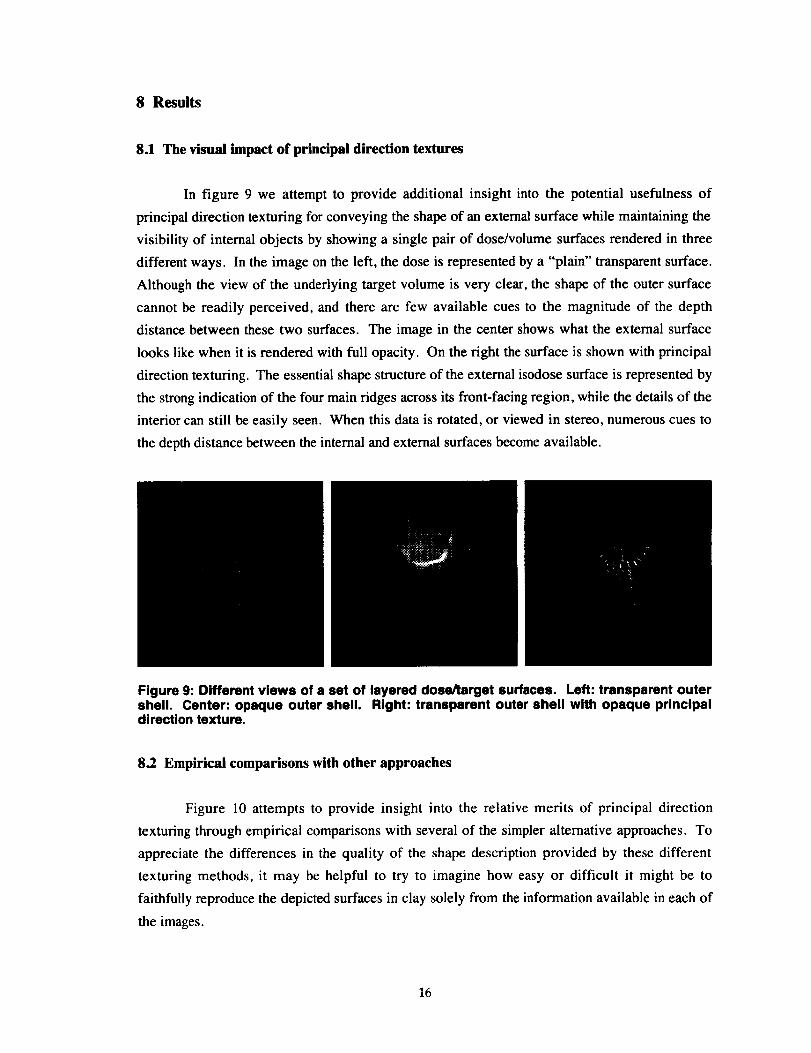
In figure 9 we attempt to provide additional insight into the potential usefulness of
principal direction texturing for conveying the shape of an external surface while maintaining the
visibility of internal objects by showing a single pair of dose/volume surfaces rendered in three
different ways. In the image on the left, the dose is represented by a "plain" transparent surface.
Although the view of the underlying target volume is very clear, the shape of the outer surface
cannot be readily perceived, and there are few available cues to the magnitude of the depth
distance between these two surfaces. The image in the center shows what the external surface
looks like when it is rendered with full opacity. On the right the surface is shown with principal
direction texturing. The essential shape structure of the external isodose surface is represented by
the strong indication of the four main ridges across its front-facing region, while the details of the
interior can still be easily seen. When this data is rotated, or viewed in stereo, numerous cues to
the depth distance between the internal and external surfaces become available.
Figure 9: Different views of a set of layered dose/target surfaces. Left: transparent outershell. Center: opaque outer shell. Right: transparent outer shell with opaque principaldirection texture.
8.2 Empirical comparisons with other approaches
Figure 10 attempts to provide insight into the relative merits of principal direction
texturing through empirical comparisons with several of the simpler alternative approaches. To
appreciate the differences in the quality of the shape description provided by these different
texturing methods, it may be helpful to try to imagine how easy or difficult it might be to
faithfully reproduce the depicted surfaces in clay solely from the information available in each of
the images.
16
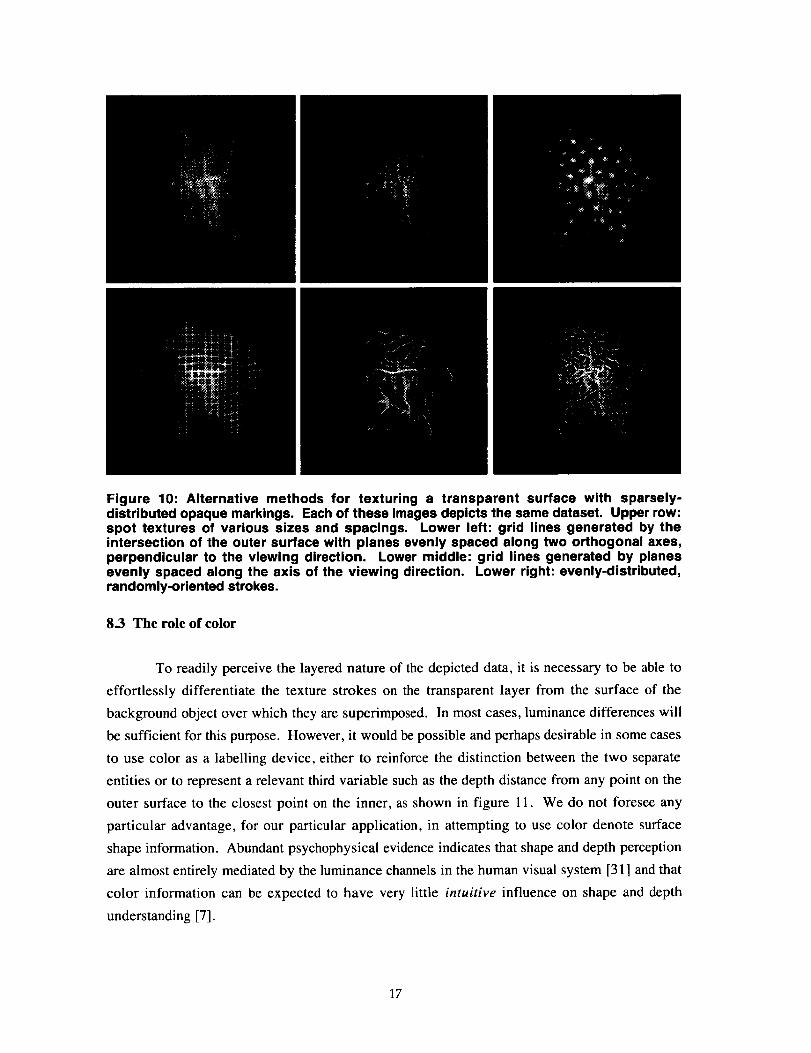
Figure 10: Alternative methods for texturing a transparent surface with sparsely-distributed opaque markings. Each of these images depicts the same dataset. Upper row:spot textures of various sizes and spacings. Lower left: grid lines generated by theintersection of the outer surface with planes evenly spaced along two orthogonal axes,perpendicular to the viewing direction. Lower middle: grid lines generated by planesevenly spaced along the axis of the viewing direction. Lower right: evenly-distributed,randomly-oriented strokes.
8.3 The role of color
To readily perceive the layered nature of the depicted data, it is necessary to be able to
effortlessly differentiate the texture strokes on the transparent layer from the surface of the
background object over which they are superimposed. In most cases, luminance differences will
be sufficient for this purpose. However, it would be possible and perhaps desirable in some cases
to use color as a labelling device, either to reinforce the distinction between the two separate
entities or to represent a relevant third variable such as the depth distance from any point on the
outer surface to the closest point on the inner, as shown in figure 11. We do not foresee any
particular advantage, for our particular application, in attempting to use color denote surface
shape information. Abundant psychophysical evidence indicates that shape and depth perception
are almost entirely mediated by the luminance channels in the human visual system [31] and that
color information can be expected to have very little intuitive influence on shape and depth
understanding [7].
17
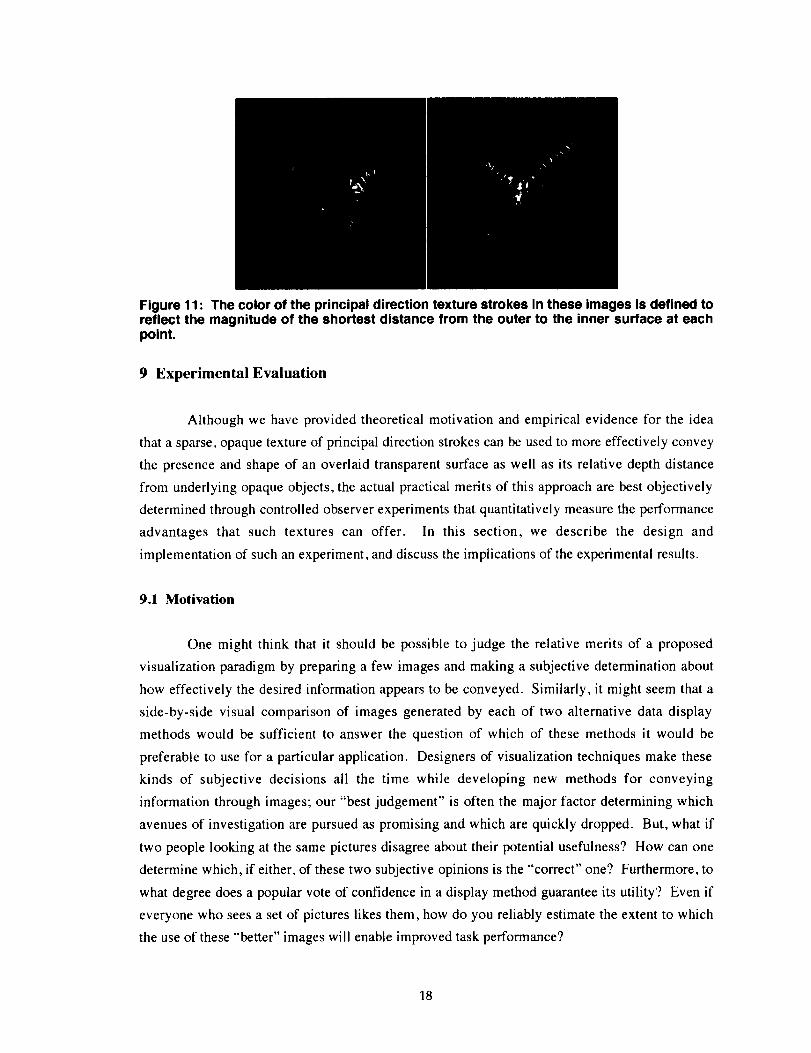
Figure 11: The color of the principal direction texture strokes in these images is defined toreflect the magnitude of the shortest distance from the outer to the inner surface at eachpoint.
9 Experimental Evaluation
Although we have provided theoretical motivation and empirical evidence for the idea
that a sparse, opaque texture of principal direction strokes can be used to more effectively convey
the presence and shape of an overlaid transparent surface as well as its relative depth distance
from underlying opaque objects, the actual practical merits of this approach are best objectively
determined through controlled observer experiments that quantitatively measure the performance
advantages that such textures can offer. In this section, we describe the design and
implementation of such an experiment, and discuss the implications of the experimental results.
9.1 Motivation
One might think that it should be possible to judge the relative merits of a proposed
visualization paradigm by preparing a few images and making a subjective determination about
how effectively the desired information appears to be conveyed. Similarly, it might seem that a
side-by-side visual comparison of images generated by each of two alternative data display
methods would be sufficient to answer the question of which of these methods it would be
preferable to use for a particular application. Designers of visualization techniques make these
kinds of subjective decisions all the time while developing new methods for conveying
information through images; our "best judgement" is often the major factor determining which
avenues of investigation are pursued as promising and which are quickly dropped. But, what if
two people looking at the same pictures disagree about their potential usefulness? How can one
determine which, if either, of these two subjective opinions is the "correct" one? Furthermore, to
what degree does a popular vote of confidence in a display method guarantee its utility? Even if
everyone who sees a set of pictures likes them, how do you reliably estimate the extent to which
the use of these "better" images will enable improved task performance?
18
Althoughstudiessuch as the one by Nielsen and Levy [39] indicate a general positive
correlation between subjective preferences for a system and objective performance measures, this
association is by no means guaranteed. Nielsen and Levy cite enough counter-examples to raise
serious concerns about the validity of making presumptions about the extent of any potential
performance benefits based on the results of preference studies, no matter how objective or well-
controlled they are. Not only has it been shown in some cases that a technique which appears, for
many theoretically well-founded and subjectively evident reasons, to better represent some
particular data can repeatedly fail in practice to enable improved performance [28], but the
reverse can also be true [27].
Controlled observer experiments can provide a quantitative measure of the practical
utility of a visualization paradigm. Carefully designed, they can be used to determine more
reliably not only which of two alternative display methods might offer greater practical benefits,
but also to estimate quantitatively the relative amount of improvement in performance that might
be expected from the better method. However, observer experiments are time-consuming to
prepare and execute, and it can be difficult (and potentially costly) to recruit suitably skilled and
motivated subjects. Clearly they aren't warranted in all situations.
9.2 Our experimental objectives
The observer study that we conducted was designed to help answer two fundamental
questions:
1) does adding artistically-inspired sparse opaque texture to a layered transparent
surface really improve the perceptibility of its shape and depth distance from underlying
objects, or can this information be as easily and accurately perceived in images in which
the transparent surfaces lack this artificial enhancement?
2) does a principal direction texture convey shape and depth information any
more accurately or efficiently than simpler existing methods for adding opacity to
selected regions of a transparent surface?
9.3 The experimental design
In order that the results of the experiment be as directly relevant as possible to the needs
of our driving application, we made two crucial initial design choices: to conduct the experiment
entirely with data obtained from actual clinical studies, and to choose a task that was directly
implicated in actual treatment plan evaluation. The key objective in radiation therapy treatment
planning is to define a distribution of radiation dose that is high enough in the target area to
destroy cancerous cells but low enough elsewhere to minimize damage to uninvolved tissues.
The main purpose of graphically displaying radiotherapy planning data is to allow the oncologist
19
toobtaina clearer intuitive understanding of the three-dimensional distribution of the dose over
the patient anatomy so that he can more easily and effectively weigh the many complex trade-offs
that are involved in determining the suitability of a particular treatment plan. The experimental
task that we defined was therefore designed to reveal the accuracy with which observers could
make judgements that reflected an integrated understanding of the shapes and positions of both an
outer transparent surface and an inner opaque object under different texturing conditions.
9.3.1 The experimental task
As the basic experimental task, observers were shown a sequence of images of external
transparent isodose surfaces, completely enclosing an opaque inner treatment regions, and were
asked in each case to specify the point on the outer surface where they felt that it most closely
approached the inner. Because of the nature of the test data, in which dose and anatomy surfaces
came from treatment plans for actual patients, it was neither realistic to assume the existence of a
unique closest point nor practical to construct such examples. We therefore advised subjects that
they would be permitted to indicate up to a maximum of three separate points if they felt that the
outer and inner surfaces came "equally close" in more than one region.
9.3.2 The experimental setup
Test images were displayed in stereo on a Silicon Graphics Indy with a 70Hz, 1278x1022
resolution, 24-bit color monitor and viewed through a set of Crystal Eyes field-sequential stereo
glasses, which effectively halved the vertical resolution to 511. The test images were rendered
using a perspective projection, and the stereo and perspective calculations were calibrated for a
single pre-defined viewing position 24" from the screen, to which observers were constrained by
means of a head rest. We assumed a fixed inter-ocular distance of 64mm for all subjects. For
logistical reasons, the experiments had to be conducted on a workstation in a public graphics
laboratory that was used by a fairly large number of students on a consistent basis. Temporary
curtains were hung to isolate the immediate area surrounding the workstation for the duration of
the experiments, and subjects were required to wear earmuffs to minimize any potentially
distracting effects from ambient noise. Extraneous illumination was kept as low as reasonably
possible under the circumstances, and light levels were measured both at the screen and at the
viewing position prior to each experimental run to ensure their consistency between observers.
Five highly motivated test subjects agreed to participate in the experiment as a favor to the first
author. Three were professional graphic designers, two of whom used computers regularly in
their work, and the others were skilled professionals employed in fields unrelated to computer
graphics or visualization. Each of the observers was prescreened for stereo ability and adequate
visual acuity. Four of the five subjects had a corrected visual acuity of 20/20; subject TCG had
20
uncorrectedvisualacuityof 20/50. A writtensetof instructions explained each step of the
experimental task, and subjects were generally aware that the objective of the experiment was to
measure the effect of surface texture on the perceptibility of shape and depth information.
9.3.3 Task specifics
Each of the trial datasets was pre-rendered at nine successive 2-degree rotational
increments, spanning a total of 16 degrees, and observers had the option of either viewing the
data as an automatically rocking "cine" sequence or selecting individual frames of the rotation to
view statically. In "static" viewing mode, observers were provided with a virtual slider that they
could use to interactively control the rotational position of the object; in "rocking" mode,
observers could control the speed of the apparent motion by clicking in the viewing window to
increase or decrease the time delay between the display of successive frames. Data were always
presented in rocking mode at the beginning of each trial, so that we could be sure that observers
were exposed to the full range of available shape information in every instance.
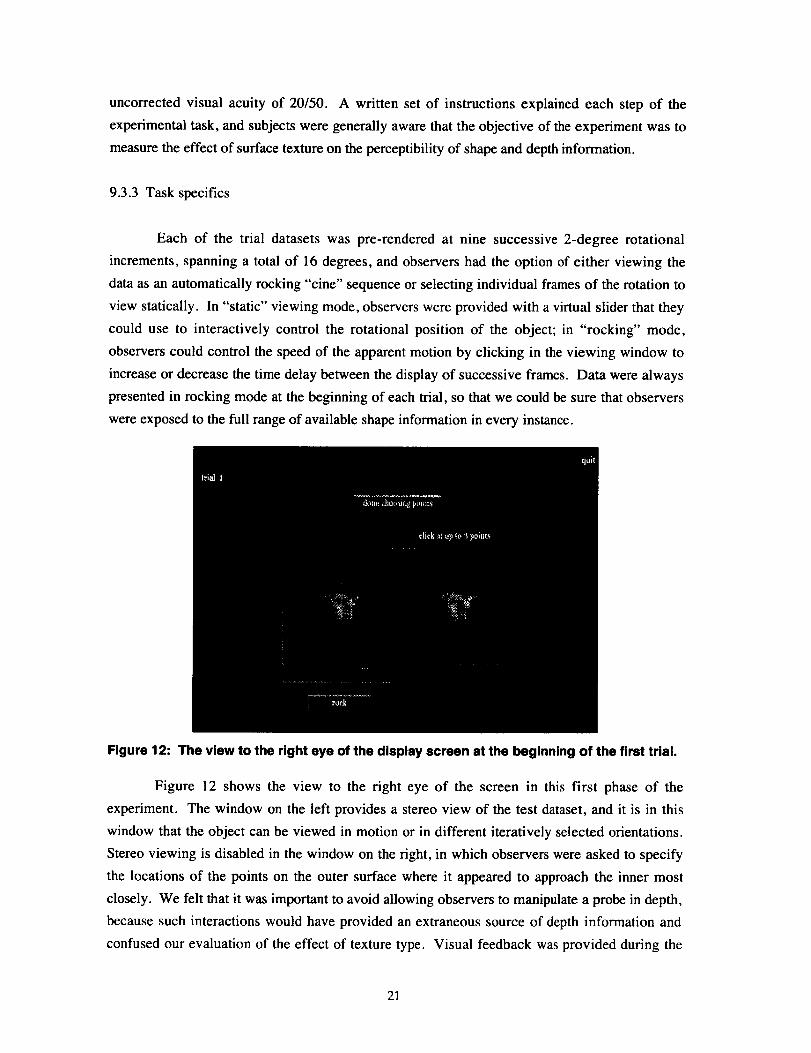
Figure 12: The view to the right eye of the display screen at the beginning of the first trial.
Figure 12 shows the view to the right eye of the screen in this first phase of the
experiment. The window on the left provides a stereo view of the test dataset, and it is in this
window that the object can be viewed in motion or in different iteratively selected orientations.
Stereo viewing is disabled in the window on the right, in which observers were asked to specify
the locations of the points on the outer surface where it appeared to approach the inner most
closely. We felt that it was important to avoid allowing observers to manipulate a probe in depth,
because such interactions would have provided an extraneous source of depth information and
confused our evaluation of the effect of texture type. Visual feedback was provided during the
21
pointspecification phase via a 3x3 square of black pixels surrounded by a 1-pixel wide perimeter
of white that permitted good visibility over a wide variety of potential background intensities.
Observers were advised to be as exact as possible in making their selection, and were allowed to
deselect any previously-chosen point by simply clicking on it.
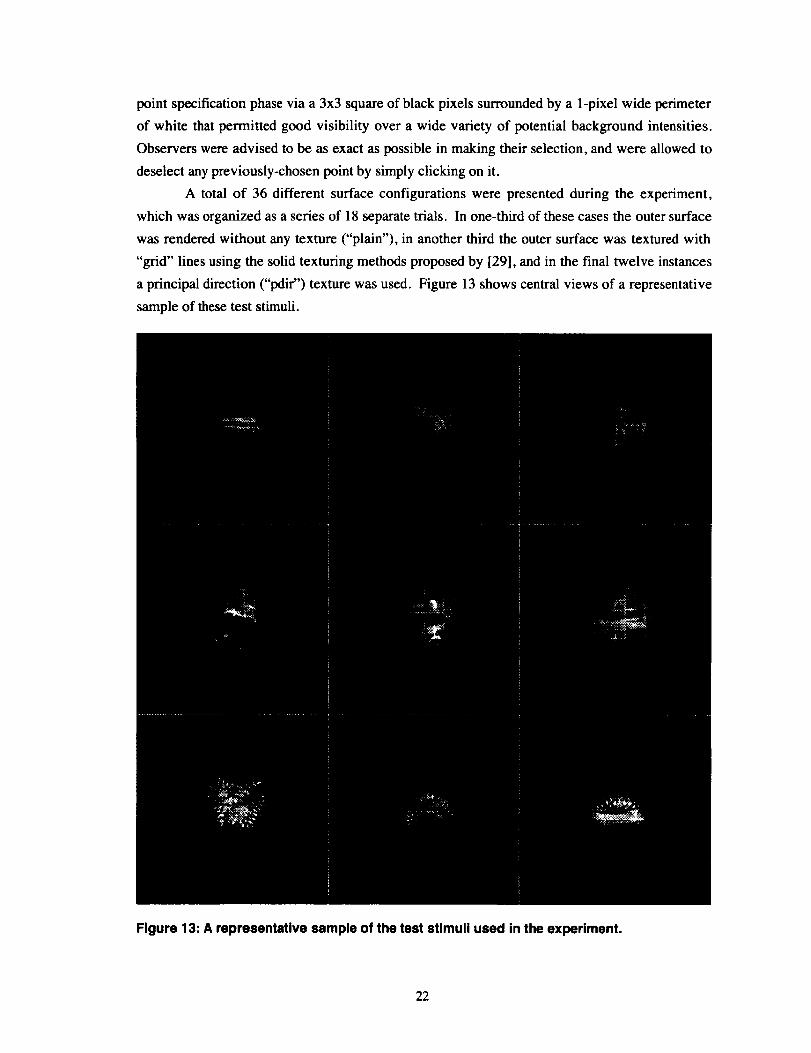
A total of 36 different surface configurations were presented during the experiment,
which was organized as a series of 18 separate trials. In one-third of these cases the outer surface
was rendered without any texture ("plain"), in another third the outer surface was textured with
"grid" lines using the solid texturing methods proposed by [29], and in the final twelve instances
a principal direction ("pdir') texture was used. Figure 13 shows central views of a representative
sample of these test stimuli.
Figure 13: A representative sample of the test stimuli used in the experiment.
22
A single volume texture was used to define the grid lines on all of the surfaces rendered
in this particular style, and a consistent uniform spacing was used for the pdir texture in each of
the cases where it was applied. We took great care to select these grid spacing and texture
element distribution parameters so that surface coverage would be as nearly equivalent as
possible in each of the images in which opaque texture was used.
The presentation order of the images was randomly determined and independently
defined for each subject. The experiment was self-paced, and observers were allowed to spend as
much or as little time on any portion of it as they felt necessary. Two rest breaks were strictly
enforced, after the 6th and 12th trials. The number of the current trial was displayed in the upper
left-hand comer of the screen at all times, so that subjects could pace themselves and know when
to take a break.
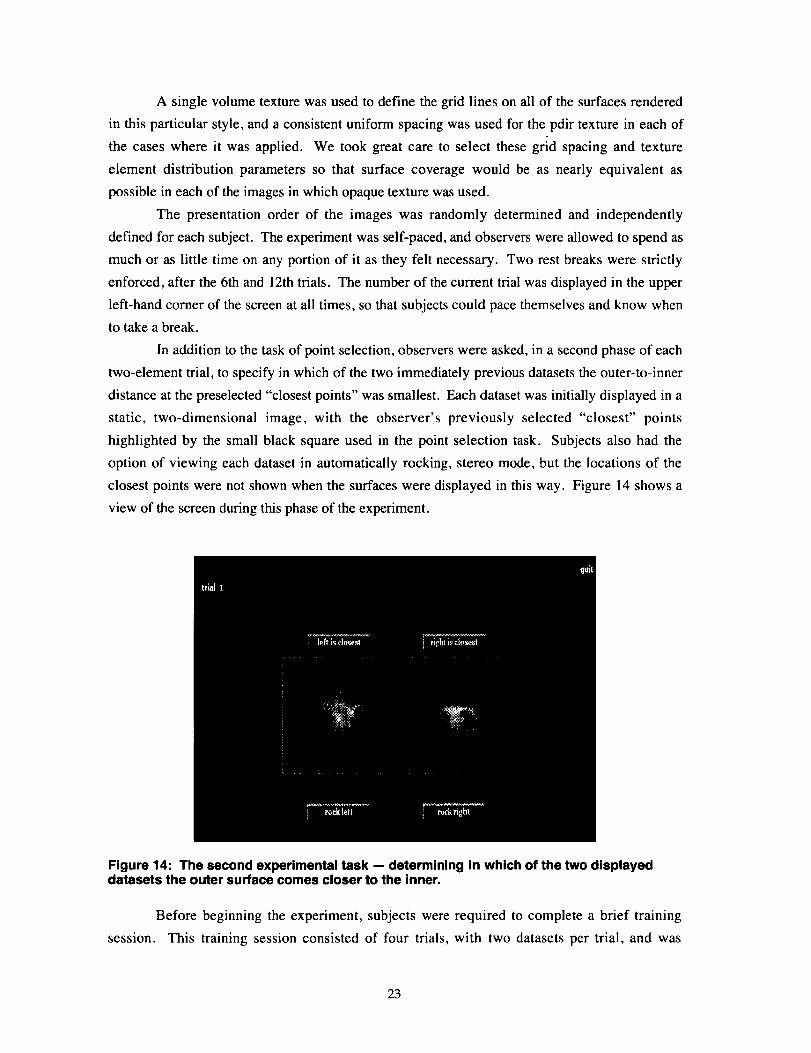
In addition to the task of point selection, observers were asked, in a second phase of each
two-element trial, to specify in which of the two immediately previous datasets the outer-to-inner
distance at the preselected "closest points" was smallest. Each dataset was initially displayed in a
static, two-dimensional image, with the observer's previously selected "closest" points
highlighted by the small black square used in the point selection task. Subjects also had the
option of viewing each dataset in automatically rocking, stereo mode, but the locations of the
closest points were not shown when the surfaces were displayed in this way. Figure 14 shows a
view of the screen during this phase of the experiment.
Figure 14: The second experimental task -- determining in which of the two displayeddatasets the outer surface comes closer to the inner.
Before beginning the experiment, subjects were required to complete a brief training
session. This training session consisted of four trials, with two datasets per trial, and was
23
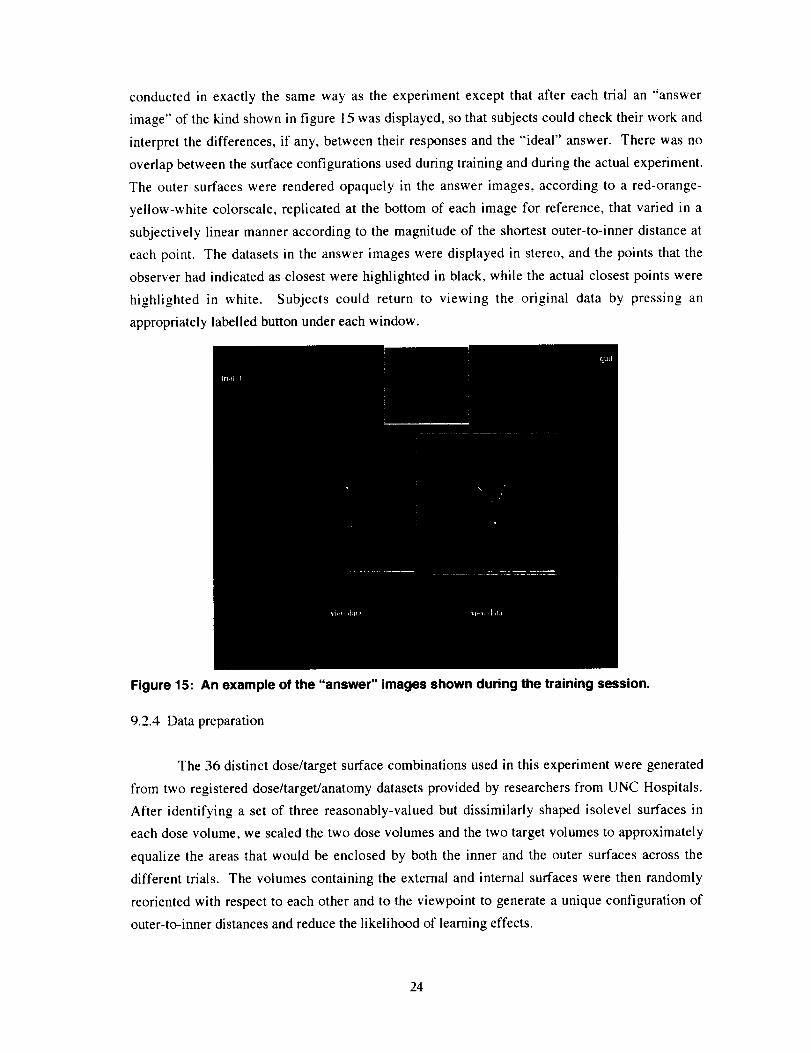
conductedin exactlythesamewayastheexperimentexceptthataftereachtrial an "answerimage"of thekindshownin figure15wasdisplayed,sothatsubjectscouldchecktheirworkandinterpretthedifferences,if any,betweentheirresponsesandthe"ideal"answer.Therewasnooverlapbetweenthesurfaceconfigurationsusedduringtrainingandduringtheactualexperiment.Theoutersurfaceswererenderedopaquelyin theanswerimages,accordingto a red-orange-yellow-whitecolorscale,replicatedat thebottomof eachimagefor reference,thatvariedin asubjectivelylinearmanneraccordingto themagnitudeof theshortestouter-to-innerdistanceateachpoint. Thedatasetsin theanswerimagesweredisplayedin stereo,andthepointsthattheobserverhadindicatedasclosestwerehighlightedinblack,whiletheactualclosestpointswere
highlightedin white. Subjectscould returnto viewing the original databy pressinganappropriatelylabelledbuttonundereachwindow.
Figure 15: An example of the "answer" images shown during the training session.
9.2.4 Data preparation
The 36 distinct dose/target surface combinations used in this experiment were generated
from two registered dose/target/anatomy datasets provided by researchers from UNC Hospitals.
After identifying a set of three reasonably-valued but dissimilarly-shaped isolevel surfaces in
each dose volume, we scaled the two dose volumes and the two target volumes to approximately
equalize the areas that would be enclosed by both the inner and the outer surfaces across the
different trials. The volumes containing the external and internal surfaces were then randomly
reoriented with respect to each other and to the viewpoint to generate a unique configuration of
outer-to-inner distances and reduce the likelihood of learning effects.
24
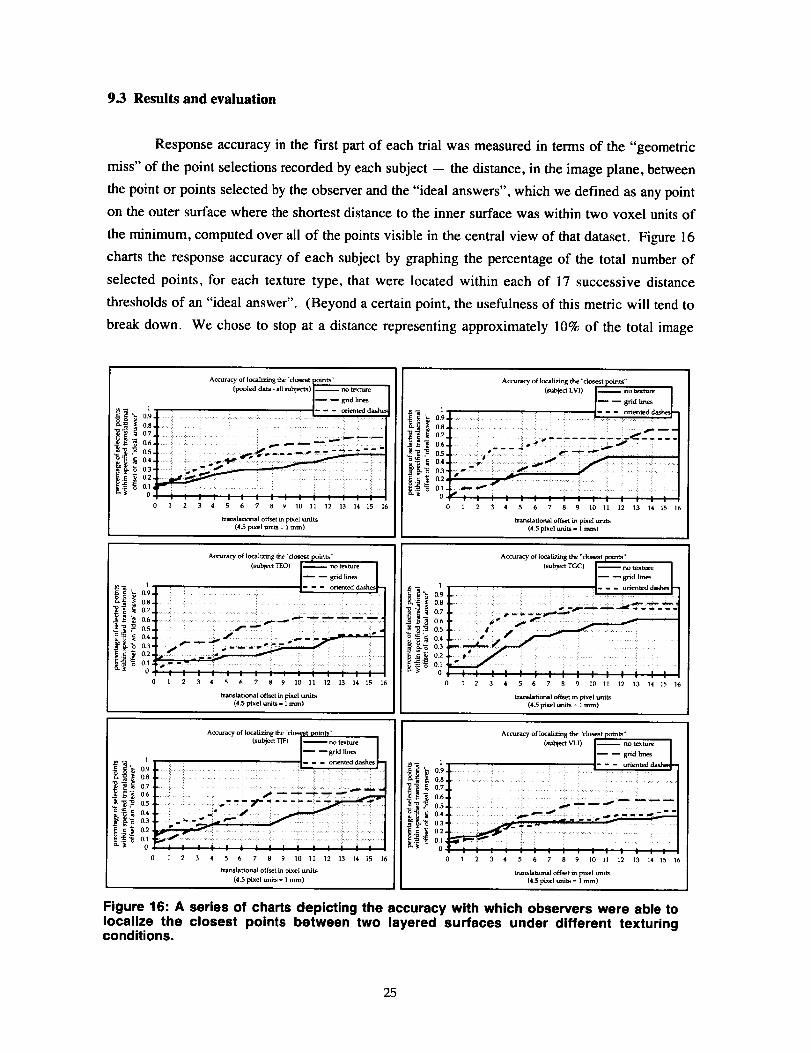
9.3 Results and evaluation
Response accuracy in the first part of each trial was measured in terms of the "geometric
miss" of the point selections recorded by each subject -- the distance, in the image plane, between
the point or points selected by the observer and the "ideal answers", which we defined as any point
on the outer surface where the shortest distance to the inner surface was within two voxel units of
the minimum, computed over all of the points visible in the central view of that dataset. Figure 16
charts the response accuracy of each subject by graphing the percentage of the total number of
selected points, for each texture type, that were located within each of 17 successive distance
thresholds of an "ideal answer". (Beyond a certain point, the usefulness of this metric will tend to
break down. We chose to stop at a distance representing approximately 10% of the total image
Accuracy of Iocalhlfing the '_clo_st
(pooled data - alt subjects)
_ grid lines
0 1 2 3 4
Accuracy of localizing the "closest
(sub_ct LVI)
5 6 7 8 9 10 11 12 13 14 15 16
translatim,.al offset in ptaeI units
(4.5 pixel traits = 1 ram)
Accuracy of Iocalir2ng the "dosest ]xfints"
(sub_ct TEO) I_ no texture
4 -- grid lines
............
_ _
01234 5 6 7 8 9 10 11 12 13 14 15 16
translational offset in pixel units(4.5 pixel units = 1 ram)
Accuracy of Iota lizin
(sub_eaT_)
0 I 2 3 4 5 6 7 8 9 10 11 12 13 14 15 16
translational offset in pixel units
(4.5 pixel units = I ram)
Accuracy of localizing the "closest
(subject TGC)
0 1 2 3 4 5 6 7 8 9 10 I1 12 13 14 15 16
tranalationa! offset in ptxeI units
(4.5 pixel tmlts = I ram)
Accuracy of locali_ang the "closest _nnts"
_= ...... .......... _-m_'
_ ............ _ .- .... --
0 1 2 3 4 5 6 7 8 9 10 ll 12 13 14 15 16
trans Iaiaoc_a[ offset in pixel trails
(4.5 pixel units = 1 ram)
Figure 16: A series of charts depicting the accuracy with which observers were able tolocalize the closest points between two layered surfaces under different texturingconditions.
25
diameter.) While there are a number of subtle difference between the individual curves, one
trend is fairly clear: across all subjects and at nearly all of the offset thresholds beyond 0.5mm,
point localization was consistently less accurate in the case of the untextured surface than in
either of the cases where opaque surface texturing was applied. The data does not, however,
support any assertions about the relative benefits of using one texture type over another: no
consistent trends differentiate the point localization accuracy in these cases of the principal
direction vs. solid grid textures. The remainder of the experimental results are not particularly
illuminating and will not be discussed further here; a detailed summary of the complete results is
available in [22].
There are several possible explanations for the lack of any demonstrable differences in
observer performance in the cases of principal direction and solid grid texturing, despite the very
obvious visual differences in the appearances of the two methods. One possibility is that the two
textures convey surface shape equally effectively; the other possibility is that between-method
differences in the ease of surface shape perception were not well captured by the metrics that we
used in this experiment. Several of the subjects indicated after the experiment that while the
texture of oriented dashes seemed to provide a more immediate and intuitive impression of
surface shape, they felt able, after some additional effort, to deduce an equivalently accurate
understanding of surface shape from the grid line images. It would be interesting to test the
effeciency as well as the accuracy of surface shape and depth perception, perhaps by repeating
this experiment with a new set of observers and comparing the time they spend on the point
localization task under each of the texturing conditions.
I0 Conclusions
Transparency can be a useful device, in scientific visualization, for simultaneously
depicting multiple layers of information. In computer-generated images, as in real life, however,
transparent surfaces can be difficult to clearly see and also see through at the same time. By
adding opaque texture elements to a layered transparent surface we may enable its three-
dimensional shape and relative depth to be more easily and accurately perceived, and a texture
pattern that explicitly conveys perceptually relevant characteristics of surface shape may be
especially effective.
Line orientation has long been regarded by artists and illustrators as being of significant
importance in conveying the shape of objects in two-dimensional drawings, and lines that "follow
the form" are believed to portray an object's shape particularly well. We have suggested a
method for texturing transparent surfaces with a set of uniformly distributed opaque short strokes,
locally oriented in the direction of greatest normal curvature and of length proportional to the
26
magnitude of the curvature in the stroke direction, and have provided an opportunity for empirical
comparisons between this surface texturing approach and alternative existing methods.
To quantitatively evaluate the practical merits of this visualization approach, we proposed
a novel experimental paradigm for objectively measuring the accuracy with which observers can
make integrated judgements about the shapes of two layered surfaces and the depth distance
between them. Through a controlled experiment with five subjects, we found evidence that shape
of an external transparent surface and its relative depth distance from an underlying opaque object
could be more accurately perceived when the surface was rendered with a sparse, opaque texture
than when it was left plain. We did not find consistent evidence of any differences in the
accuracy of these judgements as a function of texture type. Task performance efficiency was not
considered in this experiment.
Acknowledgments
The work described in this paper was supported by NIH grant # PO1 CA47982, and was
performed as a part of the dissertation research of the first author, who received valuable advice
in this effort from Frederick Brooks, Christina Burbeck, Julian Rosenman and Mary C. Whitton.
Marc Levoy provided the volume rendering platform within which we implemented the
isosurface extraction and surface texturing functions, and Jim Chung provided the
implementation of the marching cubes algorithm that we adapted for the surface triangulation.
The radiation therapy data was provided by Dr. Julian Rosenman, UNC Hospitals. The writing of
this paper was supported by the National Aeronautics and Space Administration under NASA
contract number NAS 1-19480 while the first author was in residence at ICASE.
References
[ 1] Bauer-Kirpes, Bernhard, Wolfgang Schlegel, Robert Boesecke and Waiter J. Lorenz. "Display ofOrgans and Isodoses as Shaded 3-D Objects for 3-D Therapy Planning", International Journal of
Radiation Oncology, Biology, Physics, vol. 13, pp. 135-140, 1987.
[2] Blake, Andrew, Heinrich H. Biilthoff and David Sheinberg. "Shape from Texture: Ideal Observers
and Human Psychophysics", Vision Research, vol. 33, no. 12, pp. 1723-1737, 1993.
[3] Beck, Jacob and Richard Ivry. "On the Role of Figural Organization in Perceptual Transparency",Perception and Psychophysics, vol. 44, no. 6, pp. 585-594, 1988.
[4] Blake, Andrew and Heinrich BiJlthoff. "Shape from Specularities: computation and psychophysics",
Philosophical Transactions of the Royal Society of London, B, vol. 331, pp. 237-252, 1991.
[5] Brady, Michael, Jean Ponce, Alan Yuille and Haruo Asada. "Describing Surfaces", Proceedings of
the Second International Symposium on Robotics Research, H. Hanafusa and H. Inoue, eds., pp. 5-16,1985.
[6] Bruno, Nicola and James E. Cutting. "Minimodularity and the Perception of Layout", Journal ofExperimental Psychology: General, voi. 117, no. 2, pp. 161-170, 1988.
27
[7] Cavanagh, Patrick and Yvan G. Leclerc. "Shape from Shadows", Journal of Experimental
Psychology: Human Perception and Performance, vol. 15, no. 1, pp. 3-27, 1989.
[8] Connolly, Michael L. "Solvent-Accessible Surfaces of Proteins and Nucleic Acids", Science, vol.
221, no. 4612, pp. 709-713,1983.
[9] Cumming, Bruce G., Elizabeth B. Johnston and Andrew J. Parker. "Effects of Different Texture Cues
on Curved Surfaces Viewed Stereoscopically", Vision Research, vol. 33, no. 5/6, pp. 827-838, 1993.
[10] Cutting, James E. and Robert T. Millard. "Three Gradients and the Perception of Flat and Curved
Surfaces", Journal of Experimental Psychology: General, vol. 113, no. 2, pp. 198-216, 1984.
[11 ] Dooley, Debra and Michael F. Cohen. "Automatic Illustration of 3D Geometric Models: Surfaces",
Visualization '90, pp. 307-313.
[ 12] Flock, Howard R. and Anthony Moscatelli. "Variables of Surface Texture and Accuracy of Space
Perceptions", Perceptual and Motor Skills, vol. 19, pp. 327-334, 1964.
[13] Frobin, W. and E. Hierholzer. "Analysis of Human Back Shape Using Surface Curvatures", Journal
ofBiomechanics, vol. 15, no. 5, pp. 379-390, 1982.
[ 14] Fukuda, Mami and Sergio Masin. "Test of Balanced Transparency", Perception, vol. 23, no. 1, pp.37-43, 1994.
[ 15] Gibson, James J. "The Perception of Visual Surfaces", American Journal of Psychology, vol. 63, pp.367-384, 1950.
[16] Glassner, Andrew. An Introduction to Ray Tracing, Academic Press, 1989.
[17] Guid, Nikola, Crtomir Oblonsek and Borut Zalik. "Surface Interrogation Methods" Computers &
Graphics, vol. 19, no. 4, pp. 557-574, 1995.
[18] Guptill, Arthur. Rendering in Pen _,nglInk, Watson-Guptill Publications, 1976.
[ 19] Hagen, H., Stefanie Hahmann, Thomas Schreibner, Yasuo Nakajima, Bukard W6rdenweber and Petra
Hollemann-Grundestedt. "Surface Interrogation Algorithms", IEEE Computer Graphics and
Applications, vol. 12, no. 5, pp. 53-60, September 1992.
[20] Hilbert, David and S. Cohn-Vossen. Geometry_ and the Imagination, translated by P. Nemenyi,
Chelsea Pub. Co., 1952.
[21 ] Hodges, Elaine R. S. The Guild Handbook of Scientific Illustration, Van Nostrand Reinhold, 1989.
[22] Interrante, Victoria. Illustrating Transparency: communicating the 3D shape of layered _ransparent
surfaces via texture, Ph.D. thesis, University of North Carolina at Chapel Hill, 1996.
[23] Interrante, Victoria, Henry Fuchs and Stephen Pizer. "Enhancing Transparent Skin Surfaces with
Ridge and Valley Lines", Visualization '95, pp. 52-59.
[24] Koenderink, Jan J. and Andrea J. van Doom. "Photometric Invariants Related to Solid Shape",
Optica Acta, vol. 27, no. 7, pp. 981-996, 1980.
[25] Koenderink, Jan. Solid Shape, MIT Press, 1990.
[26] Koenderink, Jan and Andrea J. van Doom. "Relief: pictorial and otherwise", Image and Vision
Computing, vol. 13, no. 5, pp. 321-334, June 1995.
[27] Kundel, Harold L. "Perception and Representation of Medical Images", SPIE, vol. 1898, Image
Processing, pp. 2-12, 1993.
[28] Lekowitz, Haim and Gabor T. Herman. "Color Scales for Image Data", IEEE Computer Graphicsand Applications, vol. 12, no. 1, pp. 72-80, January 1992.
28
[29] Levoy,Marc,HenryFuchs,StephenPizer,JulianRosenman,EdwardL. Chaney,GeorgeW.Sherouse,VictoriaInterranteandJeffreyKiel. "VolumeRenderinginRadiationTreatmentPlanning",First Conference on Visualization in Biomedical Computing, pp. 4-10, 1990.
[30] Levoy, Marc. "Display of Surfaces from Volume Data", IEEE Computer Graphics and Applications,vol. 8, no. 3, pp. 29-37, May 1988.
[31 ] Livingstone, Margaret S. and David H. Hubel. "Psychophysical Evidence for Separate Channels for
the Perception of Form, Color, Movement and Depth", The Journal ofNeuroscience, vol. 7, no. 11,pp. 3416-3468, 1987.
[32] Loechel, William E. Medical Illustration: a maide for the doctor-author and exhibitor, Charles C.Thomas, 1964.
[33] Lorensen, William and Harvey Cline. "Marching Cubes: A High Resolution 3D Surface
Reconstruction Algorithm", Computer Graphics (proc. SIGGRAPH '87), vol. 21, no. 4, pp. 163-169,1987.
[34] Maekawa, Takahashi and Nicholas M. Patrikalakis. "Interrogation of Differential Geometry
Properties for Design and Manufacture", the Visual Computer, vol. 10, no. 4, pp. 216-237, 1994.
[35] Metelli, Fabio. "The Perception of Transparency", Scientific American, vol. 230, pp. 47-54, 1974.
[36] Monga, Olivier, Serge Benayoun and Olivier D. Faugeras. "From Partial Derivatives of 3D Density
Images to Ridge Lines", Proceedings of the IEEE Computer Society Conference on Computer Visionand Pattern Recognition, pp. 354-359, 1992.
Moreton, Henry P. "Simplified Curve and Surface Interrogation via Mathematical Packages and
Graphics Libraries and Hardware", Computer-Aided Design, vol. 27, no. 7, pp. 523-543, 1995.
Nakayama, Ken, Shinsuke Shimojo and Vilayanur S. Ramachandran. "Transparency: relation to
depth, subjective contours, luminance and neon color spreading", Perception, vol. 19, pp. 497-513,1990.
Nielsen, Jacob and Jonathan Levy. "Measuring Usability: Preference vs. Performance",
Communications of the ACM, vol. 37, no. 4, pp. 66-75, April 1994.
Peachey, Darwyn R. "Solid Texturing of Complex Surfaces", Computer Graphics (proc. SIGGRAPH'85), vol. 19, no. 3, pp. 279-286, 1985.
Photon Treatment Planning Collaborative Working Group. "Three-Dimensional Display in PlanningRadiation Therapy: A Clinical Perspective", Int. J. Radiat. Oncology, Biol. Phys., vol. 21, pp. 79-89,1991.
Pitz, Henry C. Ink Drawing Techniques, Watson-Guptili Publications, 1957.
Rheingans, Penny. "Opacity-modulating Triangular Textures for Irregular Surfaces", proc.Visualization '96, pp. 219-225.
Richards, Whitman, Jan Koenderink and Donald Hoffman. "Inferring Three-Dimensional Shapes
from Two-Dimensional Silhouettes", Journal of the Optical Society of America, A, Optics andImaging Science, vol. 4, pp. 1168-1175, July 1987.
Saito, Takafumi. "Real-time Previewing for Volume Visualization", 1994 Symposium on VolumeVisualization, pp. 99-106.
Saito, Takafumi and Tokiichiro Takahashi. "Comprehensible Rendering of 3-D Shapes", ComputerGraphics (proc. SIGGRAPH '90), vol. 24, no. 4, pp. 197-206.
Salisbury, Michael P., Sean E. Anderson, Ronen Barzel and David H. Salesin. "Interactive Pen-and-
Ink Illustration", Computer Graphics (proc. SIGGRAPH '94), pp. 101-108.
[37]
[381
[391
[401
[41]
[421
[43]
[44]
[45]
[461
[47]
29
[48]Salisbury,MichaelP.,CorinAnderson,DaniLischinskiandDavidH.Salesin."Scale-DependentReproductionofPen-and-Ink Illustrations", Computer Graphics (proc. SIGGRAPH '96), pp. 461-468.
[49] Sander, Peter T. and Stcven W. Zucker. "Tracing Surfaces for Surfacing Traces", Proceedings of the
First International Conference on Computer Vision, pp. 241-249, 1987.
[50] Schweitzer, Dino. "Artificial Texturing: An Aid to Surface Visualization", Computer Graphics
(proc. SIGGRAPH '83), vol. 17, no. 3, pp. 23-30.
[51 ] Stevens, Kent A. "The Visual Interpretation of Surface Contours", Artificial Intelligence, vol. 17, pp.47-73, 1981.
[52] Stevens, Kent A. and Allen Brookes. "Probing Depth in Monocular Images", Biological Cybernetics,
vol. 56, pp. 355-366, 1987.
[53] Sullivan, Edmund J. kiR_l)._$I_, Chapman & Hall, 1922.
[54] Todd, James T. and Ennio Mingolla. "Perception of Surface Curvature and Direction of Illumination
from Patterns of Shading", Journal of Experimental Psychology: Human Perception and
Performance, vol. 9, no. 4, pp. 583-595, ! 983.
[55] Todd, James T. and Robin A. Akerstrom. "Perception of Three-Dimensional Form from Patterns of
Optical Texture", Journal of Experimental Psychology: Human Perception and Performance, vol. 13,
no. 2, pp. 242-255, 1987.
[56] Todd, James T. and Francene D. Reichel. "Ordinal Structure in the Visual Perception and Cognition
of Smoothly Curved Surfaces", Psychological Review, vol. 96, no. 4, pp. 643-657, 1989.
[57] Todd, James T. and Francene D. Reichel. "Visual Perception of Smoothly Curved Surfaces from
Double-Projected Contour Patterns", Journal of Experimental Psychology: Human Perception and
Performance, vol. 16, no. 3, pp. 665-674, 1990.
[58] Winkenbach, Georges and David H. Salesin. "Computer-Generated Pen-and-Ink Illustration",
Computer Graphics (proc. SIGGRAPH '94), pp. 91-100.
[59] Winkenbach, Georges and David H. Salesin. "Rendering Parametric Surfaces in Pen and Ink",
Computer Graphics (proc. SIGGRAPH '96), pp. 469-476.
[60] Young, Mark J., Michael S. Landy and Laurence T. Maloney. "A Perturbation Analysis of Depth
Perception from Combinations of Texture and Motion Cues", Vision Research, vol. 33, no. 18, pp.
2685-2696, 1993.
[61] Zisserman, Andrew, Peter Giblin and Andrew Blake. "The Information Available to a Moving
Observer from Specularities", Image and Vision Computing, vol. 7, no. 1, pp. 38-42, 1989.
30

!1
i
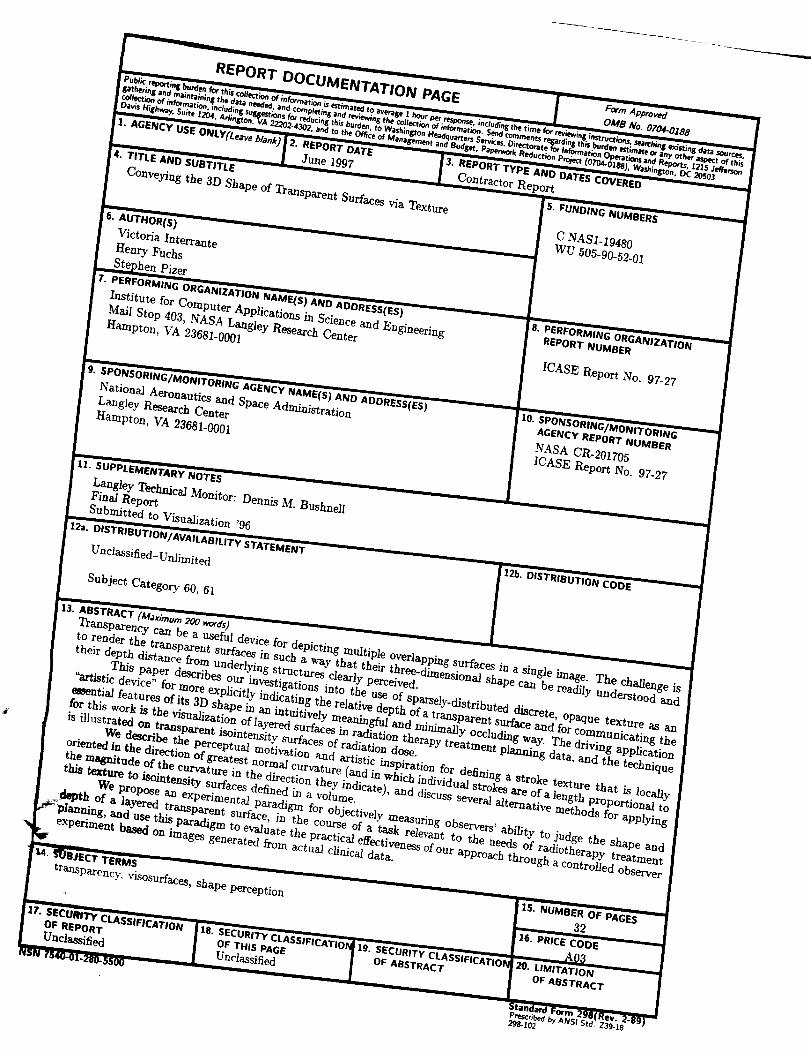
4
.,q
ii I
REPORT DOCUMENTATION PAGE Form Ap_oved.... OMB NO.0704-0188
COl,._ion of ;_z.___.:__ _2" ......... : . -v x *,no ._mmg Lne .o_Ject_n oT _mormat_On. _a o_.nments reliard_n_ tht$ _ _mNe _ afly _h_ _t _ this
° .--a, . rf he, ........... -_.._., .,._ ,u _.e _mce _ .nan_$emen_ ano _uoge_ _'aperm_r_ r;eauct_on e'roject (0104-018B) Wlshin_on DC 20503iii i o.
1. AGENCY USE ONLY(Leave blank) 2. REPORT DATE 3. REPORT TYPE AND DATES COVERED
June 1997 Contractor Reportiiii i
4. ¥iTLE AND SUBTITLE
Conveying the 3D Shape of Transparent Surfaces via Texture
6. AUTHOR(S)Victoria Interrante
Henry Fuchs
Stephen,Pizer
_. PERFORMING ORGANIZATION NAME(S) AND ADD'RESS(ES)
Institute for Computer Applications in Science and Engineering
Mail Stop 403, NASA Langley Research Center
Hampton, VA 23681-0001
9. SPONSORING/MONITORING AGEhlCY'NAME(S) AND ADDRESS(ES)
National Aeronautics and Space Administration
Langley Research Center
Hampton, VA 23681-0001
SUPPLEMENTARY ....1i. NOTES
Langley Technical Monitor: Dennis M. BushnellFinal ReportSubmitted to Visualization '96
ii
12a. DISTRIBUTION/AVAILABILITY STATEMENT
5. FUNDING NUMBERS
C NASI-19480
WU 505-90-52-01
8. PERFORMING ORGANIZATION
REPORT NUMBER
ICASE Report No. 97-27
10. SPONSORING/MONITORINGAGENCY REPORT NUMBER
NASA CR-201705
ICASE Report No. 97-27
" "12b. DISTRIBUTION CODE
Unclassified-Unlimited
Subject Category 60, 61
i ,i ii
131 ABSTRACT (Maximum200 words)
Transparency can be a useful device for depicting multiple overlapping surfaces in a single image. The challenge isto render the transparent surfaces in such a way that their three-dimensional shape can be readily understood andtheir depth distance from underlying structures clearly perceived.
This paper describes our investigations into the use of sparsely-distributed discrete, opaque texture as an"artistic device" for more explicitly indicating the relative depth of a transparent surface and for communicating the
_sential features of its 3D shape in an intuitively meaningful and minimally occluding way. The driving application
for this work is the visualization of layered surfaces in radiation therapy treatment planning data, and the technique
is illustrated on transparent isointensity surfaces of radiation dose.
We describe the perceptual motivation and artistic inspiration for defining a stroke texture that is locally
oriented in the direction of greatest normal curvature (and in which individual strokes are of a length proportional tothe magnitude of the curvature in the direction they indicate), and discuss several alternative methods for applying
this texture to isointensity surfaces defined in a volume.
We propose an experimental paradigm for objectively measuring observers' ability to judge the shape and
._k_pth of a layered transparent surface, in the course of a task relevant to the needs of radiotherapy treatment_' :planning, and use this paradigm to evaluate the practical effectiveness of our approach through a controlled observer
experiment based on images generated from actual clinical data.
ii ii i i ii i i
_',4, _I_JECT TERMS
transparency, visosurfaces, shape perception
iii
17. SECURITY CLASSIFICATIONOF REPORTUnclassified
sk z_oi-2_o.ssoo
lB. SECURITY CLASSIFICATION 19. SECURITY CLASSIFICATIONOF THIS PAGE OF ABSTRACTUnclassified
15. NUMBER OF PAGES
3216. PRICE CODE
Ag_ ,,20. LIMITATION
OF ABSTRACT
i
StandardForm 298(Rev. 249)Prescribed by ANSI Std, Z39-18298-102