Embed Size (px)
Citation preview

XX
X XX
XXXX
201
4
CONVERGENCE REPORTJUNE 2014
EN
In 2014 all ECB publications
feature a motif taken from
the €20 banknote.
CONVERGENCE REPORTJUNE 2014

© European Central Bank, 2014
Address Kaiserstrasse 29 60311 Frankfurt am MainGermany
Postal address Postfach 16 03 19 60066 Frankfurt am Main Germany
Telephone +49 69 1344 0
Website http://www.ecb.europa.eu
Fax +49 69 1344 6000
All rights reserved. Reproduction for educational and non-commercial purposes is permitted provided that the source is acknowledged.
The cut-off date for the statistics included in this issue was 15 May 2014.
ISSN 1725-9525 (online)ISSN 1725-9525 (epub)ISBN 978-92-899-1324-9 (online)ISBN 978-92-899-1346-1 (epub)EU catalogue number QB-AD-14-001-EN-N (online)EU catalogue number QB-AD-14-001-EN-E (epub)
3ECB
Convergence ReportJune 2014
CONTENTS
1 INTRODUCTION 5
2 FRAMEWORK FOR ANALYSIS 72.1 Economic convergence 72.2 Compatibility of national legislation with the Treaties 18
3 THE STATE OF ECONOMIC CONVERGENCE 37
4 COUNTRY SUMMARIES 514.1 Bulgaria 514.2 Czech Republic 534.3 Croatia 554.4 Lithuania 574.5 Hungary 594.6 Poland 614.7 Romania 634.8 Sweden 65
5 EXAMINATION OF ECONOMIC CONVERGENCE 675.1 Bulgaria 675.2 Czech Republic 855.3 Croatia 1035.4 Lithuania 1215.5 Hungary 1415.6 Poland 1615.7 Romania 1795.8 Sweden 1975.9 Statistical methodology of convergence indicators 213
6 EXAMINATION OF COMPATIBILITY OF NATIONAL LEGISLATION WITH THE TREATIES 2316.1 Bulgaria 2316.2 Czech Republic 2356.3 Croatia 2396.4 Lithuania 2406.5 Hungary 2456.6 Poland 2506.7 Romania 2546.8 Sweden 259
GLOSSARY 265
CONTENTS
4ECBConvergence ReportJune 2014
COUNTRIES
BE BelgiumBG BulgariaCZ Czech RepublicDK DenmarkDE GermanyEE Estonia IE IrelandGR GreeceES SpainFR FranceHR CroatiaIT ItalyCY CyprusLV LatviaLT LithuaniaLU LuxembourgHU HungaryMT MaltaNL NetherlandsAT AustriaPL PolandPT PortugalRO RomaniaSI SloveniaSK SlovakiaFI FinlandSE SwedenUK United KingdomUS United States
ABBREVIATIONSOTHERS
BIS Bank for International SettlementsCPI Consumer Price IndexDG ECFIN Directorate General for Economic and
Financial Affairs, European CommissionECB European Central BankEDP excessive deficit procedureEER effective exchange rateEMI European Monetary InstituteEMU Economic and Monetary UnionERM exchange rate mechanismESA 95 European System of Accounts 1995ESCB European System of Central BanksESRB European Systemic Risk BoardEU European UnionEUR euroGDP gross domestic productHICP Harmonised Index of Consumer Pricesi.i.p. international investment positionILO International Labour OrganizationIMF International Monetary FundMFI monetary financial institutionMIP macroeconomic imbalance procedureNCB national central bankOECD Organisation for Economic Co-operation
and DevelopmentSSM Single Supervisory MechanismTSCG Treaty on Stability, Coordination and
Governance in the Economic and Monetary Union
In accordance with EU practice, the EU Member States are listed in this report using the alphabetical order of the country names in the national languages.
CONVENTIONS USED IN THE TABLES
“-” data do not exist/data are not applicable“.” data are not yet available
5ECB
Convergence ReportJune 2014
1 INTRODUCTION 1 INTRODUCTIONThe euro was introduced on 1 January 1999 in 11 EU Member States. Since then, seven other EU Member States have adopted the single currency, the most recent being Latvia on 1 January 2014. Following Croatia’s accession to the EU on 1 July 2013, there are ten EU countries that do not yet participate fully in EMU, i.e. they have not yet adopted the euro. Two of these, Denmark and the United Kingdom, gave notification that they would not participate in Stage Three of EMU. As a consequence, Convergence Reports only have to be provided for these two countries if they so request. Given the absence of such a request from either country, this report examines eight countries: Bulgaria, the Czech Republic, Croatia, Lithuania, Hungary, Poland, Romania and Sweden. All eight countries are committed under the Treaty on the Functioning of the European Union (hereinafter the “Treaty”)1 to adopt the euro, which implies that they must strive to fulfil all the convergence criteria.
In producing this report, the ECB fulfils its requirement under Article 140 of the Treaty to report to the Council of the European Union (EU Council) at least once every two years or at the request of an EU Member State with a derogation “on the progress made by the Member States with a derogation in fulfilling their obligations regarding the achievement of economic and monetary union”. The eight countries under review in this report have therefore been examined as part of this regular two-year cycle. The same mandate has been given to the European Commission, which has also prepared a report, and both reports are being submitted to the EU Council in parallel.
In this report, the ECB uses the framework applied in its previous Convergence Reports. It examines, for the eight countries concerned, whether a high degree of sustainable economic convergence has been achieved, whether the national legislation is compatible with the Treaties and the Statute of the European System of Central Banks and of the European Central Bank (Statute), and whether the statutory requirements are fulfilled for the relevant NCB to become an integral part of the Eurosystem.
In this report, Lithuania is assessed in more depth than the other countries under review, since the Lithuanian authorities have on various occasions announced their intention to adopt the euro as of 1 January 2015.
The examination of the economic convergence process is highly dependent on the quality and integrity of the underlying statistics. The compilation and reporting of statistics, particularly government finance statistics, must not be subject to political considerations or interference. EU Member States have been invited to consider the quality and integrity of their statistics as a matter of high priority, to ensure that a proper system of checks and balances is in place when these statistics are compiled, and to apply minimum standards in the domain of statistics. These standards are of the utmost importance in reinforcing the independence, integrity and accountability of the national statistical institutes and in supporting confidence in the quality of government finance statistics (see Section 9 of Chapter 5).
Moreover, from 4 November 2014 onwards 2 each country whose derogation is abrogated will join the Single Supervisory Mechanism (SSM) at the latest on the date on which it adopts the euro. From that date, all SSM-related rights and obligations apply to that country. It is, therefore, of utmost importance that it makes the necessary preparations. In this respect, the ECB attaches great importance to the comprehensive assessment of credit institutions, including the balance
1 See also the clarification of the terms “Treaty” and “Treaties” in the Glossary.2 This is the date when the ECB assumes the tasks conferred on it by Council Regulation (EU) No 1024/2013 of 15 October 2013 conferring
specific tasks on the European Central Bank concerning policies relating to the prudential supervision of credit institutions, Article 33(2).
6ECBConvergence ReportJune 2014
sheet assessment that it must carry out before the assumption of its tasks. This is an assessment of the banking system in the Member States participating in the SSM and is carried out by the ECB in cooperation with the national competent authorities of the participating Member States. This assessment, which is not the subject of this report, is to be concluded prior to the assumption by the ECB of its supervisory responsibilities. It includes an asset quality review and a stress test. The objective is to foster transparency, repair balance sheets where needed and enhance confidence in the banking sector. The banking system of any Member State joining the euro area and therefore joining the SSM after the date for the commencement of supervision will be subject to a comprehensive assessment.3
This report is structured as follows. Chapter 2 describes the framework used for the examination of economic and legal convergence. Chapter 3 provides a horizontal overview of the key aspects of economic convergence. Chapter 4 contains the country summaries, which provide the main results of the examination of economic and legal convergence. Chapter 5 examines in more detail the state of economic convergence in each of the eight EU Member States under review and provides an overview of the convergence indicators and the statistical methodology used to compile them. Finally, Chapter 6 examines the compatibility of the national legislation of the Member States under review, including the statutes of their NCBs, with Articles 130 and 131 of the Treaty.
3 See recital 10 of Regulation ECB/2014/17 of the European Central Bank of 16 April 2014 establishing the framework for cooperation within the Single Supervisory Mechanism between the European Central Bank and national competent authorities and with national designated authorities (SSM Framework Regulation).
7ECB
Convergence ReportJune 2014
2 FRAMEWORK FOR
ANALYS IS
2 FRAMEWORK FOR ANALYSIS2.1 ECONOMIC CONVERGENCE
To examine the state of economic convergence in EU Member States seeking to adopt the euro, the ECB makes use of a common framework for analysis. This common framework, which has been applied in a consistent manner throughout all EMI and ECB Convergence Reports, is based, first, on the Treaty provisions and their application by the ECB with regard to developments in prices, fiscal balances and debt ratios, exchange rates and long-term interest rates, as well as in other factors relevant to economic integration and convergence. Second, it is based on a range of additional backward and forward-looking economic indicators which are considered to be useful for examining the sustainability of convergence in greater detail. The examination of the Member State concerned based on all these factors is important to ensure that its integration into the euro area will proceed without major difficulties. Boxes 1 to 5 below briefly recall the legal provisions and provide methodological details on the application of these provisions by the ECB.
This report builds on principles set out in previous reports published by the ECB (and prior to this by the EMI) in order to ensure continuity and equal treatment. In particular, a number of guiding principles are used by the ECB in the application of the convergence criteria. First, the individual criteria are interpreted and applied in a strict manner. The rationale behind this principle is that the main purpose of the criteria is to ensure that only those Member States having economic conditions that are conducive to the maintenance of price stability and the coherence of the euro area can participate in it. Second, the convergence criteria constitute a coherent and integrated package, and they must all be satisfied; the Treaty lists the criteria on an equal footing and does not suggest a hierarchy. Third, the convergence criteria have to be met on the basis of actual data. Fourth, the application of the convergence criteria should be consistent, transparent and simple. Moreover, when considering compliance with the convergence criteria, sustainability is an essential factor as convergence must be achieved on a lasting basis and not just at a given point in time. For this reason, the country examinations elaborate on the sustainability of convergence.
In this respect, economic developments in the countries concerned are reviewed from a backward-looking perspective, covering, in principle, the past ten years. This helps to better determine the extent to which current achievements are the result of genuine structural adjustments, which in turn should lead to a better assessment of the sustainability of economic convergence.
In addition, and to the extent appropriate, a forward-looking perspective is adopted. In this context, particular attention is paid to the fact that the sustainability of favourable economic developments hinges critically on appropriate and lasting policy responses to existing and future challenges. Strong governance and sound institutions are also essential for supporting sustainable output growth over the medium to long term. Overall, it is emphasised that ensuring the sustainability of economic convergence depends on the achievement of a strong starting position, the existence of sound institutions and the pursuit of appropriate policies after the adoption of the euro.
The common framework is applied individually to the eight EU Member States under review. These examinations, which focus on each Member State’s performance, should be considered separately, in line with the provisions of Article 140 of the Treaty.
The cut-off date for the statistics included in this Convergence Report was 15 May 2014. The statistical data used in the application of the convergence criteria were provided by the European Commission (see Section 9 of Chapter 5 as well as the tables and charts), in cooperation with the ECB in the case of exchange rates and long-term interest rates. Convergence data on price and
8ECBConvergence ReportJune 2014
long-term interest rate developments are presented up to April 2014, the latest month for which data on HICPs were available. For monthly data on exchange rates, the period considered in this report ends in April 2014. Historical data for fiscal positions cover the period up to 2013. Account is also taken of forecasts from various sources, together with the most recent convergence programme of the Member State concerned and other information relevant to a forward-looking examination of the sustainability of convergence. The European Commission’s spring 2014 forecast and the Alert Mechanism Report 2014, which are taken into account in this report, were released on 2 May 2014 and 13 November 2013 respectively. This report was adopted by the General Council of the ECB on 2 June 2014.
With regard to price developments, the legal provisions and their application by the ECB are outlined in Box 1.
Box 1
PRICE DEVELOPMENTS
1 Treaty provisions
Article 140(1), first indent, of the Treaty requires the Convergence Report to examine the achievement of a high degree of sustainable convergence by reference to the fulfilment by each Member State of the following criterion:
“the achievement of a high degree of price stability; this will be apparent from a rate of inflation which is close to that of, at most, the three best performing Member States in terms of price stability”.
Article 1 of Protocol (No 13) on the convergence criteria referred to in Article 140 of the Treaty stipulates that:
“The criterion on price stability referred to in the first indent of Article 140(1) of the Treaty on the Functioning of the European Union shall mean that a Member State has a price performance that is sustainable and an average rate of inflation, observed over a period of one year before the examination, that does not exceed by more than 1½ percentage points that of, at most, the three best performing Member States in terms of price stability. Inflation shall be measured by means of the consumer price index on a comparable basis taking into account differences in national definitions”.
2 Application of Treaty provisions
In the context of this report, the ECB applies the Treaty provisions as outlined below.
First, with regard to “an average rate of inflation, observed over a period of one year before the examination”, the inflation rate has been calculated using the change in the latest available 12-month average of the HICP over the previous 12-month average. Hence, with regard to the rate of inflation, the reference period considered in this report is May 2013 to April 2014.

9ECB
Convergence ReportJune 2014
2 FRAMEWORK FOR
ANALYS IS
To allow a more detailed examination of the sustainability of price developments in the country under review, the average rate of HICP inflation over the 12-month reference period from May 2013 to April 2014 is reviewed in the light of the country’s economic performance over the last ten years in terms of price stability. In this connection, attention is paid to the orientation of monetary policy, in particular to whether the focus of the monetary authorities has been primarily on achieving and maintaining price stability, as well as to the contribution of other areas of economic policy to this objective. Moreover, the implications of the macroeconomic environment for the achievement of price stability are taken into account. Price developments are examined in the light of supply and demand conditions, focusing on, inter alia, factors influencing unit labour costs and import prices. Finally, trends in other relevant price indices (such as the HICP excluding unprocessed food and energy, the HICP at constant tax rates, the national CPI, the private consumption deflator, the GDP deflator and producer prices) are considered. From a forward-looking perspective, a view is provided of prospective inflationary developments in the coming years, including forecasts by major international organisations and market participants. Moreover, institutional and structural aspects relevant for maintaining an environment conducive to price stability after adoption of the euro are discussed.
Second, the notion of “at most, the three best performing Member States in terms of price stability”, which is used for the definition of the reference value, has been applied by taking the unweighted arithmetic average of the rates of inflation of the following three Member States: Latvia (0.1%), Portugal (0.3%) and Ireland (0.3%). As a result, the average rate is 0.2% and, adding 1½ percentage points, the reference value is 1.7%.
The inflation rates of Greece, Bulgaria and Cyprus have been excluded from the calculation of the reference value. Price developments in these countries over the reference period resulted in a 12-month average inflation rate in April 2014 of -1.2%, -0.8% and -0.4%, respectively. These three countries have been treated as “outliers” for the calculation of the reference value. In all these countries, inflation rates were significantly lower than the comparable rates in other Member States over the reference period and, in all of them, this was due to exceptional factors. Greece and Cyprus have been undergoing an extraordinarily deep recession, with the result that their price developments have been dampened by exceptionally large negative output gaps. With respect to Bulgaria, an accumulation of country-specific factors has exerted significant downward pressure on inflation. These factors include substantial administered price cuts – mostly relating to electricity prices – and substantially negative contributions from transport and health services.
It should be noted that the concept of “outlier” has been referred to in previous ECB Convergence Reports (see, for example, the 2010, 2012 and 2013 reports) as well as in the Convergence Reports of the EMI. In line with those reports, a Member State is considered to be an “outlier” if two conditions are fulfilled: first, its 12-month average inflation rate is significantly below the comparable rates in other Member States; and second, its price developments have been strongly affected by exceptional factors. The identification of outliers does not follow any mechanical approach. The approach used was introduced to deal appropriately with potential significant distortions in the inflation developments of individual countries.
Inflation has been measured on the basis of the HICP, which was developed for the purpose of assessing convergence in terms of price stability on a comparable basis (see Section 9 of Chapter 5). For information, the average euro area inflation rate is shown in the statistical part of this report.
10ECBConvergence ReportJune 2014
With regard to fiscal developments, the legal provisions and their application by the ECB, together with procedural issues, are outlined in Box 2.
Box 2
FISCAL DEVELOPMENTS
1 Treaty and other legal provisions
Article 140(1), second indent, of the Treaty requires the Convergence Report to examine the achievement of a high degree of sustainable convergence by reference to the fulfilment by each Member State of the following criterion:
“the sustainability of the government financial position; this will be apparent from having achieved a government budgetary position without a deficit that is excessive as determined in accordance with Article 126(6)”.
Article 2 of Protocol (No 13) on the convergence criteria referred to in Article 140 of the Treaty stipulates that:
“The criterion on the government budgetary position referred to in the second indent of Article 140(1) of the said Treaty shall mean that at the time of the examination the Member State is not the subject of a Council decision under Article 126(6) of the said Treaty that an excessive deficit exists”.
Article 126 sets out the excessive deficit procedure (EDP). According to Article 126(2) and (3), the European Commission prepares a report if a Member State does not fulfil the requirements for fiscal discipline, in particular if:
(a) the ratio of the planned or actual government deficit to GDP exceeds a reference value (defined in the Protocol on the EDP as 3% of GDP), unless either:
– the ratio has declined substantially and continuously and reached a level that comes close to the reference value; or, alternatively,
– the excess over the reference value is only exceptional and temporary and the ratio remains close to the reference value;
(b) the ratio of government debt to GDP exceeds a reference value (defined in the Protocol on the EDP as 60% of GDP), unless the ratio is sufficiently diminishing and approaching the reference value at a satisfactory pace.
In addition, the report prepared by the Commission must take into account whether the government deficit exceeds government investment expenditure and all other relevant factors, including the medium-term economic and budgetary position of the Member State.
11ECB
Convergence ReportJune 2014
2 FRAMEWORK FOR
ANALYS ISThe Commission may also prepare a report if, notwithstanding the fulfilment of the criteria, it is of the opinion that there is a risk of an excessive deficit in a Member State. The Economic and Financial Committee formulates an opinion on the Commission’s report. Finally, in accordance with Article 126(6), the EU Council, on the basis of a recommendation from the Commission and having considered any observations which the Member State concerned may wish to make, decides, acting by qualified majority and excluding the Member State concerned, and following an overall assessment, whether an excessive deficit exists in a Member State.
The Treaty provisions under Article 126 are further clarified by Council Regulation (EC) No 1467/97,1 which among other things:
• confirms the equal footing of the debt criterion with the deficit criterion by making the former operational, while allowing for a three-year period of transition. Article 2(1a) of the Regulation provides that when it exceeds the reference value, the ratio of the government debt to GDP shall be considered sufficiently diminishing and approaching the reference value at a satisfactory pace if the differential with respect to the reference value has decreased over the previous three years at an average rate of one twentieth per year as a benchmark, based on changes over the last three years for which the data are available. The requirement under the debt criterion shall also be considered to be fulfilled if the required reduction in the differential looks set to occur over a defined three-year period, based on the Commission’s budgetary forecast. In implementing the debt reduction benchmark, the influence of the economic cycle on the pace of debt reduction shall be taken into account;
• details the relevant factors that the Commission shall take into account when preparing a report under Article 126(3) of the Treaty. Most importantly, it specifies a series of factors considered relevant in assessing developments in medium-term economic, budgetary and government debt positions (see Article 2(3) of the Regulation and, below, details on the ensuing ECB analysis).
Moreover, the Treaty on Stability, Coordination and Governance in the Economic and Monetary Union (TSCG), which builds on the provisions of the enhanced Stability and Growth Pact, was signed on 2 March 2012 by 25 EU Member States (all EU Member States except the United Kingdom, the Czech Republic and Croatia) and entered into force on 1 January 2013.2 Title III (Fiscal Compact) provides, inter alia, for a binding fiscal rule aimed at ensuring that the general government budget is balanced or in surplus. This rule is deemed to be respected if the annual structural balance meets the country-specific medium-term objective and does not exceed a deficit – in structural terms – of 0.5% of GDP. If the government debt ratio is significantly below 60% of GDP and risks to long-term fiscal sustainability are low, the medium-term objective can be set at a structural deficit of at most 1% of GDP. The TSCG also includes the debt reduction benchmark rule referred to in Council Regulation (EU) No 1177/2011, which has amended Council Regulation (EC) 1467/97.3 The signatory Member States are required to
1 Council Regulation (EC) No 1467/97 of 7 July 1997 on speeding up and clarifying the implementation of the excessive deficit procedure, OJ L 209, 2.8.1997, p. 6.
2 The TSCG applies also to those EU Member States with a derogation that have ratified it, as from the date when the decision abrogating that derogation takes effect or as from an earlier date if the Member State concerned declares its intention to be bound at such earlier date by all or part of the provisions of the TSCG.
3 Council Regulation (EU) No 1177/2011 of 8 November 2011 amending Regulation (EC) No 1467/97 on speeding up and clarifying the implementation of the EDP, OJ L 306, 23.11.2011, p. 33.
12ECBConvergence ReportJune 2014
introduce in their constitution – or equivalent law of higher level than the annual budget law – the stipulated fiscal rules accompanied by an automatic correction mechanism in case of deviation from the fiscal objective.
With respect to the Treaty establishing the European Stability Mechanism (“ESM Treaty”), recital 7 provides that as a consequence of joining the euro area, an EU Member State should become an ESM Member with full rights and obligations. Article 44 sets out the procedure for application and accession to the ESM.4
2 Application of Treaty provisions
For the purpose of examining convergence, the ECB expresses its view on fiscal developments. With regard to sustainability, the ECB examines key indicators of fiscal developments from 2004 to 2013, the outlook and the challenges for general government finances, and focuses on the links between deficit and debt developments. The ECB provides an analysis with respect to the effectiveness of national budgetary frameworks, as referred to in Article 2(3)(b) of Council Regulation (EC) No 1467/97 and in Council Directive 2011/85/EU.5 Moreover, the expenditure benchmark rule as set out in Article 9(1) of Council Regulation (EC) No 1466/976 aims to ensure a proper financing of expenditure increases. Under the rule, inter alia, EU Member States that have not yet reached their medium-term budgetary objective should ensure that the annual growth of relevant primary expenditure does not exceed a reference medium-term rate of potential GDP growth, unless the excess is matched by discretionary revenue measures. With regard to Article 126, the ECB, in contrast to the Commission, has no formal role in the EDP. The ECB report only states whether the country is subject to an EDP.
With regard to the Treaty provision that a debt ratio of above 60% of GDP should be “sufficiently diminishing and approaching the reference value at a satisfactory pace”, the ECB examines past and future trends in the debt ratio. For EU Member States in which the debt ratio exceeds the reference value, the ECB provides, for illustrative purposes, a debt sustainability analysis, including with reference to the aforementioned debt reduction benchmark laid down in Article 2(1a) of Council Regulation (EC) No 1467/97.
The examination of fiscal developments is based on data compiled on a national accounts basis, in compliance with the ESA 95 (see Section 9 of Chapter 5). Most of the figures presented in this report were provided by the Commission in April 2014 and include government financial positions from 2004 to 2013 as well as Commission forecasts for 2014.
4 In Opinion CON/2012/73, the ECB noted that Article 44 of the ESM Treaty provides that “the ESM Treaty shall be open for accession by other Member States of the EU upon their application for membership. These ‘other’ Member States are those which have not adopted the euro at the time of signature of the ESM Treaty. Article 44 of the ESM Treaty provides further that the Member State shall file with the ESM its application for membership after the adoption by the Council of the European Union of the decision to abrogate the Member State’s derogation from adopting the euro in accordance with Article 140(2) of the Treaty. Article 44 of the ESM Treaty also provides that, following the approval of the application for membership by the ESM’s Board of Governors, the new ESM Member shall accede upon deposit of the instruments for accession with the Depository”. ECB opinions are available on the ECB’s website at www.ecb.europa.eu.
5 Council Directive 2011/85/EU of 8 November 2011 on requirements for budgetary frameworks of the Member States, OJ L 306, 23.11.2011, p. 41.
6 Council Regulation (EC) No 1466/97 of 7 July 1997 on the strengthening of the surveillance of budgetary positions and the surveillance and coordination of economic policies, OJ L 209, 2.8.1997, p.1.
13ECB
Convergence ReportJune 2014
2 FRAMEWORK FOR
ANALYS ISWith regard to the sustainability of public finances, the outcome in the reference year, 2013, is reviewed in the light of the performance of the country under review over the past ten years. First, the development of the deficit ratio is investigated. It is considered useful to bear in mind that the change in a country’s annual deficit ratio is typically influenced by a variety of underlying forces. These influences are often divided into “cyclical effects” on the one hand, which reflect the reaction of deficits to changes in the economic cycle, and “non-cyclical effects” on the other, which are often taken to reflect structural or permanent adjustments to fiscal policies. However, such non-cyclical effects, as quantified in this report, cannot necessarily be seen as entirely reflecting a structural change to fiscal positions, because they include temporary effects on the budgetary balance stemming from the impact of both policy measures and special factors. Indeed, assessing how structural budgetary positions have changed during the crisis is particularly difficult in view of uncertainty over the level and growth rate of potential output. As regards other fiscal indicators, past government expenditure and revenue trends are also considered in more detail.
As a further step, the development of the government debt ratio in this period is considered, as well as the factors underlying it, namely the difference between nominal GDP growth and interest rates, the primary balance and the deficit-debt adjustment. Such a perspective can offer further information on the extent to which the macroeconomic environment, in particular the combination of growth and interest rates, has affected the dynamics of debt. It can also provide more information on the contribution of fiscal consolidation efforts, as reflected in the primary balance, and on the role played by special factors, as included in the deficit-debt adjustment. In addition, the structure of government debt is considered, by focusing in particular on the shares of debt with a short-term maturity and foreign currency debt, as well as their development. By comparing these shares with the current level of the debt ratio, the sensitivity of fiscal balances to changes in exchange rates and interest rates can be highlighted.
Turning to a forward-looking perspective, national budget plans and recent forecasts by the European Commission for 2014 are considered, and account is taken of the medium-term fiscal strategy, as reflected in the convergence programme. This includes an assessment of the projected attainment of the country’s medium-term budgetary objective, as foreseen in the Stability and Growth Pact, as well as of the outlook for the debt ratio on the basis of current fiscal policies. Finally, long-term challenges to the sustainability of budgetary positions and broad areas for consolidation are emphasised, particularly those related to the issue of unfunded government pension systems in connection with demographic change and to contingent liabilities incurred by the government, especially during the financial and economic crisis.
In line with past practices, the analysis described above also covers most of the relevant factors identified in Article 2(3) of Council Regulation (EC) No 1467/97 as described in Box 2.
With regard to exchange rate developments, the legal provisions and their application by the ECB are outlined in Box 3.
14ECBConvergence ReportJune 2014
Box 3
EXCHANGE RATE DEVELOPMENTS
1 Treaty provisions
Article 140(1), third indent, of the Treaty requires the Convergence Report to examine the achievement of a high degree of sustainable convergence by reference to the fulfilment by each Member State of the following criterion:
“the observance of the normal fluctuation margins provided for by the exchange-rate mechanism of the European Monetary System, for at least two years, without devaluing against the euro”.
Article 3 of Protocol (No 13) on the convergence criteria referred to in Article 140 of the Treaty stipulates that:
“The criterion on participation in the Exchange Rate mechanism of the European Monetary System referred to in the third indent of Article 140(1) of the said Treaty shall mean that a Member State has respected the normal fluctuation margins provided for by the exchange-rate mechanism on the European Monetary System without severe tensions for at least the last two years before the examination. In particular, the Member State shall not have devalued its currency’s bilateral central rate against the euro on its own initiative for the same period.”
2 Application of Treaty provisions
With regard to exchange rate stability, the ECB examines whether the country has participated in ERM II (which superseded the ERM as of January 1999) for a period of at least two years prior to the convergence examination without severe tensions, in particular without devaluing against the euro. In cases of shorter periods of participation, exchange rate developments are described over a two-year reference period.
The examination of exchange rate stability against the euro focuses on the exchange rate being close to the ERM II central rate, while also taking into account factors that may have led to an appreciation, which is in line with the approach taken in the past. In this respect, the width of the fluctuation band within ERM II does not prejudice the examination of the exchange rate stability criterion.
Moreover, the issue of the absence of “severe tensions” is generally addressed by: i) examining the degree of deviation of exchange rates from the ERM II central rates against the euro; ii) using indicators such as exchange rate volatility vis-à-vis the euro and its trend, as well as short-term interest rate differentials vis-à-vis the euro area and their development; iii) considering the role played by foreign exchange interventions; and iv) considering the role of international financial assistance programmes in stabilising the currency.
The reference period in this report is from 16 May 2012 to 15 May 2014. All bilateral exchange rates are official ECB reference rates (see Section 9 of Chapter 5).
15ECB
Convergence ReportJune 2014
2 FRAMEWORK FOR
ANALYS ISIn addition to ERM II participation and nominal exchange rate developments against the euro over the period under review, evidence relevant to the sustainability of the current exchange rate is briefly reviewed. This is derived from the development of the real bilateral and effective exchange rates, export market shares and the current, capital and financial accounts of the balance of payments. The evolution of gross external debt and the net international investment position over longer periods are also examined. The section on exchange rate developments further considers measures of the degree of a country’s integration with the euro area. This is assessed in terms of both external trade integration (exports and imports) and financial integration. Finally, the section on exchange rate developments reports, if applicable, whether the country under examination has benefited from central bank liquidity assistance or balance of payments support, either bilaterally or multilaterally with the involvement of the IMF and/or the EU. Both actual and precautionary assistance are considered, including access to precautionary financing in the form of, for instance, the IMF’s Flexible Credit Line.
With regard to long-term interest rate developments, the legal provisions and their application by the ECB are outlined in Box 4.
Box 4
LONG-TERM INTEREST RATE DEVELOPMENTS
1 Treaty provisions
Article 140(1), fourth indent, of the Treaty requires the Convergence Report to examine the achievement of a high degree of sustainable convergence by reference to the fulfilment by each Member State of the following criterion:
“the durability of convergence achieved by the Member State with a derogation and of its participation in the exchange-rate mechanism being reflected in the long-term interest-rate levels”.
Article 4 of Protocol (No 13) on the convergence criteria referred to in Article 140 of the Treaty stipulates that:
“The criterion on the convergence of interest rates referred to in the fourth indent of Article 140(1) of the said Treaty shall mean that, observed over a period of one year before the examination, a Member State has had an average nominal long-term interest rate that does not exceed by more than two percentage points that of, at most, the three best performing Member States in terms of price stability. Interest rates shall be measured on the basis of long-term government bonds or comparable securities, taking into account differences in national definitions”.
2 Application of Treaty provisions
In the context of this report, the ECB applies the Treaty provisions as outlined below.
First, with regard to “an average nominal long-term interest rate” observed over “a period of one year before the examination”, the long-term interest rate has been calculated as an arithmetic
16ECBConvergence ReportJune 2014
As mentioned above, the Treaty makes explicit reference to the “durability of convergence” being reflected in the level of long-term interest rates. Therefore, developments over the reference period from May 2013 to April 2014 are reviewed against the background of the path of long-term interest rates over the past ten years (or otherwise the period for which data are available) and the main factors underlying differentials vis-à-vis the average long-term interest rate prevailing in the euro area. During the reference period, the average euro area long-term interest rate partly reflected the high country-specific risk premia of several euro area countries. Therefore, the euro area AAA long-term government bond yield (i.e. the long-term yield of the euro area AAA yield curve, which includes the euro area countries with an AAA rating) is also used for comparison purposes. As background to this analysis, this report also provides information about the size and development of the financial market. This is based on three indicators (the outstanding amount of debt securities issued by corporations, stock market capitalisation and domestic bank credit to the private sector), which, together, measure the size of financial markets.
Finally, Article 140(1) of the Treaty requires this report to take account of several other relevant factors (see Box 5). In this respect, an enhanced economic governance framework in accordance with Article 121(6) of the Treaty entered into force on 13 December 2011 with the aim of ensuring a closer coordination of economic policies and the sustained convergence of EU Member States’ economic performances. Box 5 below briefly recalls these legislative provisions and the way in which the above-mentioned additional factors are addressed in the assessment of convergence conducted by the ECB.
average over the latest 12 months for which HICP data were available. The reference period considered in this report is from May 2013 to April 2014.
Second, the notion of “at most, the three best performing Member States in terms of price stability”, which is used for the definition of the reference value, has been applied by using the unweighted arithmetic average of the long-term interest rates of the same three Member States entering the calculation of the reference value for the criterion on price stability (see Box 1). Over the reference period considered in this report, the long-term interest rates of the three best performing countries in terms of price stability were 3.3% (Latvia), 3.5% (Ireland) and 5.8% (Portugal). As a result, the average rate is 4.2% and, adding 2 percentage points, the reference value is 6.2%. Interest rates have been measured on the basis of available harmonised long-term interest rates, which were developed for the purpose of examining convergence (see Section 9 of Chapter 5).
Box 5
OTHER RELEVANT FACTORS
1 Treaty and other legal provisions
Article 140(1) of the Treaty requires that: “The reports of the Commission and the European Central Bank shall also take account of the results of the integration of markets, the situation and development of the balances of payments on current account and an examination of the development of unit labour costs and other price indices”.
17ECB
Convergence ReportJune 2014
2 FRAMEWORK FOR
ANALYS ISIn this respect, the ECB takes into account the legislative package on EU economic governance which entered into force on 13 December 2011. Building on the Treaty provisions under Article 121(6), the European Parliament and the EU Council adopted detailed rules for the multilateral surveillance procedure referred to in Articles 121(3) and 121(4) of the Treaty. These rules were adopted “in order to ensure closer coordination of economic policies and sustained convergence of the economic performances of the Member States” (Article 121(3)), following the “need to draw lessons from the first decade of functioning of the economic and monetary union and, in particular, for improved economic governance in the Union built on stronger national ownership”.1 The new legislative package includes an enhanced surveillance framework (the macroeconomic imbalance procedure or MIP) aimed at preventing excessive macroeconomic imbalances and helping diverging EU Member States to establish corrective plans before divergence becomes entrenched. The MIP, with both preventive and corrective arms, applies to all EU Member States, except those which, being under an international financial assistance programme, are already subject to closer scrutiny coupled with conditionality. The MIP includes an alert mechanism for the early detection of imbalances, based on a transparent scoreboard of indicators with alert thresholds for all EU Member States, combined with economic judgement. This judgement should take into account, inter alia, nominal and real convergence inside and outside the euro area.2 When assessing macroeconomic imbalances, this procedure should take due account of their severity and their potential negative economic and financial spillover effects, which aggravate the vulnerability of the EU economy and threaten the smooth functioning of EMU.3
2 Application of Treaty provisions
In line with past practices, the additional factors referred to in Article 140(1) of the Treaty are reviewed in Chapter 5 under the headings of the individual criteria described in Boxes 1 to 4. Regarding the elements of the MIP, most of the macroeconomic indicators have been referred to in this report in the past (some with different statistical definitions), as part of the wide range of additional backward and forward-looking economic indicators that are considered to be useful for examining the sustainability of convergence in greater detail, as required by Article 140 of the Treaty. For completeness, in Chapter 3 the scoreboard indicators (including in relation to the alert thresholds) are presented for the countries covered in this report, thereby ensuring the provision of all available information relevant to the detection of macroeconomic imbalances that may be hampering the achievement of a high degree of sustainable convergence as stipulated by Article 140(1) of the Treaty. Notably, EU Member States with a derogation that are subject to an excessive imbalance procedure can hardly be considered as having achieved a high degree of sustainable convergence as stipulated by Article 140(1) of the Treaty.
1 See Regulation (EU) No 1176/2011 of the European Parliament and of the Council of 16 November 2011 on the prevention and correction of macroeconomic imbalances, recital 2.
2 See Regulation (EU) No 1176/2011, Article 4(4).3 See Regulation (EU) No 1176/2011, recital 17.
18ECBConvergence ReportJune 2014
2.2 COMPATIBILITY OF NATIONAL LEGISLATION WITH THE TREATIES
2.2.1 INTRODUCTION
Article 140(1) of the Treaty requires the ECB (and the European Commission) to report, at least once every two years or at the request of a Member State with a derogation, to the Council on the progress made by the Member States with a derogation in fulfilling their obligations regarding the achievement of economic and monetary union. These reports must include an examination of the compatibility between the national legislation of each Member State with a derogation, including the statutes of its NCB, and Articles 130 and 131 of the Treaty and the relevant Articles of the Statute. This Treaty obligation of Member States with a derogation is also referred to as ‘legal convergence’. When assessing legal convergence, the ECB is not limited to making a formal assessment of the letter of national legislation, but may also consider whether the implementation of the relevant provisions complies with the spirit of the Treaties and the Statute. The ECB is particularly concerned about any signs of pressure being put on the decision-making bodies of any Member State’s NCB which would be inconsistent with the spirit of the Treaty as regards central bank independence. The ECB also sees the need for the smooth and continuous functioning of the NCBs’ decision-making bodies. In this respect, the relevant authorities of a Member State have, in particular, the duty to take the necessary measures to ensure the timely appointment of a successor if the position of a member of an NCB’s decision-making body becomes vacant.1 The ECB will closely monitor any developments prior to making a positive final assessment concluding that a Member State’s national legislation is compatible with the Treaty and the Statute.
MEMBER STATES WITH A DEROGATION AND LEGAL CONVERGENCEBulgaria, the Czech Republic, Croatia, Lithuania, Hungary, Poland, Romania and Sweden, whose national legislation is examined in this report, each have the status of a Member State with a derogation, i.e. they have not yet adopted the euro. Sweden was given the status of a Member State with a derogation by a decision of the Council in May 1998.2 As far as the other Member States are concerned, Articles 43 and 54 of the Acts concerning the conditions of accession provide that each of these Member States shall participate in Economic and Monetary Union from the date of accession as a Member State with a derogation within the meaning of Article 139 of the Treaty. This report does not cover Denmark or the United Kingdom, which are Member States with a special status and which have not yet adopted the euro.
Protocol (No 16) on certain provisions relating to Denmark, annexed to the Treaties, provides that, in view of the notice given to the Council by the Danish Government on 3 November 1993, Denmark has an exemption and that the procedure for the abrogation of the derogation will only be initiated at the request of Denmark. As Article 130 of the Treaty applies to Denmark, Danmarks Nationalbank has to fulfil the requirements of central bank independence. The EMI’s Convergence
1 Opinions CON/2010/37 and CON/2010/91.2 Council Decision 98/317/EC of 3 May 1998 in accordance with Article 109j(4) of the Treaty (OJ L 139, 11.5.1998, p. 30). Note: The title
of Decision 98/317/EC refers to the Treaty establishing the European Community (prior to the renumbering of the Articles of this Treaty in accordance with Article 12 of the Treaty of Amsterdam); this provision has been repealed by the Treaty of Lisbon.
3 Act concerning the conditions of accession of the Czech Republic, the Republic of Estonia, the Republic of Cyprus, the Republic of Latvia, the Republic of Lithuania, the Republic of Hungary, the Republic of Malta, the Republic of Poland, the Republic of Slovenia and the Slovak Republic and the adjustments to the Treaties on which the European Union is founded (OJ L 236, 23.9.2003, p. 33).
4 For Bulgaria and Romania, see Article 5 of the Act concerning the conditions of accession of the Republic of Bulgaria and Romania and the adjustments to the treaties on which the European Union is founded (OJ L 157, 21.6.2005, p. 203). For Croatia, see Article 5 of the Act concerning the conditions of accession of the Republic of Croatia and the adjustments to the Treaty on European Union, the Treaty on the Functioning of the European Union and the Treaty establishing the European Atomic Energy Community (OJ L 112, 24.4.2012, p. 21).
19ECB
Convergence ReportJune 2014
2 FRAMEWORK FOR
ANALYS IS Report of 1998 concluded that this requirement had been fulfilled. There has been no assessment of Danish convergence since 1998 due to Denmark’s special status. Until such time as Denmark notifies the Council that it intends to adopt the euro, Danmarks Nationalbank does not need to be legally integrated into the Eurosystem and no Danish legislation needs to be adapted.
According to Protocol (No 15) on certain provisions relating to the United Kingdom of Great Britain and Northern Ireland, annexed to the Treaties, the United Kingdom is under no obligation to adopt the euro unless it notifies the Council that it intends to do so. On 30 October 1997 the United Kingdom notified the Council that it did not intend to adopt the euro on 1 January 1999 and this situation has not changed. Pursuant to this notification, certain provisions of the Treaty (including Articles 130 and 131) and of the Statute do not apply to the United Kingdom. Accordingly, there is no current legal requirement to ensure that national legislation (including the Bank of England’s statutes) is compatible with the Treaty and the Statute.
The aim of assessing legal convergence is to facilitate the Council’s decisions as to which Member States fulfil ‘their obligations regarding the achievement of economic and monetary union’ (Article 140(1) of the Treaty). In the legal domain, such conditions refer in particular to central bank independence and to the NCBs’ legal integration into the Eurosystem.
STRUCTURE OF THE LEGAL ASSESSMENTThe legal assessment broadly follows the framework of the previous reports of the ECB and the EMI on legal convergence.5
The compatibility of national legislation is considered in the light of legislation enacted before 20 March 2014.
2.2.2 SCOPE OF ADAPTATION
2.2.2.1 AREAS OF ADAPTATION For the purpose of identifying those areas where national legislation needs to be adapted, the following issues are examined:
– compatibility with provisions on the independence of NCBs in the Treaty (Article 130) and the Statute (Articles 7 and 14.2) and with provisions on confidentiality (Article 37 of the Statute);
– compatibility with the prohibitions on monetary financing (Article 123 of the Treaty) and privileged access (Article 124 of the Treaty) and compatibility with the single spelling of the euro required by EU law; and
– legal integration of the NCBs into the Eurosystem (in particular as regards Articles 12.1 and 14.3 of the Statute).
5 In particular the ECB’s Convergence Reports of June 2013 (on Latvia), May 2012 (on Bulgaria, the Czech Republic, Latvia, Lithuania, Hungary, Poland, Romania and Sweden), May 2010 (on Bulgaria, the Czech Republic, Estonia, Latvia, Lithuania, Hungary, Poland, Romania and Sweden), May 2008 (on Bulgaria, the Czech Republic, Estonia, Latvia, Lithuania, Hungary, Poland, Romania, Slovakia and Sweden), May 2007 (on Cyprus and Malta), December 2006 (on the Czech Republic, Estonia, Cyprus, Latvia, Hungary, Malta, Poland, Slovakia and Sweden), May 2006 (on Lithuania and Slovenia), October 2004 (on the Czech Republic, Estonia, Cyprus, Latvia, Lithuania, Hungary, Malta, Poland, Slovenia, Slovakia and Sweden), May 2002 (on Sweden) and April 2000 (on Greece and Sweden), and the EMI’s Convergence Report of March 1998.
20ECBConvergence ReportJune 2014
2.2.2.2 ‘COMPATIBILITY’ VERSUS ‘HARMONISATION’Article 131 of the Treaty requires national legislation to be ‘compatible’ with the Treaties and the Statute; any incompatibility must therefore be removed. Neither the supremacy of the Treaties and the Statute over national legislation nor the nature of the incompatibility affects the need to comply with this obligation.
The requirement for national legislation to be ‘compatible’ does not mean that the Treaty requires ‘harmonisation’ of the NCBs’ statutes, either with each other or with the Statute. National particularities may continue to exist to the extent that they do not infringe the EU’s exclusive competence in monetary matters. Indeed, Article 14.4 of the Statute permits NCBs to perform functions other than those specified in the Statute, to the extent that they do not interfere with the ESCB’s objectives and tasks. Provisions authorising such additional functions in NCBs’ statutes are a clear example of circumstances in which differences may remain. Rather, the term ‘compatible’ indicates that national legislation and the NCBs’ statutes need to be adjusted to eliminate inconsistencies with the Treaties and the Statute and to ensure the necessary degree of integration of the NCBs into the ESCB. In particular, any provisions that infringe an NCB’s independence, as defined in the Treaty, and its role as an integral part of the ESCB, should be adjusted. It is therefore insufficient to rely solely on the primacy of EU law over national legislation to achieve this.
The obligation in Article 131 of the Treaty only covers incompatibility with the Treaties and the Statute. However, national legislation that is incompatible with secondary EU legislation should be brought into line with such secondary legislation. The primacy of EU law does not affect the obligation to adapt national legislation. This general requirement derives not only from Article 131 of the Treaty but also from the case law of the Court of Justice of the European Union.6
The Treaties and the Statute do not prescribe the manner in which national legislation should be adapted. This may be achieved by referring to the Treaties and the Statute, or by incorporating provisions thereof and referring to their provenance, or by deleting any incompatibility, or by a combination of these methods.
Furthermore, among other things as a tool for achieving and maintaining the compatibility of national legislation with the Treaties and the Statute, the ECB must be consulted by the EU institutions and by the Member States on draft legislative provisions in its fields of competence, pursuant to Articles 127(4) and 282(5) of the Treaty and Article 4 of the Statute. Council Decision 98/415/EC of 29 June 1998 on the consultation of the European Central Bank by national authorities regarding draft legislative provisions7 expressly requires Member States to take the measures necessary to ensure compliance with this obligation.
2.2.3 INDEPENDENCE OF NCBS
As far as central bank independence and confidentiality are concerned, national legislation in the Member States that joined the EU in 2004, 2007 or 2013 had to be adapted to comply with the relevant provisions of the Treaty and the Statute, and be in force on 1 May 2004, 1 January 2007 and 1 July 2013 respectively. Sweden had to bring the necessary adaptations into force by the date of establishment of the ESCB on 1 June 1998.
6 See, amongst others, Case 167/73 Commission of the European Communities v French Republic [1974] ECR 359 (‘Code du Travail Maritime’).
7 OJ L 189, 3.7.1998, p. 42.

21ECB
Convergence ReportJune 2014
2 FRAMEWORK FOR
ANALYS IS CENTRAL BANK INDEPENDENCEIn November 1995, the EMI established a list of features of central bank independence (later described in detail in its 1998 Convergence Report) which were the basis for assessing the national legislation of the Member States at that time, in particular the NCBs’ statutes. The concept of central bank independence includes various types of independence that must be assessed separately, namely: functional, institutional, personal and financial independence. Over the past few years there has been further refinement of the analysis of these aspects of central bank independence in the opinions adopted by the ECB. These aspects are the basis for assessing the level of convergence between the national legislation of the Member States with a derogation and the Treaties and the Statute.
FUNCTIONAL INDEPENDENCECentral bank independence is not an end in itself, but is instrumental in achieving an objective that should be clearly defined and should prevail over any other objective. Functional independence requires each NCB’s primary objective to be stated in a clear and legally certain way and to be fully in line with the primary objective of price stability established by the Treaty. It is served by providing the NCBs with the necessary means and instruments for achieving this objective independently of any other authority. The Treaty’s requirement of central bank independence reflects the generally held view that the primary objective of price stability is best served by a fully independent institution with a precise definition of its mandate. Central bank independence is fully compatible with holding NCBs accountable for their decisions, which is an important aspect of enhancing confidence in their independent status. This entails transparency and dialogue with third parties.
As regards timing, the Treaty is not clear about when the NCBs of Member States with a derogation must comply with the primary objective of price stability set out in Articles 127(1) and 282(2) of the Treaty and Article 2 of the Statute. For those Member States that joined the EU after the date of the introduction of the euro in the EU, it is not clear whether this obligation should run from the date of accession or from the date of their adoption of the euro. While Article 127(1) of the Treaty does not apply to Member States with a derogation (see Article 139(2)(c) of the Treaty), Article 2 of the Statute does apply to such Member States (see Article 42.1 of the Statute). The ECB takes the view that the obligation of the NCBs to have price stability as their primary objective runs from 1 June 1998 in the case of Sweden, and from 1 May 2004, 1 January 2007 and 1 July 2013 for the Member States that joined the EU on those dates. This is based on the fact that one of the guiding principles of the EU, namely price stability (Article 119 of the Treaty), also applies to Member States with a derogation. It is also based on the Treaty objective that all Member States should strive for macroeconomic convergence, including price stability, which is the intention behind the regular reports of the ECB and the European Commission. This conclusion is also based on the underlying rationale of central bank independence, which is only justified if the overall objective of price stability has primacy.
The country assessments in this report are based on these conclusions as to the timing of the obligation of the NCBs of Member States with a derogation to have price stability as their primary objective.
INSTITUTIONAL INDEPENDENCEThe principle of institutional independence is expressly referred to in Article 130 of the Treaty and Article 7 of the Statute. These two articles prohibit the NCBs and members of their decision-making bodies from seeking or taking instructions from EU institutions or bodies, from any government of
22ECBConvergence ReportJune 2014
a Member State or from any other body. In addition, they prohibit EU institutions, bodies, offices or agencies, and the governments of the Member States from seeking to influence those members of the NCBs’ decision-making bodies whose decisions may affect the fulfilment of the NCBs’ ESCB-related tasks. If national legislation mirrors Article 130 of the Treaty and Article 7 of the Statute, it should reflect both prohibitions and not narrow the scope of their application.8
Whether an NCB is organised as a state-owned body, a special public law body or simply a public limited company, there is a risk that influence may be exerted by the owner on its decision-making in relation to ESCB-related tasks by virtue of such ownership. Such influence, whether exercised through shareholders’ rights or otherwise, may affect an NCB’s independence and should therefore be limited by law.
Prohibition on giving instructionsRights of third parties to give instructions to NCBs, their decision-making bodies or their members are incompatible with the Treaty and the Statute as far as ESCB-related tasks are concerned.
Any involvement of an NCB in the application of measures to strengthen financial stability must be compatible with the Treaty, i.e. NCBs’ functions must be performed in a manner that is fully compatible with their functional, institutional, and financial independence so as to safeguard the proper performance of their tasks under the Treaty and the Statute.9 To the extent that national legislation provides for a role of an NCB that goes beyond advisory functions and requires it to assume additional tasks, it must be ensured that these tasks will not affect the NCB’s ability to carry out its ESCB-related tasks from an operational and financial point of view.10 Additionally, the inclusion of NCB representatives in collegiate decision-making supervisory bodies or other authorities would need to give due consideration to safeguards for the personal independence of the members of the NCB’s decision-making bodies.11
Prohibition on approving, suspending, annulling or deferring decisionsRights of third parties to approve, suspend, annul or defer an NCB’s decisions are incompatible with the Treaty and the Statute as far as ESCB-related tasks are concerned.
Prohibition on censoring decisions on legal groundsA right for bodies other than independent courts to censor, on legal grounds, decisions relating to the performance of ESCB-related tasks is incompatible with the Treaty and the Statute, since the performance of these tasks may not be reassessed at the political level. A right of an NCB Governor to suspend the implementation of a decision adopted by the ESCB or by an NCB decision-making body on legal grounds and subsequently to submit it to a political body for a final decision would be equivalent to seeking instructions from third parties.
Prohibition on participation in decision-making bodies of an NCB with a right to voteParticipation by representatives of third parties in an NCB’s decision-making body with a right to vote on matters concerning the performance by the NCB of ESCB-related tasks is incompatible with the Treaty and the Statute, even if such vote is not decisive.
8 Opinion CON/2011/104.9 Opinion CON/2010/31.10 Opinion CON/2009/93.11 Opinion CON/2010/94.
23ECB
Convergence ReportJune 2014
2 FRAMEWORK FOR
ANALYS IS Prohibition on ex ante consultation relating to an NCB’s decisionAn express statutory obligation for an NCB to consult third parties ex ante relating to an NCB’s decision provides third parties with a formal mechanism to influence the final decision and is therefore incompatible with the Treaty and the Statute.
However, dialogue between an NCB and third parties, even when based on statutory obligations to provide information and exchange views, is compatible with central bank independence provided that:
– this does not result in interference with the independence of the members of the NCB’s decision-making bodies;
– the special status of Governors in their capacity as members of the ECB’s decision-making bodies is fully respected; and
– confidentiality requirements resulting from the Statute are observed.
Discharge provided for the duties of members of the NCB’s decision-making bodiesStatutory provisions regarding the discharge provided by third parties (e.g. governments) regarding the duties of members of the NCB’s decision-making bodies (e.g. in relation to accounts) should contain adequate safeguards, so that such a power does not impinge on the capacity of the individual NCB member independently to adopt decisions in respect of ESCB-related tasks (or implement decisions adopted at ESCB level). Inclusion of an express provision to this effect in NCB statutes is recommended.
PERSONAL INDEPENDENCEThe Statute’s provision on security of tenure for members of NCBs’ decision-making bodies further safeguards central bank independence. NCB Governors are members of the General Council of the ECB and will be members of the Governing Council upon adoption of the euro by their Member States. Article 14.2 of the Statute provides that NCB statutes must, in particular, provide for a minimum term of office of five years for Governors. It also protects against the arbitrary dismissal of Governors by providing that Governors may only be relieved from office if they no longer fulfil the conditions required for the performance of their duties or if they have been guilty of serious misconduct, with the possibility of recourse to the Court of Justice of the European Union. NCB statutes must comply with this provision as set out below.
Article 130 of the Treaty prohibits national governments and any bodies from influencing the members of NCBs’ decision-making bodies in the performance of their tasks. In particular, Member States may not seek to influence the members of the NCB’s decision-making bodies by amending national legislation affecting their remuneration, which, as a matter of principle, should apply only for future appointments.12
Minimum term of office for GovernorsIn accordance with Article 14.2 of the Statute, NCB statutes must provide for a minimum term of office of five years for a Governor. This does not preclude longer terms of office, while an indefinite term of office does not require adaptation of the statutes provided the grounds for the dismissal of a Governor are in line with those of Article 14.2 of the Statute. National legislation which provides for a compulsory retirement age should ensure that the retirement age does not
12 See, for example, Opinions CON/2010/56, CON/2010/80, CON/2011/104 and CON/2011/106.
24ECBConvergence ReportJune 2014
interrupt the minimum term of office provided by Article 14.2 of the Statute, which prevails over any compulsory retirement age, if applicable to a Governor.13 When an NCB’s statutes are amended, the amending law should safeguard the security of tenure of the Governor and of other members of decision-making bodies who are involved in the performance of ESCB-related tasks.
Grounds for dismissal of GovernorsNCB statutes must ensure that Governors may not be dismissed for reasons other than those mentioned in Article 14.2 of the Statute. The purpose of this requirement is to prevent the authorities involved in the appointment of Governors, particularly the government or parliament, from exercising their discretion to dismiss a Governor. NCB statutes should either refer to Article 14.2 of the Statute, or incorporate its provisions and refer to their provenance, or delete any incompatibility with the grounds for dismissal laid down in Article 14.2, or omit any mention of grounds for dismissal (since Article 14.2 is directly applicable). Once elected or appointed, Governors may not be dismissed under conditions other than those mentioned in Article 14.2 of the Statute even if the Governors have not yet taken up their duties.
Security of tenure and grounds for dismissal of members of NCBs’ decision-making bodies, other than Governors, who are involved in the performance of ESCB-related tasksPersonal independence would be jeopardised if the same rules for the security of tenure and grounds for dismissal of Governors were not also to apply to other members of the decision-making bodies of NCBs involved in the performance of ESCB-related tasks.14 Various Treaty and Statute provisions require comparable security of tenure. Article 14.2 of the Statute does not restrict the security of tenure of office to Governors, while Article 130 of the Treaty and Article 7 of the Statute refer to ‘members of the decision-making bodies’ of NCBs, rather than to Governors specifically. This applies in particular where a Governor is ‘first among equals’ with colleagues with equivalent voting rights or where such other members are involved in the performance of ESCB-related tasks.
Right of judicial reviewMembers of the NCBs’ decision-making bodies must have the right to submit any decision to dismiss them to an independent court of law, in order to limit the potential for political discretion in evaluating the grounds for their dismissal.
Article 14.2 of the Statute stipulates that NCB Governors who have been dismissed from office may refer such a decision to the Court of Justice of the European Union. National legislation should either refer to the Statute or remain silent on the right to refer such decision to the Court of Justice of the European Union (as Article 14.2 of the Statute is directly applicable).
National legislation should also provide for a right of review by the national courts of a decision to dismiss any other member of the decision-making bodies of the NCB involved in the performance of ESCB-related tasks. This right can either be a matter of general law or can take the form of a specific provision. Even though this right may be available under the general law, for reasons of legal certainty it could be advisable to provide specifically for such a right of review.
Safeguards against conflicts of interestPersonal independence also entails ensuring that no conflict of interest arises between the duties of members of NCB decision-making bodies involved in the performance of ESCB-related tasks in relation to their respective NCBs (and of Governors in relation to the ECB) and any other functions 13 Opinion CON/2012/89.14 The main formative ECB opinions in this area are: CON/2004/35; CON/2005/26; CON/2006/32; CON/2006/44; and CON/2007/6.
25ECB
Convergence ReportJune 2014
2 FRAMEWORK FOR
ANALYS IS which such members of decision-making bodies may have and which may jeopardise their personal independence. As a matter of principle, membership of a decision-making body involved in the performance of ESCB-related tasks is incompatible with the exercise of other functions that might create a conflict of interest. In particular, members of such decision-making bodies may not hold an office or have an interest that may influence their activities, whether through office in the executive or legislative branches of the state or in regional or local administrations, or through involvement in a business organisation. Particular care should be taken to prevent potential conflicts of interest on the part of non-executive members of decision-making bodies.
FINANCIAL INDEPENDENCEEven if an NCB is fully independent from a functional, institutional and personal point of view (i.e. this is guaranteed by the NCB’s statutes), its overall independence would be jeopardised if it could not autonomously avail itself of sufficient financial resources to fulfil its mandate (i.e. to perform the ESCB-related tasks required of it under the Treaty and the Statute).
Member States may not put their NCBs in a position where they have insufficient financial resources to carry out their ESCB or Eurosystem-related tasks, as applicable. It should be noted that Articles 28.1 and 30.4 of the Statute provide for the possibility of the ECB making further calls on the NCBs to contribute to the ECB’s capital and to make further transfers of foreign reserves.15 Moreover, Article 33.2 of the Statute provides16 that, in the event of a loss incurred by the ECB which cannot be fully offset against the general reserve fund, the ECB’s Governing Council may decide to offset the remaining loss against the monetary income of the relevant financial year in proportion to and up to the amounts allocated to the NCBs. The principle of financial independence means that compliance with these provisions requires an NCB to be able to perform its functions unimpaired.
Additionally, the principle of financial independence requires an NCB to have sufficient means not only to perform its ESCB-related tasks but also its national tasks (e.g. financing its administration and own operations).
For all the reasons mentioned above, financial independence also implies that an NCB should always be sufficiently capitalised. In particular, any situation should be avoided whereby for a prolonged period of time an NCB’s net equity is below the level of its statutory capital or is even negative, including where losses beyond the level of capital and the reserves are carried over. Any such situation may negatively impact on the NCB’s ability to perform its ESCB-related tasks but also its national tasks. Moreover, such a situation may affect the credibility of the Eurosystem’s monetary policy. Therefore, the event of an NCB’s net equity becoming less than its statutory capital or even negative would require that the respective Member State provides the NCB with an appropriate amount of capital at least up to the level of the statutory capital within a reasonable period of time so as to comply with the principle of financial independence. As concerns the ECB, the relevance of this issue has already been recognised by the Council by adopting Council Regulation (EC) No 1009/2000 of 8 May 2000 concerning capital increases of the European Central Bank.17 It enabled the Governing Council of the ECB to decide on an actual increase of the ECB’s capital to sustain the adequacy of the capital base to support the operations of the ECB;18 NCBs should be financially able to respond to such ECB decision.
15 Article 30.4 of the Statute only applies within the Eurosystem.16 Article 33.2 of the Statute only applies within the Eurosystem.17 OJ L 115, 16.5.2000, p. 1.18 Decision ECB/2010/26 of 13 December 2010 on the increase of the ECB’s capital (OJ L 11, 15.1.2011, p. 53).
26ECBConvergence ReportJune 2014
The concept of financial independence should be assessed from the perspective of whether any third party is able to exercise either direct or indirect influence not only over an NCB’s tasks but also over its ability to fulfil its mandate, both operationally in terms of manpower, and financially in terms of appropriate financial resources. The aspects of financial independence set out below are particularly relevant in this respect.19 These are the features of financial independence where NCBs are most vulnerable to outside influence.
Determination of budgetIf a third party has the power to determine or influence an NCB’s budget, this is incompatible with financial independence unless the law provides a safeguard clause so that such a power is without prejudice to the financial means necessary for carrying out the NCB’s ESCB-related tasks.
The accounting rulesThe accounts should be drawn up either in accordance with general accounting rules or in accordance with rules specified by an NCB’s decision-making bodies. If, instead, such rules are specified by third parties, the rules must at least take into account what has been proposed by the NCB’s decision-making bodies.
The annual accounts should be adopted by the NCB’s decision-making bodies, assisted by independent accountants, and may be subject to ex post approval by third parties (e.g. the government or parliament). The NCB’s decision-making bodies should be able to decide on the calculation of the profits independently and professionally.
Where an NCB’s operations are subject to the control of a state audit office or similar body charged with controlling the use of public finances, the scope of the control should be clearly defined by the legal framework, should be without prejudice to the activities of the NCB’s independent external auditors20 and further, in line with the principle of institutional independence, it should comply with the prohibition on giving instructions to an NCB and its decision-making bodies and should not interfere with the NCB’s ESCB-related tasks.21 The state audit should be done on a non-political, independent and purely professional basis.
Distribution of profits, NCBs’ capital and financial provisions With regard to profit allocation, an NCB’s statutes may prescribe how its profits are to be allocated. In the absence of such provisions, decisions on the allocation of profits should be taken by the NCB’s decision-making bodies on professional grounds, and should not be subject to the discretion of third parties unless there is an express safeguard clause stating that this is without prejudice to the financial means necessary for carrying out the NCB’s ESCB-related tasks as well as national tasks.
Profits may be distributed to the State budget only after any accumulated losses from previous years have been covered22 and financial provisions deemed necessary to safeguard the real value of the NCB’s capital and assets have been created. Temporary or ad hoc legislative measures amounting to instructions to the NCBs in relation to the distribution of their profits are not admissible.23
19 The main formative ECB opinions in this area are: CON/2002/16; CON/2003/22; CON/2003/27; CON/2004/1; CON/2006/38; CON/2006/47; CON/2007/8; CON/2008/13; CON/2008/68 and CON/2009/32.
20 For the activities of the independent external auditors of the NCBs see Article 27.1 of the Statute.21 Opinions CON/2011/9 and CON/2011/53.22 Opinion CON/2009/85.23 Opinion CON/2009/26 and Opinion CON/2013/15.
27ECB
Convergence ReportJune 2014
2 FRAMEWORK FOR
ANALYS IS Similarly, a tax on an NCB’s unrealised capital gains would also impair the principle of financial independence.24
A Member State may not impose reductions of capital on an NCB without the ex ante agreement of the NCB’s decision-making bodies, which must aim to ensure that it retains sufficient financial means to fulfil its mandate under Article 127(2) of the Treaty and the Statute as a member of the ESCB. For the same reason, any amendment to the profit distribution rules of an NCB should only be initiated and decided in cooperation with the NCB, which is best placed to assess its required level of reserve capital.25 As regards financial provisions or buffers, NCBs must be free to independently create financial provisions to safeguard the real value of their capital and assets. Member States may also not hamper NCBs from building up their reserve capital to a level which is necessary for a member of the ESCB to fulfil its tasks.26
Financial liability for supervisory authoritiesMost Member States place their financial supervisory authorities within their NCB. This is unproblematic if such authorities are subject to the NCB’s independent decision-making. However, if the law provides for separate decision-making by such supervisory authorities, it is important to ensure that decisions adopted by them do not endanger the finances of the NCB as a whole. In such cases, national legislation should enable the NCB to have ultimate control over any decision by the supervisory authorities that could affect an NCB’s independence, in particular its financial independence.
Autonomy in staff mattersMember States may not impair an NCB’s ability to employ and retain the qualified staff necessary for the NCB to perform independently the tasks conferred on it by the Treaty and the Statute. Also, an NCB may not be put into a position where it has limited control or no control over its staff, or where the government of a Member State can influence its policy on staff matters.27 Any amendment to the legislative provisions on the remuneration for members of an NCB’s decision-making bodies and its employees should be decided in close and effective cooperation with the NCB, taking due account of its views, to ensure the ongoing ability of the NCB to independently carry out its tasks.28 Autonomy in staff matters extends to issues relating to staff pensions.
Ownership and property rightsRights of third parties to intervene or to issue instructions to an NCB in relation to the property held by an NCB are incompatible with the principle of financial independence.
2.2.4 CONFIDENTIALITY
The obligation of professional secrecy for ECB and NCB staff under Article 37 of the Statute may give rise to similar provisions in NCBs’ statutes or in the Member States’ legislation. The primacy of EU law and rules adopted thereunder also means that national laws on access by third parties to documents may not lead to infringements of the ESCB’s confidentiality regime. The access of a state audit office or similar body to an NCB’s information and documents must be limited and must be without prejudice to the ESCB’s confidentiality regime to which the members of NCBs’ decision-making
24 Opinion CON/2009/63 and Opinion CON/2009/59.25 Opinion CON/2009/83 and Opinion CON/2009/53.26 Opinion CON/2009/26.27 Opinion CON/2008/9, Opinion CON/2008/10 and Opinion CON/2012/89.28 The main Opinions are CON/2010/42, CON/2010/51, CON/2010/56, CON/2010/69, CON/2010/80, CON/2011/104, CON/2011/106,
CON/2012/6, CON/2012/86 and CON/2014/7.
28ECBConvergence ReportJune 2014
bodies and staff are subject. NCBs should ensure that such bodies protect the confidentiality of information and documents disclosed at a level corresponding to that applied by the NCBs.
2.2.5 PROHIBITION ON MONETARY FINANCING AND PRIVILEGED ACCESS
On the monetary financing prohibition and the prohibition on privileged access, the national legislation of the Member States that joined the EU in 2004, 2007 or 2013 had to be adapted to comply with the relevant provisions of the Treaty and the Statute and be in force on 1 May 2004, 1 January 2007 and 1 July 2013 respectively. Sweden had to bring the necessary adaptations into force by 1 January 1995.
2.2.5.1 PROHIBITION ON MONETARY FINANCINGThe monetary financing prohibition is laid down in Article 123(1) of the Treaty, which prohibits overdraft facilities or any other type of credit facility with the ECB or the NCBs of Member States in favour of EU institutions, bodies, offices or agencies, central governments, regional, local or other public authorities, other bodies governed by public law, or public undertakings of Member States; and the purchase directly from these public sector entities by the ECB or NCBs of debt instruments. The Treaty contains one exemption from the prohibition; it does not apply to publicly-owned credit institutions which, in the context of the supply of reserves by central banks, must be given the same treatment as private credit institutions (Article 123(2) of the Treaty). Moreover, the ECB and the NCBs may act as fiscal agents for the public sector bodies referred to above (Article 21.2 of the Statute). The precise scope of application of the monetary financing prohibition is further clarified by Council Regulation (EC) No 3603/93 of 13 December 1993 specifying definitions for the application of the prohibitions referred to in Articles 104 and 104b (1) of the Treaty29 which makes it clear that the prohibition includes any financing of the public sector’s obligations vis-à-vis third parties.
The monetary financing prohibition is of essential importance to ensuring that the primary objective of monetary policy (namely to maintain price stability) is not impeded. Furthermore, central bank financing of the public sector lessens the pressure for fiscal discipline. Therefore the prohibition must be interpreted extensively in order to ensure its strict application, subject only to the limited exemptions contained in Article 123(2) of the Treaty and Regulation (EC) No 3603/93. Thus, even if Article 123(1) of the Treaty refers specifically to ‘credit facilities’, i.e. with the obligation to repay the funds, the prohibition applies a fortiori to other forms of funding, i.e. without the obligation to repay.
The ECB’s general stance on the compatibility of national legislation with the prohibition has primarily been developed within the framework of consultations of the ECB by Member States on draft national legislation under Articles 127(4) and 282(5) of the Treaty.30
NATIONAL LEGISLATION TRANSPOSING THE MONETARY FINANCING PROHIBITIONIn general, it is unnecessary to transpose Article 123 of the Treaty, supplemented by Regulation (EC) No 3603/93, into national legislation as they are both directly applicable. If, however, national legislative provisions mirror these directly applicable EU provisions, they may not narrow the scope of application of the monetary financing prohibition or extend the exemptions available under EU law. For example, national legislation providing for the financing by the NCB of a Member
29 OJ L 332, 31.12.1993, p. 1. Articles 104 and 104b(1) of the Treaty establishing the European Community are now Articles 123 and 125(1) of the Treaty.
30 See Convergence Report 2008, page 23, footnote 13, containing a list of formative EMI/ECB opinions in this area adopted between May 1995 and March 2008. Other formative ECB opinions in this area are: CON/2008/46; CON/2008/80; CON/2009/59 and CON/2010/4.

29ECB
Convergence ReportJune 2014
2 FRAMEWORK FOR
ANALYS IS State’s financial commitments to international financial institutions (other than the IMF in the capacities foreseen in Regulation (EC) No 3603/9331) or to third countries is incompatible with the monetary financing prohibition.
FINANCING OF THE PUBLIC SECTOR OR OF PUBLIC SECTOR OBLIGATIONS TO THIRD PARTIESNational legislation may not require an NCB to finance either the performance of functions by other public sector bodies or the public sector’s obligations vis-à-vis third parties. For example, national laws authorising or requiring an NCB to finance judicial or quasi-judicial bodies that are independent of the NCB and operate as an extension of the state are incompatible with the monetary financing prohibition. If an NCB is to be entrusted with a new task, that is not a central banking task, it needs to be adequately remunerated.32 Moreover, in line with the prohibition on monetary financing, an NCB may not finance any resolution fund or deposit guarantee scheme.33 No bridge financing may be provided by an NCB to enable a Member State to honour its obligations in respect of State guarantees of bank liabilities.34 However, the provision of resources by an NCB to a supervisory authority does not give rise to monetary financing concerns insofar as the NCB will be financing the performance of a legitimate financial supervisory task under national law as part of its mandate, or as long as the NCB can contribute to and have influence on the decision-making of the supervisory authorities.35
Also, the distribution of central bank profits which have not been fully realised, accounted for and audited does not comply with the monetary financing prohibition. To comply with the monetary financing prohibition, the amount distributed to the State budget pursuant to the applicable profit distribution rules cannot be paid, even partially, from the NCB’s reserve capital. Therefore, profit distribution rules should leave unaffected the NCB’s reserve capital. Moreover, when NCB assets are transferred to the State, they must be remunerated at market value and the transfer should take place at the same time as the remuneration.36
Similarly, intervention in the performance of other Eurosystem tasks, such as the management of foreign reserves, by introducing taxation of theoretical and unrealised capital gains is not permitted.37
ASSUMPTION OF PUBLIC SECTOR LIABILITIESNational legislation which requires an NCB to take over the liabilities of a previously independent public body, as a result of a national reorganisation of certain tasks and duties (for example, in the context of a transfer to the NCB of certain supervisory tasks previously carried out by the state or independent public authorities or bodies), without fully insulating the NCB from all financial obligations resulting from the prior activities of such a body, would be incompatible with the monetary financing prohibition.38
FINANCIAL SUPPORT FOR CREDIT AND/OR FINANCIAL INSTITUTIONSNational legislation which provides for financing by an NCB, granted independently and at their full discretion, of credit institutions other than in connection with central banking tasks (such as monetary policy, payment systems or temporary liquidity support operations), in particular the
31 Opinion CON/2013/16. 32 Opinion CON/2013/29. 33 Opinions CON/2011/103 and CON/2012/22. See also section entitled ‘Financial support for deposit insurance and investor compensation
schemes’ for some specific cases.34 Opinion CON/2012/4.35 Opinion CON/2010/4.36 Opinions CON/2011/91 and CON/2011/99.37 Opinion CON/2009/63.38 Opinion CON/2013/56.
30ECBConvergence ReportJune 2014
support of insolvent credit and/or other financial institutions, would be incompatible with the monetary financing prohibition.
This applies, in particular, to the support of insolvent credit institutions. The rationale is that by financing an insolvent credit institution, an NCB would be assuming a State task.39 The same concerns apply to the Eurosystem financing of a credit institution which has been recapitalised to restore its solvency by way of a direct placement of state-issued debt instruments where no alternative market-based funding sources exist (hereinafter ‘recapitalisation bonds’), and where such bonds are to be used as collateral. In such case of a state recapitalisation of a credit institution by way of direct placement of recapitalisation bonds, the subsequent use of the recapitalisation bonds as collateral in central bank liquidity operations raises monetary financing concerns.40
Emergency liquidity assistance, granted by an NCB independently and at its full discretion to a solvent credit institution on the basis of collateral security in the form of a State guarantee, has to meet the following criteria: (i) it must be ensured that the credit provided by the NCB is as short term as possible; (ii) there must be systemic stability aspects at stake; (iii) there must be no doubts as to the legal validity and enforceability of the State guarantee under applicable national law; and (iv) there must be no doubts as to the economic adequacy of the State guarantee, which should cover both principal and interest on the loans.41
To this end, inserting references to Article 123 of the Treaty in national legislation should be considered.
FINANCIAL SUPPORT FOR DEPOSIT INSURANCE AND INVESTOR COMPENSATION SCHEMESThe Deposit Guarantee Schemes Directive42 and the Investor Compensation Schemes Directive43 provide that the costs of financing deposit guarantee schemes and investor compensation schemes must be borne, respectively, by credit institutions and investment firms themselves. National legislation which provides for the financing by an NCB of a national deposit insurance scheme for credit institutions or a national investor compensation scheme for investment firms would be compatible with the monetary financing prohibition only if it were short term, addressed urgent situations, systemic stability aspects were at stake, and decisions were at the NCB’s discretion. To this end, inserting references to Article 123 of the Treaty in national legislation should be considered. When exercising its discretion to grant a loan, the NCB must ensure that it is not de facto taking over a State task.44 In particular, central bank support for deposit guarantee schemes should not amount to a systematic pre-funding operation.45
In line with the prohibition of monetary financing, an NCB may not finance any resolution fund. Where an NCB acts as resolution authority, it should in no event assume or finance any obligation of either a bridge institution or an asset management vehicle.46
39 Opinion CON/2013/5. 40 Opinions CON/2012/50, CON/2012/64, and CON/2012/71.41 Opinion CON/2012/4, footnote 42 referring to further relevant Opinions in this field.42 Recital 23 of Directive 94/19/EC of the European Parliament and of the Council of 30 May 1994 on deposit-guarantee schemes (OJ L 135,
31.5.1994, p. 5).43 Recital 23 of Directive 97/9/EC of the European Parliament and of the Council of 3 March 1997 on investor-compensation schemes (OJ L
84, 26.3.1997, p. 22).44 Opinion CON/2011/83.45 Opinion CON/2011/84.46 Opinions CON/2011/103 and CON/2012/99.
31ECB
Convergence ReportJune 2014
2 FRAMEWORK FOR
ANALYS IS FISCAL AGENCY FUNCTION Article 21.2 of the Statute establishes that the ‘ECB and the national central banks may act as fiscal agents’ for ‘Union institutions, bodies, offices or agencies, central governments, regional local or other public authorities, other bodies governed by public law, or public undertakings of Member States.’ The purpose of Article 21.2 of the Statute is, following transfer of the monetary policy competence to the Eurosystem, to enable NCBs to continue to provide the fiscal agent service traditionally provided by central banks to governments and other public entities without automatically breaching the monetary financing prohibition. Regulation (EC) No 3603/93 establishes a number of explicit and narrowly drafted exemptions from the monetary financing prohibition relating to the fiscal agency function, as follows (i) intra-day credits to the public sector are permitted provided that they remain limited to the day and that no extension is possible;47 (ii) crediting the public sector’s account with cheques issued by third parties before the drawee bank has been debited is permitted if a fixed period of time corresponding to the normal period for the collection of cheques by the NCB concerned has elapsed since receipt of the cheque, provided that any float which may arise is exceptional, is of a small amount and averages out in the short term;48 and (iii) the holding of coins issued by and credited to the public sector is permitted where the amount of such assets remains at less than 10 % of coins in circulation.49
National legislation on the fiscal agency function should be compatible with EU law in general, and with the monetary financing prohibition in particular.50 Taking into account the express recognition in Article 21.2 of the Statute of the provision of fiscal agency services as a legitimate function traditionally performed by NCBs, the provision by central banks of fiscal agency services complies with the prohibition on monetary financing, provided that such services remain within the field of the fiscal agency function and do not constitute central bank financing of public sector obligations vis-à-vis third parties or central bank crediting of the public sector outside the narrowly defined exceptions specified in Regulation (EC) No 3603/93.51 National legislation that enables an NCB to hold government deposits and to service government accounts does not raise concerns about compliance with the monetary financing prohibition as long as such provisions do not enable the extension of credit, including overnight overdrafts. However, there would be a concern about compliance with the monetary financing prohibition if, for example, national legislation were to enable the remuneration of deposits or current account balances above, rather than at or below, market rates. Remuneration that is above market rates constitutes a de facto credit, contrary to the objective of the prohibition on monetary financing, and might therefore undermine the prohibition’s objectives. It is essential for any remuneration of an account to reflect market parameters and it is particularly important to correlate the remuneration rate of the deposits with their maturity.52 Moreover, the provision without remuneration by an NCB of fiscal agent services does not raise monetary financing concerns, provided they are core fiscal agent services.53
2.2.5.2 PROHIBITION ON PRIVILEGED ACCESS Article 124 of the Treaty provides that ‘[a]ny measure, not based on prudential considerations, establishing privileged access by Union institutions, bodies, offices or agencies, central governments, regional, local or other public authorities, other bodies governed by public law, or public undertakings of Member States to financial institutions, shall be prohibited.’
47 See Article 4 of Regulation (EC) No 3603/93 and Opinion CON/2013/2.48 See Article 5 of Regulation (EC) No 3603/93.49 See Article 6 of Regulation (EC) No 3603/93.50 Opinion CON/2013/3.51 Opinions CON/2009/23, CON/2009/67 and CON/2012/9.52 See, among others, Opinions CON/2010/54, CON/2010/55 and CON/2013/62.53 Opinion CON/2012/9.
32ECBConvergence ReportJune 2014
Under Article 1(1) of Council Regulation (EC) No 3604/93,54 privileged access is understood as any law, regulation or other binding legal instrument adopted in the exercise of public authority which: (a) obliges financial institutions to acquire or to hold liabilities of EU institutions or bodies, central governments, regional, local or other public authorities, other bodies governed by public law or public undertakings of Member States (hereinafter the ‘public sector’), or (b) confers tax advantages that only benefit financial institutions or financial advantages that do not comply with the principles of a market economy, in order to encourage those institutions to acquire or hold such liabilities.
As public authorities, NCBs may not take measures granting privileged access to financial institutions by the public sector if such measures are not based on prudential considerations. Furthermore, the rules on the mobilisation or pledging of debt instruments enacted by the NCBs must not be used as a means of circumventing the prohibition on privileged access.55 Member States’ legislation in this area may not establish such privileged access.
Article 2 of Regulation (EC) No 3604/93 defines ‘prudential considerations’ as those which underlie national laws, regulations or administrative actions based on, or consistent with, EU law and designed to promote the soundness of financial institutions so as to strengthen the stability of the financial system as a whole and the protection of the customers of those institutions. Prudential considerations seek to ensure that banks remain solvent with regard to their depositors.56 In the area of prudential supervision, EU secondary legislation has established a number of requirements to ensure the soundness of credit institutions.57 A ‘credit institution’ has been defined as an undertaking whose business is to receive deposits or other repayable funds from the public and to grant credits for its own account.58 Additionally, credit institutions are commonly referred to as ‘banks’ and require an authorisation by a competent Member State authority to provide services.59
Although minimum reserves might be seen as a part of prudential requirements, they are usually part of an NCB’s operational framework and used as a monetary policy tool in most economies, including in the euro area.60 In this respect, Section 1.3.3. of Annex I to Guideline ECB/2011/1461 states that the Eurosystem’s minimum reserve system primarily pursues the monetary policy functions of stabilising the money market interest rates and creating or enlarging a structural liquidity shortage.62 The ECB requires credit institutions established in the euro area to hold the required minimum reserves (in the form of deposits) on account with their NCB.63
54 Council Regulation (EC) No 3604/93 of 13 December 1993 specifying definitions for the application of the prohibition of privileged access referred to in Article 104a of the Treaty [establishing the European Community] (OJ L 332, 31.12.1993, p. 4). Article 104a is now Article 124 of the Treaty.
55 See Article 3(2) of and recital 10 of Regulation (EC) No 3604/93.56 Opinion of Advocate General Elmer in Case C-222/95 Parodi v Banque H. Albert de Bary [1997] ECR I-3899, paragraph 24.57 See: (i) Regulation (EU) No 575/2013 of the European Parliament and of the Council of 26 June 2013 on prudential requirements for
credit institutions and investment firms and amending Regulation (EU) No 648/2012 (OJ L 176, 27.06.2013, p. 1); and (ii) Directive 2013/36/EU of the European Parliament and of the Council of 26 June 2013 on access to the activity of credit institutions and the prudential supervision of credit institutions and investment firms, amending Directive 2002/87/EC and repealing Directives 2006/48/EC and 2006/49/EC (OJ L 176, 27.06.2013, p. 338).
58 See point (1) of Article 4(1) of Regulation (EU) No 575/2013. 59 See Article 8 of Directive 2013/36/EU. 60 This is supported by Article 3(2) and recital 9 of Regulation (EC) No 3604/93.61 Guideline of the European Central Bank of 20 September 2011 on monetary policy instruments and procedures of the Eurosystem
(ECB/2011/14) (OJ L 331, 14.12.2011, p. 1).62 The higher the reserve requirement is set, the less funds banks will have to loan out, leading to lower money creation.63 See: Article 19 of the Statute; Council Regulation (EC) No 2531/98 of 23 November 1998 concerning the application of minimum
reserves by the European Central Bank (OJ L 318, 27.11.1998, p. 1); Regulation (EC) No 1745/2003 of the European Central Bank of 12 September 2003 on the application of minimum reserves (ECB/2003/9) (OJ L 250, 2.10.2003, p. 10); and Regulation ECB/2008/32 of 19 December 2008 concerning the balance sheet of the monetary financial institutions sector (OJ L 15, 20.1.2009, p. 14).
33ECB
Convergence ReportJune 2014
2 FRAMEWORK FOR
ANALYS IS This report focuses on the compatibility both of national legislation or rules adopted by NCBs and of the NCBs’ statutes with the Treaty prohibition on privileged access. However, this report is without prejudice to an assessment of whether laws, regulations, rules or administrative acts in Member States are used under the cover of prudential considerations as a means of circumventing the prohibition on privileged access. Such an assessment is beyond the scope of this report.
2.2.6 SINGLE SPELLING OF THE EURO
Article 3(4) of the Treaty on European Union lays down that the ‘Union shall establish an economic and monetary union whose currency is the euro’. In the texts of the Treaties in all the authentic languages written using the Roman alphabet, the euro is consistently identified in the nominativesingularcaseas‘euro’.IntheGreekalphabettext,theeuroisspelled‘ευρώ’andintheCyrillicalphabet text theeuro is spelled ‘евро’.64 Consistent with this, Council Regulation (EC) No 974/98 of 3 May 1998 on the introduction of the euro65 makes it clear that the name of the single currency must be the same in all the official languages of the EU, taking into account the existence of different alphabets. The Treaties thus require a single spelling of the word ‘euro’ in the nominative singular case in all EU and national legislative provisions, taking into account the existence of different alphabets.
In view of the exclusive competence of the EU to determine the name of the single currency, any deviations from this rule are incompatible with the Treaties and should be eliminated. While this principle applies to all types of national legislation, the assessment in the country chapters focuses on the NCBs’ statutes and the euro changeover laws.
2.2.7 LEGAL INTEGRATION OF NCBS INTO THE EUROSYSTEM
Provisions in national legislation (in particular an NCB’s statutes, but also other legislation) which would prevent the performance of Eurosystem-related tasks or compliance with the ECB’s decisions are incompatible with the effective operation of the Eurosystem once the Member State concerned has adopted the euro. National legislation therefore has to be adapted to ensure compatibility with the Treaty and the Statute in respect of Eurosystem-related tasks. To comply with Article 131 of the Treaty, national legislation had to be adjusted to ensure its compatibility by the date of establishment of the ESCB (as regards Sweden) and by 1 May 2004, 1 January 2007 and 1 July 2013 (as regards the Member States which joined the EU on these dates). Nevertheless, statutory requirements relating to the full legal integration of an NCB into the Eurosystem need only enter into force at the moment that full integration becomes effective, i.e. the date on which the Member State with a derogation adopts the euro.
The main areas examined in this report are those in which statutory provisions may hinder an NCB’s compliance with the Eurosystem’s requirements. These include provisions that could prevent the NCB from taking part in implementing the single monetary policy, as defined by the ECB’s decision-making bodies, or hinder a Governor from fulfilling their duties as a member of the ECB’s Governing Council, or which do not respect the ECB’s prerogatives. Distinctions are
64 The ‘Declaration by the Republic of Latvia, the Republic of Hungary and the Republic of Malta on the spelling of the name of the single currency in the Treaties’, annexed to the Treaties, states that; ‘Without prejudice to the unified spelling of the name of the single currency of the European Union referred to in the Treaties as displayed on banknotes and on coins, Latvia, Hungary and Malta declare that the spelling of the name of the single currency, including its derivatives as applied throughout the Latvian, Hungarian and Maltese text of the Treaties, has no effect on the existing rules of the Latvian, Hungarian or Maltese languages’.
65 OJ L 139, 11.5.1998, p. 1.
34ECBConvergence ReportJune 2014
made between economic policy objectives, tasks, financial provisions, exchange rate policy and international cooperation. Finally, other areas where an NCB’s statutes may need to be adapted are mentioned.
2.2.7.1 ECONOMIC POLICY OBJECTIVESThe full integration of an NCB into the Eurosystem requires its statutory objectives to be compatible with the ESCB’s objectives, as laid down in Article 2 of the Statute. Among other things, this means that statutory objectives with a ‘national flavour’ – for example, where statutory provisions refer to an obligation to conduct monetary policy within the framework of the general economic policy of the Member State concerned – need to be adapted. Furthermore, an NCB’s secondary objectives must be consistent and not interfere with its obligation to support the general economic policies in the EU with a view to contributing to the achievement of the objectives of the EU as laid down in Article 3 of the Treaty on European Union, which is itself an objective expressed to be without prejudice to maintaining price stability.66
2.2.7.2 TASKSThe tasks of an NCB of a Member State whose currency is the euro are predominantly determined by the Treaty and the Statute, given that NCB’s status as an integral part of the Eurosystem. In order to comply with Article 131 of the Treaty, provisions on tasks in an NCB’s statutes therefore need to be compared with the relevant provisions of the Treaty and the Statute, and any incompatibility must be removed.67 This applies to any provision that, after adoption of the euro and integration into the Eurosystem, constitutes an impediment to carrying out ESCB-related tasks and in particular to provisions which do not respect the ESCB’s powers under Chapter IV of the Statute.
Any national legislative provisions relating to monetary policy must recognise that the EU’s monetary policy is to be carried out through the Eurosystem.68 An NCB’s statutes may contain provisions on monetary policy instruments. Such provisions should be comparable to those in the Treaty and the Statute, and any incompatibility must be removed in order to comply with Article 131 of the Treaty.
Monitoring fiscal developments is a task that an NCB carries out on a regular basis to assess properly the stance to be taken in monetary policy. NCBs may also present their views on relevant fiscal developments on the basis of their monitoring activity and the independence of their advice, with a view to contributing to the proper functioning of the European Monetary Union. The monitoring of fiscal developments by an NCB for monetary policy purposes should be based on the full access to all relevant public finance data. Accordingly, the NCBs should be granted unconditional, timely and automatic access to all relevant public finance statistics. However, an NCB’s role should not go beyond monitoring activities that result from or are linked – directly or indirectly – to the discharge of their monetary policy mandate.69 A formal mandate for an NCB to assess forecasts and fiscal developments implies a function for the NCB in (and a corresponding responsibility for) fiscal policymaking which may risk undermining the discharge of the Eurosystem’s monetary policy mandate and the NCB’s independence.70
66 Opinions CON/2010/30 and CON/2010/48.67 See, in particular, Articles 127 and 128 of the Treaty and Articles 3 to 6 and 16 of the Statute.68 First indent of Article 127(2) of the Treaty.69 Opinion CON/2012/105.70 For example, national legislative provisions transposing Council Directive 2011/85/EU of 8 November 2011 on requirements for
budgetary frameworks of the Member States (OJ L 306, 23.11.2011, p. 41). See Opinions CON/2013/90 and CON/2013/91.

35ECB
Convergence ReportJune 2014
2 FRAMEWORK FOR
ANALYS IS In the context of the national legislative initiatives to address the turmoil in the financial markets, the ECB has emphasised that any distortion in the national segments of the euro area money market should be avoided, as this may impair the implementation of the single monetary policy. In particular, this applies to the extension of State guarantees to cover interbank deposits.71
Member States must ensure that national legislative measures addressing liquidity problems of businesses or professionals, for example their debts to financial institutions, do not have a negative impact on market liquidity. In particular, such measures may not be inconsistent with the principle of an open market economy, as reflected in Article 3 of the Treaty on European Union, as this could hinder the flow of credit, materially influence the stability of financial institutions and markets and therefore affect the performance of Eurosystem tasks.72
National legislative provisions assigning the exclusive right to issue banknotes to the NCB must recognise that, once the euro is adopted, the ECB’s Governing Council has the exclusive right to authorise the issue of euro banknotes, pursuant to Article 128(1) of the Treaty and Article 16 of the Statute, while the right to issue euro banknotes belongs to the ECB and the NCBs. National legislative provisions enabling the government to influence issues such as the denominations, production, volume or withdrawal of euro banknotes must also either be repealed or recognition must be given to the ECB’s powers with regard to euro banknotes, as set out in the provisions of the Treaty and the Statute. Irrespective of the division of responsibilities in relation to coins between governments and NCBs, the relevant provisions must recognise the ECB’s power to approve the volume of issue of euro coins once the euro is adopted. A Member State may not consider currency in circulation as its NCB’s debt to the government of that Member State, as this would defeat the concept of a single currency and be incompatible with the requirements of Eurosystem legal integration.73
With regard to foreign reserve management,74 any Member State that has adopted the euro and which does not transfer its official foreign reserves75 to its NCB is in breach of the Treaty. In addition, any right of a third party – for example, the government or parliament – to influence an NCB’s decisions with regard to the management of the official foreign reserves would be inconsistent with the third indent of Article 127(2) of the Treaty. Furthermore, NCBs have to provide the ECB with foreign reserve assets in proportion to their shares in the ECB’s subscribed capital. This means that there must be no legal obstacles to NCBs transferring foreign reserve assets to the ECB.
With regard to statistics, although regulations adopted under Article 34.1 of the Statute in the field of statistics do not confer any rights or impose any obligations on Member States that have not adopted the euro, Article 5 of the Statute, which concerns the collection of statistical information, applies to all Member States, regardless of whether they have adopted the euro. Accordingly, Member States whose currency is not the euro are under an obligation to design and implement, at national level, all measures they consider appropriate to collect the statistical information needed to fulfil the ECB’s statistical reporting requirements and to make timely preparations in the field of statistics in order for them to become Member States whose currency is the euro.76
71 Opinions CON/2009/99 and CON/2011/79.72 Opinion CON/2010/8.73 Opinion CON/2008/34.74 Third indent of Article 127(2) of the Treaty.75 With the exception of foreign-exchange working balances, which Member State governments may retain pursuant to Article 127(3) of the
Treaty.76 Opinion CON/2013/88.
36ECBConvergence ReportJune 2014
2.2.7.3 FINANCIAL PROVISIONSThe financial provisions in the Statute comprise rules on financial accounts,77 auditing,78 capital subscription,79 the transfer of foreign reserve assets80 and the allocation of monetary income.81 NCBs must be able to comply with their obligations under these provisions and therefore any incompatible national provisions must be repealed.
2.2.7.4 EXCHANGE RATE POLICYA Member State with a derogation may retain national legislation which provides that the government is responsible for the exchange rate policy of that Member State, with a consultative and/or executive role being granted to the NCB. However, by the time that a Member State adopts the euro, such legislation must reflect the fact that responsibility for the euro area’s exchange rate policy has been transferred to the EU level in accordance with Articles 138 and 219 of the Treaty.
2.2.7.5 INTERNATIONAL COOPERATIONFor the adoption of the euro, national legislation must be compatible with Article 6.1 of the Statute, which provides that in the field of international cooperation involving the tasks entrusted to the Eurosystem, the ECB decides how the ESCB is represented. National legislation allowing an NCB to participate in international monetary institutions must make such participation subject to the ECB’s approval (Article 6.2 of the Statute).
2.2.7.6 MISCELLANEOUSIn addition to the above issues, in the case of certain Member States there are other areas where national provisions need to be adapted (for example in the area of clearing and payment systems and the exchange of information).
77 Article 26 of the Statute.78 Article 27 of the Statute.79 Article 28 of the Statute.80 Article 30 of the Statute.81 Article 32 of the Statute.
37ECB
Convergence ReportJune 2014
3 THE STATE OF ECONOMIC CONVERGENCEAfter the publication of the previous regular Convergence Report of the ECB in 2012, economic
activity slowed down in large parts of Europe.1 At the same time, progress was made in several countries in reducing fiscal imbalances. In the course of 2013 economic activity started to gain momentum again in most countries and gradually became broader-based. This reflected the impact of rising real disposable income in the absence of inflationary pressures in most countries, accommodative macroeconomic policies in several countries and increasing signs of economic stabilisation in the euro area. However, the incipient recovery has not yet led to significant improvements in the labour market, where unemployment remains high. At the same time, substantial progress has been made in several countries with regard to correcting external imbalances and reducing the dependence on external funding, particularly in the banking sector. This enhanced the resilience of most of the countries under review during the recent episodes of turmoil in emerging markets outside the EU. Still, significant vulnerabilities prevail in individual countries which, if not adequately tackled, are likely to restrain the convergence process over the long term.
Regarding the price stability criterion, the 12-month average inflation rate was well below the reference value in seven countries examined in this report, namely Bulgaria, the Czech Republic, Croatia, Lithuania, Hungary, Poland and Sweden, while it was above the reference value in Romania. In 2012, only three out of the eight countries considered in the Convergence Report recorded inflation rates below the reference value.
As regards fiscal criteria, among the countries under review, only the Czech Republic, Croatia and Poland are, at the time of this report, subject to an EU Council decision on the existence of an excessive deficit. This is in contrast to the situation identified in the 2012 Convergence Report, when all countries examined except Sweden were subject to an excessive deficit procedure (EDP). In 2013, the headline fiscal balances stood below the 3% of GDP reference value in all countries except Croatia and Poland. In the 2012 Convergence Report, all countries with the exception of Sweden, Bulgaria and Hungary posted a fiscal deficit-to-GDP ratio above the 3% reference value. In 2013, government debt-to-GDP ratios increased in the majority of countries under review except the Czech Republic, Lithuania and Hungary. However, apart from Croatia and Hungary, all the examined countries had a general government debt-to-GDP ratio below the 60% reference value in 2013. Poland’s debt-to-GDP ratio rose to close to the reference value in 2013. Debt ratios in 2013 were below 50% of GDP in the Czech Republic and Sweden, below 40% of GDP in Lithuania and Romania, and below 20% of GDP in Bulgaria. In the 2012 Convergence Report, only Hungary recorded a gross debt-to-GDP ratio above 60%.
As regards the exchange rate criterion, only one of the currencies of the countries examined in this report participates in ERM II, namely the Lithuanian litas. None of the countries under review joined ERM II since the convergence assessment in 2012. Over the reference period, financial market conditions in Lithuania were stable overall. The exchange rates of currencies not participating in ERM II exhibited relatively wide fluctuations over the reference period, except for the currencies of Bulgaria, which has a currency board vis-à-vis the euro, and Croatia, which operates a tightly managed float.
With regard to the convergence of long-term interest rates, all of the eight countries under review in this report are below – and in the case of Bulgaria, the Czech Republic, Lithuania, Poland and Sweden, well below – the 6.2% reference value for the interest rate convergence criterion. In 2012, six out of the eight countries then considered recorded interest rates below the reference value.1 Of the eight countries examined in the 2012 Convergence Report, Latvia has in the meantime adopted the euro (for further reference see
the June 2013 ECB Convergence Report, prepared on Latvia’s request). Croatia, which joined the EU on 1 July 2013, is assessed for the first time in this report. This change in the composition of the group of countries under review should be taken into account when comparing the findings of the two reports.
3 THE STATE OF ECONOMIC CONVERGENCE
38ECBConvergence ReportJune 2014
When considering compliance with the convergence criteria, sustainability is an essential factor, as convergence must be achieved on a lasting basis and not just at a given point in time. The first decade of EMU showed that weak fundamentals, an excessively loose macroeconomic stance at country level and overly optimistic expectations about the convergence in real incomes pose risks not only for the countries concerned but also for the smooth functioning of the euro area as a whole. Large and persistent macroeconomic imbalances, for example in the form of sustained losses in competitiveness or the build-up of indebtedness and housing market bubbles, accumulated over the first decade of EMU in many EU Member States, including euro area countries, and are one of the main reasons for the economic and financial crisis which developed after 2008. This highlights the fact that the temporary fulfilment of the numerical convergence criteria is, by itself, not a guarantee of smooth membership in the euro area. Countries joining the euro area should thus demonstrate the sustainability of their convergence processes and their capacity to live up to the permanent commitments which euro adoption represents. This is in the country’s own interest, as well as in the interest of the euro area as a whole.
The need for improved economic governance in the EU has been recognised. In particular, new legislative packages entered into force on 13 December 2011 (the “six-pack”) and 30 May 2013 (the “two-pack”), providing a significant reinforcement of surveillance of fiscal policies as well as a new surveillance procedure for the prevention and correction of macroeconomic imbalances.
As highlighted in previous Convergence Reports, lasting policy adjustments are required in many of the countries under review on account of a combination of the following factors, which are relevant to economic integration and convergence:
i) High public or private indebtedness, particularly in connection with a relatively high level of external debt, makes economies vulnerable to contagion from stress in financial markets. Such indebtedness may also hinder sustainable output growth because of its potentially negative impact on funding, as well as owing to the need for deleveraging.
ii) Containing excessive wage growth and fostering productivity through innovation remain necessary to support competitiveness.
iii) In order to support higher, balanced and sustainable growth, skill mismatches need to be tackled and labour market participation encouraged, with a focus on high value-added goods and services. This would help to reduce labour shortages and promote higher potential growth.
iv) Further improvements in the business environment and measures to strengthen governance as well as to enhance the quality of institutions would support higher sustainable output growth and make the economy more resilient to country-specific shocks.
v) Regarding the financial sector, it is essential to monitor the banking sector as closely as possible, and notably the risks relating to its exposure to other countries and relatively high foreign currency lending. It is also necessary to develop funding markets in local currency, especially at longer maturities.
vi) The further convergence of income levels in most of the countries covered in this report is likely to exert additional upward pressure on prices or nominal exchange rates (or both). Hence, a proven ability to achieve and maintain price stability on a lasting basis under conditions of stable exchange rates vis-à-vis the euro remains crucial for sustainable economic convergence.
39ECB
Convergence ReportJune 2014
3 THE STATE OF ECONOMIC CONVERGENCEvii) Sustainable policy adjustments are needed to avoid any new build-up of macroeconomic
imbalances. This risk exists, in particular, if income convergence is accompanied by renewed excessive credit growth and asset price increases, fuelled, for example, by low or negative real interest rates.
viii) The projected demographic changes, which are expected to be rapid and substantial in nature, need to be addressed, for example through responsible and forward-looking pension reforms.
THE PRICE STABILITY CRITERIONOver the 12-month reference period from May 2013 to April 2014, inflation was low in the EU, mainly as a result of low imported inflationary pressures and the ongoing weakness in economic activity in most of the countries. The reference value for the price stability criterion was 1.7%. It was calculated by adding 1.5 percentage points to the unweighted arithmetic average of the rate of HICP inflation over the 12 months in Latvia (0.1%), Portugal (0.3%) and Ireland (0.3%). The HICP inflation rates of Greece, Bulgaria and Cyprus were judged to be an outlier and consequently excluded from the calculation of the reference value (see Box 1 in Chapter 2).
As several countries recorded very low average inflation rates over the 12 months to April 2014 (see Table 1), it must be recalled that under the Treaty a country’s inflation performance is examined in relative terms, i.e. against the level of the best performing Member States. The price stability criterion thus takes into account the fact that common shocks (stemming, for example, from global commodity prices) can temporarily drive inflation away from levels compatible with price stability, including in the euro area.
Looking back over the past ten years, inflation has been volatile in all EU countries, although to different degrees, largely reflecting the developments in commodity prices, administered price measures and the macroeconomic environment. Exchange rate developments as well as monetary policy conditions have also contributed to the volatility of inflation in most countries under review. During a period of robust economic growth up to 2008 inflation accelerated in most of the countries, before declining substantially in 2009 as a result of the negative global commodity price shock and the significant downturn in economic activity in most of these countries. However, inflation rose from 2010 to 2012 in spite of persistently weak domestic demand, largely owing to external factors and administered prices. During 2013, inflation decreased in all countries under review to – in some cases – historically low levels, although a gradual economic recovery has emerged in all countries except Croatia, where large macroeconomic imbalances persist. The sharp disinflation process was largely induced by decreases in global oil and non-oil commodity prices and good harvests. It was also supported by still negative output gaps in most countries and the absence of inflationary pressures stemming from exchange rate developments. In some countries, cuts in administered prices and indirect taxes or base effects from past increases in indirect taxes helped to bring inflation rates down further. Several countries have loosened monetary policy conditions considerably in view of subdued inflation rates, which have fallen below the central bank’s target in all inflation-targeting countries examined in this report. At the beginning of 2014, HICP inflation remained low in all countries under review.
The cross-country variation in annual HICP inflation rates has remained significant. Inflation has been most volatile in Bulgaria and Lithuania. In these countries, overheating domestic economies took inflation to double-digit levels in the period up to 2008; it then declined significantly until 2010. Thereafter, inflation in these two countries fluctuated within narrower ranges. In Romania, inflation rates remained persistently high until mid-2011, before declining to lower levels.
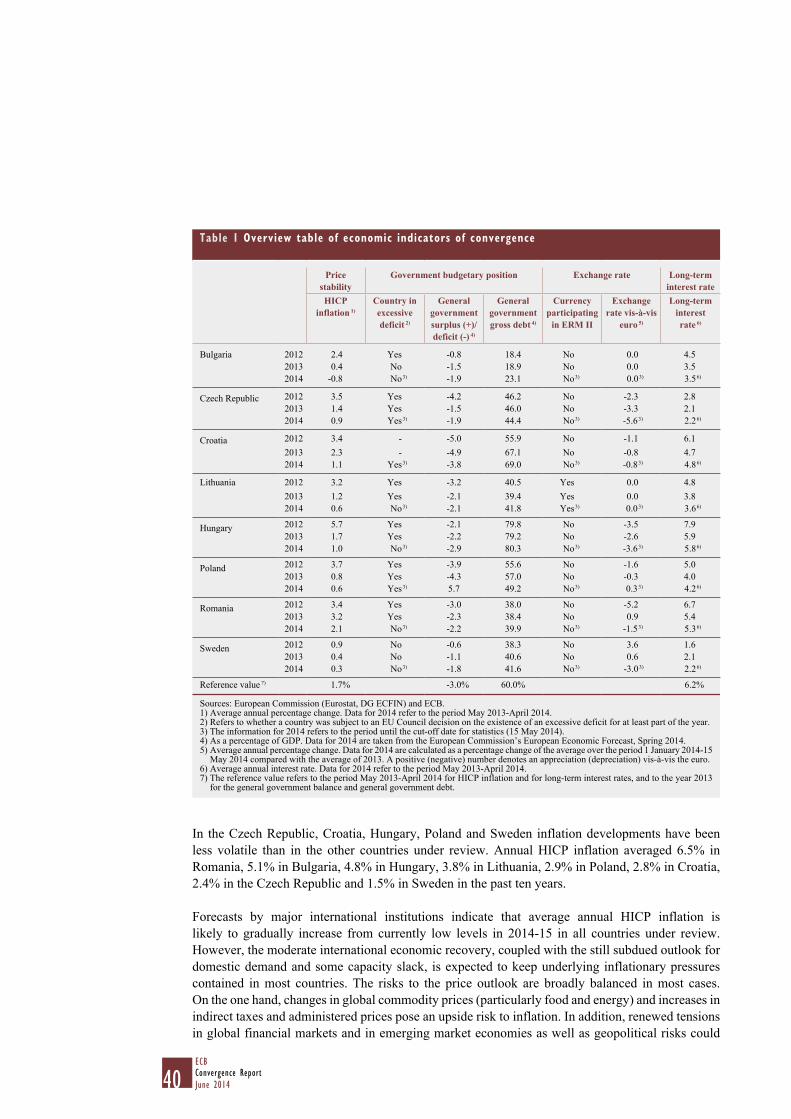
40ECBConvergence ReportJune 2014
In the Czech Republic, Croatia, Hungary, Poland and Sweden inflation developments have been less volatile than in the other countries under review. Annual HICP inflation averaged 6.5% in Romania, 5.1% in Bulgaria, 4.8% in Hungary, 3.8% in Lithuania, 2.9% in Poland, 2.8% in Croatia, 2.4% in the Czech Republic and 1.5% in Sweden in the past ten years.
Forecasts by major international institutions indicate that average annual HICP inflation is likely to gradually increase from currently low levels in 2014-15 in all countries under review. However, the moderate international economic recovery, coupled with the still subdued outlook for domestic demand and some capacity slack, is expected to keep underlying inflationary pressures contained in most countries. The risks to the price outlook are broadly balanced in most cases. On the one hand, changes in global commodity prices (particularly food and energy) and increases in indirect taxes and administered prices pose an upside risk to inflation. In addition, renewed tensions in global financial markets and in emerging market economies as well as geopolitical risks could
Table 1 Overview table of economic indicators of convergence
Price stability
Government budgetary position Exchange rate Long-term interest rate
HICP inflation 1)
Country in excessive deficit 2)
General government surplus (+)/ deficit (-) 4)
General government gross debt 4)
Currency participating
in ERM II
Exchange rate vis-à-vis
euro 5)
Long-term interest rate 6)
Bulgaria 2012 2.4 Yes -0.8 18.4 No 0.0 4.52013 0.4 No -1.5 18.9 No 0.0 3.52014 -0.8 No 3) -1.9 23.1 No 3) 0.0 3) 3.5 6)
Czech Republic 2012 3.5 Yes -4.2 46.2 No -2.3 2.82013 1.4 Yes -1.5 46.0 No -3.3 2.12014 0.9 Yes 3) -1.9 44.4 No 3) -5.6 3) 2.2 6)
Croatia 2012 3.4 - -5.0 55.9 No -1.1 6.12013 2.3 - -4.9 67.1 No -0.8 4.72014 1.1 Yes 3) -3.8 69.0 No 3) -0.8 3) 4.8 6)
Lithuania 2012 3.2 Yes -3.2 40.5 Yes 0.0 4.82013 1.2 Yes -2.1 39.4 Yes 0.0 3.82014 0.6 No 3) -2.1 41.8 Yes 3) 0.0 3) 3.6 6)
Hungary 2012 5.7 Yes -2.1 79.8 No -3.5 7.92013 1.7 Yes -2.2 79.2 No -2.6 5.92014 1.0 No 3) -2.9 80.3 No 3) -3.6 3) 5.8 6)
Poland 2012 3.7 Yes -3.9 55.6 No -1.6 5.02013 0.8 Yes -4.3 57.0 No -0.3 4.02014 0.6 Yes 3) 5.7 49.2 No 3) 0.3 3) 4.2 6)
Romania 2012 3.4 Yes -3.0 38.0 No -5.2 6.72013 3.2 Yes -2.3 38.4 No 0.9 5.42014 2.1 No 3) -2.2 39.9 No 3) -1.5 3) 5.3 6)
Sweden 2012 0.9 No -0.6 38.3 No 3.6 1.62013 0.4 No -1.1 40.6 No 0.6 2.12014 0.3 No 3) -1.8 41.6 No 3) -3.0 3) 2.2 6)
Reference value 7) 1.7% -3.0% 60.0% 6.2%
Sources: European Commission (Eurostat, DG ECFIN) and ECB.1) Average annual percentage change. Data for 2014 refer to the period May 2013-April 2014.2) Refers to whether a country was subject to an EU Council decision on the existence of an excessive deficit for at least part of the year.3) The information for 2014 refers to the period until the cut-off date for statistics (15 May 2014).4) As a percentage of GDP. Data for 2014 are taken from the European Commission’s European Economic Forecast, Spring 2014.5) Average annual percentage change. Data for 2014 are calculated as a percentage change of the average over the period 1 January 2014-15
May 2014 compared with the average of 2013. A positive (negative) number denotes an appreciation (depreciation) vis-à-vis the euro.6) Average annual interest rate. Data for 2014 refer to the period May 2013-April 2014.7) The reference value refers to the period May 2013-April 2014 for HICP inflation and for long-term interest rates, and to the year 2013
for the general government balance and general government debt.
41ECB
Convergence ReportJune 2014
3 THE STATE OF ECONOMIC CONVERGENCEproduce weakening pressures on the currencies of some countries. Furthermore, developments
in the labour market, especially in countries with relatively high structural unemployment and bottlenecks in the faster-growing sectors, constitute an additional upside risk to inflation. On the other hand, a slower than expected recovery in economic activity both domestically and abroad would dampen inflationary pressures. In the central and eastern European countries under review, the ongoing catching-up process may in the longer run lead to renewed upward pressures on prices and/or the nominal exchange rate, although the exact size of this effect is difficult to assess. The risk of renewed inflationary pressures will be particularly high if the next upswing is again accompanied by excessive credit growth and asset price increases fuelled by low real interest rates.
Overall, although the 12-month average rate of HICP inflation is below the reference value in most countries under review, there are concerns regarding the sustainability of inflation convergence in many countries over the longer run. Recent disinflation largely reflects the temporary factors mentioned above. Once the economic recovery gathers momentum and the favourable temporary effects dissipate or even reverse, inflation is expected to rise again.
An environment that is conducive to sustainable price stability in the countries covered in this report requires the pursuit of a stability-oriented monetary policy. Achieving or maintaining an environment supportive of price stability will, in addition, crucially depend on the implementation of further structural reforms. In particular, wage increases should reflect labour productivity growth and take into account labour market conditions and developments in competitor countries. In addition, continued reform effort is needed to further improve the functioning of labour and product markets and maintain favourable conditions for economic expansion and employment growth. To that end, measures to support stronger governance and further improvements in the quality of institutions are also essential. Financial sector policies should be aimed at ensuring that the financial sector makes a sound contribution to economic growth and price stability by preventing episodes of excessive credit growth and the accumulation of financial vulnerabilities. In order to minimise the potential risks to financial stability associated with a large share of loans being denominated in foreign currency, particularly in some of the countries under review, the recommendations of the European Systemic Risk Board (ESRB) on lending in foreign currencies must be implemented in full. In the follow-up report published by the ESRB in November 2013, Bulgaria was considered only partially compliant, Lithuania, Hungary and Sweden largely compliant, and the Czech Republic, Poland and Romania fully compliant with the recommendations. Croatia was not covered in the ESRB report. Close cooperation between supervisors across EU countries is important to ensure the effective implementation of the measures. Moreover, financial stability in all countries under review could benefit from participation in the SSM, which will take up its prudential supervisory tasks in November 2014. Given the limited room for manoeuvre for monetary policy under the tightly managed exchange rate regime in Croatia, as well as the currency board arrangements in Bulgaria and Lithuania, it is imperative that other policy areas support the capacity of the economy to cope with country-specific shocks and to avoid the re-emergence of macroeconomic imbalances.
THE GOVERNMENT BUDGETARY POSITION CRITERIONAt the time of publication of this report, the Czech Republic, Croatia and Poland are subject to an EU Council decision on the existence of an excessive deficit. The deadlines for correcting the excessive deficit situation are as follows: 2013 for the Czech Republic, 2015 for Poland and 2016 for Croatia. All the countries under review, with the exception of Croatia and Poland, posted a fiscal deficit-to-GDP ratio below the 3% reference value in 2013. Croatia and Poland recorded deficits of, respectively, 4.9% and 4.3% of GDP, Romania 2.3% of GDP, Hungary 2.2% of GDP, Lithuania 2.1% of GDP, Bulgaria and the Czech Republic 1.5% of GDP and Sweden 1.1% of GDP.
42ECBConvergence ReportJune 2014
The fiscal balance deteriorated in 2013 compared with 2012 in four countries, mainly reflecting fiscal loosening (Bulgaria, Hungary and Sweden) or a weaker macroeconomic environment (Poland). By contrast, there was continued progress with fiscal consolidation in Lithuania and Romania, for which the respective EDPs were abrogated in June 2013, and in the Czech Republic, which brought its deficit below the 3% of GDP reference value by the 2013 EDP deadline. The deficit-to-GDP ratio in Croatia declined only marginally in 2013.
For 2014, the European Commission forecasts the deficit-to-GDP ratio to remain above the 3% reference value in Croatia (3.8%). Hungary is projected to post a deficit ratio of 2.9% just below the reference value, while all the other countries are projected to stay below (Lithuania and Romania) or well below (Bulgaria, the Czech Republic and Sweden) the reference value. Poland is projected to have a temporary surplus of 5.7% of GDP in 2014, owing to the reversal of the systemic pension reform that includes a one-off asset transfer from the second pension pillar equivalent to about 9% of GDP in 2014.
Government debt-to-GDP ratios increased in 2013 in the countries under review, with the exception of the Czech Republic, Lithuania and Hungary (see Table 1). The increase reflected still large primary deficits and unfavourable interest-growth differentials in some countries, while the deficit-debt adjustment generally had a decreasing impact on the debt ratio. Taking a longer perspective, between 2004 and 2013 government debt-to-GDP ratios increased substantially in Croatia (28.9 percentage points), Lithuania (20.1), Romania (19.7), Hungary (19.7), the Czech Republic (17.1) and Poland (11.3). In Bulgaria and Sweden, by contrast, the 2013 debt-to-GDP ratio stood below that of 2004, by 18.1 and 9.7 percentage points respectively.
For 2014, the European Commission projects a rise in the debt ratio in all countries examined in this report, with the exception of the Czech Republic and Poland. The Commission’s projections also indicate that the debt ratio will remain below the 60% reference value in 2014 in all countries except Croatia and Hungary.
Looking ahead, it is absolutely essential for the countries examined to achieve and maintain sound and sustainable fiscal positions. Countries that are subject to an EU Council decision on the existence of an excessive deficit must comply with their EDP commitments in a credible and timely manner in order to bring their budget deficits below the reference value in accordance with the agreed deadline. Further consolidation is also required in those other countries that have yet to attain their medium-term budgetary objectives. In this respect, particular attention should be paid to limiting expenditure growth to a rate below the medium-term potential economic growth rate, in line with the expenditure benchmark rule of the revised Stability and Growth Pact. Moreover, beyond the transition period provided for under the Pact, countries whose debt-to-GDP ratio is likely to exceed the reference value should ensure that the ratio is declining sufficiently, in accordance with the provisions of the enhanced Pact. Further consolidation would also make it easier to deal with the budgetary challenges related to the ageing of the population. Strong national fiscal frameworks that are fully in line with EU rules should support fiscal consolidation and limit slippages in public expenditure, while helping to prevent a re-emergence of macroeconomic imbalances. Overall, such strategies should be embedded in comprehensive structural reforms to increase potential growth and employment.
43ECB
Convergence ReportJune 2014
3 THE STATE OF ECONOMIC CONVERGENCETHE EXCHANGE RATE CRITERION
Among the countries examined in this report, only Lithuania currently participates in ERM II. The Lithuanian litas joined ERM II on 28 June 2004 and thus had been participating in ERM II for more than two years prior to the convergence examination, as laid down in Article 140 of the Treaty. The agreement on participation in ERM II was based on a number of policy commitments by the Lithuanian authorities, relating to, among other things, pursuing sound fiscal policies, containing credit growth and implementing further structural reforms. In addition, it was accepted that Lithuania join ERM II with its existing currency board arrangement in place. This commitment imposed no additional obligations on the ECB.
The central rate of the Lithuanian litas within ERM II remained unchanged in the reference period from 16 May 2012 to 15 May 2014. The Lithuanian litas traded continuously at its central rate, and market conditions in Lithuania were, overall, stable throughout the period, as also reflected in low short-term interest rate differentials vis-à-vis the euro area.
The Bulgarian currency did not participate in ERM II but its exchange rate was fixed to the euro within the framework of a currency board agreement in an environment of mostly low short-term interest rate differentials vis-à-vis the euro area.
The Croatian kuna and the Romanian leu traded under a flexible exchange rate regime involving a managed float vis-à-vis the euro. In the case of the Croatian kuna, this was reflected in low exchange rate volatility compared with the other flexible currencies outside ERM II, while short-term interest rate differentials vis-à-vis the euro area were relatively high. The exchange rate of the Romanian leu against the euro showed a relatively high degree of volatility, with short-term interest rate differentials vis-à-vis the euro area remaining at high levels throughout the reference period. In 2009, Romania was granted an international financial assistance package, led by the EU and the IMF, followed by a precautionary financial assistance programme in 2011 and a successor programme in 2013. However, during the reference period Romania did not draw on the resources of the precautionary arrangements. As these agreements have helped reduce financial vulnerabilities, they might also have contributed to reducing exchange rate pressures over the reference period.
TheCzechkorunatradedunderaflexibleexchangerateregime.However,inNovember2013Českánárodníbankaintervenedinforeignexchangemarketsinordertoweakenthekorunaandcommitteditself to not allowing the exchange rate of the koruna to appreciate beyond a certain level against the euro. This decision was taken as part of the central bank’s efforts to maintain price stability. Overall, the exchange rate of the koruna against the euro was subject to a relatively high degree of volatility in the reference period, while short-term interest rate differentials vis-à-vis the euro area were relatively small.
The Hungarian forint and the Polish zloty both traded under a flexible exchange rate regime, with high volatility of the exchange rate amid high short-term interest rate differentials vis-à-vis the euro area. In 2008, repurchase agreements providing access to euro liquidity were announced between the Magyar Nemzeti Bank and the ECB as well as between Narodowy Bank Polski and the ECB. In the case of Poland, a Flexible Credit Line arrangement with the IMF, designed to meet the demand for crisis-prevention and crisis-mitigation lending, was in place over the reference period. Poland has not received any disbursements from this instrument. As these arrangements have helped to reduce risks related to financial vulnerabilities, they might also have contributed to reducing the risk of exchange rate pressures.
44ECBConvergence ReportJune 2014
The Swedish krona traded under a flexible exchange rate regime amid high exchange rate volatility and relatively low short-term interest rate differentials vis-à-vis the euro area. Over the reference period, Sveriges Riksbank maintained a swap agreement with the ECB which, as it has helped to reduce financial vulnerabilities, might also have had an impact on the exchange rate of the Swedish krona against the euro.
THE LONG-TERM INTEREST RATE CRITERIONDuring the reference period, on average, long-term interest rate spreads vis-à-vis the euro area average tightened or remained broadly stable in most of the countries under review, partly reflecting a reduction in investor risk aversion. Financial markets still differentiated between countries on the basis of their external and internal vulnerabilities, including the developments in budgetary performance and the prospects for sustainable convergence.
Over the 12-month reference period from May 2013 to April 2014, the reference value for long-term interest rates was 6.2%. This value was calculated by adding 2 percentage points to the unweighted arithmetic average of the long-term interest rates of the three best performing Member States in terms of price stability, namely Latvia (3.3%), Ireland (3.5%) and Portugal (5.8%). During the reference period, the euro area average long-term interest rate and the long-term AAA yield, which are included for illustrative purposes only, stood respectively at 2.9% and 1.9%.
Over the reference period, all eight Member States under examination had average long-term interest rates that were – to different degrees – below the 6.2% reference value for the interest rate convergence criterion (see Table 1).
OTHER RELEVANT FACTORSArticle 140 of the Treaty requires the examination of other factors relevant to economic integration and convergence. Examining these additional factors is important, as they provide information that is relevant to assessing whether the integration of a Member State into the euro area is likely to be sustainable over time. These additional factors include the integration of markets, the situation and development of the balance of payments, and the development of unit labour costs and other price indices.
Moreover, in order to ensure closer coordination of economic policies and sustained convergence of the economic performances of the EU Member States (Article 121(3) of the Treaty), a surveillance procedure for the prevention and correction of macroeconomic imbalances, the macroeconomic imbalance procedure (MIP), entered into force in 2011.2 The first step in this annual procedure is an Alert Mechanism Report prepared by the European Commission for the early detection and monitoring of possible macroeconomic imbalances. The latest Alert Mechanism Report was published by the Commission on 13 November 2013 and includes a qualitative economic and financial assessment based on, among other things, an indicative and transparent scoreboard with a set of indicators, the values of which are compared with their indicative thresholds as provided for in EU Regulation 1176/2011 (see Table 2).3 This is followed by an in-depth review which the Commission undertakes for each Member State that it considers may be affected by, or may be at risk of being affected by, imbalances.
2 Regulation (EU) No 1176/2011 of the European Parliament and of the Council of 16 November 2011 on the prevention and correction of macroeconomic imbalances.
3 The scoreboard published in the above-mentioned Alert Mechanism Report provided figures for the year 2012. By contrast, Table 2 provides a scoreboard for the period 2011-13, as available at the cut-off date of this report, i.e. 15 May 2014.
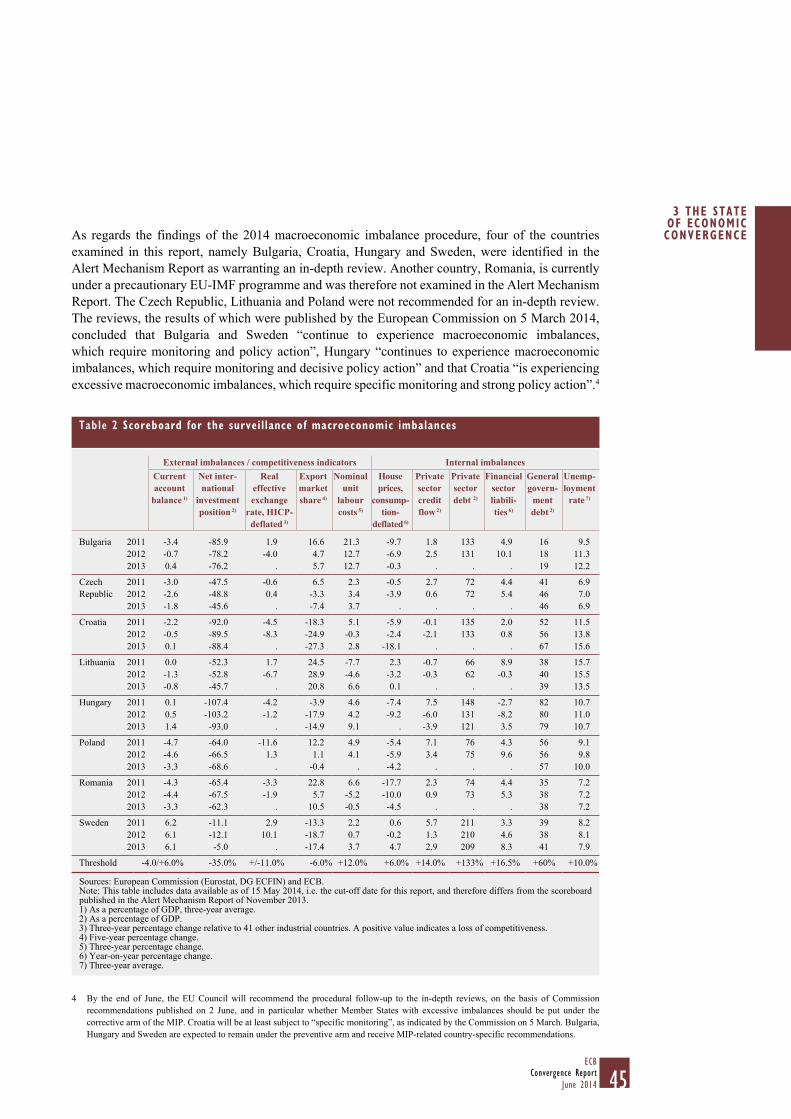
45ECB
Convergence ReportJune 2014
3 THE STATE OF ECONOMIC CONVERGENCEAs regards the findings of the 2014 macroeconomic imbalance procedure, four of the countries
examined in this report, namely Bulgaria, Croatia, Hungary and Sweden, were identified in the Alert Mechanism Report as warranting an in-depth review. Another country, Romania, is currently under a precautionary EU-IMF programme and was therefore not examined in the Alert Mechanism Report. The Czech Republic, Lithuania and Poland were not recommended for an in-depth review. The reviews, the results of which were published by the European Commission on 5 March 2014, concluded that Bulgaria and Sweden “continue to experience macroeconomic imbalances, which require monitoring and policy action”, Hungary “continues to experience macroeconomic imbalances, which require monitoring and decisive policy action” and that Croatia “is experiencing excessive macroeconomic imbalances, which require specific monitoring and strong policy action”.4
4 By the end of June, the EU Council will recommend the procedural follow-up to the in-depth reviews, on the basis of Commission recommendations published on 2 June, and in particular whether Member States with excessive imbalances should be put under the corrective arm of the MIP. Croatia will be at least subject to “specific monitoring”, as indicated by the Commission on 5 March. Bulgaria, Hungary and Sweden are expected to remain under the preventive arm and receive MIP-related country-specific recommendations.
Table 2 Scoreboard for the surveillance of macroeconomic imbalances
External imbalances / competitiveness indicators Internal imbalancesCurrent account
balance 1)
Net inter-national
investment position 2)
Real effective exchange
rate, HICP-deflated 3)
Export market share 4)
Nominal unit
labour costs 5)
House prices,
consump-tion-
deflated 6)
Private sector credit flow 2)
Private sector debt 2)
Financial sector liabili- ties 6)
General govern-
ment debt 2)
Unemp-loyment
rate 7)
Bulgaria 2011 -3.4 -85.9 1.9 16.6 21.3 -9.7 1.8 133 4.9 16 9.52012 -0.7 -78.2 -4.0 4.7 12.7 -6.9 2.5 131 10.1 18 11.32013 0.4 -76.2 . 5.7 12.7 -0.3 . . . 19 12.2
Czech Republic
2011 -3.0 -47.5 -0.6 6.5 2.3 -0.5 2.7 72 4.4 41 6.92012 -2.6 -48.8 0.4 -3.3 3.4 -3.9 0.6 72 5.4 46 7.02013 -1.8 -45.6 . -7.4 3.7 . . . . 46 6.9
Croatia 2011 -2.2 -92.0 -4.5 -18.3 5.1 -5.9 -0.1 135 2.0 52 11.52012 -0.5 -89.5 -8.3 -24.9 -0.3 -2.4 -2.1 133 0.8 56 13.82013 0.1 -88.4 . -27.3 2.8 -18.1 . . . 67 15.6
Lithuania 2011 0.0 -52.3 1.7 24.5 -7.7 2.3 -0.7 66 8.9 38 15.72012 -1.3 -52.8 -6.7 28.9 -4.6 -3.2 -0.3 62 -0.3 40 15.52013 -0.8 -45.7 . 20.8 6.6 0.1 . . . 39 13.5
Hungary 2011 0.1 -107.4 -4.2 -3.9 4.6 -7.4 7.5 148 -2.7 82 10.72012 0.5 -103.2 -1.2 -17.9 4.2 -9.2 -6.0 131 -8.2 80 11.02013 1.4 -93.0 . -14.9 9.1 . -3.9 121 3.5 79 10.7
Poland 2011 -4.7 -64.0 -11.6 12.2 4.9 -5.4 7.1 76 4.3 56 9.12012 -4.6 -66.5 1.3 1.1 4.1 -5.9 3.4 75 9.6 56 9.82013 -3.3 -68.6 . -0.4 . -4.2 . . . 57 10.0
Romania 2011 -4.3 -65.4 -3.3 22.8 6.6 -17.7 2.3 74 4.4 35 7.22012 -4.4 -67.5 -1.9 5.7 -5.2 -10.0 0.9 73 5.3 38 7.22013 -3.3 -62.3 . 10.5 -0.5 -4.5 . . . 38 7.2
Sweden 2011 6.2 -11.1 2.9 -13.3 2.2 0.6 5.7 211 3.3 39 8.22012 6.1 -12.1 10.1 -18.7 0.7 -0.2 1.3 210 4.6 38 8.12013 6.1 -5.0 . -17.4 3.7 4.7 2.9 209 8.3 41 7.9
Threshold -4.0/+6.0% -35.0% +/-11.0% -6.0% +12.0% +6.0% +14.0% +133% +16.5% +60% +10.0%
Sources: European Commission (Eurostat, DG ECFIN) and ECB.Note: This table includes data available as of 15 May 2014, i.e. the cut-off date for this report, and therefore differs from the scoreboard published in the Alert Mechanism Report of November 2013.1) As a percentage of GDP, three-year average.2) As a percentage of GDP.3) Three-year percentage change relative to 41 other industrial countries. A positive value indicates a loss of competitiveness.4) Five-year percentage change.5) Three-year percentage change.6) Year-on-year percentage change.7) Three-year average.
46ECBConvergence ReportJune 2014
A condensed, preliminary and not exhaustive reading of country imbalances is provided by the above-mentioned scoreboard. Regarding external imbalances, after having adjusted sharply in recent years in most countries, the scoreboard shows that current account balances (the three-year average of the current account balance as a percentage of GDP) improved further in 2013 in Bulgaria and Croatia, where they moved into surplus, as well as in the Czech Republic, Lithuania, Poland and Romania. Sweden and Hungary have recorded persistent current account surpluses which have been particularly large in Sweden, above the 6% of GDP indicative threshold, in the past few years.
The net international investment position as a share of GDP has stayed at high negative levels, beyond the indicative threshold of -35% of GDP, in all countries under review except Sweden. In 2013, those negative levels were very high in Bulgaria, Croatia and Hungary, where despite recent improvements they exceeded -75% of GDP, while in Poland and Romania they exceeded -60% of GDP. They reflect past current account deficits, high levels of foreign direct investment in the economy as well as more volatile other investment (in particular in the form of loans and deposits) which accumulated mainly before the global financial and economic crisis.
In terms of price and cost competitiveness, the global crisis halted a general trend of declining competitiveness in several countries under review. Between 2009 and 2012 real effective exchange rates depreciated to different degrees in Bulgaria, Croatia, Lithuania, Hungary and Romania. The Czech Republic, Poland and Sweden recorded an exchange rate appreciation in real effective terms. The cumulative three-year growth rate in unit labour costs, which in the pre-crisis years stood at very high levels in all countries under review except the Czech Republic, remained strong and even increased in 2013 in most countries, with the main exception of Romania. In Bulgaria, the growth in unit labour costs remained stable in 2013 above the scoreboard’s indicative threshold of 12%. Finally, export market shares increased markedly (in value terms) over the five years until 2013 in Lithuania and, to a lesser extent, in Bulgaria and Romania. In the other countries under review export market shares decreased; in the case of the Czech Republic, Croatia, Hungary and Sweden by more than the 6% indicative threshold (i.e. by 7.4%, 27.3%, 14.9% and 17.4% respectively).
Turning to the scoreboard indicators of possible internal imbalances, a relatively long period of credit expansion prior to the global financial and economic crisis left economic agents, with the main exception of the financial sector, with high levels of accumulated debt. High indebtedness, particularly in the private sector, constitutes a key vulnerability in several countries under review. In Sweden, the level of private sector debt stood above the indicative threshold of 133% of GDP in 2013; it was at the threshold in Croatia in 2012. Public debt-to-GDP ratios have also increased in several countries, although from relatively low levels, in the aftermath of the global financial and economic crisis. High domestic indebtedness, particularly in connection with a relatively high level of external debt, makes economies vulnerable to contagion from stress in financial markets. Through its potentially negative impact on funding, as well as owing to the need for deleveraging, high indebtedness also weakens sustainable output growth. Furthermore, the prevalence of foreign currency loans in several countries under review represents a macroeconomic and financial risk, as it exposes unhedged borrowers to exchange rate risk. Risks stemming from foreign currency mismatches are large in Croatia, Hungary, Poland and Romania, notably affecting households, and, in Croatia and Hungary, also the public sector. In Bulgaria and Lithuania, where foreign currency lending accounts for an even greater share of banks’ total loan portfolio, this lending is largely denominated in euro and the central banks are strongly committed to maintaining euro-based currency boards.
47ECB
Convergence ReportJune 2014
3 THE STATE OF ECONOMIC CONVERGENCEIn all countries under review house price developments reflect a – in some cases substantial –
downward correction from the high levels reached in the pre-crisis phase. Further adjustments/declines in house prices remain a risk in some countries.
In the labour market, the adjustment process has been translated into a relatively high level of unemployment, which in 2013 stood at or above the indicative threshold of 10% (three-year average) in Bulgaria (12.2%), Croatia (15.6%), Lithuania (13.5%), Hungary (10.7%) and Poland (10.0%). Persistently high unemployment – which has generally been accompanied by a worsening of skill and/or geographical mismatches – remains a key vulnerability in many countries and poses a risk to the convergence of real incomes, also in view of adverse demographic trends.
The indications based on a mechanical reading of the scoreboard should not be interpreted as conclusive evidence of the existence of imbalances. For example, a mechanical reading of the scoreboard could mask the existence of imbalances and vulnerabilities in the more recent period, as three or five-year averages are strongly influenced by the sharp post-crisis adjustment, which might not be sustainable in the future. Not least for this reason, additional factors have to be taken into account in the context of the in-depth reviews, including the evolution of indicators over time, as well as the most recent developments and outlook.
The strength of the institutional environment, including in the area of statistics, is another important, complementary variable to be examined as an additional factor relevant to the sustainability of economic integration and convergence. In certain central and eastern European countries under review, removing the existing rigidities and impediments to the efficient use and allocation of production factors would help to enhance economic potential. These reflect weaknesses in the business environment, the relatively low quality of institutions, weak governance and corruption. By hampering potential output growth, the institutional environment may also undermine a country’s debt-servicing ability and make economic adjustments more difficult. It may also affect a country’s ability to implement necessary policy measures.
Chart 1 shows the current ranking of the 28 Member States of the EU, as reported by various international organisations in the following reports: the Worldwide Governance Indicators, the Global Competitiveness Report (World Economic Forum), the Corruption Perceptions Index (Transparency International) and the Doing Business Report (World Bank and International Finance Corporation). These indicators provide mostly qualitative information and, in some cases, reflect perceptions rather than observed facts. Nevertheless, taken as a whole, they summarise a broad set of highly relevant information on the quality of the institutional environment. The average of those ranks in 2013 and five years earlier, based on ECB calculations, is reported in Chart 2.
It can be seen that, with the notable exception of Sweden, which ranks second among all EU Member States,inallthecountriesunderreview−despitesignificantdifferencesbetweenthem−thequalityof institutions and governance is reported as being relatively weak, on average, compared with most euro area countries. After Sweden, among the countries under review, Lithuania and Poland occupied the 14th and 16th positions respectively among EU countries in 2013. Bulgaria, Croatia and Romania, respectively in 25th, 26th and 27th position, are almost at the bottom of the ranking. Furthermore, as reported in Chart 2, no significant improvements have been made over the last five years in the countries under review – other than in Lithuania, Poland and to a lesser extent Bulgaria – in comparison with developments in other Member States.
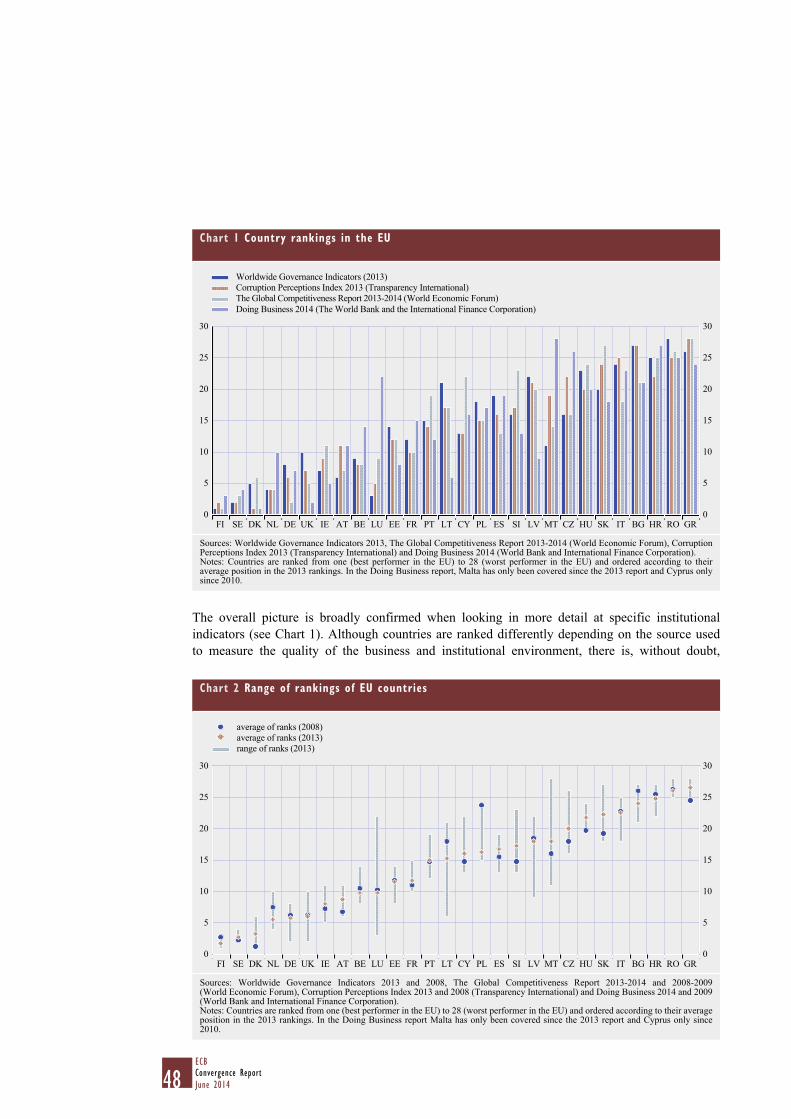
48ECBConvergence ReportJune 2014
The overall picture is broadly confirmed when looking in more detail at specific institutional indicators (see Chart 1). Although countries are ranked differently depending on the source used to measure the quality of the business and institutional environment, there is, without doubt,
Chart 2 Range of rankings of EU countries
0
5
10
15
20
25
30
0
5
10
15
20
25
30
FI SE DK NL DE UK IE AT BE LU EE FR PT LT CY PL ES SI LV MT CZ HU SK IT BG HR RO GR
average of ranks (2008)average of ranks (2013)range of ranks (2013)
Sources: Worldwide Governance Indicators 2013 and 2008, The Global Competitiveness Report 2013-2014 and 2008-2009 (World Economic Forum), Corruption Perceptions Index 2013 and 2008 (Transparency International) and Doing Business 2014 and 2009 (World Bank and International Finance Corporation).Notes: Countries are ranked from one (best performer in the EU) to 28 (worst performer in the EU) and ordered according to their average position in the 2013 rankings. In the Doing Business report Malta has only been covered since the 2013 report and Cyprus only since 2010.
Chart 1 Country rankings in the EU
0
5
10
15
20
25
30
0
5
10
15
20
25
30
FI SE DK NL DE UK IE AT BE LU EE FR PT LT CY PL ES SI LV MT CZ HU SK IT BG HR RO GR
Worldwide Governance Indicators (2013)Corruption Perceptions Index 2013 (Transparency International)The Global Competitiveness Report 2013-2014 (World Economic Forum)Doing Business 2014 (The World Bank and the International Finance Corporation)
Sources: Worldwide Governance Indicators 2013, The Global Competitiveness Report 2013-2014 (World Economic Forum), Corruption Perceptions Index 2013 (Transparency International) and Doing Business 2014 (World Bank and International Finance Corporation).Notes: Countries are ranked from one (best performer in the EU) to 28 (worst performer in the EU) and ordered according to their average position in the 2013 rankings. In the Doing Business report, Malta has only been covered since the 2013 report and Cyprus only since 2010.
49ECB
Convergence ReportJune 2014
3 THE STATE OF ECONOMIC CONVERGENCEstill significant room for improvement in this field in most countries under review. For example, the
business environment is regarded as particularly positive in Lithuania, which in 2013 ranked sixth among the EU countries in the Doing Business report. Yet the relatively weak overall performance in terms of governance in Lithuania, which is in 21st position in the Worldwide Governance Indicators, makes a stronger institutional environment desirable.
Improving the local institutions, governance and business environment, along with further progress with the privatisation of state-owned enterprises and reinforced efforts to enhance the absorption of EU funds, would help to speed up productivity growth by, among other things, increasing competition in key regulated sectors (e.g. energy, transport), diminishing barriers to entry and encouraging much-needed private investment.
Finally, institutional features relating to the quality of the statistics are also essential to support a smooth convergence process. This applies to, among other things, the specification of the legal independence of the national statistical authority, its administrative supervision and budget autonomy, its legal mandate for data collection and its legal provisions governing statistical confidentiality, which are described in more detail in Section 9 of Chapter 5.

51ECB
Convergence ReportJune 2014
4 COUNTRYSUMMARIES
4.1 BULGARIA
Over the reference period from May 2013 to April 2014, the 12-month average rate of HICP inflation in Bulgaria was -0.8%, i.e. well below the reference value of 1.7% for the criterion on price stability.
Looking back over a longer period, consumer price inflation in Bulgaria has been volatile, ranging from 0.4% to 12.0% on an annual basis over the past ten years. The increase in inflation in 2004-08 reflected adjustments in administered prices, the harmonisation of excise duties with EU levels, a series of supply-side shocks and increasing demand pressures. The sharp fall in inflation in 2009 was partly a result of lower commodity prices and the contraction in economic activity. In 2010 and 2011 inflation gradually picked up again, to 3.0% and 3.4% respectively, largely reflecting higher commodity prices and increases in the excise duty on tobacco. Thereafter, the easing of commodity price pressures combined with weak internal and external demand resulted in a gradual decline in inflation. In addition to the low underlying level of inflation, significant cuts in administered prices further contributed to the historically low levels of inflation reached in 2013. Growth in nominal unit labour costs declined from a peak of 12.6% in 2008 to 2.5% in 2011, but picked up again to 5.2% in 2013. Looking at recent developments, the annual HICP inflation rate has followed a downward trend, declining from 1.0% in May 2013 to a low of -2.1% in February 2014, after which it started to recover somewhat, to stand at -1.3% in April. These developments were partially driven by the downward trend in international prices for food and energy products and, to a lesser extent, by an effective exchange rate appreciation. In addition, exceptional domestic factors exerted considerable downward pressure on inflation. These factors include a reduction in administered electricity prices for households, as well as cuts in other administered prices, falling prices in transport and health services and a good harvest which contributed to falls in food prices.
The latest available forecasts from major international institutions project inflation to increase gradually in 2014-15 from very negative levels currently and range from -0.8% to 0.9% in 2014 and from 0.9% to 2.3% in 2015. Risks to the inflation outlook appear to be broadly balanced in the near to medium term. Downside risks stem from weaker than expected domestic demand and the external environment. However, international commodity prices and a cessation or reversal of recent administered prices cuts could pose an upside risk. Looking further ahead, maintaining low inflation rates on a sustainable basis in Bulgaria will be challenging in the medium term, given the limited scope for active monetary policy under the existing currency board arrangement. The catching-up process is likely to have a bearing on inflation over the medium term since GDP per capita and price levels are still significantly lower in Bulgaria than in the euro area. However, it is difficult to assess the exact size of the inflation effect resulting from this catching-up process. Once the economic recovery gains momentum and the income convergence progresses, price level convergence is likely to continue. This, in turn, would manifest itself in terms of higher domestic inflation, given the fixed nominal exchange rate. In the context of the process of economic convergence, the recurrence of significant demand pressures cannot be completely ruled out, although the ongoing deleveraging process reduces this risk for the near future. In the light of the currency board arrangement and the limited impact of alternative counter-cyclical policy instruments, it may prove difficult to prevent another build-up of macroeconomic imbalances, including high rates of inflation.
Overall, although the 12-month average rate of HICP inflation in Bulgaria is currently well below the reference value, there are concerns regarding the sustainability of inflation convergence.
Bulgaria is not currently subject to an EU Council decision on the existence of an excessive deficit. In the reference year 2013 the general government budget balance recorded a deficit of 1.5% of
4 COUNTRY SUMMARIES
52ECBConvergence ReportJune 2014
GDP, i.e. well below the 3% reference value. The general government gross debt-to-GDP ratio was 18.9%, i.e. well below the 60% reference value. In 2014 the deficit ratio is forecast by the European Commission to increase to 1.9% and the government debt ratio to 23.1%. With regard to other fiscal factors, the deficit ratio did not exceed the ratio of public investment to GDP in 2013. Importantly, Bulgaria must ensure sufficient progress is made towards meeting its medium-term objective (a structural deficit of 1.0% of GDP) and maintain sound fiscal policies thereafter. It also needs to address a number of fiscal challenges, as described in Chapter 5.
In the two-year reference period the Bulgarian lev did not participate in ERM II, but its exchange rate was fixed at 1.95583 levs per euro within the framework of a currency board arrangement adopted in July 1997. Short-term interest rate differentials against the three-month EURIBOR stood at a sizeable level of 1.9 percentage points in the three-month period ending in June 2012, but declined to a relatively low level of 0.6 percentage point in the three-month period ending in March 2014. In a longer-term context, in April 2014 both the real effective exchange rate and the real bilateral exchange rate of the Bulgarian lev against the euro stood close to the corresponding ten-year historical averages. As regards other external developments, the deficit in the combined current and capital account of the balance of payments widened progressively between 2004 and 2007. After a strong fall in domestic demand, the deficit decreased substantially in 2009, and the combined current and capital account turned into a small surplus from 2011. At the same time Bulgaria’s net international investment position, which had also deteriorated sharply from -30.1% of GDP in 2004 to -101.8% in 2009, improved steadily to reach -78.2% in 2012 and -76.2.% in 2013. However, the country’s net foreign liabilities are still very high, with foreign direct investment accounting for the largest part of gross foreign liabilities. Fiscal and structural policies therefore continue to be important for supporting external sustainability and the competitiveness of the economy.
Long-term interest rates were 3.5% on average over the reference period from May 2013 to April 2014 and were thus well below the 6.2% reference value for the long-term interest rate convergence criterion. Long-term interest rates have been stabilising in Bulgaria in recent years and, at the end of the reference period, stood at 3.4%. The long-term interest rate differential with respect to the euro area narrowed significantly to around zero towards the end of 2012 and increased slightly thereafter. The differential with the euro area average was only 1.0 percentage point (and 1.7 percentage points with respect to the AAA euro area yield) at the end of the reference period.
Achieving an environment that is conducive to sustainable convergence in Bulgaria requires, among other things, economic policies that are geared towards ensuring overall macroeconomic stability, including sustainable price stability. With regard to macroeconomic imbalances, the European Commission selected Bulgaria for an in-depth review in its Alert Mechanism Report 2014 and concluded that “Bulgaria continues to experience macroeconomic imbalances, which require monitoring and policy action”. At the same time, given the limited room for manoeuvre for monetary policy under the currency board arrangement, it is imperative that other policy areas provide the economy with the wherewithal to cope with country-specific shocks in order to prevent the reoccurrence of macroeconomic imbalances. Specifically, Bulgaria needs to deal with a wide range of economic policy challenges that are described in more detail in Chapter 5.
Bulgarian law does not comply with all the requirements for central bank independence, the monetary financing prohibition, and legal integration into the Eurosystem. Bulgaria is an EU Member State with a derogation and must therefore comply with all adaptation requirements under Article 131 of the Treaty.
53ECB
Convergence ReportJune 2014
4 COUNTRYSUMMARIES
4.2 CZECH REPUBLIC
Over the reference period from May 2013 to April 2014, the 12-month average rate of HICP inflation in the Czech Republic was 0.9%, i.e. well below the reference value of 1.7% for the criterion on price stability.
Looking back over a longer period, annual consumer price inflation in the Czech Republic fluctuated in a range from 1.6% to 3% during the period 2004-07. After peaking in 2008, inflation fell markedly in the wake of the financial crisis and started to pick up gradually in late 2009 and then slowed again in 2013, to stand at 1.4%. Inflation developments over the past ten years should be viewed against the background of sustained economic growth, which was only interrupted in 2008-09 and 2012-13. For most of the period under review, growth in compensation per employee exceeded labour productivity growth. Growth in unit labour costs slowed and temporarily fell into negative territory in the aftermath of the crisis, before accelerating again in 2012. In 2013 growth in unit labour costs was slightly below zero, owing to a significant decline in compensation per employee. The fall in import prices throughout most of the period from 2005 to 2010 and the rise from 2011 were largely due to the appreciation and subsequent depreciation of the koruna compounded by a surge in global commodity prices over the period 2011-12. At the end of 2013, growth in import prices picked up, owingtoaweakenedkoruna.ThedepreciationofthekorunafollowedtheinterventionbyČeskánárodníbankainNovember2013toweakenthedomesticcurrencyandthecommitmentnottoletthe koruna appreciate against the euro beyond a certain level. This decision was taken as part of the central bank’s efforts to maintain price stability. Looking at recent developments, the annual rate of HICP inflation decelerated significantly in early 2014 owing to the fading effects of past increases in indirect taxes and a sharp decline in regulated prices for electricity. In April 2014 inflation stood at 0.2%.
The latest available forecasts from major international institutions project inflation to increase gradually in 2014-15, ranging from 0.1% to 1.0% and from 1.8% to 2.2%. A sizeable fall in administered price growth and an unwinding of the first-round effects of the 2013 hike in the value added tax (VAT) rate are expected to dampen inflationary pressures in 2014. However, stronger domestic demand and higher prices for imported goods are expected to drive up inflation towards the 2% target over the forecast horizon. Risks to the inflation outlook are balanced. Upside risks are associated with larger than expected hikes in commodity prices, while downside risks relate mainly to weaker than expected economic activity. Looking further ahead, the catching-up process may have a bearing on inflation and/or on the nominal exchange rate over the coming years, given that GDP per capita and price levels are still lower in the Czech Republic than in the euro area. However, it is difficult to assess the exact size of the effect resulting from this catching-up process.
The Czech Republic is currently subject to an EU Council decision on the existence of an excessive deficit, with a deadline of 2013 for correcting it. In the reference year 2013 the general government budget balance recorded a deficit of 1.5% of GDP, i.e. well below the 3% reference value. The general government gross debt-to-GDP ratio was 46.0% of GDP, i.e. below the 60% reference value. In 2014 the deficit ratio is forecast by the European Commission to increase to 1.9% of GDP and the government debt ratio to decline to 44.4% of GDP. With regard to other fiscal factors, the deficit ratio did not exceed the ratio of public investment to GDP in 2013. Importantly, the Czech Republic must ensure the durable correction of the excessive deficit and make sufficient progress towards meeting its medium-term objective (a structural deficit of 1.0% of GDP), as well as maintaining sound fiscal policies thereafter. It also needs to address a number of fiscal challenges, as described in Chapter 5.
54ECBConvergence ReportJune 2014
In the two-year reference period, the Czech koruna did not participate in ERM II, but traded under aflexibleexchangerateregime.However,inNovember2013Českánárodníbankaannouncedthatit would intervene in foreign exchange markets with the goal of weakening the koruna in order to prevent a long-term undershooting of the inflation target and made a commitment not to let the exchange rate of the koruna against the euro appreciate beyond a certain level. The exchange rate of the Czech koruna against the euro was, on average, subject to a relatively high degree of volatility. After appreciating up to September 2012, the Czech koruna depreciated gradually until November 2013. Thereafter it depreciated further to a level in line with the floor set by Česká národní banka.Over the reference period short-term interest rate differentials against the three-month EURIBOR were overall small, and stood at 0.1 percentage point in the three-month period ending in March 2014. In a longer-term context, in April 2014 both the real effective exchange rate and the real bilateral exchange rate of the Czech koruna against the euro stood close to the corresponding ten-year historical averages. With regard to other external developments, the Czech Republic recorded a widening deficit in the combined current and capital account of its balance of payments between 2005 and 2007, which then went on to adjust in 2008 and 2009 owing to a sharp fall in domestic demand. Following an increase in the deficit in 2010, the external balance improved further to 0.0% of GDP in 2012 and recorded a surplus of 0.5% in 2013 owing to a rising surplus in the trade in goods balance. At the same time the country’s net international investment position deteriorated substantially from -28.2% of GDP in 2004 to -48.8% of GDP in 2012, before improving to -45.6 % of GDP in 2013.
Long-term interest rates were 2.2% on average over the reference period from May 2013 to April 2014 and were thus well below the 6.2% reference value for the interest rate convergence criterion. In recent years, long-term interest rates in the Czech Republic have been on a strong downward trend since peaking at 5.5% in June 2009, with bond yields exhibiting some of the volatile behaviour also observed in other countries in the context of the euro area sovereign debt crisis. At the end of the reference period, long-term interest rates stood at 2.0%. The decline in long-term interest rates from 2009, coupled with high long-term interest rates in the euro area, caused the interest rate differential to narrow and turn significantly negative; in August 2012 it stood at -1.5 percentage points. Subsequently, long-term interest rates in the Czech Republic fell less sharply than those in the euro area, and the spread narrowed to stand at about -0.4 percentage point (and 0.3 percentage point with respect to the AAA euro area yield) at the end of the reference period.
Achieving an environment that is conducive to sustainable convergence in the Czech Republic requires, among other things, maintaining a price stability-oriented monetary policy in the medium term. Regarding macroeconomic imbalances, the European Commission did not select the Czech Republic for an in-depth review in its Alert Mechanism Report 2014. Nevertheless, the Czech Republic needs to deal with a wide range of economic policy challenges, which are described in more detail in Chapter 5.
Czech law does not comply with all the requirements for central bank independence, confidentiality, the monetary financing prohibition and legal integration into the Eurosystem. The Czech Republic is an EU Member State with a derogation and must therefore comply with all adaptation requirements under Article 131 of the Treaty.
55ECB
Convergence ReportJune 2014
4 COUNTRYSUMMARIES
4.3 CROATIA1
Over the reference period from May 2013 to April 2014, the 12-month average rate of HICP inflation in Croatia was 1.1%, i.e. well below the reference value of 1.7% for the criterion on price stability.
Looking back over a longer period, consumer price inflation in Croatia fluctuated between annual averages of 1.1% and 5.8% over the past ten years. Having hovered around 2-3% during the period 2004-07, inflation exceeded 5% in 2008, before returning to more moderate levels. During the period 2004-08 there was a build-up of domestic demand pressures, which was driven by strong credit growth. At the same time, robust wage growth was eroding competitiveness. These macroeconomic developments proved to be unsustainable, and the global financial crisis pushed Croatia’s economy into a lasting recession in 2009. Consequently, the annual rate of HICP inflation decelerated, bottoming out at 1.1% in 2010. Thereafter it gradually picked up again, to stand at 3.4% in 2012, owing to increases in food, energy and administered prices, as well as to hikes in the value added tax (VAT) and excise duties, before slowing to 2.3% in 2013 as the effects of these increases faded. Looking at recent developments, the annual rate of HICP inflation moved temporarily into slightly negative territory in early 2014, to stand at -0.1% in April. This marked decline is attributable to lower food and energy prices, a reduction in electricity prices in October 2013 and the absence of demand-side pressures. Overall, the current inflation picture needs to be viewed against a background of large macroeconomic imbalances and vulnerabilities.
The latest available forecasts from major international institutions project inflation to increase gradually in 2014-15 and to range from 0.5% to 1.1% and from 1.1% to 2.2% respectively from currently negative levels. Risks to the inflation outlook for Croatia are broadly balanced. In particular, on the upside the risks relate to developments in commodity and administered prices, while on the downside they relate to the strength of the economic recovery. Looking further ahead, maintaining low inflation rates on a sustainable basis in Croatia may be challenging in the medium term, given monetary policy’s limited room for manoeuvre under the tightly managed floating exchange rate regime and the high level of euroisation. The catching-up process is likely to have a bearing on inflation and/or the nominal exchange rate over the coming years, given that GDP per capita and price levels are still lower in Croatia than in the euro area. However, it is difficult to assess the exact magnitude of the effect resulting from this catching-up process. Once the economy gains momentum and the income convergence progresses, price level convergence is likely to continue. This, in turn, would manifest itself in terms of higher domestic inflation, given the tightly managed floating exchange rate regime.
Overall, although the 12-month average rate of HICP inflation in Croatia is currently well below the reference value, there are concerns regarding the sustainability of inflation convergence.
Croatia is subject to an EU Council decision on the existence of an excessive deficit, with a deadline of 2016 for correcting it. In the reference year 2013 the general government budget balance recorded a deficit of 4.9% of GDP, i.e. well above the 3% reference value. The general government gross debt-to-GDP ratio was 67.1%, i.e. above the 60% reference value. In 2014 the deficit ratio is forecast by the European Commission to decrease to 3.8% and the government debt ratio to increase to 69.0%. With regard to other fiscal factors, the deficit ratio exceeded the ratio of public investment to GDP in 2013 and is projected to do so again in 2014. Importantly, Croatia
1 Croatia joined the European Union on 1 July 2013.
56ECBConvergence ReportJune 2014
must ensure progress is made on fiscal consolidation in 2014 and beyond, in line with the EDP requirement to ensure that the excessive deficit is corrected by the 2016 deadline. It also needs to address a number of fiscal challenges, as described in Chapter 5.
In the two-year reference period the Croatian kuna did not participate in ERM II, but traded under a flexible exchange rate regime involving a tightly managed floating of the currency’s exchange rate. Over the reference period the exchange rate of the Croatian kuna against the euro showed a low degree of volatility. At the same time short-term interest rate differentials against the three-month EURIBOR stood, on average, at relatively high levels. In a longer-term context, in April 2014 both the real effective exchange rate and the real bilateral exchange rate of the Croatian kuna against the euro stood close to the corresponding ten-year historical averages. As regards other external developments, Croatia’s current and capital account has adjusted substantially in recent years. After a progressive increase in the external deficit between 2004 and 2008, the combined current and capital account improved steadily and turned into a slight surplus of 0.1% of GDP in 2012 and a surplus of 1.2% of GDP in 2013. At the same time the country’s net international investment position deteriorated substantially from -47.7% of GDP in 2004 to -89.5% in 2012 and -88.4% in 2013. Fiscal and structural policies therefore continue to be important for supporting external sustainability and the competitiveness of the economy.
Long-term interest rates were 4.8% on average over the reference period from May 2013 to April 2014 and thus below the 6.2% reference value for the interest rate convergence criterion. During the reference period long-term interest rates increased as credit ratings were downgraded. Long-term interest rates stood at 4.4% at the end of the reference period, 2.0 percentage points higher than the euro area average (and 2.7 percentage points higher than the euro area AAA yield).
Achieving an environment that is conducive to sustainable convergence in Croatia requires, among other things, a stability-oriented monetary policy and all-encompassing structural reforms. With regard to macroeconomic imbalances, the European Commission selected Croatia for an in-depth review in its Alert Mechanism Report 2014 and concluded that “Croatia is experiencing excessive macroeconomic imbalances, which require specific monitoring and strong policy action”. At the same time, given monetary policy’s limited room for manoeuvre owing to the tightly managed floating exchange rate regime and the high level of euroisation, it is imperative that other policy areas provide the economy with the wherewithal to cope with country-specific shocks in order to ensure the correction of macroeconomic imbalances and to prevent their recurrence in the future. Specifically, Croatia needs to deal with a wide range of economic policy challenges that are described in more detail in Chapter 5.
Croatian law does not comply with all the requirements for central bank independence. Croatia is a Member State with a derogation and must therefore comply with all adaptation requirements under Article 131 of the Treaty.

57ECB
Convergence ReportJune 2014
4 COUNTRYSUMMARIES
4.4 LITHUANIA
Over the reference period from May 2013 to April 2014, the 12-month average rate of HICP inflation in Lithuania was 0.6%, i.e. well below the reference value of 1.7% for the criterion on price stability.
Looking back over a longer period, consumer price inflation in Lithuania has been volatile, with 12-month average rates ranging from 1.2% to 11.1% over the past ten years. Following Lithuania’s accession to the EU in 2004, inflation picked up from the subdued rates prevailing earlier in the decade and rose significantly in 2007-08. The upward trend in inflation was initially due to higher prices for commodities and imports, as well as hikes in indirect tax rates. A further rise in inflation that began in 2007 is attributable to a combination of factors, including higher prices for energy and food products, as well as an increasingly tight labour market and very strong demand growth, reflecting an overheating economy and rising macroeconomic imbalances. As these macroeconomic developments proved to be unsustainable, the Lithuanian economy experienced a severe contraction in 2009, before recovering again in the years that followed. After peaking at 11.1% in 2008, the annual rate of inflation fell sharply. This adjustment helped Lithuania to regain price competitiveness. In 2011-12, however, hikes in global energy and food prices set inflation on an upward course once again. In 2013 inflation then declined to 1.2% as a result of favourable global commodity prices and a fall in food prices and administered prices. Looking at recent developments, the annual rate of HICP inflation remained low in early 2014 and stood at 0.3% in April 2014.
The latest available forecasts from major international institutions project inflation to increase gradually and to range from 1.0% to 1.3% in 2014 and from 1.8% to 2.4% in 2015. Risks to inflation are tilted to the upside: there is the possibility of higher than expected increases in prices for global food and energy and stronger than expected increases in wages, but there are downside risks stemming from likely administrative price reductions related to envisaged price cuts of imported gas. Larger increases in wages, particularly if labour productivity growth is weaker than currently expected, would put upward pressure on unit labour costs. Looking further ahead, maintaining low inflation rates on a sustainable basis in Lithuania will be challenging in the medium term, given monetary policy’s limited room for manoeuvre. The catching-up process is also likely to have a bearing on inflation over the coming years, given that GDP per capita and price levels are still lower in Lithuania than in the euro area. However, it is difficult to assess the exact size of the inflation effect resulting from this catching-up process. Nevertheless, income and price level convergence is likely to continue. This, in turn, would manifest itself in terms of higher domestic inflation, given the absence of flexibility in the nominal exchange rate. Indeed, in the context of the process of economic convergence, it cannot be ruled out that significant demand pressure may emerge again, although the ongoing deleveraging process, strengthened fiscal governance and macro-prudential frameworks (including the implementation of “responsible lending guidelines” of Lietuvos bankas) reduce this risk for the future. Therefore, given the lack of nominal exchange rate flexibility and the limitations of alternative counter-cyclical policy instruments, it may be difficult to prevent another build-up of macroeconomic imbalances, including high rates of inflation.
Overall, although the 12-month average rate of HICP inflation in Lithuania is well below thereferencevalue,thereareconcernsregardingthesustainabilityofinflationconvergence.
Lithuania is not currently subject to an EU Council decision on the existence of an excessive deficit. In the reference year 2013 the general government budget balance recorded a deficit of 2.1% of GDP, i.e. below the 3% reference value. The general government gross debt-to-GDP ratio was 39.4%,
58ECBConvergence ReportJune 2014
i.e. well below the 60% reference value. In 2014 the deficit ratio is forecast by the European Commission to remain at 2.1% and the government debt ratio to increase to 41.8%. With regard to other fiscal factors, the deficit ratio did not exceed the ratio of public investment to GDP in 2013. Importantly, Lithuania must ensure sufficient progress is made towards meeting its medium-term objective (a structural deficit of 1.0% of GDP), as well as maintaining sound fiscal policies thereafter. It also needs to continue the implementation of its expenditure-based consolidation strategy and to address a number of fiscal challenges, as described in Chapter 5.
The Lithuanian litas has been participating in ERM II since 28 June 2004. In the two-year reference period the litas was stable at its central rate of 3.45280 litas per euro. Short-term interest rate differentials against the three-month EURIBOR averaged a modest level of around 0.5 percentage point from the start of the reference period to the three-month period ending in June 2013. Thereafter they declined to very low levels, standing at 0.1 percentage point in the three-month period ending in March 2014. In a longer-term context, in April 2014 both the real effective exchange rate and the real bilateral exchange rate of the Lithuanian litas against the euro stood relatively close to the corresponding ten-year historical averages. As regards other external developments, the deficit in the combined current and capital account of the balance of payments widened progressively between 2004 and 2008. After a sharp fall in domestic demand, which led to lower imports, gains in competitiveness and a strong recovery of exports, the deficit decreased substantially and the combined current and capital account registered a large surplus in 2009, standing at 2.0% of GDP in 2012 and 3.7% in 2013. At the same time Lithuania’s net international investment position deteriorated from -34.4% of GDP in 2004 to -57.3% in 2009, but gradually improved to -52.8% in 2012 and -45.7% in 2013.
Long-term interest rates were 3.6% on average over the reference period from May 2013 to April 2014 and were thus well below the 6.2% reference value for the interest rate convergence criterion. The international financial crisis had a significant adverse effect on Lithuanian capital markets, and long-term interest rates increased considerably to a plateau of 14.5% during 2009, with no secondary trading taking place. From 2010 limited trading and primary issuance restarted, and long-term interest rates declined almost continuously until the end of the reference period to stand at 3.3%. The decline occurred against a background of more stable economic developments. From 2010 onwards the interest rate differential with the euro area average narrowed to stand at 0.9 percentage point (and 1.6 percentage points with respect to the AAA euro area yield) at the end of the reference period.
Achieving an environment that is conducive to sustainable convergence in Lithuania requires, among other things, the conduct of economic policies which are geared towards ensuring overall sustainable macroeconomic stability, including price stability. Regarding macroeconomic imbalances, the European Commission did not select Lithuania for an in-depth review in its Alert Mechanism Report 2014. At the same time, given monetary policy’s limited room for manoeuvre owing to the lack of nominal exchange rate flexibility, it is imperative that other policy areas provide the economy with the wherewithal to cope with country-specific shocks in order to prevent the recurrence of macroeconomic imbalances. Specifically, Lithuania needs to deal with a wide range of economic policy challenges that are described in more detail in Chapter 5.
Lithuanian law complies with the Treaties and the Statute.
59ECB
Convergence ReportJune 2014
4 COUNTRYSUMMARIES
4.5 HUNGARY
Over the reference period from May 2013 to April 2014, the 12-month average rate of HICP inflation in Hungary was 1.0%, i.e. well below the reference value of 1.7% for the criterion on price stability.
Looking back over a longer period the annual rate of consumer price inflation in Hungary has hovered around 5% over the past ten years with some exceptions. However, successive commodity price shocks and frequent changes in indirect taxes and administered prices meant that consumer price inflation in Hungary was relatively volatile during the period under review. The substantial growth in compensation per employee up to 2008 pushed up unit labour costs, which then fell in 2009-10 as a result of the wage restraint associated with the economic slowdown. This moderation in unit labour cost growth proved to be temporary, as a pick-up in growth in compensation per employee in 2011 and negative labour productivity growth in 2012 pushed up unit labour costs. In 2013 unit labour cost growth accelerated further on the back of substantial growth in compensation per employee, reflecting wage increases in the public sector. Looking at recent developments, the annual rate of HICP inflation has subsided further in early 2014 to stand at -0.2% in April. Besides the subdued domestic demand, low inflation reflects a slowdown in food price inflation on the back of a good harvest, low imported inflation and declining energy prices reflecting the cuts in administered prices in 2013-14.
The latest available forecasts from major international institutions project inflation to gradually rise in 2014 and 2015 and to range from 0.5% to 1.0% and from 2.8% to 3.0% respectively. The risks to the inflation outlook are broadly balanced. On the upside, there may be a stronger than expected rise in global commodity prices and renewed tensions in global financial markets, while domestic policy uncertainty may exert further depreciation pressure on the forint and thus drive up prices for imported goods and services. On the downside, the ongoing balance sheet adjustment by banks and households and the fiscal burden are expected to weigh on the recovery of domestic demand. Looking further ahead, the catching-up process is likely to have a bearing on inflation and/or the nominal exchange rate over the coming years, given that GDP per capita and price levels are still lower in Hungary than in the euro area. However, it is difficult to assess the exact size of the effect resulting from this catching-up process.
Overall, although the 12-month average rate of HICP inflation in Hungary is well below thereferencevalue,thereareconcernsregardingthesustainabilityofinflationconvergence.
Hungary is not currently subject to an EU Council decision on the existence of an excessive deficit. In the reference year 2013 the general government budget balance recorded a deficit of 2.2% of GDP, i.e. below the 3% reference value. The general government gross debt-to-GDP ratio was 79.2%, i.e. above the 60% reference value. In 2014 the budget deficit is forecast by the European Commission to increase to 2.9% of GDP and the government debt ratio to 80.3%. With regard to other fiscal factors, the deficit ratio did not exceed the ratio of public investment to GDP in 2013. Importantly, Hungary must ensure that it complies with its medium-term objective (a structural deficit of 1.7% of GDP) and brings the government debt ratio onto a firm downward path. It also needs to address a number of fiscal challenges, as described in Chapter 5.5.2.
In the two-year reference period the Hungarian forint did not participate in ERM II. The exchange rate of the Hungarian forint against the euro showed a high degree of volatility. The forint appreciated up to August 2012, but thereafter weakened by about 10% vis-à-vis the euro in late 2012 and the first quarter of 2013. After recovering some of its losses, the Hungarian
60ECBConvergence ReportJune 2014
forint came under renewed pressure in mid-2013 and depreciated in early 2014, before recovering somewhat from the end of the first quarter onwards. Short-term interest rate differentials against the three-month EURIBOR stood at high levels, although they were declining gradually amid interest rate cuts by the Magyar Nemzeti Bank in an environment of decreasing inflation differentials vis-à-vis the euro area. An agreement on repurchase transactions between the Magyar Nemzeti Bank and the ECB announced in late 2008 helped to reduce financial vulnerabilities and therefore might also have contributed to reducing exchange rate pressures over the reference period. In a longer-term context, in April 2014 both the real effective exchange rate and the real bilateral exchange rate of the Hungarian forint against the euro stood below the corresponding ten-year historical averages. As regards other external developments, Hungary’s current and capital account has adjusted sharply in recent years. After reporting persistent large deficits between 2004 and 2008, the combined current and capital account of the balance of payments reversed to reach a surplus in 2009 and widened gradually to 3.5% in 2012 and 6.5% in 2013. At the same time Hungary’s net international investment position, which had also deteriorated sharply from -85.4% of GDP in 2004 to a trough of -117.2% in 2009, improved to -103.2% of GDP in 2012 and -93.0% of GDP in 2013. However, the country’s net foreign liabilities are still very high. Fiscal and structural policies therefore continue to be important for supporting external sustainability and the competitiveness of the economy.
Long-term interest rates were 5.8% on average over the reference period from May 2013 to April 2014 and were thus below the 6.2% reference value for the interest rate convergence criterion. Leading up to the reference period, long-term interest rates had decreased substantially, from 9.0% in early 2012 to 5.1% in May 2013. A decrease in global risk aversion and a number of consecutive monetary policy rate cuts had contributed to the decline in bond yields. During the reference period interest rates increased and stood at 5.6% at the end of the period, reflecting mainly domestic imbalances. The interest rate differential with the euro area average stood at 3.2 percentage points at the end of the reference period (and 3.9 percentage points with respect to the AAA euro area yield).
Achieving an environment that is conducive to sustainable convergence in Hungary requires, among other things, a stability-oriented monetary policy, including a stable institutional environment that maintains market confidence, while fully respecting the independence of the central bank. With regard to macroeconomic imbalances, the European Commission selected Hungary for an in-depth review in its Alert Mechanism Report 2014 and concluded that “Hungary continues to experience macroeconomic imbalances, which require monitoring and decisive policy action”. Indeed, Hungary needs to deal with a wide range of economic policy challenges that are described in more detail in Chapter 5.5.1.
Hungarian law does not comply with all the requirements for central bank independence, the prohibition of monetary financing, the requirements for the single spelling of the euro and legal integration into the Eurosystem. Hungary is an EU Member State with a derogation and must therefore comply with all adaptation requirements under Article 131 of the Treaty.

61ECB
Convergence ReportJune 2014
4 COUNTRYSUMMARIES
4.6 POLAND
Over the reference period from May 2013 to April 2014, the 12-month average rate of HICP inflation in Poland was 0.6%, i.e. well below the reference value of 1.7% for the criterion on price stability.
Looking back over a longer period, annual consumer price inflation in Poland has fluctuated within a range of 0.8% and 4.2% over the past ten years. More specifically, following a temporary rise in 2004, owing mainly to Poland’s accession to the EU, inflation declined to low levels in 2005 and 2006. At the end of 2006 price pressures picked up, with inflation rising to above 4.0% in 2008 and remaining at an elevated level in 2009. Up to mid-2008 macroeconomic developments were characterised by a sustained upswing in economic activity that was only interrupted in the first half of 2005. Price developments at that time were also influenced by the rise in commodity prices. Capacity pressures became apparent in 2007-08, but these declined with the onset of the global financial crisis. A relatively short-lived economic slowdown and lower global commodity prices resulted in a temporary decline in annual HICP inflation to levels below 2% in the summer of 2010. In 2011 the surge in global commodity prices, the depreciation of the nominal exchange rate and a hike in the value added tax rate amid robust domestic demand contributed to a renewed increase in inflation. However, the significant weakening of domestic economic activity that started in 2012, combined with developments in global commodity prices, contributed to a sharp decline in inflation in 2013 to a historically low level. Annual inflation reached a trough of 0.2% in June 2013. Looking at recent developments, annual HICP inflation has remained subdued, standing at 0.3% in April 2014. CPI inflation also stood at 0.3%, below the central bank’s medium-term inflation target (2.5% with a tolerance band of ±1 percentage point).
The latest available forecasts from major international institutions project inflation to gradually rise in 2014 and 2015, and to range from 1.1% to 1.5% and from 1.9% to 2.4% respectively. Risks to the inflation outlook are broadly balanced. Upside risks relate mainly to developments in commodity prices, while downside risks are mostly associated with the pace of the economic recovery in Poland. Looking further ahead, the catching-up process is likely to have a bearing on inflation and/or the nominal exchange rate over the coming years, given that GDP per capita and price levels are still lower in Poland than in the euro area. However, it is difficult to assess the exact size of the effect resulting from this catching-up process.
Overall, although the 12-month average rate of HICP inflation in Poland is currently well below the reference value, there are concerns regarding the sustainability of inflation convergence.
Poland is currently subject to an EU Council decision on the existence of an excessive deficit. In the reference year 2013 the general government budget balance recorded a deficit of 4.3% of GDP, i.e. well above the 3% reference value. The general government gross debt-to-GDP ratio was 57.0%, i.e. below the 60% reference value. In 2014 a temporary budget surplus of 5.7% of GDP is forecast by the European Commission, while the government debt ratio is projected to decrease to 49.2% owing to a one-off transfer of assets from the second pillar of the pension system (about 9% of GDP). With regard to other fiscal factors, the deficit ratio exceeded the ratio of public investment to GDP in 2013. Importantly, Poland must ensure that there is a sustainable reduction in the budget deficit and correct the excessive deficit by 2015, in line with the EDP requirements, as well as ensuring that sufficient progress is made towards meeting its medium-term objective (a structural deficit of 1% of GDP) thereafter. It also needs to address other fiscal challenges, as described in Chapter 5.
62ECBConvergence ReportJune 2014
In the two-year reference period the Polish zloty did not participate in ERM II, but traded under a flexible exchange rate regime. The exchange rate of the Polish zloty against the euro showed a relatively high degree of volatility. Up to August 2012 the Polish zloty appreciated gradually against the euro. It then depreciated vis-à-vis the euro during a period of increased volatility in mid-2013. Thereafter, the zloty strengthened gradually against the euro until the end of the reference period. Short-term interest rate differentials against the three-month EURIBOR remained at somewhat wide levels in Poland. In late 2008 Narodowy Bank Polski and the ECB agreed on repurchase transactions, which would provide Narodowy Bank Polski with a facility to borrow up to €10 billion. Moreover, a Flexible Credit Line (FCL) arrangement with the IMF, designed to meet the demand for crisis-prevention and crisis-mitigation lending, has been in place since mid-2009, having been prolonged twice in 2011 and 2013. Poland has not received any disbursements from the FCL since its establishment. As these arrangements helped to reduce risks related to financial vulnerabilities, they might also have contributed to reducing the risk of exchange rate pressures. In a longer-term context, in April 2014 both the real effective exchange rate and the real bilateral exchange rate of the Polish zloty against the euro stood close to the corresponding ten-year historical averages. As regards other external developments, in 2007 and 2008 Poland reported large deficits in the combined current and capital account of its balance of payments. The combined current and capital account balance adjusted markedly in 2009 and stood at -1.5% of GDP in 2012 and 1.0% in 2013. At the same time Poland’s net international investment position deteriorated substantially, from -41.6% of GDP in 2004 to -68.6% in 2013. Fiscal and structural policies therefore continue to be important for supporting external sustainability and the competitiveness of the economy.
Long-term interest rates were 4.2% on average over the reference period from May 2013 to April 2014 and were thus well below the reference value of 6.2% for the interest rate convergence criterion. During the financial crisis, long-term interest rates in Poland were, overall, relatively volatile, stabilising in the second half of 2009 and in early 2010. Increasing international investor demand for Polish sovereign bonds fostered the decline in long-term interest rates in 2010. At the end of 2010 and the beginning of 2011, long-term interest rates increased somewhat, reflecting broader financial market tensions. From mid-2011 until mid-2013, they followed a downward trend, increasing somewhat afterwards. At the end of the reference period, the long-term interest rate for Poland stood at 4.1%, which was 1.7 percentage points higher than the euro area average (and 2.4 percentage points higher than the euro area AAA yield).
Achieving an environment that is conducive to sustainable convergence in Poland requires, among other things, maintaining a price stability-oriented monetary policy in the medium term. Regarding macroeconomic imbalances, the European Commission did not select Poland for an in-depth review in its Alert Mechanism Report 2014. Although the Polish economy managed to weather the global crisis comparatively well, a number of structural issues remain unresolved. Specifically, Poland needs to deal with a wide range of economic policy challenges that are described in more detail in Chapter 5.
Polish law does not comply with all the requirements for central bank independence, confidentiality, the monetary financing prohibition and legal integration into the Eurosystem. Poland is an EU Member State with a derogation and must therefore comply with all adaptation requirements under Article 131 of the Treaty.
63ECB
Convergence ReportJune 2014
4 COUNTRYSUMMARIES
4.7 ROMANIA
Over the reference period from May 2013 to April 2014, the 12-month average rate of HICP inflation in Romania was 2.1%, i.e. above the reference value of 1.7% for the criterion on price stability.
Looking back over a longer period, the average annual rate of HICP inflation in Romania decreased from very high levels in the early 2000s up to 2007, when the downward trend was reversed. In 2009 inflation fell again and broadly stabilised thereafter at an elevated level, before declining to historically low levels of 3.4% and 3.2% in 2012 and 2013 respectively. In addition to unit labour costs, a succession of major supply-side shocks (including a VAT rate hike in 2010), adjustments in administered prices and excise duties and exchange rate developments played a major role in driving inflation developments. Inflation dynamics over the past ten years should be viewed against a background of overheating in the economy from 2004 to 2008, which was followed by a sharp contraction in economic activity in 2009 and 2010, and a moderate recovery from 2011 to 2013. During the period 2004-08 unemployment declined and wage growth significantly outpaced productivity growth, which in turn drove up unit labour cost growth to double-digit levels. As unemployment picked up again and wage growth moderated significantly, unit labour cost growth fell from 22.9% in 2008 to 2.5% in 2013. Looking at recent developments, annual HICP inflation broadly followed a downward path from its peak of 5.4% in September 2012 to 1.1% in September 2013, before picking up somewhat to 1.6% in April 2014 following an increase in excise duties on fuel. The overall marked decline is attributable to a reduction in the value added tax rate on flour and bakery products in September 2013, easing pressures from energy and food prices on the back of global price developments, a very good harvest, downward base effects, the disinflation pressures exerted by the negative output gap and falling inflation expectations.
The latest available forecasts from major international institutions project average annual inflation to rise gradually from historically low levels and to range from 2.2% to 2.5% in 2014 and from 3.0% to 3.3% in 2015. While the immediate risks to the inflation outlook are broadly balanced, upside risks prevail in the medium term. They relate to a stronger than expected rise in global commodity prices and depreciation pressures on the leu resulting from renewed tensions in global financial markets. Risks from domestic sources are associated with the impact of further deregulation of energy prices and hikes in excise duties as well as persistent uncertainty regarding progress made on implementing the structural reform measures agreed in the context of the precautionary financial assistance programme. Moreover, there are risks stemming from possible fiscal slippages in the context of the presidential elections scheduled for December 2014. Weaker than expected economic activity constitutes a downside risk to the inflation outlook. Looking further ahead, the catching-up process is likely to have a bearing on inflation and/or the nominal exchange rate over the coming years, given that GDP per capita and price levels are still significantly lower in Romania than in the euro area. However, it is difficult to assess the exact magnitude of the effect resulting from this catching-up process.
Romania is not currently subject to an EU Council decision on the existence of an excessive deficit. In the reference year 2013 the general government budget balance recorded a deficit of 2.3% of GDP, i.e. below the 3% reference value. The general government gross debt-to-GDP ratio was 38.4%, i.e. well below the 60% reference value. In 2014 the deficit ratio is forecast by the European Commission to decline marginally to 2.2% and the government debt ratio to increase to 39.9%. With regard to other fiscal factors, the deficit ratio did not exceed the ratio of public investment to GDP in 2013. Importantly, Romania must ensure that sufficient progress is made towards meeting its medium-term objective (a structural deficit of 1% of GDP), as well as fulfilling
64ECBConvergence ReportJune 2014
the commitments agreed on in the context of the EU-IMF financial assistance programme. It also needs to address a number of fiscal challenges, as described in Chapter 5.
Over the two-year reference period the Romanian leu did not participate in ERM II, but traded under a flexible exchange rate regime involving a managed floating of the currency. The exchange rate of the Romanian leu against the euro showed a relatively high degree of volatility. Following a slight appreciation of the Romanian leu up to May 2013, the currency weakened during a period of increased volatility in mid-2013. Thereafter the leu strengthened again somewhat, stabilising around its average level at the beginning of the reference period. Over the entire reference period short-term interest rate differentials against the three-month EURIBOR remained, on average, at a highlevel,althoughdeclininggraduallyamidinterestratecutsbyBancaNaţionalăaRomânieiinan environment of decreasing inflation differentials vis-à-vis the euro area. In 2009 an international financial assistance package led by the EU and the IMF was agreed for Romania, which was followed by a precautionary financial assistance programme in 2011 and a successor programme in 2013. During the reference period Romania did not draw on the resources of the precautionary arrangements. As these agreements helped to reduce financial vulnerabilities, they might also have contributed to reducing exchange rate pressures over the reference period. In a longer-term context, in April 2014 both the real effective exchange rate and the real bilateral exchange rate of the Romanian leu against the euro stood relatively close to the corresponding ten-year historical averages. As regards other external developments, Romania’s current and capital account has adjusted substantially in recent years. After reporting a progressive increase in the external deficit between 2004 and 2007, the combined current and capital account deficit adjusted in 2009, improving further to 3.0% of GDP in 2012 and turning into a surplus of 1.2% of GDP in 2013. At the same time, the country’s net international investment position deteriorated substantially from -26.4% of GDP in 2004 to -67.5% in 2012, but improved to -62.3% in 2013. Fiscal and structural policies therefore continue to be important for supporting external sustainability and the competitiveness of the economy.
Long-term interest rates were 5.3% on average over the reference period from May 2013 to April 2014 and were thus below the 6.2% reference value for the interest rate convergence criterion. In previous years, long-term interest rates in Romania had tended to fluctuate around 7%, within a margin of ±0.5 percentage point, with stubborn inflation dynamics preventing a sustained downward trend in nominal interest rates. More recently, inflation has declined sharply, allowing the central bank to ease policy rates more rapidly than before. This has contributed to the narrowing of the long-term interest rate differential between Romania and the euro area average. At the end of the reference period, the long-term interest rate stood at 5.2%, 2.8 percentage points above the euro area average (and 3.5 percentage points above the AAA euro area yield).
Achieving an environment that is conducive to sustainable convergence in Romania requires, among other things, the conduct of economic policies which are geared towards ensuring overall macroeconomic stability, including sustainable price stability. Regarding macroeconomic imbalances, the country is subject to surveillance under a macroeconomic adjustment programme supported by financial assistance. Romania needs to deal with a wide range of economic policy challenges that are described in more detail in Chapter 5.
Romanian law does not comply with all the requirements for central bank independence, the monetary financing prohibition and legal integration into the Eurosystem. Romania is an EU Member State with a derogation and must therefore comply with all adaptation requirements under Article 131 of the Treaty.

65ECB
Convergence ReportJune 2014
4 COUNTRYSUMMARIES
4.8 SWEDEN
Over the reference period from May 2013 to April 2014, the 12-month average rate of HICP inflation in Sweden was 0.3%, i.e. well below the reference value of 1.7% for the criterion on price stability.
Looking back over a longer period, inflation developments in Sweden have generally been moderate, with the rate of HICP inflation averaging 1.5% over the past ten years. This reflects the credibility of monetary policy in Sweden, which is underpinned by moderate wage formation and the country’s status as an advanced economy. During this period average annual HICP inflation exceeded 2.0% only in 2008. In 2013 average annual HICP inflation stood at 0.4%. Looking at recent developments, the annual rate of HICP inflation stood at moderate levels in the last quarter of 2013 and in early 2014, and was well below the inflation target of Sveriges Riksbank. This pattern was mainly attributable to declining energy prices and subdued increases in services prices. The fall in profit shares in both the services and goods producing industries signalled that the business sector was still having difficulty backing cost increases with higher prices.
The latest available forecasts from major international institutions project inflation to remain broadly unchanged in 2014 before increasing in 2015, and to range from 0.1% to 0.5% and from 1.4% to 1.8% respectively. Overall, risks to the inflation outlook are broadly balanced. Upside risks relate to a stronger than expected rebound in investment activity and to increasing global commodity prices. The main downside risk relates to a correction of house prices, which could dampen domestic demand. Exchange rate fluctuations are an additional source of uncertainty surrounding the inflation forecast. The fact that the price level in Sweden is still relatively high compared with the euro area average suggests that further trade integration and increased competition may have a downward impact on price dynamics.
Sweden is not subject to an EU Council decision on the existence of an excessive deficit. In the reference year 2013 the general government budget balance recorded a deficit of 1.1% of GDP, i.e. well below the 3% deficit reference value. The general government gross debt-to-GDP ratio was 40.6% of GDP, i.e. below the 60% reference value. In 2014 the deficit ratio is forecast by the European Commission to increase to 1.8% of GDP and the government debt ratio to 41.6%. With regard to other fiscal factors, the deficit ratio did not exceed the ratio of public investment to GDP in 2013. Importantly, Sweden should maintain sound public finances and continue to anchor its budgetary consolidation strategy in the years to come in its rule-based fiscal framework, which has so far been beneficial to fiscal performance. It also needs to address a number of fiscal challenges, as described in Chapter 5.
In the two-year reference period the Swedish krona did not participate in ERM II, but traded under a flexible exchange rate regime. The exchange rate of the Swedish krona against the euro displayed, on average, a high degree of volatility over the reference period. The currency appreciated against the euro up to August 2012, before weakening again up to the end of 2012. Thereafter the krona appreciated in the first quarter of 2013, before gradually depreciating up to May 2014. Short-term interest rate differentials against the three-month EURIBOR decreased gradually from 1.6 percentage points in the three-month period ending in June 2012 to 0.6 percentage point in the three-month period ending in March 2014. Over the reference period Sveriges Riksbank maintained a swap agreement with the ECB for borrowing euro in exchange for Swedish kronor. As this arrangement helped to reduce financial vulnerabilities, it might also have had an impact on the exchange rate of the Swedish krona. In a longer-term context, in April 2014 both the real effective exchange rate and the real bilateral exchange rate of the Swedish krona against the euro stood
66ECBConvergence ReportJune 2014
close to the corresponding ten-year historical averages. As regards other external developments, since 2004 Sweden has accumulated large surpluses – of around 7% of GDP on average – in its combined current and capital account of the balance of payments, which reached 6.0% in 2013. At the same time the country’s net international investment position improved from -24.9% of GDP in 2004 to -12.1% in 2012 and -5.0% in 2013.
Long-term interest rates were 2.2% on average over the reference period from May 2013 to April 2014 and were thus well below the 6.2% reference value for the interest rate convergence criterion. Long-term interest rates reached a historically low level of 1.3% in 2012, partly reflecting the Swedish government’s high perceived creditworthiness and strong demand for Swedish krona assets. They increased afterwards as safe-haven portfolio flows reduced, and stood at 2.1% at the end of the reference period. The differential between the Swedish long-term interest rate and that of the euro area average was negative from 2005 onwards and widened from 2008 to reach 3.0% in 2011. The differential narrowed thereafter as a result of a decline in euro area yields and an increase in Swedish yields, and stood at -0.3 percentage point (and 0.4 percentage point with respect to the AAA euro area yield) at the end of the reference period.
Maintaining an environment that is conducive to sustainable convergence in Sweden requires, among other things, the continuation of a price stability-oriented monetary policy over the medium term. With regard to macroeconomic imbalances, the European Commission selected Sweden for an in-depth review in its Alert Mechanism Report 2014 and concluded that “Sweden continues to experience macroeconomic imbalances, which require monitoring and policy action”. Sweden needs to deal with a wide range of economic policy challenges, which are described in more detail in Chapter 5.
Swedish law does not comply with all the requirements for central bank independence, the monetary financing prohibition and legal integration into the Eurosystem. Sweden is an EU Member State with derogation and must therefore comply with all adaptation requirements under Article 131 of the Treaty. Furthermore, the ECB notes that, pursuant to the Treaty, Sweden has been under the obligation to adopt national legislation with a view to integration into the Eurosystem since 1 June 1998. As yet no legislative action has been taken by the Swedish authorities to remedy the incompatibilities described in this and previous reports.

67ECB
Convergence ReportJune 2014
BULGARIA
5 EXAMINATION OF ECONOMIC CONVERGENCE5.1 BULGARIA
5.1.1 PRICE DEVELOPMENTS
Over the reference period from May 2013 to April 2014, the 12-month average rate of HICP inflation in Bulgaria was -0.8%, i.e. well below the reference value of 1.7% for the criterion on price stability (see Table 1). On the basis of the most recent information, the 12-month average rate of HICP inflation is expected to decrease in the coming months.
Looking back over a longer period, consumer price inflation in Bulgaria has been volatile, ranging from 0.4% to 12.0% on an annual basis over the past ten years (see Chart 1). The increase in inflation in 2004-08 reflected adjustments in administered prices, the harmonisation of excise duties with EU levels, a series of supply-side shocks and increasing demand pressures. The sharp fall in inflation in 2009 was partly a result of lower commodity prices and the contraction in economic activity. In 2010 and 2011 inflation gradually picked up again, to 3.0% and 3.4% respectively, largely reflecting higher commodity prices and increases in the excise duty on tobacco. Thereafter, the easing of commodity price pressures combined with weak internal and external demand resulted in a gradual decline in inflation. In addition to the low underlying level of inflation, significant cuts in administered prices further contributed to the historically low levels of inflation reached in 2013.
Economic and monetary policy choices have played an important role in shaping inflation developments over the past ten years, most notably the orientation of monetary policy towards the achievement of price stability, which is the primary objective of monetary policy as enshrined in the central bank law. In 1997 Bulgaria adopted a currency board arrangement. The lev was fixed first to the Deutsche Mark and then to the euro in 1999. During the period 2004-08 monetary policy conditions in Bulgaria under the currency board arrangement became too expansionary for a catching-up economy as it was faced with overheating pressures and had a significantly higher growth potential than the euro area. Despite Bulgaria’s sound fiscal policy record, its overall policy stance proved unable to fully contain demand pressures or to control price stability. The ensuing macroeconomic developments led to a period of externally induced economic adjustment beginning in 2009. Comprehensive consolidation measures introduced in that year helped to put the fiscal deficit that had just emerged on a downward path, owing largely to broad-based restraint in expenditure. In recent years the government has exercised fiscal prudence.
Inflation developments over the past ten years should be viewed against the background of the robust economic expansion up to 2008, which was followed by a sharp contraction in GDP in 2009 and a subdued recovery thereafter (see Table 2). Up to 2008 large capital inflows into Bulgaria had contributed to a boom in domestic demand and, in particular, in investment, which resulted in the economy overheating. Subsequently, the necessary correction was characterised by a contraction in imports and a deceleration in capital inflows in the aftermath of the global financial and economic crisis. The deterioration in economic activity and reduced employment levels brought about a significant increase in the unemployment rate, from 5.6% in 2008 to 13% in 2013. Total employment rose slightly in the first half of 2013, after having been on a downward trend for four years. However, this was not sufficient to bring about a decrease in unemployment owing to an increase in labour force participation. Growth in nominal unit labour costs declined from a peak of 12.6% in 2008 to 2.5% in 2011, but picked up again to 5.2% in 2013, while growth in compensation per employee fell from very high levels in the pre-crisis period to 6.6% in 2013. It should be noted, however, that the assessment of trends in wage dynamics has been complicated by the latest revisions to national accounts data, which introduced methodological changes in employment series
68ECBConvergence ReportJune 2014
without correcting the figures on the compensation of employees. Turning to house prices, very sharp increases were recorded for several years during the economic boom. After peaking in 2008 they fell considerably, although the rate of decline eased significantly in 2013 to stand at -1.8%. Overall, import prices were rather volatile in recent years, reflecting mainly developments in oil and food prices, particularly in view of their large weight in Bulgaria’s HICP basket of goods and services. The impact of the effective exchange rate on import prices remained relatively small. The general pattern of inflation developments in Bulgaria was also reflected in other relevant indices, such as the HICP excluding unprocessed food and energy.
Looking at recent developments, the annual rate of HICP inflation has followed a downward trend, declining from 1.0% in May 2013 to a low of -2.1% in February 2014, after which it started to recover somewhat, to stand at -1.3% in April 2014 (see Table 3a). The sharp deceleration in inflation was partially driven by the downward trend in international prices for food and energy products and, to a lesser extent, an effective exchange rate appreciation. In addition, exceptional domestic factors exerted considerable downward pressure on inflation. These factors include a reduction in administered electricity prices for households, as well as cuts in other administered prices, falling prices in transport and health services, and a good harvest which contributed to falls in food prices. Administered prices (including energy prices) currently represent 16% of Bulgaria’s HICP basket of goods and services and their contribution to headline inflation stood at -0.2 percentage point in 2013. Furthermore, limited domestic demand pressures contributed to a decline in the HICP excluding unprocessed food and energy. Overall, the current inflation developments need to be viewed against the background of an economic environment that is still weak. Real GDP remained subdued during 2013 resulting in 0.9% growth for the year as a whole.
The latest available forecasts from major international institutions project inflation to increase gradually in 2014-15 from currently very negative levels and to range from -0.8% to 0.9% in 2014 and from 0.9% to 2.3% in 2015 (see Table 3b). Economic activity and domestic demand are expected to recover gradually, while no additional cuts in administered prices are foreseen and international commodity prices may stabilise. Nevertheless, inflationary pressures in Bulgaria are likely to be dampened by weak domestic demand, high unemployment and a fragile international environment. Risks to the inflation outlook appear to be broadly balanced in the near to medium term. Downside risks stem from weaker than expected domestic demand and the external environment. However, international commodity prices and a cessation or reversal of recent administered prices cuts could pose an upside risk.
Looking further ahead, maintaining low inflation rates on a sustainable basis in Bulgaria will be challenging in the medium term given the limited scope for active monetary policy under the existing currency board arrangement. The catching-up process is likely to have a bearing on inflation over the medium term, since GDP per capita and price levels are still significantly lower in Bulgaria than in the euro area (see Table 2). However, it is difficult to assess the exact size of the inflation effect resulting from this catching-up process. Once the economic recovery gains momentum and the income convergence progresses, price level convergence is likely to continue. This, in turn, would manifest itself in terms of higher domestic inflation, given the fixed nominal exchange rate. In the context of the process of economic convergence, the recurrence of significant demand pressures cannot be completely ruled out, although the ongoing deleveraging process reduces this risk for the near future. In the light of the currency board arrangement and the limited impact of alternative counter-cyclical policy instruments, it may prove difficult to prevent another build-up of macroeconomic imbalances, including high rates of inflation.
69ECB
Convergence ReportJune 2014
BULGARIA
Overall, although the 12-month average rate of HICP inflation in Bulgaria is currently well below the reference value, there are concerns regarding the sustainability of inflation convergence.
Achieving an environment that is conducive to sustainable convergence in Bulgaria requires, among other things, economic policies that are geared towards ensuring overall macroeconomic stability, including sustainable price stability. With regard to macroeconomic imbalances, the European Commission selected Bulgaria for an in-depth review in its Alert Mechanism Report 2014 in order to investigate the potential risks related to Bulgaria’s external position, corporate deleveraging and labour market adjustment. It concluded that “Bulgaria continues to experience macroeconomic imbalances, which require monitoring and policy action”.
Given monetary policy’s limited room for manoeuvre under the currency board arrangement, it is imperative that other policy areas provide the economy with the wherewithal to cope with country-specific shocks in order to prevent the reoccurrence of macroeconomic imbalances. More specifically, progress in the areas below will help to achieve an environment that is conducive to sustainable price stability and promote competitiveness and employment growth.
With regard to structural reforms, further improvements in the business and institutional environment are crucial in order to attract foreign direct investment flows and to raise the growth potential of the Bulgarian economy. This would also help to enhance Bulgaria’s absorption capacity of EU funds. Furthermore, additional targeted measures to increase human capital and enhance the flexibility of the labour market are required. In the current context of high unemployment, these measures are especially important in order to address a rise in structural unemployment or a decline in the participation rate. In particular, increases in the minimum wage and minimum social insurance thresholds should be based not only on fiscal considerations, but also on a thorough analysis of any potential negative repercussions they may have on individuals with low educational attainment and on other groups which are vulnerable to unemployment. Education programmes should be adjusted on an ongoing basis in order to meet the demands of employers and ensure sufficiently high standards.
Maintaining sufficient flexibility in nominal and real wages is necessary to ensure that the economy remains competitive over the medium term, particularly given Bulgaria’s fixed exchange rate regime. Wage increases should reflect labour productivity growth, labour market conditions and developments in competitor countries. In order to sustain further economic expansion, it will also be essential to strengthen national policies aimed at enhancing competition in product markets and to proceed with the liberalisation of regulated sectors. In particular, inefficiencies in the energy sector should be addressed through closer supervision of Bulgarian Energy Holdings and its subsidiaries. The independence and efficiency of regulatory bodies in sectors with natural monopolies or weak competition should be strengthened. Further reforms may be necessary to deliver an efficiently functioning and independent judiciary, particularly as the shadow economy remains sizeable.
Financial sector policies should be geared towards preventing boom-bust cycles, while financial supervisors should continue to closely monitor banks’ risk exposures, risk management practices andcapitaladequacyratios.ItiscrucialthatБългарсканароднабанка(BulgarianNationalBank)remains vigilant and ensures that banks continue to provision prudently. In order to minimise the potential risks to financial stability associated with the high proportion of foreign currency loans, which are denominated predominantly in euro, it is necessary for Bulgaria to fully implement the recommendation of the ESRB on lending in foreign currencies, with regard to which Bulgaria
70ECBConvergence ReportJune 2014
was considered to be only partially compliant in the follow-up report published by the ESRB in November 2013.1 Close cooperation between home and host country supervisory authorities is important to ensure the effective implementation of these measures. Finally, financial stability could benefit from Bulgaria’s participation in the SSM, which will take up its prudential supervisory tasks in November 2014.
5.1.2 FISCAL DEVELOPMENTS
Bulgaria is not currently subject to an EU Council decision on the existence of an excessive deficit. In the reference year 2013 the general government budget balance recorded a deficit of 1.5% of GDP, i.e. well below the 3% reference value. The general government gross debt-to-GDP ratio was 18.9%, i.e. well below the 60% reference value (see Table 4). Compared with the previous year, the budget balance ratio decreased by 0.7 percentage point, while the public debt ratio increased by 0.5 percentage point. In 2014 the deficit ratio is forecast by the European Commission to increase to 1.9% and the government debt ratio to increase to 23.1%. With regard to other fiscal factors, the deficit ratio did not exceed the ratio of public investment to GDP in 2013, nor is it expected to in 2014.
Looking at developments in Bulgaria’s budgetary position over the period from 2004 to 2013, the budget was in surplus until 2008, before registering a deficit of 4.3% of GDP in 2009. In the period from 2010 to 2012 the deficit-to-GDP ratio was significantly reduced, before increasing again in 2013. As the deficit-to-GDP ratio rose above the 3% of GDP reference value in 2009, the ECOFIN Council decided on 13 July 2010 that an excessive deficit situation existed in Bulgaria and set a deadline of 2011 for correcting it. The decision was abrogated in June 2012 after Bulgaria successfully reduced its general government deficit.
As shown in greater detail in Chart 2b, European Commission estimates indicate that, overall, cyclical factors had a small positive impact on the change in the budget balance, before contributing to its strong deterioration in 2009. From 2010 cyclical factors on aggregate had a neutral impact on the change in the budget balance. Non-cyclical factors had a volatile impact on the change in the budget balance before 2008 and contributed to its strong deterioration in 2009. This was mainly due to a rise in expenditure, including increases in pensions and other current transfers payable. In the second half of 2009 the government implemented comprehensive consolidation measures which contained the deterioration in the budget balance in that year and helped to reduce the budget deficit in the following three years. These measures were aimed at cutting current expenditure in particular and at raising tax revenue collection by improving compliance with VAT and corporate income tax rules to counteract the fall in tax revenue. Non-cyclical factors again had a negative impact on the deterioration in the budget balance in 2013, mainly as a result of increases in the compensation of employees, public investment and pensions. The underlying changes in the budget deficit over 2004-13 seem to reflect a structural deterioration in Bulgaria’s fiscal position up to 2009, an improvement from 2010 to 2012 and a deterioration once again in 2013.
Turning to developments in general government gross debt, the debt-to-GDP ratio declined cumulatively by 18.1 percentage points between 2004 and 2013. The debt-to-GDP ratio remains the lowest among non-euro area EU Member States. As shown in greater detail in Chart 3b, primary surpluses and the positive growth-interest rate differential contributed favourably to this development until 2008. Primary deficits contributed to an increase in debt from 2009 onwards on
1 See Recommendation (ESRB/2011/1) of the European Systemic Risk Board of 21 September 2011 on lending in foreign currencies.
71ECB
Convergence ReportJune 2014
BULGARIA
the back of deteriorating macroeconomic and financial conditions, while deficit-debt adjustments limited the rise in the debt ratio as the government reduced the size of its financial assets. A notable exception was 2012, when the primary balance had a small debt-reducing effect. However, this was eliminated by deficit-debt adjustment that had the opposite effect.
As regards Bulgaria’s general government debt structure, the share of government debt with a short-term maturity increased from 0.5% in 2004 to 2.2% in 2013 (see Table 6). Taking into account the low level of the debt ratio, fiscal balances are relatively insensitive to changes in interest rates. The proportion of government debt denominated in foreign currency is high (71.6% in 2013), although it has fallen considerably over the past decade. However, given that 58.1% of government debt is denominated in euro, fiscal balances are relatively insensitive to changes in exchange rates other than the EUR/BGN exchange rate, which is fixed under the currency board. With reference to the most recent developments, the impact of the global financial and economic crisis on Bulgaria’s debt structure has been limited. At the same time, the Bulgarian government has not incurred contingent liabilities resulting from government interventions to support financial institutions and financial markets during the crisis (see Section 5.9).
Moving on to examine trends in other fiscal indicators, Chart 4 and Table 5 show that the general government total expenditure-to-GDP ratio increased only marginally from 38.6% in 2004 to 38.7% in 2013. After peaking at 41.4% of GDP in 2009 on account of, inter alia, sizeable increases in nominal pensions and other current transfers payable, as well as compensation of employees in the government sector (albeit to a lesser extent), the expenditure ratio declined markedly in 2010 and 2011. This was mainly as a result of declines in other current expenditure and capital expenditure, and, to a lesser extent, lower compensation of employees. Total government expenditure increased again in 2012 and 2013. In 2012 the increase was mostly due to higher capital and other current transfers payable. The expenditure rise in 2013 mainly reflected an increase in the compensation of employees, public investment and total pensions. Total government revenue as a share of GDP decreased substantially over the period from 40.4% of GDP in 2004 to 37.2% of GDP in 2013. The total revenue-to-GDP ratio declined strongly in 2009 across most revenue items following the impact of the financial and economic crisis, before increasing again in 2012 and 2013.
Looking ahead, Bulgaria’s medium-term fiscal policy strategy, as presented in the 2014-17 convergence programme update, points to a slight increase in the budget deficit to 1.8% of GDP in 2014 and to a gradual reduction to 0.9% of GDP by 2017. According to the 2014-17 convergence programme update, the structural deficit will reach the medium-term objective of 1.0% of GDP (specified in line with the Stability and Growth Pact) in 2016. According to the European Commission’s projections, the structural deficit will remain above the medium-term objective of 1.0% of GDP over the whole forecasting horizon.
On 2 March 2012 Bulgaria signed the Treaty on Stability, Coordination and Governance in the Economic and Monetary Union (TSCG), committing it, inter alia, to apply (and include in its national legislation) the fiscal rules specified under Title III, “Fiscal Compact”, as referred to in Box 2 of Chapter 2.
As regards fiscal governance, Bulgaria has implemented several reforms in recent years. The new Public Finance Act, which came into force on 1 January 2014, strengthened the national fiscal framework significantly by introducing new fiscal rules and institutions required by the TSCG.
72ECBConvergence ReportJune 2014
Turning to factors that will have an impact on Bulgaria’s public finances over the long term, a relatively steep ageing of the population is expected, as highlighted in Table 8. According to the 2012 projections by the European Commission and the EU’s Economic Policy Committee, starting from a level of 18.2% of GDP in 2010, Bulgaria is likely to experience a notable increase in strictly age-related public expenditure amounting to 2.8 percentage points of GDP in the years to 2060, which is below the EU average (4.8 percentage points of GDP).2
As for fiscal challenges, Bulgaria must ensure that it reduces the budget deficit to its medium-term objective in a sustainable manner through continued fiscal consolidation based on cuts in unproductive public expenditure and reform of tax administration. Bulgaria’s fiscal policy strategy should be supported by the rigorous implementation of its revised fiscal framework. More efforts are needed to further strengthen the binding character and the content of the medium-term budgetary framework. At the same time, Bulgaria should make every effort to fully comply with its obligations under the enhanced Stability and Growth Pact and to implement the provisions of the TSCG effectively. Existing risks to medium-term fiscal sustainability warrant structural fiscal reforms that focus on avoiding pro-cyclical fiscal policies, as well as improving the sustainability of the pension system, tax administration and the overall quality of economic governance.
5.1.3 EXCHANGE RATE DEVELOPMENTS
In the two-year reference period from 16 May 2012 to 15 May 2014, the Bulgarian lev did not participate in ERM II, but its exchange rate was fixed to the euro at 1.95583 levs per euro within the framework of a currency board arrangement (see Table 9a). This arrangement, which was adopted in July 1997 to address the repercussions of the financial crisis and hyperinflationary pressures, was based initially on a commitment to maintain a fixed exchange rate to the Deutsche Mark. In January 1999 the reference currency was changed to the euro. Over the reference period the lev did not exhibit any deviation from the rate of 1.95583 levs per euro, which is used as a benchmark for illustrative purposes in the absence of an ERM II central rate (see Chart 5 and Table 9a). As implied bythecurrencyboardregime,Българсканароднабанка(BulgarianNationalBank)continuedtoexchange on demand domestic currency against the anchor currency and vice versa at the fixed rate. Overall, its purchases and sales of foreign currency during the two-year reference period resulted in a net sale. Short-term interest rate differentials against the three-month EURIBOR declined steadily from the sizeable level of 1.9 percentage points in the three-month period ending in June 2012 to a relatively low level of 0.6 percentage point in the three-month period ending in March 2014 (see Table 9b).
In a longer-term context, in April 2014 both the real effective exchange rate and the real bilateral exchange rate of the Bulgarian lev against the euro stood close to the corresponding ten-year historical averages (see Table 10). However, these indicators should be interpreted with caution, as during this period Bulgaria was subject to a process of economic convergence, which complicates any historical assessment of real exchange rate developments.
As regards other external developments, the deficit in the combined current and capital account of the balance of payments widened progressively from 5.6% of GDP in 2004 to very high levels in excess of 20% of GDP in 2007 and 2008 (see Table 11). After a strong fall in domestic demand, leading to lower imports, and a strong export performance, the deficit decreased substantially and
2 European Commission and Economic Policy Committee, “The 2012 Ageing Report: Economic and budgetary projections for the EU-27 Member States (2010-2060)”.
73ECB
Convergence ReportJune 2014
BULGARIA
the combined current and capital account turned into a small surplus from 2011. This shift in the current account balance primarily reflected a substantial reduction in the goods deficit on account of the export-led recovery and subdued domestic demand following the sharp contraction of activity, as well as a widening surplus on current transfers. The narrowing of the combined current and capital account deficit over the past few years has also been associated with a slowdown in net capital inflows. Net direct investment inflows have stabilised at around 3% of GDP since 2010, while Bulgaria has continued to record net outflows of portfolio investment, mainly on account of government debt repayments. Against this background, gross external debt, which had increased substantially from 61.7% of GDP in 2004 to 108.3% in 2009, declined to around 95% of GDP in 2012 and 2013. At the same time Bulgaria’s net international investment position, which had also deteriorated sharply from -30.1% of GDP in 2004 to -101.8% in 2009, improved steadily to reach -78.2% in 2012 and -76.2% in 2013. However, the country’s net foreign liabilities are still very high, with foreign direct investment accounting for the largest part of gross foreign liabilities. Fiscal and structural policies therefore continue to be important for supporting external sustainability and the competitiveness of the economy. Bulgaria is a small open economy; the ratio of foreign trade in goods and services to GDP increased from 55.2% in 2004 to 70.1% in 2013 for exports and from 66.5% in 2004 to 70.7% in 2013 for imports. Over the same period Bulgaria’s share in world exports expanded from 0.12% to 0.16%.
Concerning measures of economic integration with the euro area, in 2013 exports of goods to the euro area constituted 44.5% of total goods exports, whereas the corresponding figure for imports was 42.4%. The share of euro area countries in Bulgaria’s stock of inward direct investment stood at 70.0% in 2013, and their share in its stock of portfolio investment liabilities stood at 84.1% in 2012. The share of Bulgaria’s stock of assets invested in the euro area amounted to 45.1% in the case of direct investment in 2013 and 44.5% for portfolio investment in 2012 (see Table 12).
5.1.4 LONG-TERM INTEREST RATE DEVELOPMENTS
Over the reference period from May 2013 to April 2014, long-term interest rates in Bulgaria were 3.5% on average and were thus well below the 6.2% reference value for the interest rate convergence criterion (see Table 13).
Long-term interest rates followed a declining trend from January 2004 until the end of 2005 and subsequently embarked on an upward trend in 2006 and 2007 in an environment of accumulating domestic and external imbalances (see Chart 6a). Long-term interest rates stabilised at around 5% for most of 2008, but escalated sharply to reach 7.8% in December of that year on account of the global crisis, resulting in a downgrading of Bulgaria’s sovereign credit rating. In late 2009 long-term interest rates began to decline in a sustained manner as the process of correcting the significant pre-crisis imbalances was under way and inflation was slowing down. In mid-2011 one of the three major rating agencies increased the country’s classification to one level above investment grade. Long-term interest rates in Bulgaria then followed a gradual but consistent downward path until 2013, when they began to stabilise. At the end of the reference period, long-term interest rates in Bulgaria stood at 3.4%.
The differential between long-term interest rates in Bulgaria and the euro area average followed a downward trend until 2005, when it almost reached zero. In 2006 and 2007 the differential between long-term interest rates in Bulgaria and the euro area average was stable at a low level of around 0.3 percentage point (see Chart 6b), increasing to 4.1 percentage points in 2008, reflecting global
74ECBConvergence ReportJune 2014
financial market tensions and concerns about persisting economic imbalances in Bulgaria. From late 2009 onwards, the slow but steady reduction in Bulgarian long-term interest rates, coupled with an increase in euro area average rates, gradually lowered the differential, bringing it to around zero towards the end of 2012. Since then, the long-term interest rate differential with the euro area average has increased slightly, to stand at 1.0 percentage point (and 1.7 percentage points with respect to the AAA euro area yield) at the end of the reference period.
As regards financial integration and development, Bulgarian capital markets are smaller and much less developed than those in the euro area (see Table 14). Stock market capitalisation has progressively declined in recent years, from a peak of 48.2% of GDP in 2007 to just 12.7% at the end of 2013. Outstanding debt securities issued by corporations (a measure of market-based indebtedness) amounted to only 4.6% of GDP in 2013. Bulgaria’s financial sector is bank-based, with credit to non-government residents increasing very rapidly between 2004 and 2009 and amounting to 70.8% of GDP in 2013. Foreign-owned banks, primarily from the euro area, play a major role in the system and the majority of loans are denominated in foreign currencies, in this case the currency board’s reserve currency. The international claims of euro area banks in Bulgaria, defined as the share in total liabilities of loans from euro area banks to banks in the country, amounted to 9.7% in 2013.

75ECB
Convergence ReportJune 2014
BULGARIA
BULGARIA
1 PRICE DEVELOPMENTSTable 1 HICP inflation 76Chart 1 Price developments 76Table 2 Measures of inflation and related indicators 76Table 3 Recent inflation trends and forecasts 77
(a) Recent trends in the HICP 77(b) Inflation forecasts 77
2 FISCAL DEVELOPMENTSTable 4 General government fiscal position 78Table 5 General government budgetary position 78Chart 2 General government surplus (+)/deficit (-) 79
(a) Levels 79(b) Annual change and underlying factors 79
Table 6 General government gross debt – structural features 79Chart 3 General government gross debt 80
(a) Levels 80(b) Annual change and underlying factors 80
Chart 4 General government expenditure and revenue 80Table 7 General government deficit-debt adjustment 81Table 8 Projections of the ageing-induced fiscal burden 81
3 EXCHANGE RATE DEVELOPMENTSTable 9 (a) Exchange rate stability 82
(b) Key indicators of exchange rate pressure for the Bulgarian lev 82Chart 5 Bulgarian lev: nominal exchange rate development against the euro 82
(a) Exchange rate over the reference period 82(b) Exchange rate over the last ten years 82
Table 10 Bulgarian lev: real exchange rate developments 83Table 11 External developments 83Table 12 Indicators of integration with the euro area 83
4 LONG-TERM INTEREST RATE DEVELOPMENTSTable 13 Long-term interest rates (LTIRs) 84Chart 6 Long-term interest rate (LTIR) 84
(a) Long-term interest rate (LTIR) 84(b) LTIR and HICP inflation differentials vis-à-vis the euro area 84
Table 14 Selected indicators of financial development and integration 84
LIST OF TABLES AND CHARTS
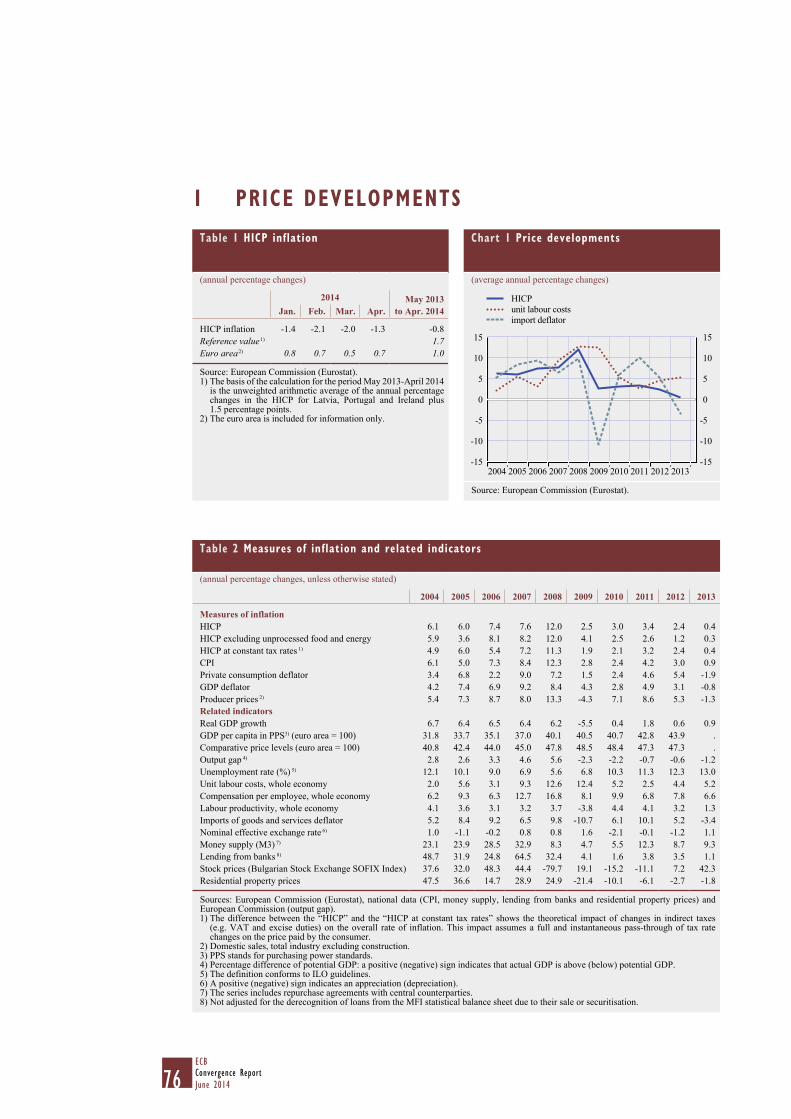
76ECBConvergence ReportJune 2014
1 PRICE DEVELOPMENTSChart 1 Price developments
(average annual percentage changes)
-15
-10
-5
0
5
10
15
-15
-10
-5
0
5
10
15
2012 2013
HICPunit labour costsimport deflator
2004 2005 2006 2007 2008 2009 2010 2011
Source: European Commission (Eurostat).
Table 1 HICP inflation
(annual percentage changes)
2014 May 2013 to Apr. 2014 Jan. Feb. Mar. Apr.
HICP inflation -1.4 -2.1 -2.0 -1.3 -0.8Reference value 1) 1.7Euro area 2) 0.8 0.7 0.5 0.7 1.0
Source: European Commission (Eurostat).1) The basis of the calculation for the period May 2013-April 2014
is the unweighted arithmetic average of the annual percentage changes in the HICP for Latvia, Portugal and Ireland plus 1.5 percentage points.
2) The euro area is included for information only.
Table 2 Measures of inflation and related indicators
(annual percentage changes, unless otherwise stated)
2004 2005 2006 2007 2008 2009 2010 2011 2012 2013
Measures of inflationHICP 6.1 6.0 7.4 7.6 12.0 2.5 3.0 3.4 2.4 0.4HICP excluding unprocessed food and energy 5.9 3.6 8.1 8.2 12.0 4.1 2.5 2.6 1.2 0.3HICP at constant tax rates 1) 4.9 6.0 5.4 7.2 11.3 1.9 2.1 3.2 2.4 0.4CPI 6.1 5.0 7.3 8.4 12.3 2.8 2.4 4.2 3.0 0.9Private consumption deflator 3.4 6.8 2.2 9.0 7.2 1.5 2.4 4.6 5.4 -1.9GDP deflator 4.2 7.4 6.9 9.2 8.4 4.3 2.8 4.9 3.1 -0.8Producer prices 2) 5.4 7.3 8.7 8.0 13.3 -4.3 7.1 8.6 5.3 -1.3Related indicatorsReal GDP growth 6.7 6.4 6.5 6.4 6.2 -5.5 0.4 1.8 0.6 0.9GDP per capita in PPS3) (euro area = 100) 31.8 33.7 35.1 37.0 40.1 40.5 40.7 42.8 43.9 .Comparative price levels (euro area = 100) 40.8 42.4 44.0 45.0 47.8 48.5 48.4 47.3 47.3 .Output gap 4) 2.8 2.6 3.3 4.6 5.6 -2.3 -2.2 -0.7 -0.6 -1.2Unemployment rate (%) 5) 12.1 10.1 9.0 6.9 5.6 6.8 10.3 11.3 12.3 13.0Unit labour costs, whole economy 2.0 5.6 3.1 9.3 12.6 12.4 5.2 2.5 4.4 5.2Compensation per employee, whole economy 6.2 9.3 6.3 12.7 16.8 8.1 9.9 6.8 7.8 6.6Labour productivity, whole economy 4.1 3.6 3.1 3.2 3.7 -3.8 4.4 4.1 3.2 1.3Imports of goods and services deflator 5.2 8.4 9.2 6.5 9.8 -10.7 6.1 10.1 5.2 -3.4Nominal effective exchange rate 6) 1.0 -1.1 -0.2 0.8 0.8 1.6 -2.1 -0.1 -1.2 1.1Money supply (M3) 7) 23.1 23.9 28.5 32.9 8.3 4.7 5.5 12.3 8.7 9.3Lending from banks 8) 48.7 31.9 24.8 64.5 32.4 4.1 1.6 3.8 3.5 1.1Stock prices (Bulgarian Stock Exchange SOFIX Index) 37.6 32.0 48.3 44.4 -79.7 19.1 -15.2 -11.1 7.2 42.3Residential property prices 47.5 36.6 14.7 28.9 24.9 -21.4 -10.1 -6.1 -2.7 -1.8
Sources: European Commission (Eurostat), national data (CPI, money supply, lending from banks and residential property prices) and European Commission (output gap).1) The difference between the “HICP” and the “HICP at constant tax rates” shows the theoretical impact of changes in indirect taxes
(e.g. VAT and excise duties) on the overall rate of inflation. This impact assumes a full and instantaneous pass-through of tax rate changes on the price paid by the consumer.
2) Domestic sales, total industry excluding construction.3) PPS stands for purchasing power standards.4) Percentage difference of potential GDP: a positive (negative) sign indicates that actual GDP is above (below) potential GDP.5) The definition conforms to ILO guidelines.6) A positive (negative) sign indicates an appreciation (depreciation).7) The series includes repurchase agreements with central counterparties.8) Not adjusted for the derecognition of loans from the MFI statistical balance sheet due to their sale or securitisation.

77ECB
Convergence ReportJune 2014
BULGARIA
Table 3 Recent inflation trends and forecasts
(annual percentage changes)
(a) Recent trends in the HICP2013 2014
Nov. Dec. Jan. Feb. Mar. Apr.
HICPAnnual percentage change -1.0 -0.9 -1.4 -2.1 -2.0 -1.3Change in the average of the latest three months from the previous three months, annualised rate, seasonally adjusted -1.9 -0.5 -0.4 -1.4 -3.1 -3.2Change in the average of the latest six months from the previous six months, annualised rate, seasonally adjusted -1.4 -1.6 -1.5 -1.6 -1.5 -1.6
Sources: European Commission (Eurostat) and ECB calculations.
(b) Inflation forecasts2014 2015
HICP, European Commission (Spring 2014) -0.8 1.2CPI, OECD (May 2014)1) - -CPI, IMF (April 2014) -0.4 0.9CPI, Consensus Economics (April 2014) 0.9 2.3
Sources: European Commission, OECD, IMF and Consensus Economics.1) Bulgaria is not a member of the OECD.

78ECBConvergence ReportJune 2014
2 FISCAL DEVELOPMENTSTable 4 General government fiscal position
(as a percentage of GDP)
2012 2013 2014 1)
General government surplus (+)/deficit (-) -0.8 -1.5 -1.9Reference value -3.0 -3.0 -3.0Surplus/deficit, net of government investment expenditure 2) 2.6 2.6 2.5
General government gross debt 18.4 18.9 23.1Reference value 60.0 60.0 60.0
Sources: European Commission (Eurostat, DG ECFIN) and ECB calculations.1) European Commission projections.2) A positive (negative) sign indicates that the government deficit is lower (higher) than government investment expenditure.
Table 5 General government budgetary position
(as a percentage of GDP)
2004 2005 2006 2007 2008 2009 2010 2011 2012 2013
Total revenue 40.4 38.3 36.2 40.4 40.1 37.1 34.3 33.6 35.0 37.2Current revenue 40.2 38.0 35.8 38.9 38.9 35.9 32.8 32.3 33.3 34.9
Direct taxes 5.7 4.7 4.8 7.6 6.1 5.6 5.1 4.9 4.9 5.2Indirect taxes 16.3 16.6 17.2 16.7 17.4 15.1 14.9 14.5 15.1 15.1 Social security contributions 10.2 9.7 8.3 8.1 7.8 7.7 7.0 7.3 7.2 7.8 Other current revenue 7.9 7.0 5.5 6.4 7.6 7.4 5.8 5.5 6.0 6.8
Capital revenue 0.2 0.3 0.4 1.5 1.1 1.3 1.5 1.3 1.7 2.3 Total expenditure 38.6 37.3 34.4 39.2 38.4 41.4 37.4 35.6 35.8 38.7
Current expenditure 35.0 33.4 30.5 30.9 32.7 36.3 32.5 31.9 31.8 34.1 Compensation of employees 10.0 9.4 8.8 8.8 9.2 9.9 9.5 9.2 9.0 9.9Social benefits other than in kind 11.2 10.6 10.2 9.6 10.1 12.1 12.6 11.9 11.6 12.5Interest payable 1.9 1.6 1.3 1.2 0.9 0.8 0.7 0.7 0.9 0.8
of which: impact of swaps and FRAs 1) 0.0 0.0 0.0 0.0 0.0 0.0 0.0 0.0 0.0 0.0 Other current expenditure 11.8 11.8 10.2 11.3 12.5 13.4 9.7 10.1 10.3 11.0
Capital expenditure 3.6 3.8 3.9 8.3 5.7 5.2 4.9 3.7 4.0 4.6
Surplus (+)/deficit (-) 1.9 1.0 1.9 1.2 1.7 -4.3 -3.1 -2.0 -0.8 -1.5
Primary balance 3.8 2.7 3.2 2.3 2.6 -3.6 -2.4 -1.2 0.1 -0.7Surplus/deficit, net of government investment expenditure 5.0 4.5 5.9 6.4 7.3 0.6 1.5 1.4 2.6 2.6
Sources: ESCB and European Commission (Eurostat).Notes: Differences between totals and the sum of their components are due to rounding. Interest payable as reported under the excessive deficit procedure. The item “impact of swaps and FRAs” is equal to the difference between the interest (or deficit/surplus) as defined in the excessive deficit procedure and in the ESA 95. See Regulation (EC) No 2558/2001 of the European Parliament and of the Council of 3 December 2001 amending Council Regulation (EC) No 2223/96 as regards the reclassification of settlements under swap arrangements and under forward rate agreements (0J L 344, 28.12.2001, p. 1).1) FRAs stands for forward rate agreements.
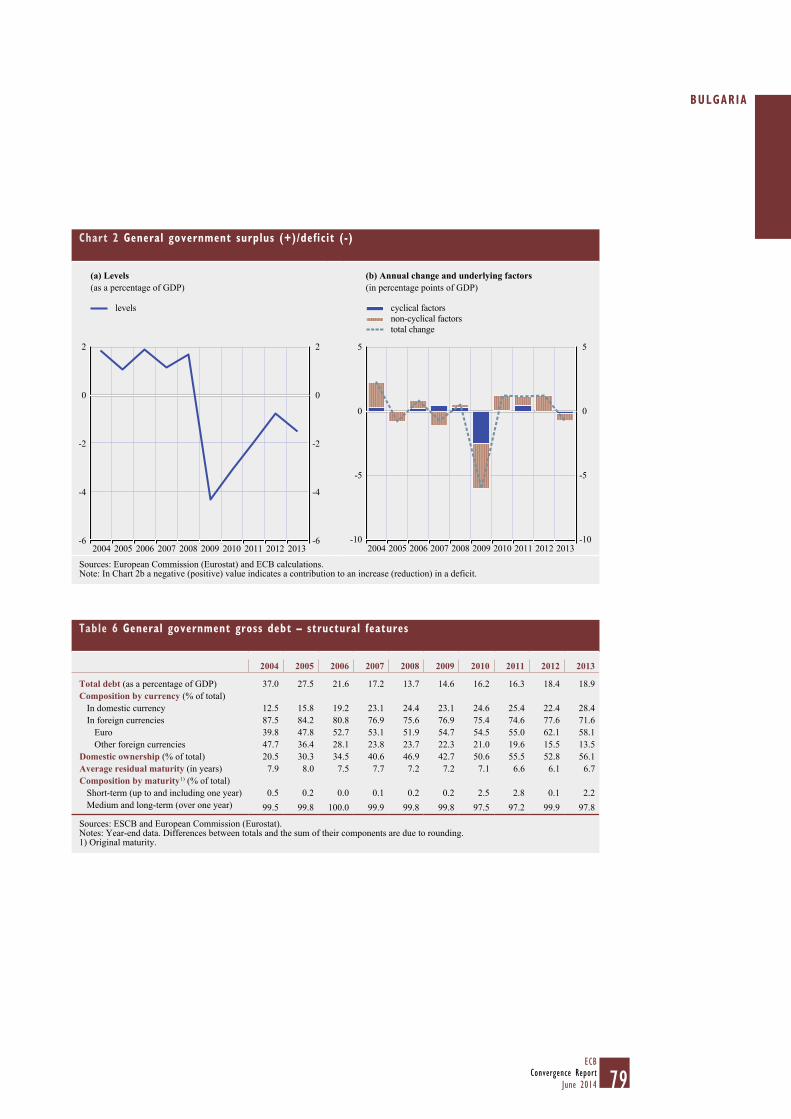
79ECB
Convergence ReportJune 2014
BULGARIA
Chart 2 General government surplus (+)/deficit (-)
(a) Levels(as a percentage of GDP)
(b) Annual change and underlying factors(in percentage points of GDP)
-6
-4
-2
0
2
-6
-4
-2
0
2
2004 2005 2006 2007 2008 2009 2010 2011 2012 2013
levels
-10
-5
0
5
-10
-5
0
5
cyclical factorsnon-cyclical factorstotal change
2004 2005 2006 2007 2008 2009 2010 2011 2012 2013
Sources: European Commission (Eurostat) and ECB calculations.Note: In Chart 2b a negative (positive) value indicates a contribution to an increase (reduction) in a deficit.
Table 6 General government gross debt – structural features
2004 2005 2006 2007 2008 2009 2010 2011 2012 2013
Total debt (as a percentage of GDP) 37.0 27.5 21.6 17.2 13.7 14.6 16.2 16.3 18.4 18.9Composition by currency (% of total)
In domestic currency 12.5 15.8 19.2 23.1 24.4 23.1 24.6 25.4 22.4 28.4In foreign currencies 87.5 84.2 80.8 76.9 75.6 76.9 75.4 74.6 77.6 71.6
Euro 39.8 47.8 52.7 53.1 51.9 54.7 54.5 55.0 62.1 58.1Other foreign currencies 47.7 36.4 28.1 23.8 23.7 22.3 21.0 19.6 15.5 13.5
Domestic ownership (% of total) 20.5 30.3 34.5 40.6 46.9 42.7 50.6 55.5 52.8 56.1Average residual maturity (in years) 7.9 8.0 7.5 7.7 7.2 7.2 7.1 6.6 6.1 6.7Composition by maturity 1) (% of total)
Short-term (up to and including one year) 0.5 0.2 0.0 0.1 0.2 0.2 2.5 2.8 0.1 2.2Medium and long-term (over one year) 99.5 99.8 100.0 99.9 99.8 99.8 97.5 97.2 99.9 97.8
Sources: ESCB and European Commission (Eurostat).Notes: Year-end data. Differences between totals and the sum of their components are due to rounding.1) Original maturity.
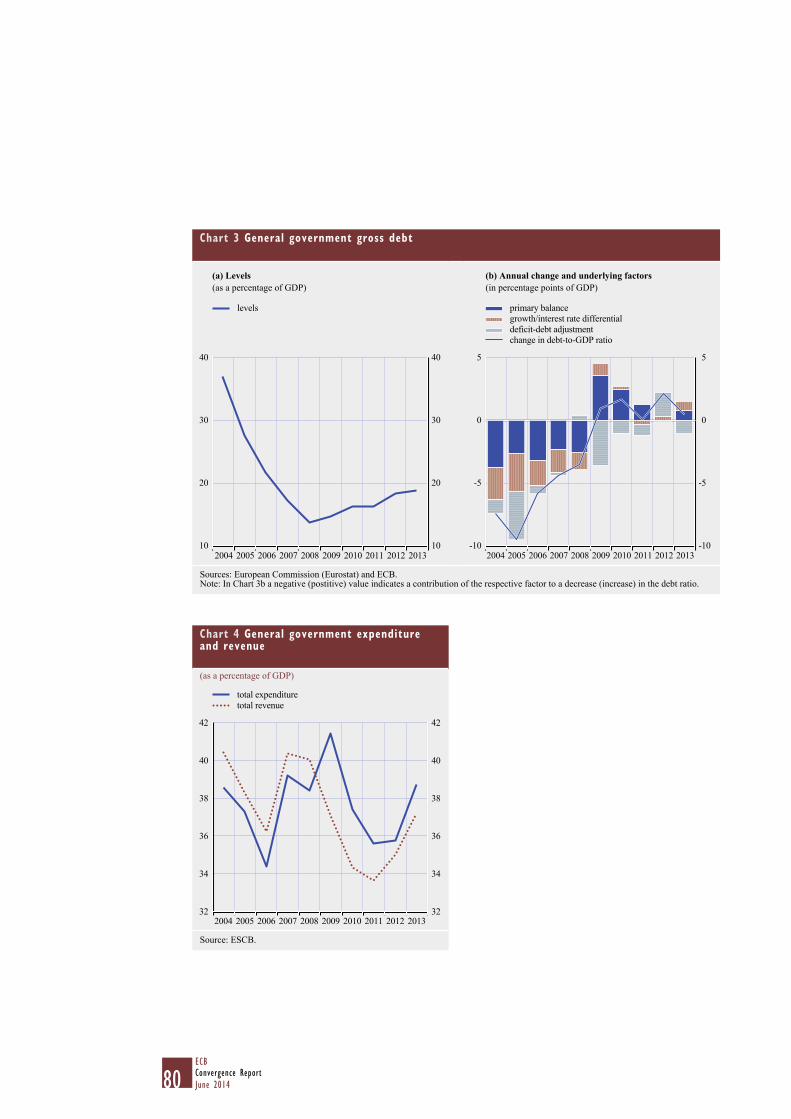
80ECBConvergence ReportJune 2014
Chart 3 General government gross debt
(a) Levels(as a percentage of GDP)
(b) Annual change and underlying factors(in percentage points of GDP)
10
20
30
40
10
20
30
40
levels
2004 2005 2006 2007 2008 2009 2010 2011 2012 2013-10
-5
0
5
-10
-5
0
5
primary balancegrowth/interest rate differentialdeficit-debt adjustmentchange in debt-to-GDP ratio
2004 2005 2006 2007 2008 2009 2010 2011 2012 2013
Sources: European Commission (Eurostat) and ECB.Note: In Chart 3b a negative (postitive) value indicates a contribution of the respective factor to a decrease (increase) in the debt ratio.
Chart 4 General government expenditure and revenue
(as a percentage of GDP)
32
34
36
38
40
42
32
34
36
38
40
42
2012 2013
total expendituretotal revenue
2004 2005 2006 2007 2008 2009 2010 2011
Source: ESCB.
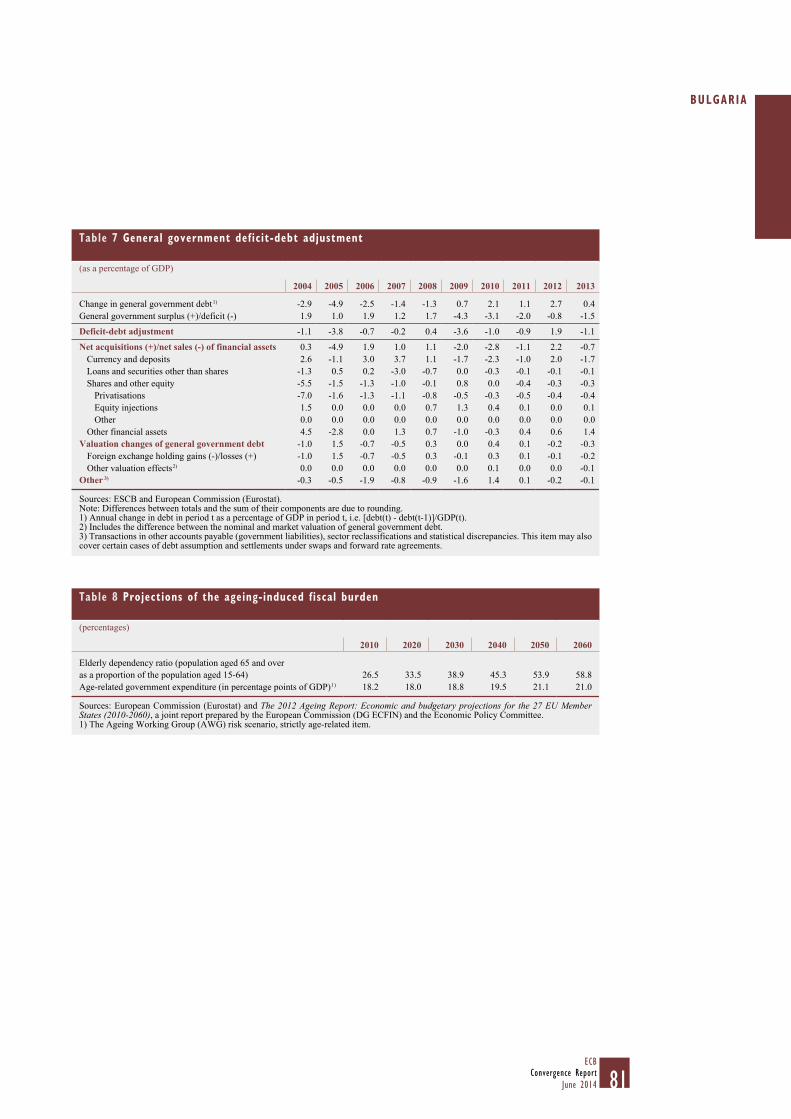
81ECB
Convergence ReportJune 2014
BULGARIA
Table 7 General government deficit-debt adjustment
(as a percentage of GDP)
2004 2005 2006 2007 2008 2009 2010 2011 2012 2013
Change in general government debt 1) -2.9 -4.9 -2.5 -1.4 -1.3 0.7 2.1 1.1 2.7 0.4General government surplus (+)/deficit (-) 1.9 1.0 1.9 1.2 1.7 -4.3 -3.1 -2.0 -0.8 -1.5
Deficit-debt adjustment -1.1 -3.8 -0.7 -0.2 0.4 -3.6 -1.0 -0.9 1.9 -1.1
Net acquisitions (+)/net sales (-) of financial assets 0.3 -4.9 1.9 1.0 1.1 -2.0 -2.8 -1.1 2.2 -0.7Currency and deposits 2.6 -1.1 3.0 3.7 1.1 -1.7 -2.3 -1.0 2.0 -1.7Loans and securities other than shares -1.3 0.5 0.2 -3.0 -0.7 0.0 -0.3 -0.1 -0.1 -0.1Shares and other equity -5.5 -1.5 -1.3 -1.0 -0.1 0.8 0.0 -0.4 -0.3 -0.3
Privatisations -7.0 -1.6 -1.3 -1.1 -0.8 -0.5 -0.3 -0.5 -0.4 -0.4Equity injections 1.5 0.0 0.0 0.0 0.7 1.3 0.4 0.1 0.0 0.1Other 0.0 0.0 0.0 0.0 0.0 0.0 0.0 0.0 0.0 0.0
Other financial assets 4.5 -2.8 0.0 1.3 0.7 -1.0 -0.3 0.4 0.6 1.4Valuation changes of general government debt -1.0 1.5 -0.7 -0.5 0.3 0.0 0.4 0.1 -0.2 -0.3
Foreign exchange holding gains (-)/losses (+) -1.0 1.5 -0.7 -0.5 0.3 -0.1 0.3 0.1 -0.1 -0.2Other valuation effects 2) 0.0 0.0 0.0 0.0 0.0 0.0 0.1 0.0 0.0 -0.1
Other 3) -0.3 -0.5 -1.9 -0.8 -0.9 -1.6 1.4 0.1 -0.2 -0.1
Sources: ESCB and European Commission (Eurostat).Note: Differences between totals and the sum of their components are due to rounding.1) Annual change in debt in period t as a percentage of GDP in period t, i.e. [debt(t) - debt(t-1)]/GDP(t).2) Includes the difference between the nominal and market valuation of general government debt.3) Transactions in other accounts payable (government liabilities), sector reclassifications and statistical discrepancies. This item may also cover certain cases of debt assumption and settlements under swaps and forward rate agreements.
Table 8 Projections of the ageing-induced fiscal burden
(percentages)
2010 2020 2030 2040 2050 2060
Elderly dependency ratio (population aged 65 and over as a proportion of the population aged 15-64) 26.5 33.5 38.9 45.3 53.9 58.8Age-related government expenditure (in percentage points of GDP) 1) 18.2 18.0 18.8 19.5 21.1 21.0
Sources: European Commission (Eurostat) and The 2012 Ageing Report: Economic and budgetary projections for the 27 EU Member States (2010-2060), a joint report prepared by the European Commission (DG ECFIN) and the Economic Policy Committee.1) The Ageing Working Group (AWG) risk scenario, strictly age-related item.
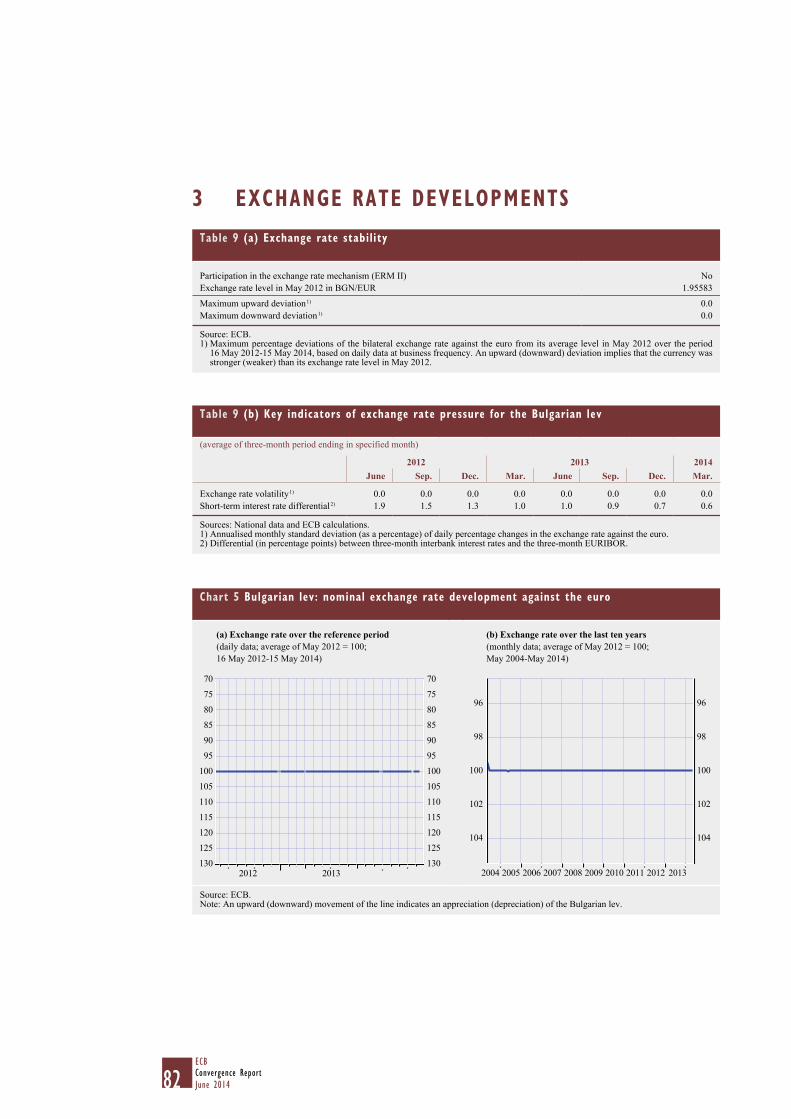
82ECBConvergence ReportJune 2014
3 EXCHANGE RATE DEVELOPMENTSTable 9 (a) Exchange rate stability
Participation in the exchange rate mechanism (ERM II) NoExchange rate level in May 2012 in BGN/EUR 1.95583
Maximum upward deviation 1) 0.0Maximum downward deviation 1) 0.0
Source: ECB.1) Maximum percentage deviations of the bilateral exchange rate against the euro from its average level in May 2012 over the period
16 May 2012-15 May 2014, based on daily data at business frequency. An upward (downward) deviation implies that the currency was stronger (weaker) than its exchange rate level in May 2012.
Chart 5 Bulgarian lev: nominal exchange rate development against the euro
(a) Exchange rate over the reference period(daily data; average of May 2012 = 100; 16 May 2012-15 May 2014)
(b) Exchange rate over the last ten years (monthly data; average of May 2012 = 100; May 2004-May 2014)
130
125
120
115
110
105
100
95
90
85
80
75
70
130
125
120
115
110
105
100
95
90
85
80
75
70
2012 2013
104
102
100
98
96
104
102
100
98
96
2004 2005 2006 2007 2008 2009 2010 2011 2012 2013
Source: ECB.Note: An upward (downward) movement of the line indicates an appreciation (depreciation) of the Bulgarian lev.
Table 9 (b) Key indicators of exchange rate pressure for the Bulgarian lev
(average of three-month period ending in specified month)
2012 2013 2014June Sep. Dec. Mar. June Sep. Dec. Mar.
Exchange rate volatility 1) 0.0 0.0 0.0 0.0 0.0 0.0 0.0 0.0Short-term interest rate differential 2) 1.9 1.5 1.3 1.0 1.0 0.9 0.7 0.6
Sources: National data and ECB calculations.1) Annualised monthly standard deviation (as a percentage) of daily percentage changes in the exchange rate against the euro.2) Differential (in percentage points) between three-month interbank interest rates and the three-month EURIBOR.
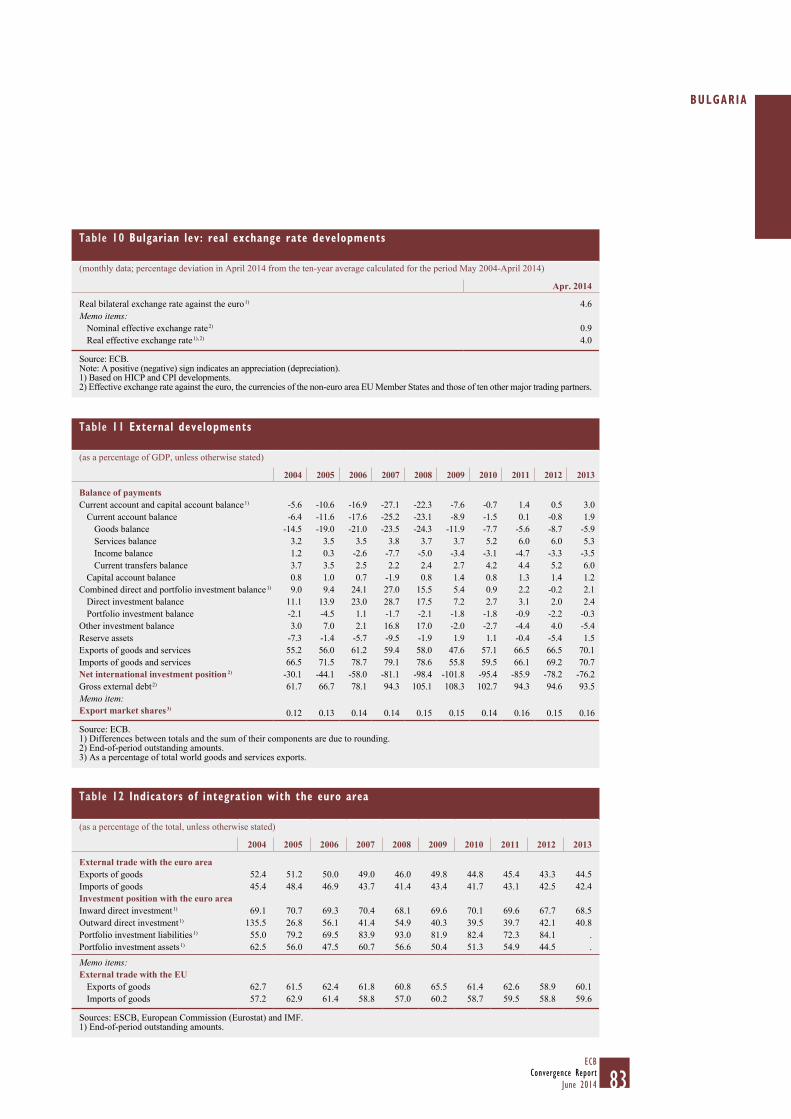
83ECB
Convergence ReportJune 2014
BULGARIA
Table 10 Bulgarian lev: real exchange rate developments
(monthly data; percentage deviation in April 2014 from the ten-year average calculated for the period May 2004-April 2014)
Apr. 2014
Real bilateral exchange rate against the euro 1) 4.6Memo items:
Nominal effective exchange rate 2) 0.9Real effective exchange rate 1), 2) 4.0
Source: ECB.Note: A positive (negative) sign indicates an appreciation (depreciation).1) Based on HICP and CPI developments.2) Effective exchange rate against the euro, the currencies of the non-euro area EU Member States and those of ten other major trading partners.
Table 11 External developments
(as a percentage of GDP, unless otherwise stated)
2004 2005 2006 2007 2008 2009 2010 2011 2012 2013
Balance of paymentsCurrent account and capital account balance 1) -5.6 -10.6 -16.9 -27.1 -22.3 -7.6 -0.7 1.4 0.5 3.0
Current account balance -6.4 -11.6 -17.6 -25.2 -23.1 -8.9 -1.5 0.1 -0.8 1.9Goods balance -14.5 -19.0 -21.0 -23.5 -24.3 -11.9 -7.7 -5.6 -8.7 -5.9Services balance 3.2 3.5 3.5 3.8 3.7 3.7 5.2 6.0 6.0 5.3Income balance 1.2 0.3 -2.6 -7.7 -5.0 -3.4 -3.1 -4.7 -3.3 -3.5Current transfers balance 3.7 3.5 2.5 2.2 2.4 2.7 4.2 4.4 5.2 6.0
Capital account balance 0.8 1.0 0.7 -1.9 0.8 1.4 0.8 1.3 1.4 1.2Combined direct and portfolio investment balance 1) 9.0 9.4 24.1 27.0 15.5 5.4 0.9 2.2 -0.2 2.1
Direct investment balance 11.1 13.9 23.0 28.7 17.5 7.2 2.7 3.1 2.0 2.4Portfolio investment balance -2.1 -4.5 1.1 -1.7 -2.1 -1.8 -1.8 -0.9 -2.2 -0.3
Other investment balance 3.0 7.0 2.1 16.8 17.0 -2.0 -2.7 -4.4 4.0 -5.4Reserve assets -7.3 -1.4 -5.7 -9.5 -1.9 1.9 1.1 -0.4 -5.4 1.5Exports of goods and services 55.2 56.0 61.2 59.4 58.0 47.6 57.1 66.5 66.5 70.1Imports of goods and services 66.5 71.5 78.7 79.1 78.6 55.8 59.5 66.1 69.2 70.7Net international investment position 2) -30.1 -44.1 -58.0 -81.1 -98.4 -101.8 -95.4 -85.9 -78.2 -76.2Gross external debt 2) 61.7 66.7 78.1 94.3 105.1 108.3 102.7 94.3 94.6 93.5Memo item:Export market shares 3) 0.12 0.13 0.14 0.14 0.15 0.15 0.14 0.16 0.15 0.16
Source: ECB.1) Differences between totals and the sum of their components are due to rounding.2) End-of-period outstanding amounts.3) As a percentage of total world goods and services exports.
Table 12 Indicators of integration with the euro area
(as a percentage of the total, unless otherwise stated)
2004 2005 2006 2007 2008 2009 2010 2011 2012 2013
External trade with the euro areaExports of goods 52.4 51.2 50.0 49.0 46.0 49.8 44.8 45.4 43.3 44.5Imports of goods 45.4 48.4 46.9 43.7 41.4 43.4 41.7 43.1 42.5 42.4Investment position with the euro areaInward direct investment 1) 69.1 70.7 69.3 70.4 68.1 69.6 70.1 69.6 67.7 68.5Outward direct investment 1) 135.5 26.8 56.1 41.4 54.9 40.3 39.5 39.7 42.1 40.8Portfolio investment liabilities 1) 55.0 79.2 69.5 83.9 93.0 81.9 82.4 72.3 84.1 .Portfolio investment assets 1) 62.5 56.0 47.5 60.7 56.6 50.4 51.3 54.9 44.5 .
Memo items: External trade with the EU
Exports of goods 62.7 61.5 62.4 61.8 60.8 65.5 61.4 62.6 58.9 60.1Imports of goods 57.2 62.9 61.4 58.8 57.0 60.2 58.7 59.5 58.8 59.6
Sources: ESCB, European Commission (Eurostat) and IMF.1) End-of-period outstanding amounts.
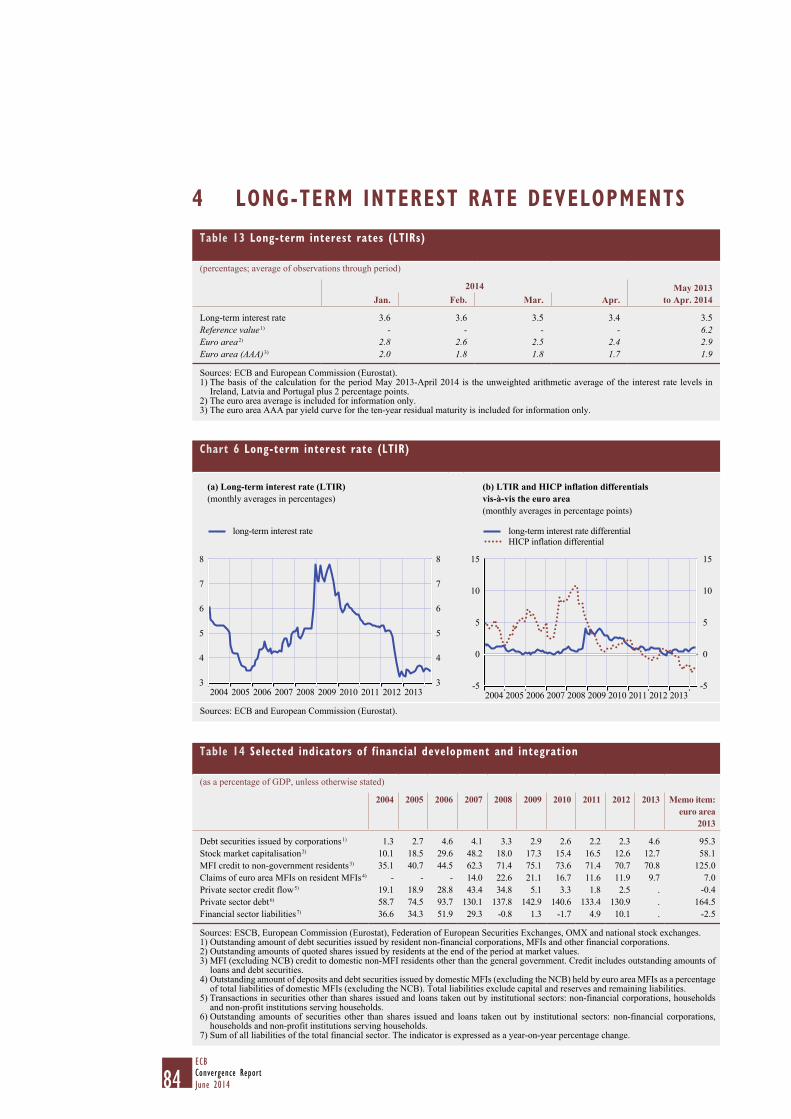
84ECBConvergence ReportJune 2014
4 LONG-TERM INTEREST RATE DEVELOPMENTSTable 13 Long-term interest rates (LTIRs)
(percentages; average of observations through period)
2014 May 2013to Apr. 2014 Jan. Feb. Mar. Apr.
Long-term interest rate 3.6 3.6 3.5 3.4 3.5Reference value 1) - - - - 6.2Euro area 2) 2.8 2.6 2.5 2.4 2.9Euro area (AAA) 3) 2.0 1.8 1.8 1.7 1.9
Sources: ECB and European Commission (Eurostat).1) The basis of the calculation for the period May 2013-April 2014 is the unweighted arithmetic average of the interest rate levels in
Ireland, Latvia and Portugal plus 2 percentage points.2) The euro area average is included for information only.3) The euro area AAA par yield curve for the ten-year residual maturity is included for information only.
Table 14 Selected indicators of financial development and integration
(as a percentage of GDP, unless otherwise stated)
2004 2005 2006 2007 2008 2009 2010 2011 2012 2013 Memo item: euro area
2013
Debt securities issued by corporations 1) 1.3 2.7 4.6 4.1 3.3 2.9 2.6 2.2 2.3 4.6 95.3Stock market capitalisation 2) 10.1 18.5 29.6 48.2 18.0 17.3 15.4 16.5 12.6 12.7 58.1MFI credit to non-government residents 3) 35.1 40.7 44.5 62.3 71.4 75.1 73.6 71.4 70.7 70.8 125.0Claims of euro area MFIs on resident MFIs 4) - - - 14.0 22.6 21.1 16.7 11.6 11.9 9.7 7.0Private sector credit flow 5) 19.1 18.9 28.8 43.4 34.8 5.1 3.3 1.8 2.5 . -0.4Private sector debt 6) 58.7 74.5 93.7 130.1 137.8 142.9 140.6 133.4 130.9 . 164.5Financial sector liabilities 7) 36.6 34.3 51.9 29.3 -0.8 1.3 -1.7 4.9 10.1 . -2.5
Sources: ESCB, European Commission (Eurostat), Federation of European Securities Exchanges, OMX and national stock exchanges.1) Outstanding amount of debt securities issued by resident non-financial corporations, MFIs and other financial corporations.2) Outstanding amounts of quoted shares issued by residents at the end of the period at market values.3) MFI (excluding NCB) credit to domestic non-MFI residents other than the general government. Credit includes outstanding amounts of
loans and debt securities.4) Outstanding amount of deposits and debt securities issued by domestic MFIs (excluding the NCB) held by euro area MFIs as a percentage
of total liabilities of domestic MFIs (excluding the NCB). Total liabilities exclude capital and reserves and remaining liabilities.5) Transactions in securities other than shares issued and loans taken out by institutional sectors: non-financial corporations, households
and non-profit institutions serving households.6) Outstanding amounts of securities other than shares issued and loans taken out by institutional sectors: non-financial corporations,
households and non-profit institutions serving households.7) Sum of all liabilities of the total financial sector. The indicator is expressed as a year-on-year percentage change.
Chart 6 Long-term interest rate (LTIR)
(a) Long-term interest rate (LTIR)(monthly averages in percentages)
(b) LTIR and HICP inflation differentials vis-à-vis the euro area(monthly averages in percentage points)
3
4
5
6
7
8
3
4
5
6
7
8
2012 20132004 2005 2006 2007 2008 2009 2010 2011
long-term interest rate
-5
0
5
10
15
-5
0
5
10
15
2012 20132004 2005 2006 2007 2008 2009 2010 2011
long-term interest rate differentialHICP inflation differential
Sources: ECB and European Commission (Eurostat).
85ECB
Convergence ReportJune 2014
CZECH REPUBLIC
5.2 CZECH REPUBLIC
5.2.1 PRICE DEVELOPMENTS
Over the reference period from May 2013 to April 2014, the 12-month average rate of HICP inflation in the Czech Republic was 0.9%, i.e. well below the reference value of 1.7% for the criterion on price stability (see Table 1). On the basis of the most recent information, the 12-month average rate of HICP inflation is expected to decrease slightly in the coming months.
Looking back over a longer period, annual consumer price inflation in the Czech Republic fluctuated in a range from 1.6% to 3% during the period 2004-07 (see Chart 1). Towards the end of 2007 price pressures started to pick up again, mainly as a result of higher food and energy prices and some administrative measures. Inflation rates remained elevated for most of 2008, standing at more than 6% on average. Driven by the collapse of global and domestic demand and by base effects related to earlier increases, consumer price inflation started to fall sharply in late 2008, reaching 0.6% in 2009. From late 2009 higher global commodity and food prices, as well as hikes in administered prices and the value added tax (VAT) rate, gradually pushed up inflation to 3.5% in 2012. Thereafter, the effects of these factors started to wane, which together with the weakness in domestic demand, brought inflation down to 1.4% in 2013.
The Czech Republic’s medium-term inflation performance reflects a number of important policy choices, most notably the orientation of monetary policy towards the achievement of price stability. In 1998 the Czech Republic adopted an inflation targeting framework, having abandoned the fixed peg of the koruna in 1997 in favour of a flexible exchange rate regime. Since April 2001 the inflation target has been defined in terms of CPI inflation, originally as a continuously declining band and, since 2006, as a flat point target. The CPI inflation target was set at 3% (±1 percentage point) in 2006 and reduced to 2% (±1 percentage point) on 1 January 2010. In November 2013, in ordertofulfilitsmandatetomaintainpricestability,Českánárodníbankaintervenedtoweakenthedomestic currency and made a commitment not to let the koruna appreciate against the euro beyond a certain level. While fiscal policy contributed to inflationary pressures during the period 2004-09, a tightening in fiscal policy thereafter contributed to taming inflation from 2009 to 2013.
Inflation developments should be viewed against the background of the various cyclical phases that the economy has been through over the past ten years. Between 2004 and 2007 macroeconomic developments were driven by a sustained upswing in economic activity. However, the Czech economy started to slow markedly in 2008 and slid into recession in 2009 as a result of the collapse in world trade. Reflecting the cooling economy, growth in property prices – while still robust – slumped in 2008 and fell into deep negative territory in 2009. While the economy was hit by a significant contraction in exports and domestic demand, particularly for investment, the recession was relatively modest compared with that in other central and eastern European economies. Nevertheless, the export-led recovery that took place in 2010-11 ebbed quickly in response to the slowdown in import demand in the euro area, which ultimately resulted in a contraction of the economy in 2012-13. Before the global financial and economic crisis, the sustained high level of growth, driven in particular by foreign direct investment into export-oriented industries, contributed to an improvement in labour market conditions and an increase in the growth of credit to the private sector. For most of the period under review, growth in compensation per employee exceeded labour productivity growth. In the wake of the global financial turmoil, growth in unit labour costs slowed in 2009 and turned negative in 2010, particularly on account of the rise in unemployment together
86ECBConvergence ReportJune 2014
with relatively moderate increases in compensation per employee. However, in 2011 it turned positive again and in 2012 it accelerated further, owing to a deterioration in cyclical conditions and the negative impact this had on labour productivity growth, alongside a slight adjustment in wages. In 2013 growth in unit labour costs was slightly below zero, owing to a significant decline in compensation per employee. The fall in import prices throughout most of the period from 2005 to 2010 and the rise from 2011 were largely due to the appreciation and subsequent depreciation of the koruna compounded by a surge in global commodity prices over the period 2011-12. The effects of these factors waned in 2013, which together with the weak external environment, resulted in a marked slowdown in import price growth. At the end of 2013, however, growth in import pricespickedup,followingthedepreciationofthekorunainthewakeoftheinterventionbyČeskánárodní banka. The general pattern of inflation developments in the Czech Republic was alsoreflected in other relevant indices, such as the HICP excluding unprocessed food and energy.
Looking at recent developments, the annual rate of HICP inflation decelerated significantly in early 2014, owing to the fading effects of past increases in indirect taxes and a sharp decline in regulated prices for electricity. In April 2014 inflation stood at 0.2% (see Table 3a). Although food prices, administered prices and hikes in indirect taxes remained the main sources of inflation in 2013, their contributions decreased over the year. Nevertheless, headline inflation accelerated at the end of 2013, driven by a pick-up in energy and food prices that partly reflected the depreciation of the koruna. By contrast, weak domestic demand and subdued cost pressures tended to dampen inflation.
The latest available forecasts from major international institutions project inflation to increase gradually in 2014-15, ranging from 0.1% to 1.0% and from 1.8% to 2.2% respectively (see Table 3b). A sizeable fall in administered price growth and an unwinding of the first-round effects of the VAT hike in 2013 are expected to dampen inflationary pressures in 2014. However, stronger domestic demand and higher prices for imported goods are expected to drive up inflation towards the 2% target over the forecast horizon. Risks to the inflation outlook are balanced. Upside risks are associated with larger than expected hikes in commodity prices, while downside risks relate mainly to weaker than expected economic activity. Looking further ahead, the catching-up process may have a bearing on inflation and/or the nominal exchange rate over the coming years, given that GDP per capita and price levels are still lower in the Czech Republic than in the euro area (see Table 2). However, it is difficult to assess the exact size of the effect resulting from this catching-up process.
Achieving an environment that is conducive to sustainable convergence in the Czech Republic requires, among other things, maintaining a price stability-oriented monetary policy in the medium term. Regarding macroeconomic imbalances, the European Commission did not select the Czech Republic for an in-depth review in its Alert Mechanism Report 2014. Specifically, progress in the areas below will help to achieve an environment that is conducive to sustainable price stability and promote competitiveness and employment growth.
Improvements in the functioning of the labour market (for example, by reducing disincentives for second earners and the low-skilled unemployed to take up work, by addressing skill mismatches through the creation of closer links between universities and the business sector, and by increasing incentives for females to participate in the labour force) are needed to boost potential growth.
In addition, it will be essential to strengthen competition in product markets (in particular electricity, gas and telecommunications), improve the effectiveness of the public administration and increase
87ECB
Convergence ReportJune 2014
CZECH REPUBLIC
investment in infrastructure. Against this background, significant effort should be made to ensure that the Czech Republic has a better absorption capacity of EU funds. Priority should also be given to further improving the business environment, including eliminating corruption in the public sector. As the process of income convergence vis-à-vis the euro area has stalled, the implementation of these structural measures should facilitate changes to the Czech Republic’s growth model, which has relied mainly on foreign direct investment and exports of manufacturing goods.
Financial sector policies should be geared towards continued vigilance, a careful monitoring of potential risks and close cross-border cooperation, given the high level of foreign ownership in the financial sector and the vulnerability of some foreign parent banks. Finally, financial stability could benefit from the Czech Republic’s participation in the SSM, which will take up its prudential supervisory tasks in November 2014.
5.2.2 FISCAL DEVELOPMENTS
The Czech Republic is currently subject to an EU Council decision on the existence of an excessive deficit. In the reference year 2013 the general government budget balance recorded a deficit of 1.5% of GDP, i.e. well below the 3% reference value. The general government gross debt-to-GDP ratio was 46.0%, i.e. below the 60% reference value (see Table 4). The budget balance ratio improved by 2.7 percentage points compared with the previous year, while the public debt ratio decreased by 0.2 percentage point. In 2014 the deficit ratio is forecast by the European Commission to increase to 1.9% and the government debt ratio to decrease to 44.4%. With regard to other fiscal factors, the deficit ratio did not exceed the ratio of public investment to GDP in 2013, nor is it expected to in 2014.
Looking at developments in the Czech Republic’s budgetary position over the period from 2004 to 2013, after declining to 0.7% in 2007, the deficit-to-GDP ratio rose sharply to 5.8% in 2009 and then declined to 1.5% in 2013 (see Table 5). As the deficit-to-GDP ratio rose above the 3% of GDP reference value in 2009, the ECOFIN Council decided on 2 December 2009 that an excessive deficit situation existed in the Czech Republic and set a deadline of 2013 for correcting it.
As shown in greater detail in Chart 2b, European Commission estimates indicate that cyclical factors had a positive impact on the change in the budget balance between 2004 and 2007 and again in 2010 and 2011. In 2009 – when the financial and economic crisis affected public finances – and in 2012 and 2013, cyclical factors had a negative impact on the change in the budget balance. Over the entire period under consideration, non-cyclical factors had a volatile impact on the changes in the deficit ratio. Non-cyclical factors were a major factor in the deterioration in the budget balance from 2008-09 as a result of tax reform and two fiscal stimulus packages. This trend was reversed in 2010, when the Czech government implemented a fiscal consolidation package consisting, inter alia, of indirect and property tax increases, a freeze in pensions and public wages and the withdrawal of stimulus measures. Non-cyclical factors led to a deterioration in the budget balance in 2012 owing to a one-off capital transfer to compensate for church property confiscated during the communist period. On the other hand, non-cyclical factors resulted in a significant reduction in the budget deficit in 2013 owing to a large cut in capital expenditure. In the absence of any substantial temporary and one-off factors between 2004 and 2013, the underlying changes in the budget deficit seem to reflect a structural deterioration of the Czech Republic’s fiscal position until 2009, and a structural improvement thereafter.
88ECBConvergence ReportJune 2014
Turning to developments in general government gross debt, the debt-to-GDP ratio increased cumulatively by 17.1 percentage points between 2004 and 2013. After hovering below 30% until 2008, it rose significantly over the period 2009-13 (see Chart 3a and Table 6). As shown in greater detail in Chart 3b, the primary budget balance had a debt-increasing effect before 2013, with the exception of 2007. On the back of deteriorating macroeconomic and financial conditions, the growth-interest rate differential contributed to an increase in debt, particularly in 2009 and 2012. By contrast, deficit-debt adjustments had a debt-decreasing effect in 2009-10. In 2013 the small decrease in the general government debt-to-GDP ratio reflected a debt-decreasing effect from deficit-debt adjustments that outweighed the debt-increasing effects of the growth-interest rate differential, while the effect of the primary balance was neutral.
As regards the Czech Republic’s general government debt structure, the share of government debt with a short-term maturity declined from 16.3% in 2004 to 6.3% in 2008, before starting to increase and becoming more noticeable by the end of 2012. It fell again in 2013 to 6.9% (see Table 6). Taking into account the level of the debt ratio, fiscal balances are relatively insensitive to changes in interest rates. The proportion of government debt denominated in foreign currency is noticeable (19.2% in 2013) but, given the overall debt level, fiscal balances are relatively insensitive to changes in exchange rates. During the crisis, the share of debt with a short-term maturity increased but remained low, pointing to limited debt-related vulnerabilities. However, the share of debt denominated in foreign currency has more than doubled since 2007, while remaining below 20%. At the same time, the Czech government has not incurred contingent liabilities resulting from government interventions to support financial institutions and financial markets during the crisis (see Section 5.9).
Moving on to examine trends in other fiscal indicators, Chart 4 and Table 5 show that the general government total expenditure-to-GDP ratio declined overall from 43.3% in 2004 to 42.4% in 2013, with intermediate peaks in 2009 and 2012. Overall, during the period under consideration, and particularly in 2009-13, “social benefits other than in kind” increased and remained at elevated levels when compared with the period 2004-08. Capital spending decreased as a ratio to GDP in 2010 and 2011 and again (strongly) in 2013. Total government revenue as a share of GDP increased slightly over the period under consideration (40.9% of GDP in 2013, compared with 40.4% in 2004). Overall, indirect taxes and capital revenues increased somewhat during the 2009-2013 period compared with 2004-2008, while direct taxes decreased.
Looking ahead, the Czech Republic’s medium-term fiscal policy strategy indicates the commitment of the current government to keep the ESA 95 deficit below the reference value in 2014 and thereafter. According to the 2014-17 convergence programme update, the ESA 95 budget deficit will rise to 1.8% of GDP in 2014 and further to 2.3% of GDP in 2015, before starting to fall again and reaching 1.7% of GDP by 2017. The structural deficit is projected to remain above the medium-term objective of 1.0% of GDP (specified in line with the Stability and Growth Pact) in the entire period from 2014 to 2017. According to the European Commission’s projections, the structural deficit will remain above the medium-term objective throughout the projection horizon.
The Czech Republic has not signed the Treaty on Stability, Coordination and Governance in the Economic and Monetary Union (TSCG), although the Czech government recently announced that it would sign it in the near future. However, this decision has still to be approved by the Czech parliament.

89ECB
Convergence ReportJune 2014
CZECH REPUBLIC
As regards fiscal governance, the Czech Republic comprehensively reformed its public finance framework in 2004. However, further efforts appear to be necessary to improve the coordination between different levels of government, including through a new fiscal rule for local and regional governments. Establishing an independent fiscal council to monitor and regularly assess public finance developments would be a step in the right direction. A stronger enforcement mechanism for the existing fiscal rules, better monitoring and ex post evaluation of budgetary performance, as well as greater consideration of sustainability in fiscal targeting, are also needed. Full compliance with the provisions for an enhanced national governance framework under Council Directive 2011/85/EU should be ensured, as referred to in Box 2 of Chapter 2.
Turning to factors that will have an impact on the Czech Republic’s public finances over the long term, a marked ageing of the population is expected, as highlighted in Table 8. According to the 2012 projections by the European Commission and the EU’s Economic Policy Committee, starting from a level of 20.2% of GDP in 2010, the Czech Republic is likely to experience a significant increase in strictly age-related public expenditure amounting to 6.4 percentage points of GDP in the years to 2060, well above the EU average.3 It will be easier to cope with the overall burden if sufficient room for manoeuvre is created in the public finances before the period in which the demographic situation is projected to worsen.
With respect to fiscal challenges, the Czech Republic must ensure that it reduces the budget deficit to its medium-term objective in a timely and sustainable manner. This requires the continuation of a prudent expenditure policy in the medium term. In addition, pension system reform should be adopted to reduce the burden of age-related public expenditure in the long term. The Czech Republic should take more determined measures to improve its fiscal institutional framework in order to strengthen public finance sustainability while avoiding pro-cyclical fiscal policies and to address inefficiencies and ineffectiveness in public spending. It is particularly important that the domestic fiscal institutional framework is improved further in order to anchor the sustainability of future fiscal policies firmly, given that the Czech Republic has not yet signed the TSCG. At the same time, the Czech Republic needs to fully comply with its existing obligations under the enhanced Stability and Growth Pact. Over the longer run, the risks to medium-term fiscal sustainability suggest that structural fiscal reforms are warranted that focus on avoiding pro-cyclical fiscal policies, as well as improving the sustainability of the pension system, tax administration, municipalities’ fiscal responsibility and the overall quality of economic governance.
5.2.3 EXCHANGE RATE DEVELOPMENTS
In the two-year reference period from 16 May 2012 to 15 May 2014, the Czech koruna did not participate in ERM II, but traded under a flexible exchange rate regime (see Table 9a). However, on7November2013Českánárodníbankaannouncedthatitwouldinterveneinforeignexchangemarkets with the goal of weakening the koruna in order to prevent a long-term undershooting of the inflation target and made a commitment not to let the exchange rate of the koruna against the euro appreciate beyond a certain level. The Czech currency mostly traded close to its May 2012 average exchange rate against the euro, which is used as a benchmark for illustrative purposes in the absence of an ERM II central rate, although since November 2013 it has traded substantially below this benchmark rate. On 15 May 2014 the exchange rate stood at 27.440 korunas per euro, i.e. 8.4% weaker than its average level in May 2012. Over the reference period the maximum upward
3 European Commission and Economic Policy Committee, “The 2012 Ageing Report: Economic and budgetary projections for the EU-27 Member States (2010-2060)”.
90ECBConvergence ReportJune 2014
deviation from this benchmark was 3.5%, while the maximum downward deviation amounted to 9.6% (see Chart 5 and Table 9a). After the announcement of foreign exchange interventions in November2013,Českánárodníbankasolddomesticcurrencyinexchangeforforeigncurrency.
The exchange rate of the Czech koruna against the euro was, on average, subject to a relatively high degree of volatility, as measured by annualised standard deviations in daily percentage changes. Between May 2012 and September 2012 the Czech koruna appreciated by around 4% against the euro on account of improving global financial market conditions and growing investor confidence in the region. Thereafter the currency depreciated gradually against the euro by about 5% until early November 2013, in an environment of small and declining interest rate differentials vis-à-vis euroareaassets,asČeskánárodníbankalowereditspolicyrateandinviewofpotentialforeignexchange interventions. Following Česká národní banka’s announcement to conduct foreignexchange interventions, the currency depreciated further – by around 7% vis-à-vis the euro – to a level in linewithČeskánárodní banka’s asymmetric exchange rate commitment to a floor of27 korunas per euro. Over the reference period short-term interest rate differentials against the three-month EURIBOR were overall small, and stood at 0.1 percentage point in the three-month period ending in March 2014 (see Table 9b).
In a longer-term context, in April 2014 both the real effective exchange rate and the real bilateral exchange rate of the Czech koruna against the euro stood close to the corresponding ten-year historical averages (see Table 10). However, these indicators should be interpreted with caution, as during this period the Czech Republic was subject to a process of economic convergence, which complicates any historical assessment of real exchange rate developments.
As regards other external developments, the Czech Republic recorded a deficit of 5.5% of GDP in the combined current and capital account of its balance of payments in 2004 (see Table 11). The deficit narrowed rapidly in 2005 to 0.8% of GDP on account of significant improvements in the balances on trade in goods and in services, as well as a temporary reduction of the deficit of the balance of income. Thereafter, rapidly increasing income payments on direct investment liabilities led to a widening of the external deficit in 2006 and 2007, which then adjusted in 2008 and 2009 owing to a strong fall in domestic demand. After an increase in the deficit to 3.0% of GDP in 2010 owing to a declining surplus on trade in goods and a further worsening of the income account, the external deficit decreased slightly in 2011, while improving further to 0.0% of GDP in 2012 and recording a surplus of 0.5% in 2013. The shifts recorded in the Czech Republic’s balance of payments over the past few years have been associated with significant capital inflows. The large net inflows in direct investment of, on average, more than 5.0% of GDP exceeded the financing needs of the Czech economy until 2007, but declined significantly thereafter to around 1.0% of GDP in 2008 and 2009. Net direct investment inflows recovered to 3.2% of GDP in 2012, but fell to 0.9% in 2013. Net inflows of portfolio investment amounted to 1.4% of GDP in 2012 and 2.4% in 2013. Against this background, gross external debt increased from 40.1% of GDP in 2005 to 62.0% in 2012 and 71.0% in 2013. At the same time the country’s net international investment position deteriorated substantially from -28.2% of GDP in 2004 to -48.8% in 2012, before improving to 45.6% in 2013. The Czech Republic is a small open economy, and the ratio of foreign trade in goods and services to GDP increased from 67.2% in 2004 to 79.6% in 2013 for exports and from 67.1% in 2004 to 73.4% in 2013 for imports. Over the same period the Czech Republic’s share in world exports decreased from 0.71% to 0.65%.
With regard to measures of economic integration with the euro area, in 2013 exports of goods to the euro area constituted 63.0% of total goods exports, whereas the corresponding figure for
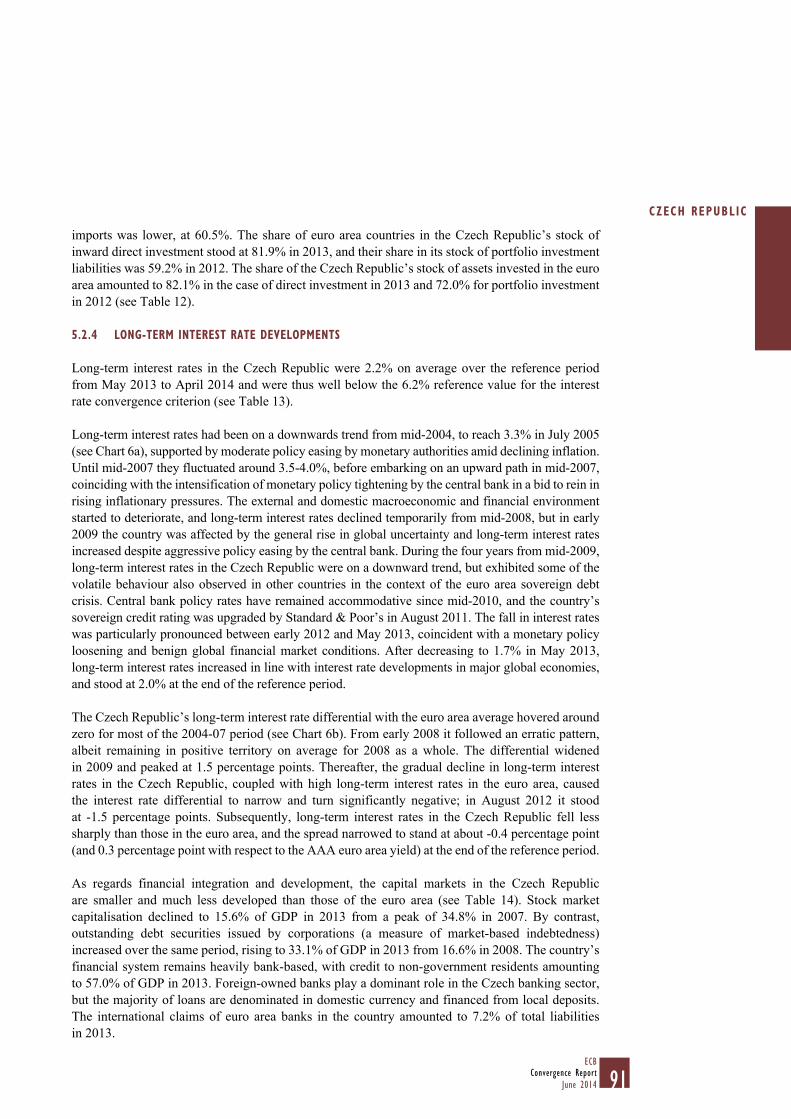
91ECB
Convergence ReportJune 2014
CZECH REPUBLIC
imports was lower, at 60.5%. The share of euro area countries in the Czech Republic’s stock of inward direct investment stood at 81.9% in 2013, and their share in its stock of portfolio investment liabilities was 59.2% in 2012. The share of the Czech Republic’s stock of assets invested in the euro area amounted to 82.1% in the case of direct investment in 2013 and 72.0% for portfolio investment in 2012 (see Table 12).
5.2.4 LONG-TERM INTEREST RATE DEVELOPMENTS
Long-term interest rates in the Czech Republic were 2.2% on average over the reference period from May 2013 to April 2014 and were thus well below the 6.2% reference value for the interest rate convergence criterion (see Table 13).
Long-term interest rates had been on a downwards trend from mid-2004, to reach 3.3% in July 2005 (see Chart 6a), supported by moderate policy easing by monetary authorities amid declining inflation. Until mid-2007 they fluctuated around 3.5-4.0%, before embarking on an upward path in mid-2007, coinciding with the intensification of monetary policy tightening by the central bank in a bid to rein in rising inflationary pressures. The external and domestic macroeconomic and financial environment started to deteriorate, and long-term interest rates declined temporarily from mid-2008, but in early 2009 the country was affected by the general rise in global uncertainty and long-term interest rates increased despite aggressive policy easing by the central bank. During the four years from mid-2009, long-term interest rates in the Czech Republic were on a downward trend, but exhibited some of the volatile behaviour also observed in other countries in the context of the euro area sovereign debt crisis. Central bank policy rates have remained accommodative since mid-2010, and the country’s sovereign credit rating was upgraded by Standard & Poor’s in August 2011. The fall in interest rates was particularly pronounced between early 2012 and May 2013, coincident with a monetary policy loosening and benign global financial market conditions. After decreasing to 1.7% in May 2013, long-term interest rates increased in line with interest rate developments in major global economies, and stood at 2.0% at the end of the reference period.
The Czech Republic’s long-term interest rate differential with the euro area average hovered around zero for most of the 2004-07 period (see Chart 6b). From early 2008 it followed an erratic pattern, albeit remaining in positive territory on average for 2008 as a whole. The differential widened in 2009 and peaked at 1.5 percentage points. Thereafter, the gradual decline in long-term interest rates in the Czech Republic, coupled with high long-term interest rates in the euro area, caused the interest rate differential to narrow and turn significantly negative; in August 2012 it stood at -1.5 percentage points. Subsequently, long-term interest rates in the Czech Republic fell less sharply than those in the euro area, and the spread narrowed to stand at about -0.4 percentage point (and 0.3 percentage point with respect to the AAA euro area yield) at the end of the reference period.
As regards financial integration and development, the capital markets in the Czech Republic are smaller and much less developed than those of the euro area (see Table 14). Stock market capitalisation declined to 15.6% of GDP in 2013 from a peak of 34.8% in 2007. By contrast, outstanding debt securities issued by corporations (a measure of market-based indebtedness) increased over the same period, rising to 33.1% of GDP in 2013 from 16.6% in 2008. The country’s financial system remains heavily bank-based, with credit to non-government residents amounting to 57.0% of GDP in 2013. Foreign-owned banks play a dominant role in the Czech banking sector, but the majority of loans are denominated in domestic currency and financed from local deposits. The international claims of euro area banks in the country amounted to 7.2% of total liabilities in 2013.

93ECB
Convergence ReportJune 2014
CZECH REPUBLIC
CZECH REPUBLIC
1 PRICE DEVELOPMENTS Table 1 HICP inflation 94Chart 1 Price developments 94Table 2 Measures of inflation and related indicators 94Table 3 Recent inflation trends and forecasts 95
(a) Recent trends in the HICP 95(b) Inflation forecasts 95
2 FISCAL DEVELOPMENTS Table 4 General government fiscal position 96Table 5 General government budgetary position 96Chart 2 General government surplus (+)/deficit (-) 97
(a) Levels 97(b) Annual change and underlying factors 97
Table 6 General government gross debt – structural features 97Chart 3 General government gross debt 98
(a) Levels 98(b) Annual change and underlying factors 98
Chart 4 General government expenditure and revenue 98Table 7 General government deficit-debt adjustment 99Table 8 Projections of the ageing-induced fiscal burden 99
3 EXCHANGE RATE DEVELOPMENTS Table 9 (a) Exchange rate stability 100
(b) Key indicators of exchange rate pressure for the Czech koruna 100Chart 5 Czech koruna: nominal exchange rate development against the euro 100
(a) Exchange rate over the reference period 100(b) Exchange rate over the last ten years 100
Table 10 Czech koruna: real exchange rate developments 101Table 11 External developments 101Table 12 Indicators of integration with the euro area 101
4 LONG-TERM INTEREST RATE DEVELOPMENTS Table 13 Long-term interest rates (LTIRs) 102Chart 6 Long-term interest rate (LTIR) 102
(a) Long-term interest rate (LTIR) 102(b) LTIR and HICP inflation differentials vis-à-vis the euro area 102
Table 14 Selected indicators of financial development and integration 102
LIST OF TABLES AND CHARTS

94ECBConvergence ReportJune 2014
1 PRICE DEVELOPMENTSTable 1 HICP inflation
(annual percentage changes)
2014 May 2013 to Apr. 2014 Jan. Feb. Mar. Apr.
HICP inflation 0.3 0.3 0.3 0.2 0.9 Reference value 1) 1.7 Euro area 2) 0.8 0.7 0.5 0.7 1.0
Source: European Commission (Eurostat).1) The basis of the calculation for the period May 2013-April 2014
is the unweighted arithmetic average of the annual percentage changes in the HICP for Latvia, Portugal and Ireland plus 1.5 percentage points.
2) The euro area is included for information only.
Chart 1 Price developments
(average annual percentage changes)
-4
-2
0
2
4
6
8
-4
-2
0
2
4
6
8
HICPunit labour costsimport deflator
2012 20132004 2005 2006 2007 2008 2009 2010 2011
Source: European Commission (Eurostat).
Table 2 Measures of inflation and related indicators
(annual percentage changes, unless otherwise stated)
2004 2005 2006 2007 2008 2009 2010 2011 2012 2013
Measures of inflationHICP 2.6 1.6 2.1 3.0 6.3 0.6 1.2 2.1 3.5 1.4 HICP excluding unprocessed food and energy 2.5 0.9 0.9 3.1 5.8 0.5 0.5 1.4 2.4 1.0 HICP at constant tax rates 1) 1.8 1.4 1.4 2.4 4.3 0.6 -0.1 2.1 2.2 0.5 CPI 2.8 1.8 2.5 2.9 6.3 1.0 1.5 1.9 3.3 1.4 Private consumption deflator 3.6 0.8 1.5 2.9 4.8 0.8 -0.2 0.5 2.7 1.1 GDP deflator 4.0 -0.3 0.5 3.3 1.9 2.3 -1.6 -0.9 1.6 1.9 Producer prices 2) 5.5 3.1 1.5 4.1 4.5 -3.1 1.2 5.6 2.1 0.8 Related indicatorsReal GDP growth 4.7 6.8 7.0 5.7 3.1 -4.5 2.5 1.8 -1.0 -0.9 GDP per capita in PPS 3) (euro area = 100) 71.9 72.8 73.7 76.2 74.5 76.2 74.3 74.6 74.9 . Comparative price levels (euro area = 100) 53.8 56.9 60.2 61.6 74.8 69.1 72.3 73.3 70.7 . Output gap 4) 0.6 2.5 5.0 5.9 4.7 -1.5 -0.8 -0.5 -1.9 -3.3 Unemployment rate (%) 5) 8.3 7.9 7.1 5.3 4.4 6.7 7.3 6.7 7.0 7.0 Unit labour costs, whole economy 2.9 -0.7 0.4 2.6 3.4 2.2 -0.4 0.5 3.3 -0.1 Compensation per employee, whole economy 8.2 3.8 6.0 6.3 4.2 -0.6 3.1 2.3 1.9 -1.9 Labour productivity, whole economy 5.1 4.6 5.6 3.5 0.8 -2.8 3.5 1.9 -1.4 -1.8 Imports of goods and services deflator 2.0 -0.2 0.7 -0.7 -3.1 -1.7 0.6 2.5 3.6 0.1 Nominal effective exchange rate 6) 1.2 6.2 5.1 3.0 12.3 -4.4 1.9 2.9 -4.0 -1.9 Money supply (M3) 7) 7.0 11.5 14.3 16.9 12.9 0.3 0.2 2.9 5.3 5.2 Lending from banks 8) 15.5 21.0 21.7 27.5 16.2 1.5 4.2 5.9 3.4 3.8 Stock prices (PX 50 Index) 56.6 42.7 7.9 14.2 -52.7 30.2 9.6 -25.6 14.0 -4.8 Residential property prices -0.8 0.6 6.6 21.1 14.0 -6.9 -3.1 0.9 -0.7 .
Sources: European Commission (Eurostat), national data (CPI, money supply, lending from banks and residential property prices) and European Commission (output gap).1) The difference between the “HICP” and the “HICP at constant tax rates” shows the theoretical impact of changes in indirect taxes
(e.g. VAT and excise duties) on the overall rate of inflation. This impact assumes a full and instantaneous pass-through of tax rate changes on the price paid by the consumer.
2) Domestic sales, total industry excluding construction.3) PPS stands for purchasing power standards.4) Percentage difference of potential GDP: a positive (negative) sign indicates that actual GDP is above (below) potential GDP.5) The definition conforms to ILO guidelines.6) A positive (negative) sign indicates an appreciation (depreciation).7) The series includes repurchase agreements with central counterparties.8) Not adjusted for the derecognition of loans from the MFI statistical balance sheet due to their sale or securitisation.
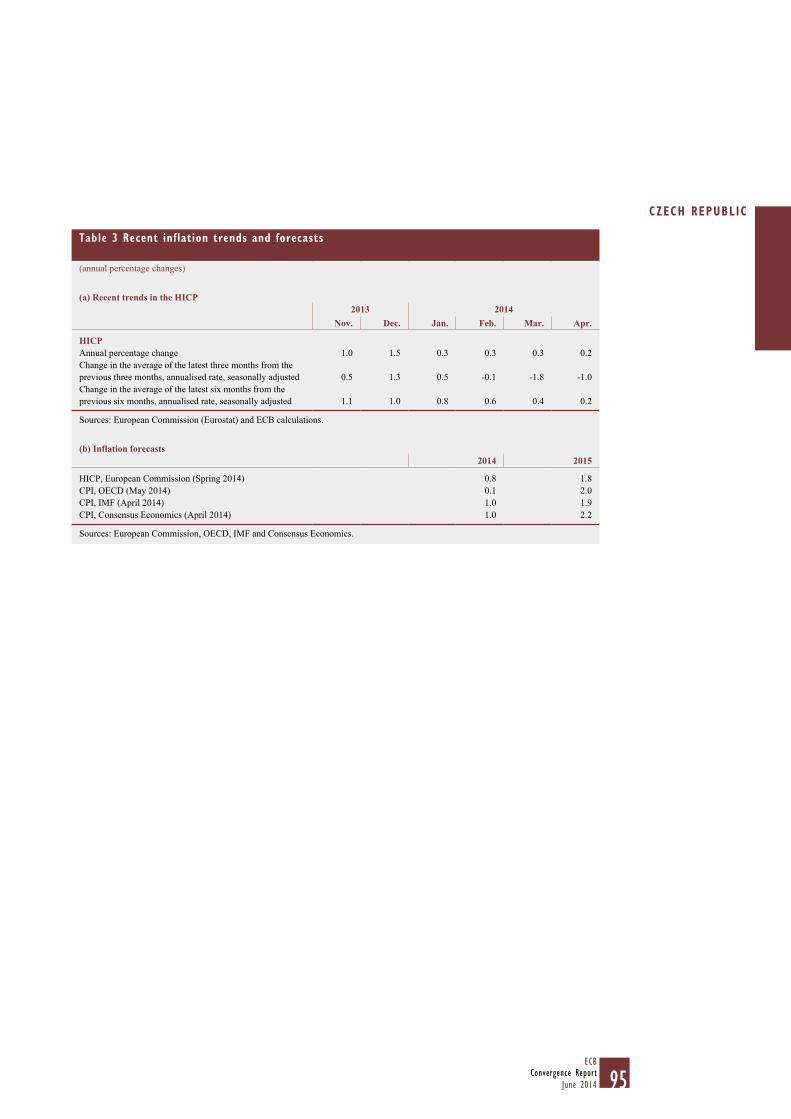
95ECB
Convergence ReportJune 2014
CZECH REPUBLIC
Table 3 Recent inflation trends and forecasts
(annual percentage changes)
(a) Recent trends in the HICP2013 2014
Nov. Dec. Jan. Feb. Mar. Apr.
HICPAnnual percentage change 1.0 1.5 0.3 0.3 0.3 0.2 Change in the average of the latest three months from the previous three months, annualised rate, seasonally adjusted 0.5 1.3 0.5 -0.1 -1.8 -1.0 Change in the average of the latest six months from the previous six months, annualised rate, seasonally adjusted 1.1 1.0 0.8 0.6 0.4 0.2
Sources: European Commission (Eurostat) and ECB calculations.
(b) Inflation forecasts2014 2015
HICP, European Commission (Spring 2014) 0.8 1.8 CPI, OECD (May 2014) 0.1 2.0 CPI, IMF (April 2014) 1.0 1.9 CPI, Consensus Economics (April 2014) 1.0 2.2
Sources: European Commission, OECD, IMF and Consensus Economics.

96ECBConvergence ReportJune 2014
2 FISCAL DEVELOPMENTSTable 4 General government fiscal position
(as a percentage of GDP)
2012 2013 2014 1)
General government surplus (+)/deficit (-) -4.2 -1.5 -1.9 Reference value -3.0 -3.0 -3.0 Surplus/deficit, net of government investment expenditure 2) -1.0 1.3 1.4
General government gross debt 46.2 46.0 44.4 Reference value 60.0 60.0 60.0
Sources: European Commission (Eurostat, DG ECFIN) and ECB calculations.1) European Commission projections.2) A positive (negative) sign indicates that the government deficit is lower (higher) than government investment expenditure.
Table 5 General government budgetary position
(as a percentage of GDP)
2004 2005 2006 2007 2008 2009 2010 2011 2012 2013
Total revenue 40.4 39.8 39.6 40.3 38.9 38.9 39.1 40.0 40.3 40.9 Current revenue 40.1 39.4 39.0 39.5 38.2 37.5 37.6 38.6 39.2 39.9
Direct taxes 9.1 8.9 8.8 9.0 8.0 7.2 6.9 7.2 7.2 7.3 Indirect taxes 11.1 11.0 10.5 10.8 10.6 11.0 11.1 11.6 12.2 12.4 Social security contributions 15.5 15.5 15.7 15.7 15.6 14.9 15.2 15.5 15.6 15.6 Other current revenue 4.4 4.1 4.0 4.0 4.0 4.3 4.3 4.3 4.3 4.6
Capital revenue 0.4 0.4 0.6 0.8 0.8 1.4 1.5 1.4 1.1 1.0 Total expenditure 43.3 43.0 42.0 41.0 41.2 44.7 43.8 43.2 44.5 42.4
Current expenditure 36.2 35.9 35.5 35.1 34.9 38.3 38.2 38.1 38.1 38.5 Compensation of employees 7.6 7.6 7.5 7.3 7.3 7.8 7.5 7.3 7.4 7.6 Social benefits other than in kind 12.3 12.0 12.2 12.5 12.4 13.5 13.7 13.8 13.9 14.0 Interest payable 1.1 1.1 1.1 1.1 1.1 1.3 1.4 1.4 1.5 1.4
of which: impact of swaps and FRAs 1) 0.0 0.0 0.0 0.0 0.0 0.0 0.1 0.0 0.0 0.0 Other current expenditure 15.3 15.1 14.7 14.2 14.2 15.7 15.6 15.6 15.3 15.5
Capital expenditure 7.1 7.1 6.5 6.0 6.2 6.4 5.6 5.1 6.4 3.9
Surplus (+)/deficit (-) -2.8 -3.2 -2.4 -0.7 -2.2 -5.8 -4.7 -3.2 -4.2 -1.5
Primary balance -1.8 -2.2 -1.3 0.4 -1.2 -4.5 -3.3 -1.8 -2.7 -0.1 Surplus/deficit, net of government investment expenditure 1.4 1.0 2.1 3.4 2.3 -0.7 -0.5 0.4 -1.0 1.3
Sources: ESCB and European Commission (Eurostat).Notes: Differences between totals and the sum of their components are due to rounding. Interest payable as reported under the excessive deficit procedure. The item “impact of swaps and FRAs” is equal to the difference between the interest (or deficit/surplus) as defined in the excessive deficit procedure and in the ESA 95. See Regulation (EC) No 2558/2001 of the European Parliament and of the Council of 3 December 2001 amending Council Regulation (EC) No 2223/96 as regards the reclassification of settlements under swap arrangements and under forward rate agreements (0J L 344, 28.12.2001, p. 1).1) FRAs stands for forward rate agreements.
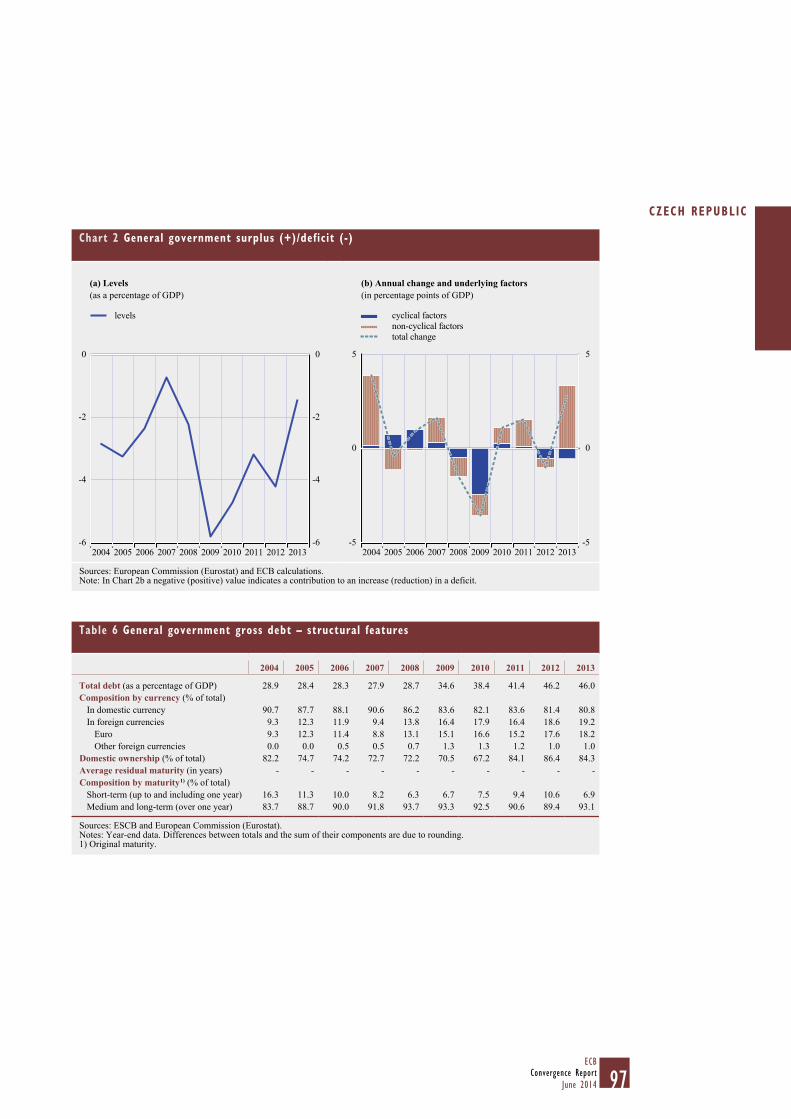
97ECB
Convergence ReportJune 2014
CZECH REPUBLIC
Chart 2 General government surplus (+)/deficit (-)
(a) Levels(as a percentage of GDP)
(b) Annual change and underlying factors(in percentage points of GDP)
-6
-4
-2
0
-6
-4
-2
0
2004 2006 2008 2010 20122005 2007 2009 2011 2013
levels
-5
0
5
-5
0
5
2012
cyclical factorsnon-cyclical factorstotal change
2004 2006 2008 2010 20132005 2007 2009 2011
Sources: European Commission (Eurostat) and ECB calculations.Note: In Chart 2b a negative (positive) value indicates a contribution to an increase (reduction) in a deficit.
Table 6 General government gross debt – structural features
2004 2005 2006 2007 2008 2009 2010 2011 2012 2013
Total debt (as a percentage of GDP) 28.9 28.4 28.3 27.9 28.7 34.6 38.4 41.4 46.2 46.0 Composition by currency (% of total)
In domestic currency 90.7 87.7 88.1 90.6 86.2 83.6 82.1 83.6 81.4 80.8 In foreign currencies 9.3 12.3 11.9 9.4 13.8 16.4 17.9 16.4 18.6 19.2
Euro 9.3 12.3 11.4 8.8 13.1 15.1 16.6 15.2 17.6 18.2 Other foreign currencies 0.0 0.0 0.5 0.5 0.7 1.3 1.3 1.2 1.0 1.0
Domestic ownership (% of total) 82.2 74.7 74.2 72.7 72.2 70.5 67.2 84.1 86.4 84.3 Average residual maturity (in years) - - - - - - - - - -Composition by maturity 1) (% of total)
Short-term (up to and including one year) 16.3 11.3 10.0 8.2 6.3 6.7 7.5 9.4 10.6 6.9 Medium and long-term (over one year) 83.7 88.7 90.0 91.8 93.7 93.3 92.5 90.6 89.4 93.1
Sources: ESCB and European Commission (Eurostat).Notes: Year-end data. Differences between totals and the sum of their components are due to rounding.1) Original maturity.

98ECBConvergence ReportJune 2014
Chart 3 General government gross debt
(a) Levels(as a percentage of GDP)
(b) Annual change and underlying factors(in percentage points of GDP)
20
30
40
50
20
30
40
50
2012 20132004 20062005 20082007 2009 2010 2011
levels
-5
0
5
10
-5
0
5
10
2012 2013
primary balancegrowth/interest rate differentialdeficit-debt adjustmentchange in debt-to-GDP ratio
2004 2005 20072006 2008 2009 2010 2011
Sources: European Commission (Eurostat) and ECB.Note: In Chart 3b a negative (postitive) value indicates a contribution of the respective factor to a decrease (increase) in the debt ratio.
Chart 4 General government expenditure and revenue
(as a percentage of GDP)
38
39
40
41
42
43
44
45
38
39
40
41
42
43
44
45
total expendituretotal revenue
20122004 2005 2007 2009 2011 20132006 2008 2010
Source: ESCB.
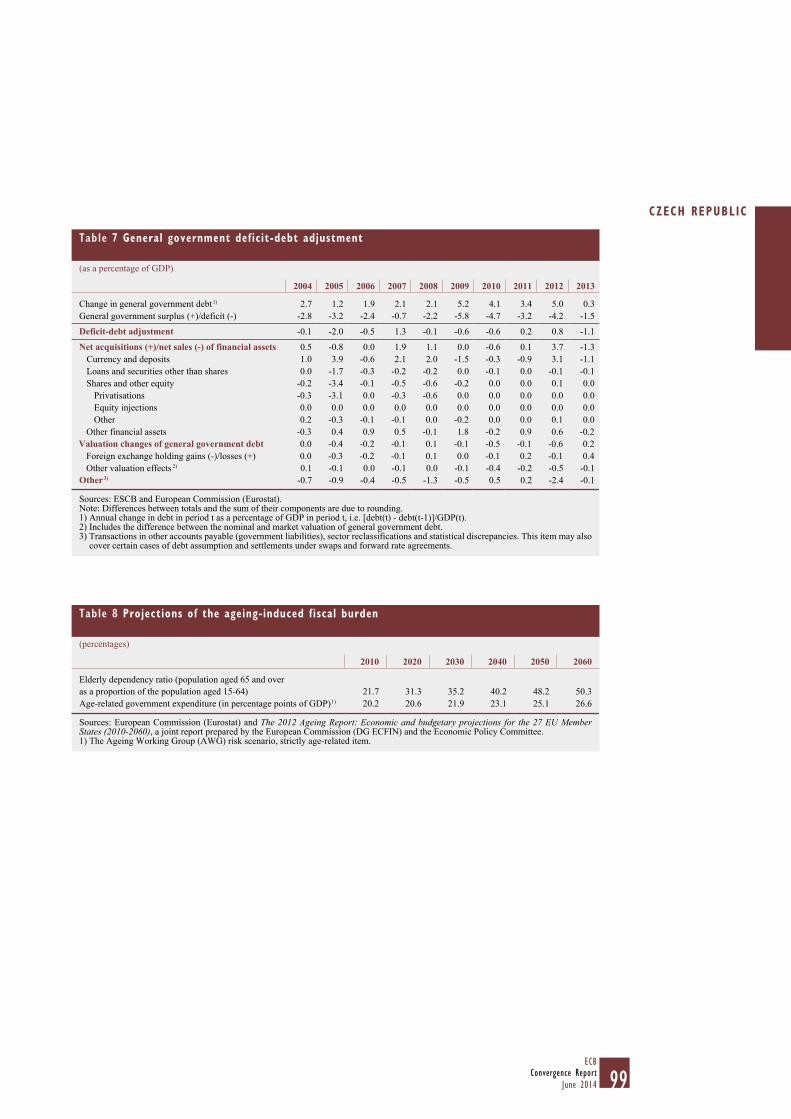
99ECB
Convergence ReportJune 2014
CZECH REPUBLIC
Table 7 General government deficit-debt adjustment
(as a percentage of GDP)
2004 2005 2006 2007 2008 2009 2010 2011 2012 2013
Change in general government debt 1) 2.7 1.2 1.9 2.1 2.1 5.2 4.1 3.4 5.0 0.3 General government surplus (+)/deficit (-) -2.8 -3.2 -2.4 -0.7 -2.2 -5.8 -4.7 -3.2 -4.2 -1.5
Deficit-debt adjustment -0.1 -2.0 -0.5 1.3 -0.1 -0.6 -0.6 0.2 0.8 -1.1
Net acquisitions (+)/net sales (-) of financial assets 0.5 -0.8 0.0 1.9 1.1 0.0 -0.6 0.1 3.7 -1.3 Currency and deposits 1.0 3.9 -0.6 2.1 2.0 -1.5 -0.3 -0.9 3.1 -1.1 Loans and securities other than shares 0.0 -1.7 -0.3 -0.2 -0.2 0.0 -0.1 0.0 -0.1 -0.1 Shares and other equity -0.2 -3.4 -0.1 -0.5 -0.6 -0.2 0.0 0.0 0.1 0.0
Privatisations -0.3 -3.1 0.0 -0.3 -0.6 0.0 0.0 0.0 0.0 0.0 Equity injections 0.0 0.0 0.0 0.0 0.0 0.0 0.0 0.0 0.0 0.0 Other 0.2 -0.3 -0.1 -0.1 0.0 -0.2 0.0 0.0 0.1 0.0
Other financial assets -0.3 0.4 0.9 0.5 -0.1 1.8 -0.2 0.9 0.6 -0.2 Valuation changes of general government debt 0.0 -0.4 -0.2 -0.1 0.1 -0.1 -0.5 -0.1 -0.6 0.2
Foreign exchange holding gains (-)/losses (+) 0.0 -0.3 -0.2 -0.1 0.1 0.0 -0.1 0.2 -0.1 0.4 Other valuation effects 2) 0.1 -0.1 0.0 -0.1 0.0 -0.1 -0.4 -0.2 -0.5 -0.1
Other 3) -0.7 -0.9 -0.4 -0.5 -1.3 -0.5 0.5 0.2 -2.4 -0.1
Sources: ESCB and European Commission (Eurostat).Note: Differences between totals and the sum of their components are due to rounding.1) Annual change in debt in period t as a percentage of GDP in period t, i.e. [debt(t) - debt(t-1)]/GDP(t).2) Includes the difference between the nominal and market valuation of general government debt.3) Transactions in other accounts payable (government liabilities), sector reclassifications and statistical discrepancies. This item may also
cover certain cases of debt assumption and settlements under swaps and forward rate agreements.
Table 8 Projections of the ageing-induced fiscal burden
(percentages)
2010 2020 2030 2040 2050 2060
Elderly dependency ratio (population aged 65 and over as a proportion of the population aged 15-64) 21.7 31.3 35.2 40.2 48.2 50.3 Age-related government expenditure (in percentage points of GDP) 1) 20.2 20.6 21.9 23.1 25.1 26.6
Sources: European Commission (Eurostat) and The 2012 Ageing Report: Economic and budgetary projections for the 27 EU Member States (2010-2060), a joint report prepared by the European Commission (DG ECFIN) and the Economic Policy Committee.1) The Ageing Working Group (AWG) risk scenario, strictly age-related item.
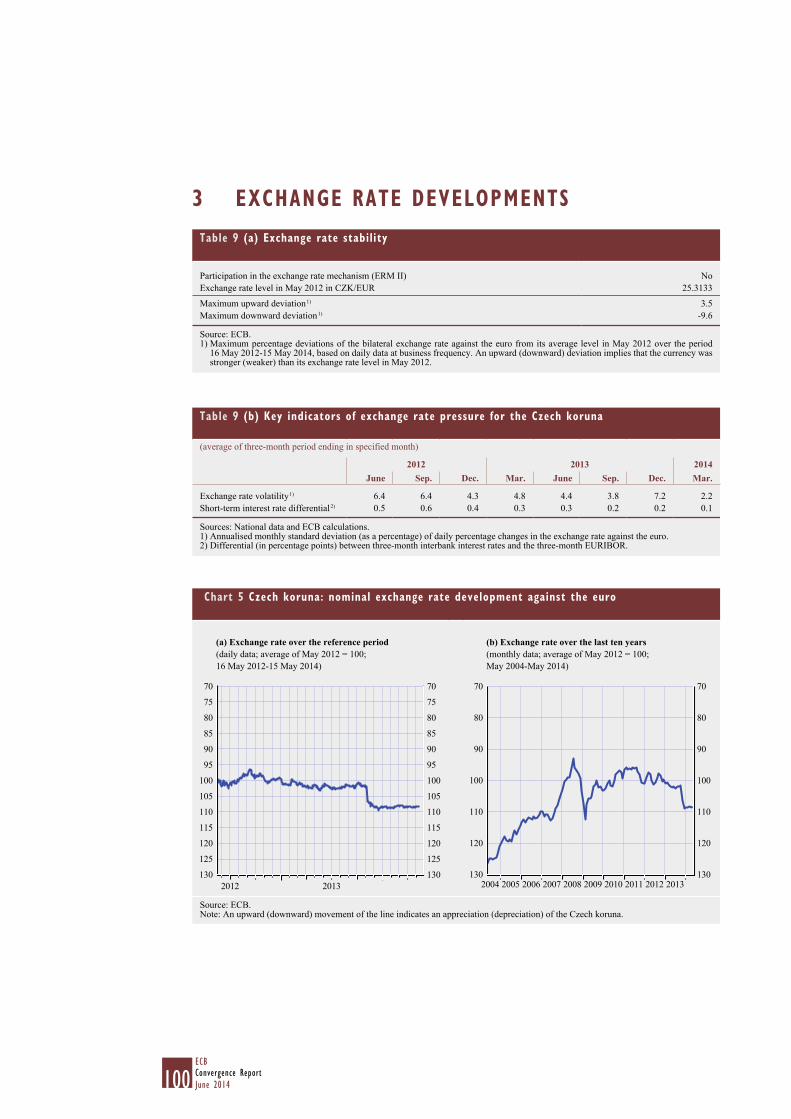
100ECBConvergence ReportJune 2014
3 EXCHANGE RATE DEVELOPMENTSTable 9 (a) Exchange rate stability
Participation in the exchange rate mechanism (ERM II) NoExchange rate level in May 2012 in CZK/EUR 25.3133
Maximum upward deviation 1) 3.5Maximum downward deviation 1) -9.6
Source: ECB.1) Maximum percentage deviations of the bilateral exchange rate against the euro from its average level in May 2012 over the period
16 May 2012-15 May 2014, based on daily data at business frequency. An upward (downward) deviation implies that the currency was stronger (weaker) than its exchange rate level in May 2012.
Table 9 (b) Key indicators of exchange rate pressure for the Czech koruna
(average of three-month period ending in specified month)
2012 2013 2014June Sep. Dec. Mar. June Sep. Dec. Mar.
Exchange rate volatility 1) 6.4 6.4 4.3 4.8 4.4 3.8 7.2 2.2 Short-term interest rate differential 2) 0.5 0.6 0.4 0.3 0.3 0.2 0.2 0.1
Sources: National data and ECB calculations.1) Annualised monthly standard deviation (as a percentage) of daily percentage changes in the exchange rate against the euro.2) Differential (in percentage points) between three-month interbank interest rates and the three-month EURIBOR.
Chart 5 Czech koruna: nominal exchange rate development against the euro
(a) Exchange rate over the reference period(daily data; average of May 2012 = 100; 16 May 2012-15 May 2014)
(b) Exchange rate over the last ten years(monthly data; average of May 2012 = 100; May 2004-May 2014)
130
125
120
115
110
105
100
95
90
85
80
75
70
130
125
120
115
110
105
100
95
90
85
80
75
70
2012 2013130
120
110
100
90
80
70
130
120
110
100
90
80
70
2012 201320052004 2006 2007 2008 2009 2010 2011
Source: ECB.Note: An upward (downward) movement of the line indicates an appreciation (depreciation) of the Czech koruna.
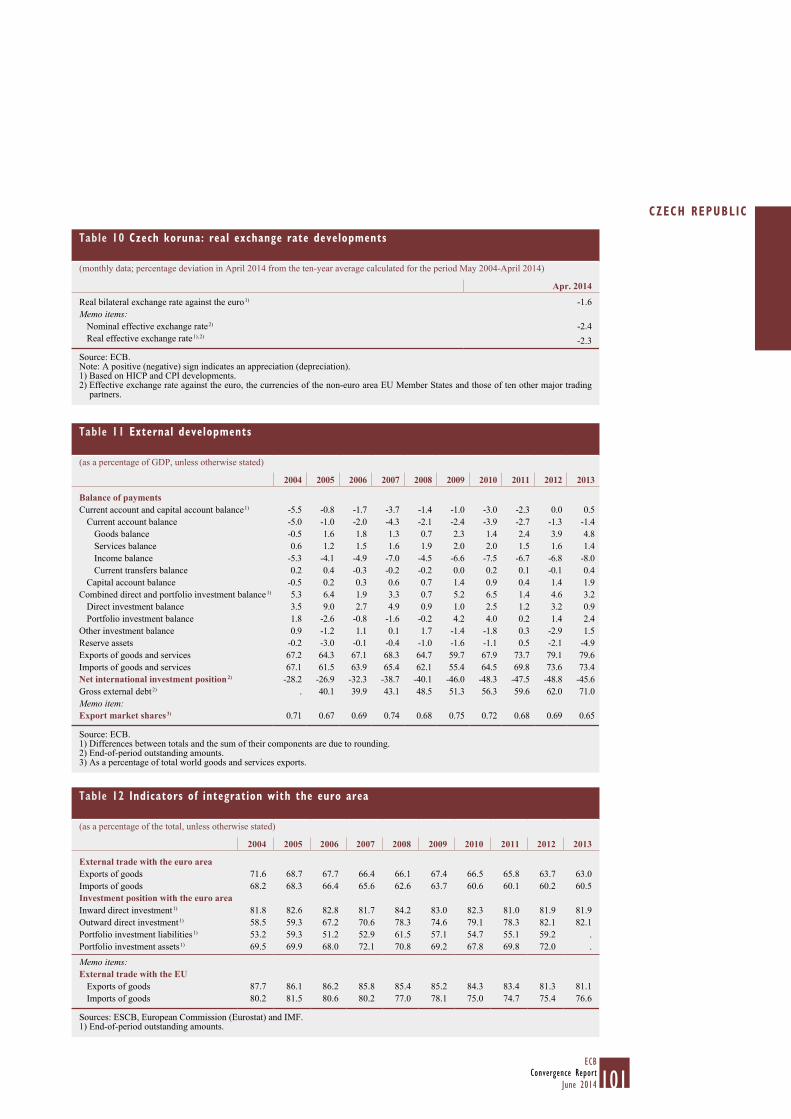
101ECB
Convergence ReportJune 2014
CZECH REPUBLIC
Table 10 Czech koruna: real exchange rate developments
(monthly data; percentage deviation in April 2014 from the ten-year average calculated for the period May 2004-April 2014)
Apr. 2014
Real bilateral exchange rate against the euro 1) -1.6 Memo items:
Nominal effective exchange rate 2) -2.4 Real effective exchange rate 1), 2) -2.3
Source: ECB.Note: A positive (negative) sign indicates an appreciation (depreciation).1) Based on HICP and CPI developments.2) Effective exchange rate against the euro, the currencies of the non-euro area EU Member States and those of ten other major trading
partners.
Table 11 External developments
(as a percentage of GDP, unless otherwise stated)
2004 2005 2006 2007 2008 2009 2010 2011 2012 2013
Balance of paymentsCurrent account and capital account balance 1) -5.5 -0.8 -1.7 -3.7 -1.4 -1.0 -3.0 -2.3 0.0 0.5
Current account balance -5.0 -1.0 -2.0 -4.3 -2.1 -2.4 -3.9 -2.7 -1.3 -1.4 Goods balance -0.5 1.6 1.8 1.3 0.7 2.3 1.4 2.4 3.9 4.8 Services balance 0.6 1.2 1.5 1.6 1.9 2.0 2.0 1.5 1.6 1.4 Income balance -5.3 -4.1 -4.9 -7.0 -4.5 -6.6 -7.5 -6.7 -6.8 -8.0 Current transfers balance 0.2 0.4 -0.3 -0.2 -0.2 0.0 0.2 0.1 -0.1 0.4
Capital account balance -0.5 0.2 0.3 0.6 0.7 1.4 0.9 0.4 1.4 1.9 Combined direct and portfolio investment balance 1) 5.3 6.4 1.9 3.3 0.7 5.2 6.5 1.4 4.6 3.2
Direct investment balance 3.5 9.0 2.7 4.9 0.9 1.0 2.5 1.2 3.2 0.9 Portfolio investment balance 1.8 -2.6 -0.8 -1.6 -0.2 4.2 4.0 0.2 1.4 2.4
Other investment balance 0.9 -1.2 1.1 0.1 1.7 -1.4 -1.8 0.3 -2.9 1.5 Reserve assets -0.2 -3.0 -0.1 -0.4 -1.0 -1.6 -1.1 0.5 -2.1 -4.9 Exports of goods and services 67.2 64.3 67.1 68.3 64.7 59.7 67.9 73.7 79.1 79.6 Imports of goods and services 67.1 61.5 63.9 65.4 62.1 55.4 64.5 69.8 73.6 73.4 Net international investment position 2) -28.2 -26.9 -32.3 -38.7 -40.1 -46.0 -48.3 -47.5 -48.8 -45.6 Gross external debt 2) . 40.1 39.9 43.1 48.5 51.3 56.3 59.6 62.0 71.0 Memo item:Export market shares 3) 0.71 0.67 0.69 0.74 0.68 0.75 0.72 0.68 0.69 0.65
Source: ECB.1) Differences between totals and the sum of their components are due to rounding.2) End-of-period outstanding amounts.3) As a percentage of total world goods and services exports.
Table 12 Indicators of integration with the euro area
(as a percentage of the total, unless otherwise stated)
2004 2005 2006 2007 2008 2009 2010 2011 2012 2013
External trade with the euro areaExports of goods 71.6 68.7 67.7 66.4 66.1 67.4 66.5 65.8 63.7 63.0 Imports of goods 68.2 68.3 66.4 65.6 62.6 63.7 60.6 60.1 60.2 60.5 Investment position with the euro areaInward direct investment 1) 81.8 82.6 82.8 81.7 84.2 83.0 82.3 81.0 81.9 81.9 Outward direct investment 1) 58.5 59.3 67.2 70.6 78.3 74.6 79.1 78.3 82.1 82.1 Portfolio investment liabilities 1) 53.2 59.3 51.2 52.9 61.5 57.1 54.7 55.1 59.2 . Portfolio investment assets 1) 69.5 69.9 68.0 72.1 70.8 69.2 67.8 69.8 72.0 .
Memo items: External trade with the EU
Exports of goods 87.7 86.1 86.2 85.8 85.4 85.2 84.3 83.4 81.3 81.1 Imports of goods 80.2 81.5 80.6 80.2 77.0 78.1 75.0 74.7 75.4 76.6
Sources: ESCB, European Commission (Eurostat) and IMF.1) End-of-period outstanding amounts.
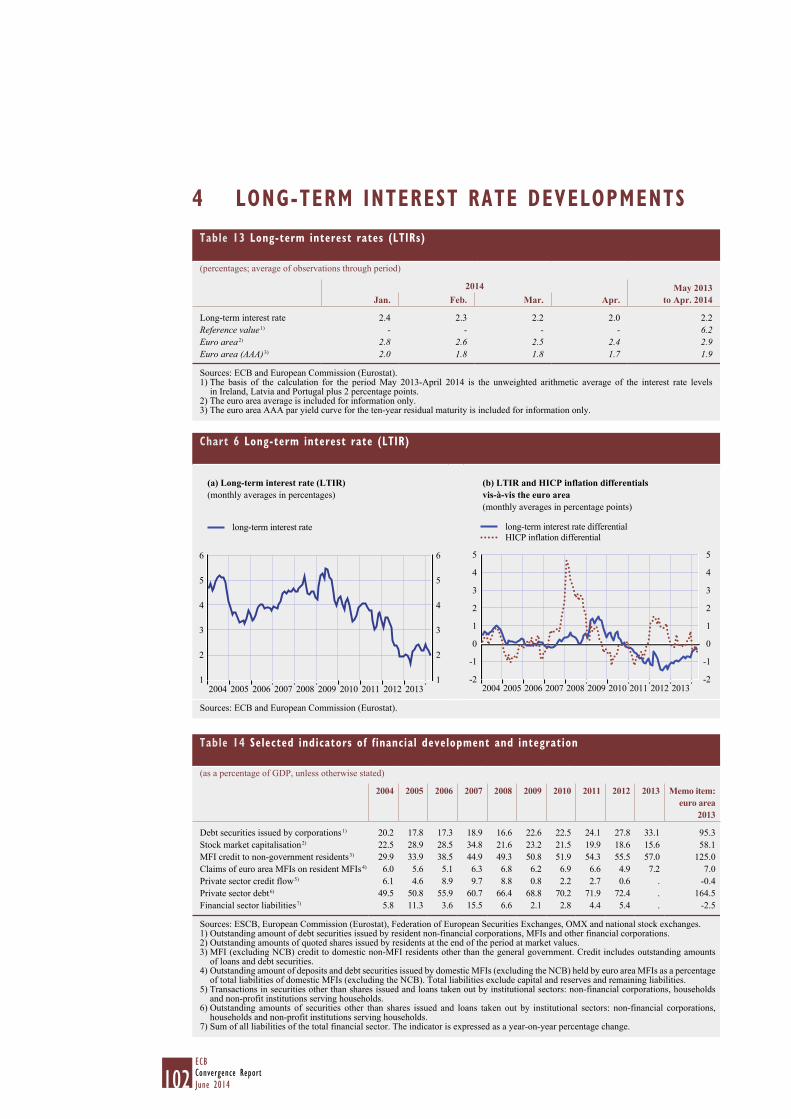
102ECBConvergence ReportJune 2014
4 LONG-TERM INTEREST RATE DEVELOPMENTSTable 13 Long-term interest rates (LTIRs)
(percentages; average of observations through period)
2014 May 2013 to Apr. 2014Jan. Feb. Mar. Apr.
Long-term interest rate 2.4 2.3 2.2 2.0 2.2 Reference value 1) - - - - 6.2 Euro area 2) 2.8 2.6 2.5 2.4 2.9 Euro area (AAA) 3) 2.0 1.8 1.8 1.7 1.9
Sources: ECB and European Commission (Eurostat).1) The basis of the calculation for the period May 2013-April 2014 is the unweighted arithmetic average of the interest rate levels
in Ireland, Latvia and Portugal plus 2 percentage points.2) The euro area average is included for information only.3) The euro area AAA par yield curve for the ten-year residual maturity is included for information only.
Table 14 Selected indicators of financial development and integration
(as a percentage of GDP, unless otherwise stated)
2004 2005 2006 2007 2008 2009 2010 2011 2012 2013 Memo item: euro area
2013
Debt securities issued by corporations 1) 20.2 17.8 17.3 18.9 16.6 22.6 22.5 24.1 27.8 33.1 95.3 Stock market capitalisation 2) 22.5 28.9 28.5 34.8 21.6 23.2 21.5 19.9 18.6 15.6 58.1 MFI credit to non-government residents 3) 29.9 33.9 38.5 44.9 49.3 50.8 51.9 54.3 55.5 57.0 125.0 Claims of euro area MFIs on resident MFIs 4) 6.0 5.6 5.1 6.3 6.8 6.2 6.9 6.6 4.9 7.2 7.0 Private sector credit flow 5) 6.1 4.6 8.9 9.7 8.8 0.8 2.2 2.7 0.6 . -0.4 Private sector debt 6) 49.5 50.8 55.9 60.7 66.4 68.8 70.2 71.9 72.4 . 164.5 Financial sector liabilities 7) 5.8 11.3 3.6 15.5 6.6 2.1 2.8 4.4 5.4 . -2.5
Sources: ESCB, European Commission (Eurostat), Federation of European Securities Exchanges, OMX and national stock exchanges.1) Outstanding amount of debt securities issued by resident non-financial corporations, MFIs and other financial corporations.2) Outstanding amounts of quoted shares issued by residents at the end of the period at market values.3) MFI (excluding NCB) credit to domestic non-MFI residents other than the general government. Credit includes outstanding amounts
of loans and debt securities.4) Outstanding amount of deposits and debt securities issued by domestic MFIs (excluding the NCB) held by euro area MFIs as a percentage
of total liabilities of domestic MFIs (excluding the NCB). Total liabilities exclude capital and reserves and remaining liabilities.5) Transactions in securities other than shares issued and loans taken out by institutional sectors: non-financial corporations, households
and non-profit institutions serving households.6) Outstanding amounts of securities other than shares issued and loans taken out by institutional sectors: non-financial corporations,
households and non-profit institutions serving households.7) Sum of all liabilities of the total financial sector. The indicator is expressed as a year-on-year percentage change.
Chart 6 Long-term interest rate (LTIR)
(a) Long-term interest rate (LTIR)(monthly averages in percentages)
(b) LTIR and HICP inflation differentials vis-à-vis the euro area(monthly averages in percentage points)
1
2
3
4
5
6
1
2
3
4
5
6
2012
long-term interest rate
2004 2005 2007 2009 2011 20132006 2008 2010-2
-1
0
1
2
3
4
5
-2
-1
0
1
2
3
4
5
2012
long-term interest rate differentialHICP inflation differential
2004 2006 2008 2010 20132005 2007 2009 2011
Sources: ECB and European Commission (Eurostat).
103ECB
Convergence ReportJune 2014
CROATIA
5.3 CROATIA4
5.3.1 PRICE DEVELOPMENTS
Over the reference period from May 2013 to April 2014, the 12-month average rate of HICP inflation in Croatia was 1.1%, i.e. well below the reference value of 1.7% for the criterion on price stability (see Table 1). On the basis of the most recent information, the 12-month average rate of HICP inflation is expected to decrease in the coming months.
Looking back over a longer period, consumer price inflation in Croatia fluctuated between annual averages of 1.1% and 5.8% over the past ten years. Having hovered around 2-3% during the period 2004-07, inflation exceeded 5% in 2008, before returning to more moderate levels (see Chart 1). The pick-up in inflation was partly attributable to a surge in food, energy and administered prices. In addition, during the period 2004-08 there was a build-up of domestic demand pressures driven by strong credit growth, which was supported, inter alia, by ample capital inflows. At the same time, robust wage growth was eroding competitiveness. These macroeconomic developments proved to be unsustainable, and the global financial crisis pushed Croatia’s economy into a lasting recession in 2009. Consequently, the annual rate of HICP inflation decelerated, bottoming out at 1.1% in 2010. Thereafter it gradually picked up again, to stand at 3.4% in 2012, owing to increases in food, energy and administered prices, as well as to hikes in the value added tax (VAT) rate and excise duties, before slowing to 2.3% in 2013 as the effects of these increases faded.
These inflation developments took place against the background of a number of important policy choices, most notably the orientation of monetary policy towards the achievement of price stability, which is the primary objective of monetary policy as enshrined in the central bank law. Hrvatska narodna banka aims to achieve price stability through a tightly managed floating exchange rate regime vis-à-vis the euro. During the period 2004-06 fiscal consolidation measures were implemented with the support of a precautionary standby arrangement with the IMF. Thereafter, however, there was a loosening of fiscal policy, except in 2012 and to a lesser extent in 2013, when a number of consolidation measures were initiated. At the same time, during the period 2004-08, Croatia’s monetary policy was constrained by the tightly managed floating exchange rate regime, and the overall policy stance (including fiscal policy) was not tight enough to counter the build-up of macroeconomic imbalances. Owing to the increasing financial vulnerabilities and macroeconomic imbalances prior to the economic downturn, Hrvatska narodna banka introduced a series of administrative and prudential measures to curb credit growth funded by banks’ borrowing abroad. However, several of these measures were later abolished or loosened as part of counter-cyclical policies. In addition, the government introduced a number of growth-enhancing credit schemes, but credit growth to the private sector remained fairly weak.
Inflation dynamics over the past ten years should be viewed against a background of solid economic growth during 2004-08 and a recession during 2009-13 (see Table 2). In 2006 and 2007 real GDP expanded at an annual rate of around 5%, largely on account of strong domestic demand, which resulted in a considerable worsening of domestic and external imbalances. Rapid credit growth partly fuelled by cross-border lending by foreign parent banks led to a significant accumulation of private sector debt and a boom in domestic demand fuelled by a surge in trade deficits. In the second half of 2008 macroeconomic conditions started to weaken, reflecting a collapse in domestic demand, the unwinding of the credit and housing bubble and the significant deterioration in the
4 Croatia joined the European Union on 1 July 2013.
104ECBConvergence ReportJune 2014
external environment, while over the following five years there was a cumulative decline of 12% in GDP. Labour market conditions broadly reflected these developments. Between 2004 and 2008 unemployment gradually declined to a historical low, while wage growth kept exceeding labour productivity growth, which led to a noticeable pick-up in unit labour cost growth. After the onset of the crisis, however, the unemployment rate rose sharply again, from 8.4% in 2008 to 17.2% in 2013, mainly owing to lay-offs in the private sector. Growth in compensation per employee moderated temporarily in 2009, to stand at 1.0%, and then started to pick up again in 2010, to reach 3.2% in 2012, and subsequently slowed down to 1.9% in 2013, reflecting, inter alia, a moderate wage cut in the public sector. Consequently, in combination with muted labour productivity gains – notwithstanding labour shedding – unit labour costs grew by 1.9% in 2013. These developments reflect, inter alia, rigidities in the labour market and wage-setting mechanisms. After stabilising in 2012, house prices fell sharply in 2013. The cumulative decline from their peak in 2008 amounts to 32%. Import prices were rather volatile during the period under review, mainly reflecting developments in commodity prices and some volatility in the effective exchange rate. The general pattern of inflation developments in Croatia was reflected in other relevant indices, such as the HICP excluding unprocessed food and energy.
Looking at recent developments, the annual rate of HICP inflation moved temporarily into slightly negative territory in early 2014, to stand at -0.1% in April (see Table 3a). This marked decline is attributable to lower food and energy prices (which together represent 47% of Croatia’s HICP basket of goods and services), a reduction in electricity prices in October 2013 and the absence of demand-side pressures. Accordingly, HICP inflation excluding unprocessed food and energy also declined sharply. Hrvatska narodna banka estimates that changes in administered prices – which represent 26% of the HICP basket of goods and services – added around 0.6 percentage point to inflation in 2013. The current inflation picture needs to be viewed against the background of large macroeconomic imbalances and vulnerabilities. The contraction in real GDP deepened in the fourth quarter of 2013, resulting in an average decline of -1.0% in GDP for the year as a whole. The unemployment rate, a large part of which is structural, amounted to 17.3% at the end of 2013. This high figure is associated, inter alia, with the sizeable informal economy.
The latest available forecasts from major international institutions project inflation to increase gradually in 2014-15, and to range from 0.5% to 1.1% and from 1.1% to 2.2% respectively, from currently negative levels (see Table 3b). Inflationary pressures are expected to be contained given the environment of weak economic growth. Risks to the inflation outlook for Croatia are broadly balanced. In particular, on the upside the risks relate to developments in commodity and administered prices, while on the downside they relate to the strength of the economic recovery. Developments in global commodity prices for food and energy tend to have a relatively large impact on consumer prices in Croatia.
Looking further ahead, maintaining low inflation rates on a sustainable basis in Croatia may be challenging in the medium term, given monetary policy’s limited room for manoeuvre under the tightly managed floating exchange rate regime and the high level of euroisation. The catching-up process is likely to have a bearing on inflation and/or the nominal exchange rate over the coming years, given that GDP per capita and price levels are still lower in Croatia than in the euro area (see Table 2). However, it is difficult to assess the exact magnitude of the effect resulting from this catching-up process. Once the economy gains momentum and the income convergence progresses, price level convergence is likely to continue. This, in turn, would manifest itself in terms of higher domestic inflation, given the tightly managed floating exchange rate regime. Overall, in the context of the process of economic convergence, it cannot be ruled out that significant demand pressures
105ECB
Convergence ReportJune 2014
CROATIA
may emerge again, although the ongoing deleveraging process reduces this risk for the near future. Given the tightly managed floating exchange rate regime and the limitations of alternative counter-cyclical policy instruments, it may be difficult to prevent another build-up of macroeconomic imbalances.
Overall, although the 12-month average rate of HICP inflation in Croatia is currently well below the reference value, there are concerns regarding the sustainability of inflation convergence.
Achieving an environment conducive to sustainable convergence in Croatia requires, among other things, a stability-oriented monetary policy and all-encompassing structural reforms. With regard to macroeconomic imbalances, the European Commission selected Croatia for an in-depth review in its Alert Mechanism Report 2014 in order to investigate the nature of and potential risks related to Croatia’s external position, trade performance and competitiveness, and internal developments. It concluded that “Croatia is experiencing excessive macroeconomic imbalances, which require specific monitoring and strong policy action.”
Given monetary policy’s limited room for manoeuvre owing to the tightly managed floating exchange rate regime and the high level of euroisation, it is imperative that other policy areas provide the economy with the wherewithal to cope with country-specific shocks in order to ensure the correction of macroeconomic imbalances and to prevent their recurrence in the future. More specifically, progress in the areas below will help to achieve an environment that is conducive to sustainable price stability and promote competitiveness and employment growth.
Wide-ranging structural reforms to help economic reorientation from the non-tradable sector to the tradable sector are needed. A rigorous labour market reform is needed to improve the competitiveness of the economy. It is essential to increase labour flexibility, but at the same time it is important to avoid the creation of a dual labour market. Measures should be taken to enhance the quantity and quality of the labour supply and reduce sectoral, skill and educational mismatches. This is particularly important in terms of tackling the high levels of structural and youth unemployment, as well as the very low labour participation rate. Social benefits should be reviewed in order to boost incentives to work and, in turn, increase the participation rate, as should labour costs in view of the high levels they have reached.
Achieving sufficient flexibility in nominal and real wages is necessary to ensure that the competitiveness of Croatia’s economy is restored over the medium term, in particular given the tightly managed floating exchange rate regime. Wage increases should reflect labour productivity growth, labour market conditions and developments in competitor countries. With regard to product markets, efforts should be made to complete the liberalisation of regulated sectors (network industries and closed professions). The quality of the business and institutional environment should be improved, inter alia, to help attract foreign direct investment, which could strengthen the competitive position of the tradable sector. Modernising the country’s infrastructure would boost potential output and support a more efficient allocation of resources. Ensuring an efficient absorption capacity of EU funds could also help attain that goal.
Financial sector policies should be geared towards the continued safeguarding of financial stability and ensure that the financial sector makes a sound contribution to economic growth. In view of the high level of private sector debt, it is important to ensure that the necessary conditions are in place for an orderly deleveraging process. In order to minimise the potential risks to financial stability associated with a high share of loans denominated in or indexed to a foreign currency, it
106ECBConvergence ReportJune 2014
is necessary for Croatia to fully implement the recommendation of the ESRB on lending in foreign currencies.5 Close cooperation between home and host country supervisory authorities is important to ensure the effective implementation of these measures. Finally, financial stability could benefit from Croatia’s participation in the SSM, which will take up its prudential supervisory tasks in November 2014.
5.3.2 FISCAL DEVELOPMENTS
Croatia is currently subject to an EU Council decision on the existence of an excessive deficit, with a deadline of 2016 for correcting it. In the reference year 2013, which was the first year of Croatia’s EU membership (its accession was on 1 July), the general government budget balance showed a deficit of 4.9% of GDP, i.e. well above the 3% reference value. The general government gross debt-to-GDP ratio was 67.1%, i.e. above the 60% reference value (see Table 4). Compared with the previous year, the budget balance ratio improved by 0.1 percentage point, while the public debt ratio increased strongly by 11.2 percentage points. This was brought about by unfavourable macroeconomic conditions and an only slightly restrictive fiscal stance. In 2014 the deficit ratio is forecast by the European Commission to decline to 3.8%, whereas the government debt ratio is projected to increase slightly to 69.0%. With regard to other fiscal factors, the deficit ratio exceeded the ratio of public investment to GDP in 2013 and is expected to continue to do so in 2014.
Looking at developments in Croatia’s budgetary position over recent years, starting from a value of 1.9% in 2008, the deficit-to-GDP ratio rose sharply, reaching 6.4% in 2010 and 7.8% in 2011. This trend has been reversed only slightly since 2012 (see Table 5 and Chart 2a). As the deficit-to-GDP ratio rose above the 3% of GDP reference value in 2013, the first year of Croatia’s EU membership, the ECOFIN Council decided on 21 January 2014 that an excessive deficit situation existed in Croatia and set 2016 as the deadline for correcting it.
As shown in greater detail in Chart 2b, European Commission estimates indicate that particularly in 2009, when the financial and economic crisis affected public finances severely, cyclical factors had a strongly negative impact on the budget balance. Non-cyclical factors contributed overall to an increase in the budget deficit over the period 2009-11, suggesting that fiscal policy was expansionary. The largest adverse contribution from non-cyclical factors occurred in 2011 owing to the fact that government expenditure was slow to adjust to the rapidly weakening macroeconomic environment and owing to the assumption of shipyards’ debt. This trend was reversed in 2012, when the Croatian government initiated consolidation measures which contributed to an improvement of the structural balance. These measures affected the revenue (the standard VAT rate increased by 2 percentage points and tax collection improved) and expenditure (restraint on subsidies, goods and services expenditure and compensation of employees) sides. Some additional consolidation measures were implemented in 2013 (such as public sector wage cuts and increases in indirect taxes). However, their impact was partly offset by other factors, mainly on the expenditure side, such as contributions to the EU budget and increased interest payments. The contribution from non-cyclical factors to the change in the general government balance was therefore only slightly positive.
Turning to developments in general government gross debt, between 2004 and 2013 the debt-to-GDP ratio increased cumulatively by 28.9 percentage points; over the 2008-11 period, it rose by 22.0 percentage points (see Chart 3a and Table 6). As shown in greater detail in Chart 3b, among
5 See Recommendation (ESRB/2011/1) of the European Systemic Risk Board of 21 September 2011 on lending in foreign currencies.

107ECB
Convergence ReportJune 2014
CROATIA
the factors underlying the annual change in the debt ratio, the primary budget balance has had a debt-increasing impact in every year since 2009, reaching a peak in 2011. The growth-interest rate differential has continuously contributed to the increase in the debt ratio since 2009. The deficit-debt adjustment made a small contribution to the increase in the debt ratio in 2010 and had a small dampening effect in 2012. In 2013 the general government debt-to-GDP ratio increased strongly by 11.2 percentage points, mainly owing to deficit-debt adjustments, while the adverse growth-interest rate differential and the primary deficit also contributed notably to the deterioration.
As regards Croatia’s general government debt structure, the share of government debt with a short-term maturity has been relatively stable. It fluctuated between 11.9% and 13.6% between 2004 and 2007, before increasing to 17.3% in 2009. The share of short-term debt then began to decline, albeit remaining at a noticeable level (12.0% in 2013) (see Table 6). Taking into account the level of the debt ratio, fiscal balances are relatively insensitive to changes in interest rates. The Croatian government has contingent liabilities – not reflected in gross government debt – resulting from public guarantees for the debt of state-owned enterprises. At the same time, there are no contingent liabilities caused by government interventions in the financial sector (see Section 5.9). The proportion of government debt denominated in foreign currency was high in 2013 (74.5%). Given the overall debt level, with 69.9% of government debt denominated in euro, fiscal balances are relatively insensitive to changes in exchange rates other than the EUR/HRK exchange rate.
Moving on to examine trends in other fiscal indicators, Chart 4 and Table 5 show that the general government total expenditure-to-GDP ratio increased overall from 43.4% in 2008 to 45.9% in 2013, having peaked at 48.1% of GDP in 2011. It declined in 2012, mainly as a result of the reduction in capital expenditure, which in 2012 and 2013 fell to levels well below those of the years before. The slight increase in the expenditure-to-GDP ratio to 45.9% in 2013 was mainly due to an increase in other current expenditure. The share of compensation of employees in GDP decreased slightly in 2012 and 2013, but remained close to the 2009-11 levels. Social benefits other than in kind increased as a ratio to GDP until 2011 and declined in 2012 and 2013. Total government revenue as a share of GDP decreased from 41.5% of GDP in 2008 to 40.3% of GDP in 2011, before starting to increase again, reaching 41.0% of GDP in 2013.
Looking ahead, Croatia’s medium-term fiscal policy strategy, as presented in the convergence programme 2014-2017 (published in April 2014), indicates the commitment of the government to bring the deficit to below the reference value in 2016; it envisages a deficit ratio of 4.4% in 2014, with a further decline to 3.5% in 2015 and 2.7% in 2016. This decline would partly be supported by cyclical factors; while the structural deficit is projected to worsen to 4.1% in 2014, it is expected to improve to 3.3% in 2015 and 2.1% in 2016. Whereas no medium-term objective was specified in the convergence programme, the structural deficit is projected to remain significantly above the minimum medium-term objective of 1.0% of GDP (specified in line with the Stability and Growth Pact) in the entire period from 2014 to 2016.
With regard to the fiscal prospects for Croatia, which with 67.1% of GDP in 2013 has a public debt ratio above 60% of GDP, Chart 5 presents calculations of potential future debt ratios using alternative assumptions for the fiscal balance. Assuming that Croatia achieves the overall fiscal position and public debt ratio projected by the European Commission for 2014, a balanced budget from 2015 onwards would reduce public debt to below 60% of GDP by 2022. However, a constant primary balance ratio at its projected 2014 level of -0.4% of GDP would not reduce public debt to below 60% of GDP. At the same time, maintaining the overall deficit ratio at its projected 2014 level of 3.8% of GDP would also result in a further increase in the debt ratio (reaching 92.3% in 2024).
108ECBConvergence ReportJune 2014
These calculations are based on the assumption of a constant nominal rate of interest of 5.4% beyond 2014.6 The nominal GDP growth rate for 2014 and 2015 is as projected by the European Commission in its spring 2014 forecast, remaining constant at the 2015 level thereafter. Deficit-debt adjustments are not taken into account in the projections. While these calculations are purely illustrative and can by no means be regarded as forecasts, the indication that maintaining the overall deficit ratio at the 2014 level would lead to a very strong increase in the debt ratio highlights the urgent need for effective implementation of further consolidation measures.
Croatia has so far not signed the Treaty on Stability, Coordination and Governance in the Economic and Monetary Union (TSCG).
As regards fiscal governance, Croatia has a multi-annual budgetary framework in the form of a three-year timescale for general government budget planning (set out in the Budget Act of 2009). The fiscal framework was reformed in 2010 when the Fiscal Responsibility Law – which introduced fiscal rules – was brought in, and in 2011 when the Fiscal Policy Committee – a fiscal council – was established. These rules were modified in December 2013 by amendments to the Fiscal Responsibility Act. Specifically, the independence of the Fiscal Policy Committee was increased. The 2013 reform responded to the requirements of EU Directive 2011/85 on requirements for the budgetary frameworks of Member States.
Moving to factors that will have an impact on Croatia’s public finances over the long term, a relatively steep ageing of the population is expected, as highlighted in Table 8. Projections of the development of age-related government expenditures by the European Commission and the EU’s Economic Policy Committee are not available.
Turning to fiscal challenges, Croatia must ensure progress with fiscal consolidation in 2014 and beyond, in line with the requirements of the corrective arm of the Stability and Growth Pact, to ensure that the excessive deficit is corrected by the 2016 deadline. Immediate and decisive action is required, given that the adjustment path already foresees consolidation measures for 2014 amounting to 2.3% of GDP. In addition, policy action is required to comply with further European Commission recommendations, such as to carry out an expenditure review and improve tax compliance and the efficiency of tax administration, as well as the institutional framework of public finances. Since Croatia has not yet signed the TSCG, it is important that its domestic fiscalframeworkisstrengthenedsufficiently.Overthelongerrun,theriskstomedium-termfiscalsustainability suggest that structural fiscal reforms are warranted that focus on avoiding pro-cyclical fiscal policies, as well as improving the sustainability of the pension system, tax administration and compliance (including further measures to reduce the size of the grey economy), the fiscal responsibility of municipalities and the overall quality of economic governance.
5.3.3 EXCHANGE RATE DEVELOPMENTS
In the period from 1 July 2013, when Croatia acceded to the European Union, to 15 May 2014, the Croatian kuna did not participate in ERM II, but traded under a flexible exchange rate regime involving a tightly managed floating of the currency’s exchange rate (see Table 9a). Over the two-year reference period the exchange rate of the kuna was broadly stable, and the currency traded close to its May 2012 average exchange rate against the euro, which is used as a benchmark for illustrative purposes in the absence of an ERM II central rate. On 15 May 2014 the exchange
6 This assumption reflects past trends in the cost of outstanding public debt.
109ECB
Convergence ReportJune 2014
CROATIA
rate stood at 7.591 kuna per euro, i.e. 0.7% weaker than its average level in May 2012. Over the reference period the maximum upward deviation from this benchmark was 2.0%, while the maximum downward deviation amounted to 1.7% (see Chart 6 and Table 9a).
Over the reference period the exchange rate of the Croatian kuna against the euro showed a low degree of volatility, as measured by annualised standard deviations in daily percentage changes. This reflected the strategy of Hrvatska narodna banka to limit exchange rate fluctuations by means of occasional market interventions. At the same time short-term interest rate differentials against the three-month EURIBOR stood, on average, at a relatively high level (see Table 9b).
In a longer-term context, in April 2014 both the real effective exchange rate and the real bilateral exchange rate of the Croatian kuna against the euro stood close to the corresponding ten-year historical averages (see Table 10). However, these indicators should be interpreted with caution, as during this period Croatia was subject to a process of economic convergence, which complicates any historical assessment of real exchange rate developments.
As regards other external developments, Croatia’s current and capital account has adjusted substantially in recent years. After a progressive increase in the external deficit from 4.2% of GDP in 2004 to 8.7% of GDP in 2008, the combined current and capital account steadily improved and turned into a slight surplus of 0.1% of GDP in 2012 and a surplus of 1.2% of GDP in 2013 (see Table 11). The improvement in the current and capital account balance primarily reflected a sharp decline in the goods deficit, largely driven by the contraction in domestic demand. The external deficit has been mainly financed by net inflows in foreign direct and other investment. The substantial adjustment in Croatia’s balance of payments was associated with a significant contraction of these capital inflows, and the balance on other investment turned into deficit. Gross external debt increased substantially from 71.0% of GDP in 2004 to 102.5% in 2012 and 105.7% in 2013. At the same time the country’s net international investment position, which had deteriorated substantially from -47.7% of GDP in 2004 to -95.9% in 2010, improved to reach -89.5% in 2012 and -88.4% in 2013. However, the country’s net foreign liabilities are still very high. Fiscal and structural policies therefore continue to be important for supporting external sustainability and the competitiveness of the economy.
Croatia is a small open economy, and the ratio of its foreign trade in goods and services to GDP increased from 42.9% in 2004 to 43.1% in 2013 for exports, while it decreased from 48.8% of GDP in 2004 to 41.9% in 2013 for imports. Over the same period Croatia’s share in world exports declined from 0.16% to 0.11%.
Concerning measures of economic integration with the euro area, in 2013 exports of goods to the euro area constituted 50.6% of total goods exports, whereas the corresponding figure for imports amounted to 52.0%. The share of euro area countries in Croatia’s inward direct investment stood at 71.6% in 2013, and their share in its portfolio investment liabilities was 59.9% in 2012. The share of Croatia’s assets invested in the euro area amounted to 19.3% in the case of direct investment in 2013 and 62.9% for portfolio investment in 2012 (see Table 12).
110ECBConvergence ReportJune 2014
5.3.4 LONG-TERM INTEREST RATE DEVELOPMENTS
Long-term interest rates in Croatia were 4.8% on average over the reference period from May 2013 to April 2014 and were thus below the 6.2% reference value for the interest rate convergence criterion (see Table 13).
Between late 2005, when the data on long-term interest rates became available,7 and early 2007, long-term interest rates in Croatia fluctuated between 4% and 5%. From mid-2007, they embarked on an upward trend in an environment of accumulating domestic and external imbalances. With the onset of the financial crisis, long-term interest rates in Croatia escalated to above 8% in early 2009, before recovering and decreasing to around 6% towards the end of that year. Between early 2010 and early 2011, long-term interest rates remained rather stable, in a range of around 6% to 6.5%. In the second half of 2011, they increased to above 7.5%, reflecting broader financial market tensions. From early 2012, long-term interest rates in Croatia declined markedly, to fall below 5% in the second half of the year. Since late 2012, they have increased somewhat, reflecting a worsening credit outlook in view of a worsening budgetary position. During this time, Croatian long-term sovereign debt has been downgraded by all three major rating agencies to below investment grade. At the end of the reference period long-term interest rates in Croatia stood at 4.4%.
The differential between long-term interest rates in Croatia and the euro area average fluctuated between 0 and 1 percentage point in 2006 and 2007. Subsequently, it increased markedly, reflecting domestic and external imbalances. In mid-2009, the long-term interest rate differential with the euro area average exceeded 4 percentage points, but dropped towards 2 percentage points in early 2010. In the period 2010-12, the differential fluctuated in a range of 2 to 3 percentage points, exhibiting upward pressure in the second half of 2011, which reflected broader financial market tensions. In the second half of 2012, the differential declined to below 2 percentage points, increasing again in early 2013, reflecting a worsening budgetary position. The differential stood at 2.0 percentage points (and 2.7 percentage points with respect to the AAA euro area yield) at the end of the reference period.
As regards financial integration and development, Croatian capital markets are smaller and less developed than in the euro area (see Table 14). Croatia’s financial sector is heavily bank-based, with credit to non-government residents amounting to 76.1% of GDP at the end of 2013. The majority of loans to the private sector are denominated in or indexed to foreign currencies. Market-based credit to the corporate sector, as measured by the value of outstanding fixed-income securities issued by corporations, was 7.4% of GDP at the end of 2013. Stock market capitalisation stood at 39.6% of GDP in 2013, relatively high in comparison with other central European stock markets. The international claims of euro area banks in Croatia, defined as the share in total liabilities of loans from euro area banks to banks in the country, amounted to 15.3% in 2013.
7 The assessment of long-term interest rates requires caution as the bonds’ maturities over some periods were much shorter than ten years.

111ECB
Convergence ReportJune 2014
CROATIA
CROATIA
1 PRICE DEVELOPMENTSTable 1 HICP inflation 112Chart 1 Price developments 112Table 2 Measures of inflation and related indicators 112Table 3 Recent inflation trends and forecasts 113
(a) Recent trends in the HICP 113(b) Inflation forecasts 113
2 FISCAL DEVELOPMENTSTable 4 General government fiscal position 114Table 5 General government budgetary position 114Chart 2 General government surplus (+)/deficit (-) 115
(a) Levels 115(b) Annual change and underlying factors 115
Table 6 General government gross debt – structural features 115Chart 3 General government gross debt 116
(a) Levels 116(b) Annual change and underlying factors 116
Chart 4 General government expenditure and revenue 116Chart 5 Potential future debt ratios under alternative assumptions for fiscal balance ratios 116Table 7 General government deficit-debt adjustment 117Table 8 Projections of the ageing-induced fiscal burden 117
3 EXCHANGE RATE DEVELOPMENTSTable 9 (a) Exchange rate stability 118
(b) Key indicators of exchange rate pressure for the Croatian kuna 118Chart 6 Croatian kuna: nominal exchange rate development against the euro 118
(a) Exchange rate over the reference period 118(b) Exchange rate over the last ten years 118
Table 10 Croatian kuna: real exchange rate developments 119Table 11 External developments 119Table 12 Indicators of integration with the euro area 119
4 LONG-TERM INTEREST RATE DEVELOPMENTSTable 13 Long-term interest rates (LTIRs) 120Chart 7 Long-term interest rate (LTIR) 120
(a) Long-term interest rate (LTIR) 120(b) LTIR and HICP inflation differentials vis-à-vis the euro area 120
Table 14 Selected indicators of financial development and integration 120
LIST OF TABLES AND CHARTS

112ECBConvergence ReportJune 2014
1 PRICE DEVELOPMENTSChart 1 Price developments
(average annual percentage changes)
-4
-2
0
2
4
6
8
-4
-2
0
2
4
6
8
HICPunit labour costsimport deflator
2012 20132004 2005 2006 2007 2008 2009 2010 2011
Source: European Commission (Eurostat).
Table 1 HICP inflation
(annual percentage changes)
2014 May 2013 to Apr. 2014 Jan. Feb. Mar. Apr.
HICP inflation 0.4 -0.2 -0.1 -0.1 1.0 Reference value 1) 1.7 Euro area 2) 0.8 0.7 0.5 0.7 1.0
Source: European Commission (Eurostat).1) The basis of the calculation for the period May 2013-April 2014
is the unweighted arithmetic average of the annual percentage changes in the HICP for Latvia, Portugal and Ireland plus 1.5 percentage points.
2) The euro area is included for information only.
Table 2 Measures of inflation and related indicators
(annual percentage changes, unless otherwise stated)
2004 2005 2006 2007 2008 2009 2010 2011 2012 2013
Measures of inflationHICP 2.1 3.0 3.3 2.7 5.8 2.2 1.1 2.2 3.4 2.3 HICP excluding unprocessed food and energy - - 3.1 3.2 5.2 3.0 0.3 1.5 1.5 2.1 HICP at constant tax rates 1) 2.1 3.0 3.3 2.7 5.8 1.9 0.6 2.2 2.0 2.1 CPI 2.1 3.3 3.2 2.9 6.1 2.4 1.0 2.3 3.4 2.2 Private consumption deflator 2.1 3.3 3.3 3.0 5.6 3.2 1.5 2.4 3.5 1.9 GDP deflator 3.8 3.3 4.0 4.1 5.7 2.9 0.8 1.8 1.9 0.9 Producer prices 2) 3.6 2.7 2.7 3.5 8.3 -0.5 4.3 6.3 7.0 0.4 Related indicatorsReal GDP growth 4.1 4.3 4.9 5.1 2.1 -6.9 -2.3 -0.2 -1.9 -1.0 GDP per capita in PPS 3) (euro area = 100) 53.2 54.1 54.8 57.6 59.9 58.6 55.4 55.7 56.7 . Comparative price levels (euro area = 100) 64.6 67.4 71.3 71.0 71.8 72.1 72.9 70.7 68.5 . Output gap 4) 0.8 1.6 3.6 6.4 6.6 -0.9 -2.4 -1.7 -2.2 -2.9 Unemployment rate (%) 5) 13.8 12.8 11.4 9.6 8.4 9.1 11.8 13.5 15.9 17.2 Unit labour costs, whole economy 1.6 1.9 2.2 4.4 5.5 6.6 -1.1 -0.3 1.1 1.9 Compensation per employee, whole economy 4.2 5.5 3.3 8.2 4.4 1.0 1.9 1.9 3.2 1.9 Labour productivity, whole economy 2.6 3.5 1.0 3.6 -1.0 -5.2 3.0 2.2 2.1 0.0 Imports of goods and services deflator 0.7 2.3 2.8 3.0 4.3 -1.9 1.5 6.0 3.1 0.2 Nominal effective exchange rate 6) 2.0 0.6 1.0 0.8 2.2 -1.2 -1.8 -2.1 -3.1 0.6 Money supply (M3) 7) - 11.5 18.2 18.2 4.2 0.4 2.7 1.0 3.6 2.0 Lending from banks 8) - 18.8 24.0 15.0 14.6 0.0 6.2 4.4 -3.9 -0.1 Stock prices (Croatian CROBEX Index) 32.1 27.6 60.7 63.2 -67.1 16.4 5.3 -17.6 0.0 3.1 Residential property prices 11.1 11.2 17.7 12.0 3.5 -3.8 -8.0 -3.6 1.0 -16.5
Sources: European Commission (Eurostat), national data (HICP at constant tax rates, CPI, money supply, lending from banks and residential property prices) and European Commission (output gap).1) The difference between the “HICP” and the “HICP at constant tax rates” shows the theoretical impact of changes in indirect taxes
(e.g. VAT and excise duties) on the overall rate of inflation. This impact assumes a full and instantaneous pass-through of tax rate changes on the price paid by the consumer. NCB estimate based on Eurostat data, referring only to constant VAT rates.
2) Domestic sales, total industry excluding construction.3) PPS stands for purchasing power standards.4) Percentage difference of potential GDP: a positive (negative) sign indicates that actual GDP is above (below) potential GDP.5) The definition conforms to ILO guidelines.6) A positive (negative) sign indicates an appreciation (depreciation).7) The series includes repurchase agreements with central counterparties.8) Not adjusted for the derecognition of loans from the MFI statistical balance sheet due to their sale or securitisation.

113ECB
Convergence ReportJune 2014
CROATIA
Table 3 Recent inflation trends and forecasts
(annual percentage changes)
(a) Recent trends in the HICP2013 2014
Nov. Dec. Jan. Feb. Mar. Apr.
HICPAnnual percentage change 0.7 0.5 0.4 -0.2 -0.1 -0.1 Change in the average of the latest three months from the previous three months, annualised rate, seasonally adjusted 0.1 -1.7 -1.9 -1.3 -1.0 -1.1 Change in the average of the latest six months from the previous six months, annualised rate, seasonally adjusted 1.1 1.1 0.8 0.2 -0.4 -0.6
Sources: European Commission (Eurostat) and ECB calculations.
(b) Inflation forecasts2014 2015
HICP, European Commission (Spring 2014) 0.8 1.2 CPI, OECD (May 2014)1) - -CPI, IMF (April 2014) 0.5 1.1 CPI, Consensus Economics (April 2014) 1.1 2.2
Sources: European Commission, OECD, IMF and Consensus Economics.1) Croatia is not a member of the OECD.

114ECBConvergence ReportJune 2014
2 FISCAL DEVELOPMENTSTable 4 General government fiscal position
(as a percentage of GDP)
2012 2013 2014 1)
General government surplus (+)/deficit (-) -5.0 -4.9 -3.8 Reference value -3.0 -3.0 -3.0 Surplus/deficit, net of government investment expenditure 2) -3.0 -2.7 -1.3
General government gross debt 55.9 67.1 69.0 Reference value 60.0 60.0 60.0
Sources: European Commission (Eurostat, DG ECFIN) and ECB calculations.1) European Commission projections.2) A positive (negative) sign indicates that the government deficit is lower (higher) than government investment expenditure.
Table 5 General government budgetary position
(as a percentage of GDP)
2004 2005 2006 2007 2008 2009 2010 2011 2012 2013
Total revenue 41.4 41.2 41.4 42.1 41.5 40.8 40.5 40.3 40.8 41.0 Current revenue 41.4 41.2 41.4 42.0 41.5 40.7 40.4 40.0 39.9 40.8
Direct taxes 6.0 6.2 6.9 7.4 7.2 7.2 6.5 6.2 6.1 6.3 Indirect taxes 18.8 18.6 18.6 18.3 18.0 17.1 18.0 17.5 18.2 18.6 Social security contributions 11.9 11.7 11.6 11.7 11.9 12.2 12.0 11.7 11.5 11.3 Other current revenue 4.7 4.6 4.3 4.6 4.4 4.2 4.0 4.5 4.0 4.6
Capital revenue 0.0 0.0 0.0 0.1 0.1 0.1 0.1 0.3 0.8 0.2 Total expenditure 45.2 44.0 44.2 44.0 43.4 46.2 46.9 48.1 45.7 45.9
Current expenditure 39.4 38.3 38.4 38.4 38.0 41.1 41.3 42.1 42.0 42.0 Compensation of employees 11.3 11.2 10.7 11.1 11.2 12.1 12.1 12.3 12.1 11.9 Social benefits other than in kind 13.8 12.7 13.4 12.7 12.3 13.8 14.0 14.3 14.1 13.6 Interest payable 1.7 1.7 1.6 1.6 1.5 2.0 2.2 2.6 3.0 3.1
of which: impact of swaps and FRAs 1) 0.0 0.0 0.0 0.0 0.0 0.0 0.0 0.0 0.0 0.0 Other current expenditure 12.6 12.7 12.7 13.0 13.0 13.2 13.0 12.8 12.8 13.5
Capital expenditure 5.8 5.7 5.8 5.6 5.4 5.1 5.6 6.0 3.7 3.9
Surplus (+)/deficit (-) -3.8 -2.8 -2.8 -1.9 -1.9 -5.4 -6.4 -7.8 -5.0 -4.9
Primary balance -2.1 -1.1 -1.2 -0.4 -0.4 -3.5 -4.1 -5.2 -2.0 -1.9 Surplus/deficit, net of government investment expenditure 0.0 0.8 1.1 2.1 1.8 -1.7 -3.9 -5.6 -3.0 -2.7
Sources: ESCB and European Commission (Eurostat).Notes: Differences between totals and the sum of their components are due to rounding. Interest payable as reported under the excessive deficit procedure. The item “impact of swaps and FRAs” is equal to the difference between the interest (or deficit/surplus) as defined in the excessive deficit procedure and in the ESA 95. See Regulation (EC) No 2558/2001 of the European Parliament and of the Council of 3 December 2001 amending Council Regulation (EC) No 2223/96 as regards the reclassification of settlements under swap arrangements and under forward rate agreements (0J L 344, 28.12.2001, p. 1).1) FRAs stands for forward rate agreements.
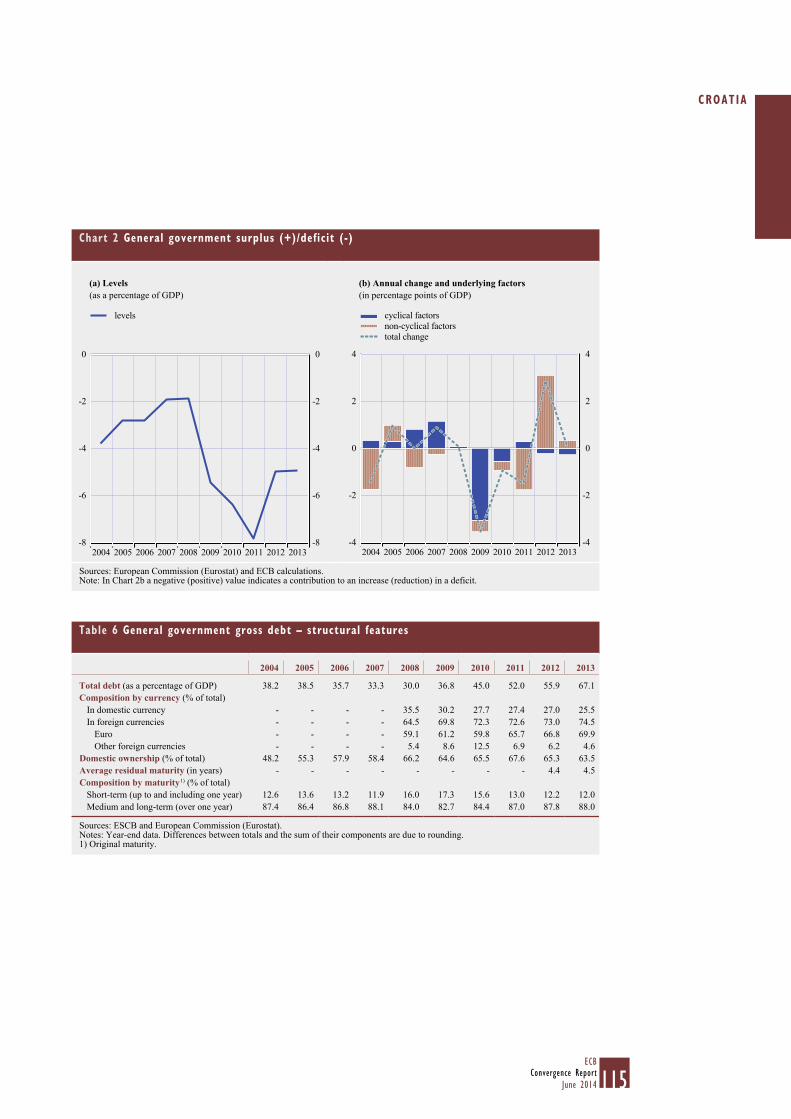
115ECB
Convergence ReportJune 2014
CROATIA
Chart 2 General government surplus (+)/deficit (-)
(a) Levels(as a percentage of GDP)
(b) Annual change and underlying factors(in percentage points of GDP)
-8
-6
-4
-2
0
-8
-6
-4
-2
0
2012 20132004 2005 2006 2007 2008 2009 2010 2011
levels
-4
-2
0
2
4
-4
-2
0
2
4
cyclical factorsnon-cyclical factorstotal change
2012 20132004 2005 2006 2007 2008 2009 2010 2011
Sources: European Commission (Eurostat) and ECB calculations.Note: In Chart 2b a negative (positive) value indicates a contribution to an increase (reduction) in a deficit.
Table 6 General government gross debt – structural features
2004 2005 2006 2007 2008 2009 2010 2011 2012 2013
Total debt (as a percentage of GDP) 38.2 38.5 35.7 33.3 30.0 36.8 45.0 52.0 55.9 67.1 Composition by currency (% of total)
In domestic currency - - - - 35.5 30.2 27.7 27.4 27.0 25.5 In foreign currencies - - - - 64.5 69.8 72.3 72.6 73.0 74.5
Euro - - - - 59.1 61.2 59.8 65.7 66.8 69.9 Other foreign currencies - - - - 5.4 8.6 12.5 6.9 6.2 4.6
Domestic ownership (% of total) 48.2 55.3 57.9 58.4 66.2 64.6 65.5 67.6 65.3 63.5 Average residual maturity (in years) - - - - - - - - 4.4 4.5 Composition by maturity 1) (% of total)
Short-term (up to and including one year) 12.6 13.6 13.2 11.9 16.0 17.3 15.6 13.0 12.2 12.0 Medium and long-term (over one year) 87.4 86.4 86.8 88.1 84.0 82.7 84.4 87.0 87.8 88.0
Sources: ESCB and European Commission (Eurostat).Notes: Year-end data. Differences between totals and the sum of their components are due to rounding.1) Original maturity.
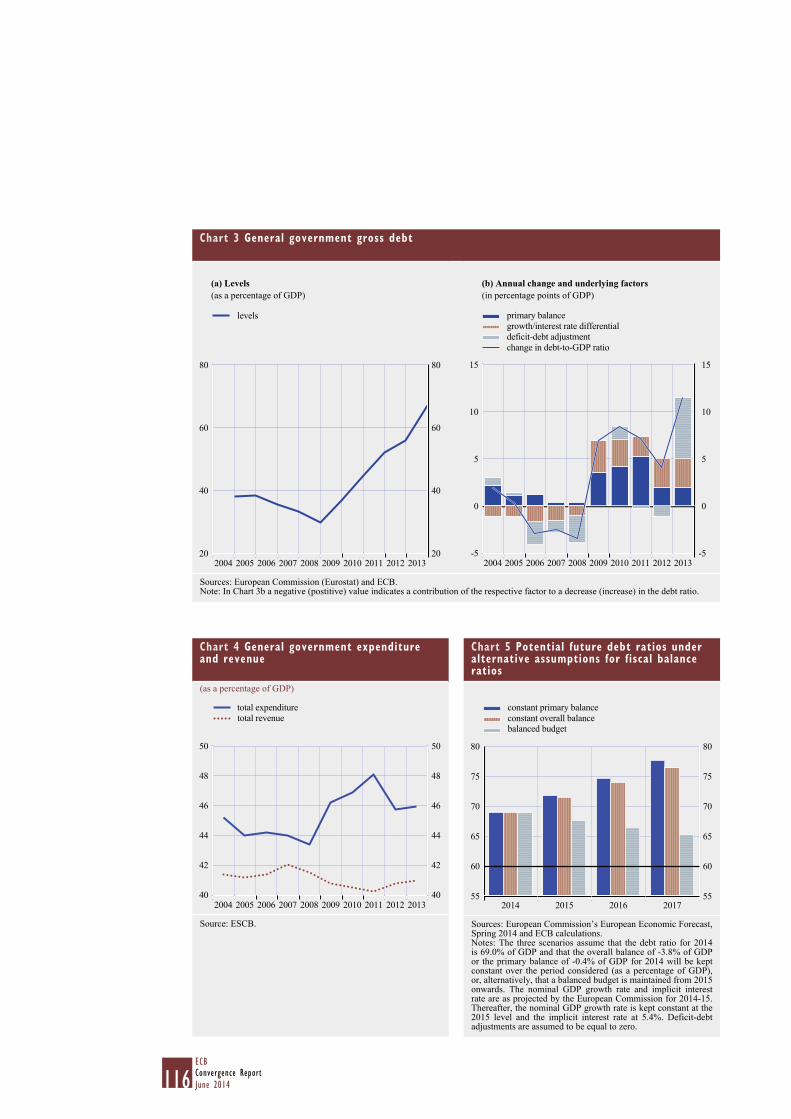
116ECBConvergence ReportJune 2014
Chart 3 General government gross debt
(a) Levels(as a percentage of GDP)
(b) Annual change and underlying factors(in percentage points of GDP)
80
60
40
20
80
60
40
202004 2005 2006 2007 2008 2009 2010 2011 2012 2013
levels
15
10
5
0
-5
15
10
5
0
-52004 2005 2006 2007 2008 2009 2010 2011 2012 2013
primary balancegrowth/interest rate differentialdeficit-debt adjustmentchange in debt-to-GDP ratio
Sources: European Commission (Eurostat) and ECB.Note: In Chart 3b a negative (postitive) value indicates a contribution of the respective factor to a decrease (increase) in the debt ratio.
Chart 4 General government expenditure and revenue
(as a percentage of GDP)
40
42
44
46
48
50
40
42
44
46
48
50
2012
total expendituretotal revenue
2004 2005 2007 2009 2011 20132006 2008 2010
Source: ESCB.
Chart 5 Potential future debt ratios under alternative assumptions for fiscal balance ratios
55
60
65
70
75
80
55
60
65
70
75
80
2017
constant primary balanceconstant overall balancebalanced budget
2014 2015 2016
Sources: European Commission’s European Economic Forecast, Spring 2014 and ECB calculations.Notes: The three scenarios assume that the debt ratio for 2014 is 69.0% of GDP and that the overall balance of -3.8% of GDP or the primary balance of -0.4% of GDP for 2014 will be kept constant over the period considered (as a percentage of GDP), or, alternatively, that a balanced budget is maintained from 2015 onwards. The nominal GDP growth rate and implicit interest rate are as projected by the European Commission for 2014-15. Thereafter, the nominal GDP growth rate is kept constant at the 2015 level and the implicit interest rate at 5.4%. Deficit-debt adjustments are assumed to be equal to zero.
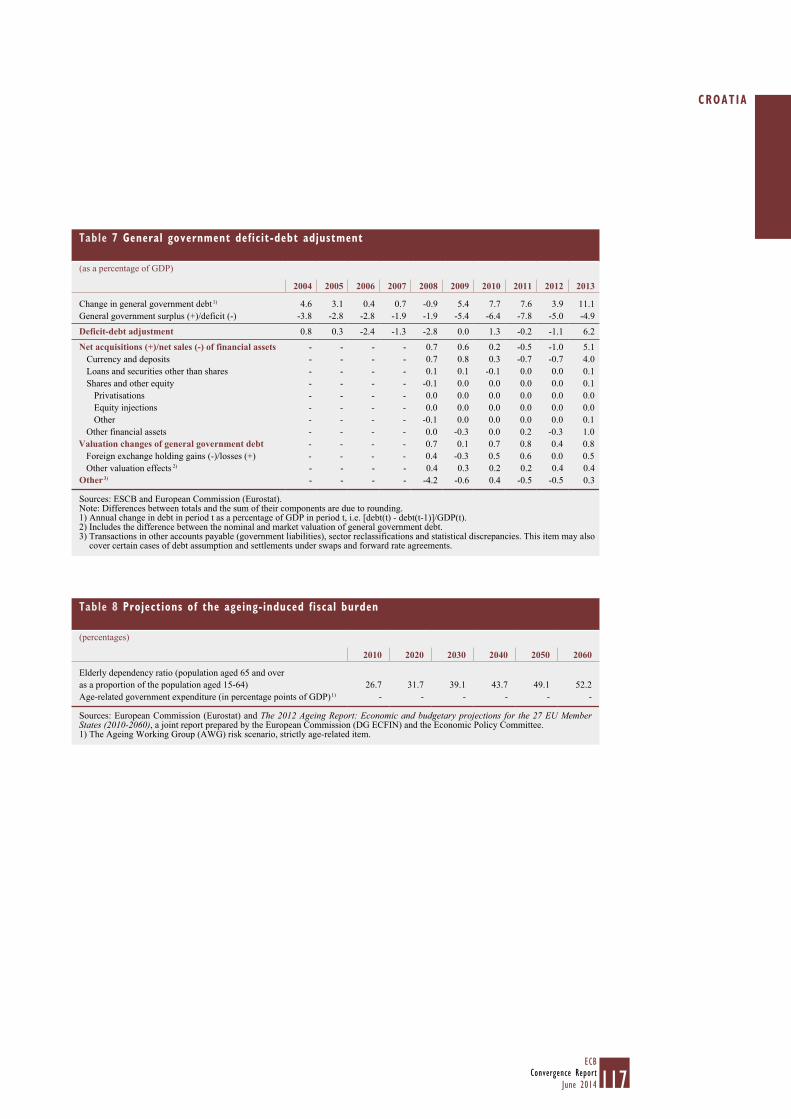
117ECB
Convergence ReportJune 2014
CROATIA
Table 7 General government deficit-debt adjustment
(as a percentage of GDP)
2004 2005 2006 2007 2008 2009 2010 2011 2012 2013
Change in general government debt 1) 4.6 3.1 0.4 0.7 -0.9 5.4 7.7 7.6 3.9 11.1 General government surplus (+)/deficit (-) -3.8 -2.8 -2.8 -1.9 -1.9 -5.4 -6.4 -7.8 -5.0 -4.9
Deficit-debt adjustment 0.8 0.3 -2.4 -1.3 -2.8 0.0 1.3 -0.2 -1.1 6.2
Net acquisitions (+)/net sales (-) of financial assets - - - - 0.7 0.6 0.2 -0.5 -1.0 5.1 Currency and deposits - - - - 0.7 0.8 0.3 -0.7 -0.7 4.0 Loans and securities other than shares - - - - 0.1 0.1 -0.1 0.0 0.0 0.1 Shares and other equity - - - - -0.1 0.0 0.0 0.0 0.0 0.1
Privatisations - - - - 0.0 0.0 0.0 0.0 0.0 0.0 Equity injections - - - - 0.0 0.0 0.0 0.0 0.0 0.0 Other - - - - -0.1 0.0 0.0 0.0 0.0 0.1
Other financial assets - - - - 0.0 -0.3 0.0 0.2 -0.3 1.0 Valuation changes of general government debt - - - - 0.7 0.1 0.7 0.8 0.4 0.8
Foreign exchange holding gains (-)/losses (+) - - - - 0.4 -0.3 0.5 0.6 0.0 0.5 Other valuation effects 2) - - - - 0.4 0.3 0.2 0.2 0.4 0.4
Other 3) - - - - -4.2 -0.6 0.4 -0.5 -0.5 0.3
Sources: ESCB and European Commission (Eurostat).Note: Differences between totals and the sum of their components are due to rounding.1) Annual change in debt in period t as a percentage of GDP in period t, i.e. [debt(t) - debt(t-1)]/GDP(t).2) Includes the difference between the nominal and market valuation of general government debt.3) Transactions in other accounts payable (government liabilities), sector reclassifications and statistical discrepancies. This item may also
cover certain cases of debt assumption and settlements under swaps and forward rate agreements.
Table 8 Projections of the ageing-induced fiscal burden
(percentages)
2010 2020 2030 2040 2050 2060
Elderly dependency ratio (population aged 65 and over as a proportion of the population aged 15-64) 26.7 31.7 39.1 43.7 49.1 52.2 Age-related government expenditure (in percentage points of GDP) 1) - - - - - -
Sources: European Commission (Eurostat) and The 2012 Ageing Report: Economic and budgetary projections for the 27 EU Member States (2010-2060), a joint report prepared by the European Commission (DG ECFIN) and the Economic Policy Committee.1) The Ageing Working Group (AWG) risk scenario, strictly age-related item.
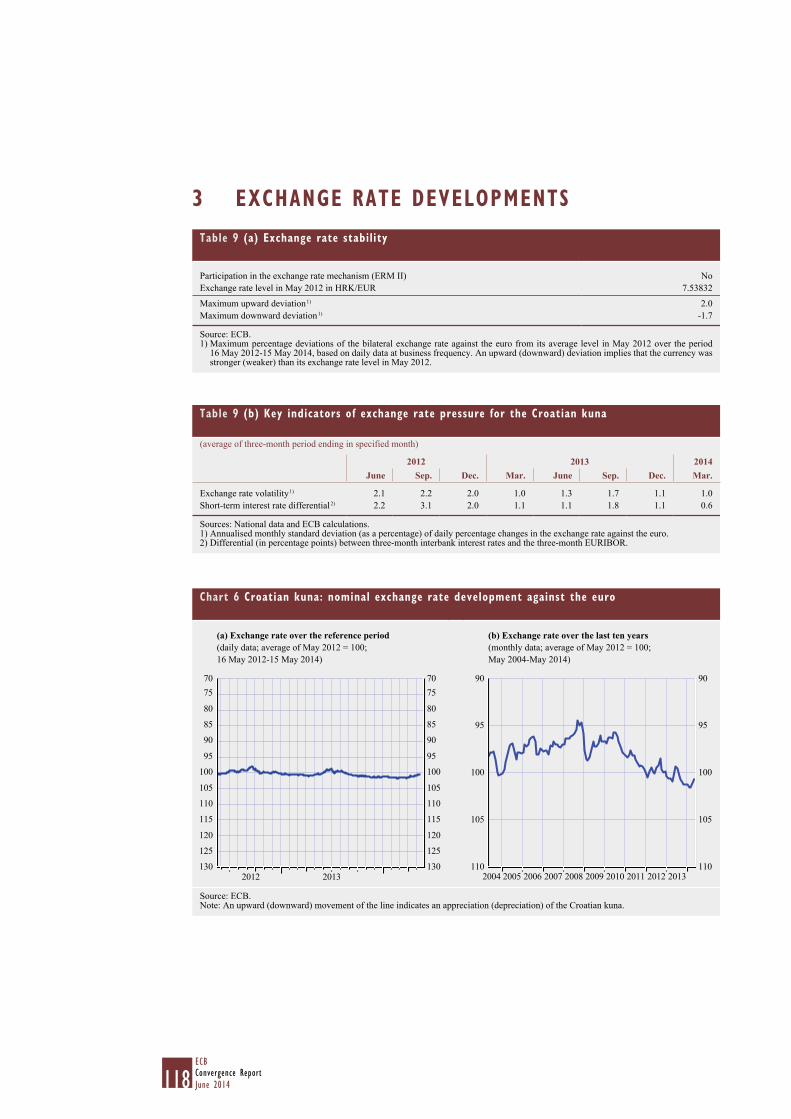
118ECBConvergence ReportJune 2014
3 EXCHANGE RATE DEVELOPMENTS
Chart 6 Croatian kuna: nominal exchange rate development against the euro
(a) Exchange rate over the reference period (daily data; average of May 2012 = 100; 16 May 2012-15 May 2014)
(b) Exchange rate over the last ten years (monthly data; average of May 2012 = 100; May 2004-May 2014)
130
125
120
115
110
105
100
95
90
85
80
7570
130
125
120
115
110
105
100
95
90
85
80
7570
2012 2013110
105
100
95
90
110
105
100
95
90
2011 2012 20132005 20062004 20082007 2009 2010
Source: ECB.Note: An upward (downward) movement of the line indicates an appreciation (depreciation) of the Croatian kuna.
Table 9 (a) Exchange rate stability
Participation in the exchange rate mechanism (ERM II) NoExchange rate level in May 2012 in HRK/EUR 7.53832
Maximum upward deviation 1) 2.0Maximum downward deviation 1) -1.7
Source: ECB.1) Maximum percentage deviations of the bilateral exchange rate against the euro from its average level in May 2012 over the period
16 May 2012-15 May 2014, based on daily data at business frequency. An upward (downward) deviation implies that the currency was stronger (weaker) than its exchange rate level in May 2012.
Table 9 (b) Key indicators of exchange rate pressure for the Croatian kuna
(average of three-month period ending in specified month)
2012 2013 2014June Sep. Dec. Mar. June Sep. Dec. Mar.
Exchange rate volatility 1) 2.1 2.2 2.0 1.0 1.3 1.7 1.1 1.0 Short-term interest rate differential 2) 2.2 3.1 2.0 1.1 1.1 1.8 1.1 0.6
Sources: National data and ECB calculations.1) Annualised monthly standard deviation (as a percentage) of daily percentage changes in the exchange rate against the euro.2) Differential (in percentage points) between three-month interbank interest rates and the three-month EURIBOR.

119ECB
Convergence ReportJune 2014
CROATIA
Table 10 Croatian kuna: real exchange rate developments
(monthly data; percentage deviation in April 2014 from the ten-year average calculated for the period May 2004-April 2014)
Apr. 2014
Real bilateral exchange rate against the euro 1) -0.3Memo items:
Nominal effective exchange rate 2) -3.1Real effective exchange rate 1), 2) -1.4
Source: ECB.Note: A positive (negative) sign indicates an appreciation (depreciation).1) Based on HICP and CPI developments.2) Effective exchange rate against the euro, the currencies of the non-euro area EU Member States and those of ten other major trading
partners.
Table 11 External developments
(as a percentage of GDP, unless otherwise stated)
2004 2005 2006 2007 2008 2009 2010 2011 2012 2013
Balance of paymentsCurrent account and capital account balance 1) -4.2 -5.1 -6.9 -7.1 -8.7 -4.8 -0.8 -0.8 0.1 1.2
Current account balance -4.3 -5.3 -6.6 -7.2 -8.8 -4.9 -0.9 -0.8 0.0 1.2 Goods balance -20.4 -20.8 -21.1 -21.8 -22.8 -16.6 -13.5 -14.4 -13.8 -14.4 Services balance 14.4 14.9 14.6 14.8 15.1 13.4 13.7 14.7 14.8 15.6 Income balance -2.0 -2.6 -2.9 -2.5 -3.3 -4.0 -3.5 -3.6 -3.5 -2.6 Current transfers balance 3.6 3.3 2.8 2.4 2.3 2.3 2.4 2.5 2.6 2.5
Capital account balance 0.1 0.1 -0.3 0.1 0.0 0.1 0.1 0.0 0.1 0.1 Combined direct and portfolio investment balance 1) 2.6 0.1 5.9 8.7 5.1 4.3 1.9 3.8 6.6 5.6
Direct investment balance 1.8 3.4 6.4 7.9 6.7 3.4 0.9 2.3 2.6 1.2 Portfolio investment balance 0.8 -3.3 -0.6 0.8 -1.7 0.9 1.0 1.5 3.9 4.4
Other investment balance 5.0 10.5 8.1 3.1 6.3 5.3 1.7 0.3 -5.5 -0.5 Reserve assets -0.1 -2.3 -3.5 -1.7 0.7 -2.0 -0.1 -0.9 -0.1 -4.3 Exports of goods and services 42.9 42.3 42.8 42.2 41.9 36.7 40.1 42.7 43.7 43.1 Imports of goods and services 48.8 48.3 49.2 49.3 49.7 39.9 39.9 42.4 42.8 41.9 Net international investment position 2) -47.7 -56.5 -77.0 -92.8 -75.3 -87.4 -95.9 -92.0 -89.5 -88.4 Gross external debt 2) 71.0 71.7 74.8 77.1 86.3 100.2 105.1 104.6 102.5 105.7 Memo item:Export market shares 3) 0.16 0.15 0.14 0.14 0.15 0.14 0.12 0.12 0.11 0.11
Source: ECB.1) Differences between totals and the sum of their components are due to rounding.2) End-of-period outstanding amounts.3) As a percentage of total world goods and services exports.
Table 12 Indicators of integration with the euro area
(as a percentage of the total, unless otherwise stated)
2004 2005 2006 2007 2008 2009 2010 2011 2012 2013
External trade with the euro areaExports of goods 59.3 56.0 55.1 51.4 52.0 52.5 53.5 51.9 49.8 50.6 Imports of goods 58.1 54.5 54.2 52.7 51.9 50.9 49.0 50.2 50.9 52.0 Investment position with the euro area Inward direct investment 1) 74.4 73.7 80.1 82.4 78.1 76.7 74.6 73.3 70.7 71.6 Outward direct investment 1) 30.8 30.4 25.6 23.3 40.5 44.8 13.2 20.6 14.5 19.3 Portfolio investment liabilities 1) 80.7 67.6 69.4 64.9 62.9 60.7 50.6 58.6 59.9 . Portfolio investment assets 1) - - - - 76.2 76.3 70.5 65.3 62.9 .
Memo items: External trade with the EU
Exports of goods 65.8 63.3 64.3 60.3 61.0 60.5 61.1 59.9 58.2 59.2 Imports of goods 71.0 67.9 67.2 64.8 64.1 62.7 60.2 61.8 62.5 65.1
Sources: ESCB, European Commission (Eurostat) and IMF.1) End-of-period outstanding amounts.
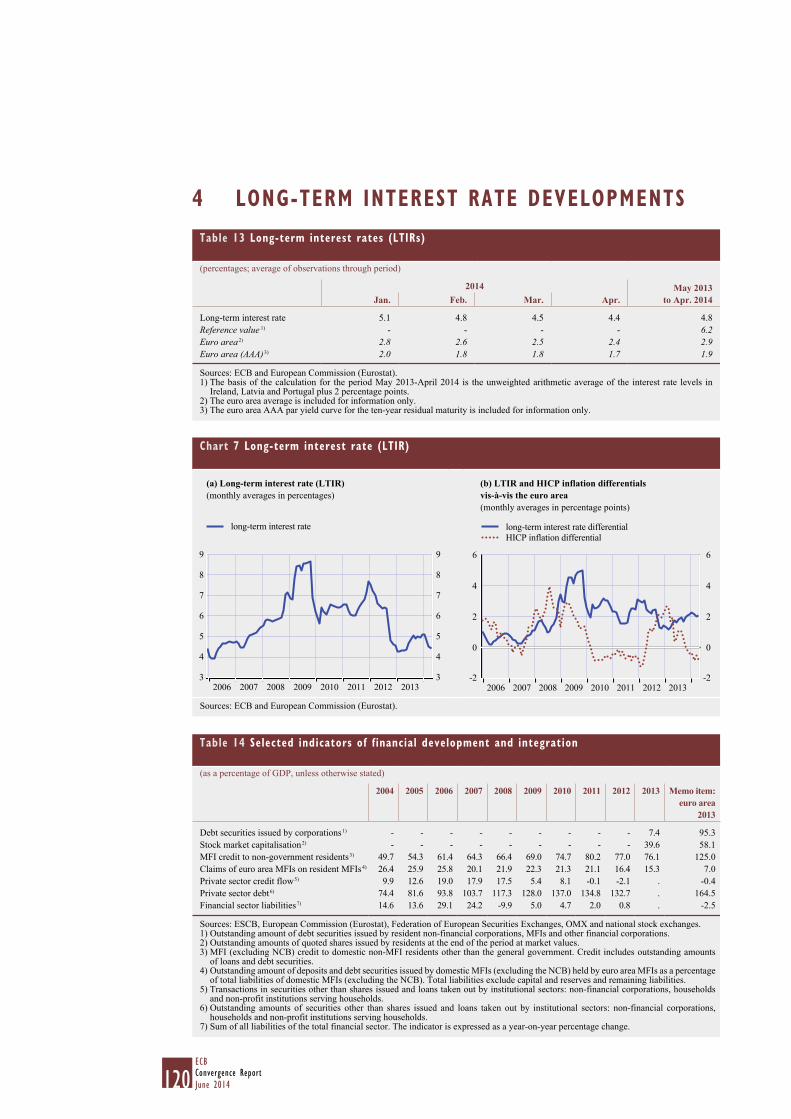
120ECBConvergence ReportJune 2014
4 LONG-TERM INTEREST RATE DEVELOPMENTSTable 13 Long-term interest rates (LTIRs)
(percentages; average of observations through period)
2014 May 2013 to Apr. 2014Jan. Feb. Mar. Apr.
Long-term interest rate 5.1 4.8 4.5 4.4 4.8 Reference value 1) - - - - 6.2 Euro area 2) 2.8 2.6 2.5 2.4 2.9 Euro area (AAA) 3) 2.0 1.8 1.8 1.7 1.9
Sources: ECB and European Commission (Eurostat).1) The basis of the calculation for the period May 2013-April 2014 is the unweighted arithmetic average of the interest rate levels in
Ireland, Latvia and Portugal plus 2 percentage points.2) The euro area average is included for information only.3) The euro area AAA par yield curve for the ten-year residual maturity is included for information only.
Table 14 Selected indicators of financial development and integration
(as a percentage of GDP, unless otherwise stated)
2004 2005 2006 2007 2008 2009 2010 2011 2012 2013 Memo item: euro area
2013
Debt securities issued by corporations 1) - - - - - - - - - 7.4 95.3 Stock market capitalisation 2) - - - - - - - - - 39.6 58.1 MFI credit to non-government residents 3) 49.7 54.3 61.4 64.3 66.4 69.0 74.7 80.2 77.0 76.1 125.0 Claims of euro area MFIs on resident MFIs 4) 26.4 25.9 25.8 20.1 21.9 22.3 21.3 21.1 16.4 15.3 7.0 Private sector credit flow 5) 9.9 12.6 19.0 17.9 17.5 5.4 8.1 -0.1 -2.1 . -0.4 Private sector debt 6) 74.4 81.6 93.8 103.7 117.3 128.0 137.0 134.8 132.7 . 164.5 Financial sector liabilities 7) 14.6 13.6 29.1 24.2 -9.9 5.0 4.7 2.0 0.8 . -2.5
Sources: ESCB, European Commission (Eurostat), Federation of European Securities Exchanges, OMX and national stock exchanges.1) Outstanding amount of debt securities issued by resident non-financial corporations, MFIs and other financial corporations.2) Outstanding amounts of quoted shares issued by residents at the end of the period at market values.3) MFI (excluding NCB) credit to domestic non-MFI residents other than the general government. Credit includes outstanding amounts
of loans and debt securities.4) Outstanding amount of deposits and debt securities issued by domestic MFIs (excluding the NCB) held by euro area MFIs as a percentage
of total liabilities of domestic MFIs (excluding the NCB). Total liabilities exclude capital and reserves and remaining liabilities.5) Transactions in securities other than shares issued and loans taken out by institutional sectors: non-financial corporations, households
and non-profit institutions serving households.6) Outstanding amounts of securities other than shares issued and loans taken out by institutional sectors: non-financial corporations,
households and non-profit institutions serving households.7) Sum of all liabilities of the total financial sector. The indicator is expressed as a year-on-year percentage change.
Chart 7 Long-term interest rate (LTIR)
(a) Long-term interest rate (LTIR) (monthly averages in percentages)
(b) LTIR and HICP inflation differentials vis-à-vis the euro area(monthly averages in percentage points)
3
4
5
6
7
8
9
3
4
5
6
7
8
9
2012 20132006 2007 2008 2009 2010 2011
long-term interest rate
-2
0
2
4
6
-2
0
2
4
6
2012 2013
long-term interest rate differentialHICP inflation differential
2006 2007 2008 2009 2010 2011
Sources: ECB and European Commission (Eurostat).
121ECB
Convergence ReportJune 2014
L ITHUANIA
5.4 LITHUANIA
5.4.1 PRICE DEVELOPMENTS
Over the reference period from May 2013 to April 2014, the 12-month average rate of HICP inflation in Lithuania was 0.6%, i.e. well below the reference value of 1.7% for the criterion on price stability (see Table 1). On the basis of the most recent information, the 12-month average rate of HICP inflation is expected to remain broadly stable in the coming months before increasing slightly later on.
Looking back over a longer period, consumer price inflation in Lithuania has been volatile, with 12-month average rates ranging from 1.2% to 11.1% over the past ten years (see Chart 1). Following Lithuania’s accession to the EU in 2004, inflation picked up from the subdued rates prevailing earlier in the decade and rose significantly in 2007-08. Unsustainable developments in domestic demand, coupled with a surge in capital inflows, led to extremely strong credit growth. In addition to the hikes in global energy and food prices, sharp wage increases pushed up inflation and led to an erosion of price competitiveness. The Lithuanian economy exhibited growing signs of overheating, an increasingly tight labour market and rising macroeconomic imbalances. As these macroeconomic developments proved to be unsustainable, the Lithuanian economy experienced a severe contraction in 2009, before recovering again in the years that followed. After peaking at 11.1% in 2008, the annual rate of inflation fell sharply. This adjustment helped Lithuania to regain price competitiveness. In 2011-12, however, hikes in global food and energy prices set inflation on an upward course once again. In 2013 inflation then declined to 1.2%, as a result of favourable global commodity prices and a fall in food prices and administered prices.
Economic and monetary policy choices have played an important role in shaping inflation developments over the past ten years. Monetary policy is aimed towards the achievement of price stability, which is the primary objective of monetary policy as enshrined in the central bank law. In 1994 Lietuvos bankas adopted a currency board arrangement, with the litas being first pegged to the US dollar and then re-pegged to the euro in 2002. In June 2004 Lithuania joined ERM II, with its existing currency board arrangement remaining in place as a unilateral commitment. During the period 2004-08 monetary policy conditions in Lithuania under the currency board arrangement became too expansionary for a catching-up economy, as it was faced with overheating pressures and had a significantly higher growth potential than the euro area. At the same time, fiscal policies became increasingly pro-cyclical and the overall policy stance (including fiscal policy) was not tight enough to counter the build-up of macroeconomic imbalances. During the subsequent downturn significant fiscal consolidation measures were implemented and the fiscal governance framework was strengthened, which contributed to the reduction of macroeconomic imbalances and a decline in inflation. These measures, along with the sharp contraction in aggregate demand, also supported an internal adjustment which reduced previous losses in competitiveness and macroeconomic imbalances. Wage cuts, followed by moderate wage growth and rising labour productivity boosted competiveness during the adjustment period. The high level of structural unemployment and supply bottlenecks (in particular for skilled labour), as well as Lithuania’s net emigration level, a relatively high tax wedge and relatively costly dismissal procedures, are still impinging on the country’s overall economic performance and pose a potential risk to price stability.
Inflation developments over the past ten years should be viewed against the background of a volatile macroeconomic environment. During this period, Lithuania’s business cycle has moved broadly in line with that of the euro area as a whole, although macroeconomic fluctuations have been more

122ECBConvergence ReportJune 2014
pronounced in Lithuania. Up to 2007 real GDP grew at a very robust rate, but then contracted sharply in 2009, owing to the build-up and subsequent correction of significant macroeconomic imbalances and vulnerabilities. In 2008 macroeconomic conditions weakened abruptly, reflecting the collapse of domestic demand and the unwinding of house price and credit growth, which were reinforced by the significant deterioration in the external environment and the global financial crisis. Following a cumulative decline of around 15%, economic activity started to recover in 2010, before picking up strongly in 2011. In 2012 and 2013 growth rates increased to sustainably robust rates of 3.7% and 3.3% respectively (see Table 2). After peaking at 18% in early 2010, unemployment has fallen, but remained at a high level, standing at 11.8% in 2013. However, according to most estimates, this level is already close to the natural rate of unemployment in Lithuania. During the period under review wages and employment were fairly flexible, but labour supply bottlenecks started emerging. Following two years of wage decline, nominal wages resumed their upward trend in 2011. After falling by almost 10% in 2009, compensation per employee recovered somewhat in 2011 as labour market conditions started to improve again. Nevertheless, it remained below pre-crisis levels until 2013, when it rose by 5.9%, in part as a result of the increase in the minimum wage by 25% (to about €290) in two steps between July 2012 and January 2013. Lithuania experienced a 7.0% fall in unit labour costs in 2010 owing to a decline in compensation that was followed by an increase in productivity gains on the back of labour shedding. Developments in import prices closely mirrored those in global commodity prices. In 2009 they declined, thereby reinforcing the downward impact of wage costs on inflation. Subsequently, they picked up sharply in 2010 and 2011, before returning to very low negative rates in 2013. The acceleration and subsequent decline in inflation over the past decade is also apparent from other relevant price indices, such as the HICP excluding unprocessed food and energy (see Table 2). Residential property prices increased somewhat in 2013, following a cumulative decline of around 41% in 2009-12.
Looking at recent developments, the annual rate of HICP inflation remained low in early 2014 and stood at 0.3% in April (see Table 3a). The low level of inflation in 2013 was due mainly to the fall in global commodity prices and the associated lower growth in administered prices and energy prices. From July 2013 commodity prices, in particular for grains, sugar and oil, fell to a level below that of one year earlier. The annual rate of growth in administered prices, which constitute 13% of Lithuania’s HICP basket of goods and services, also turned negative in the middle of 2013, mainly owing to developments in prices for heating energy, as the cheaper prices for natural gas imports were passed on to households. Food prices also contributed somewhat to the decrease in inflation. The downward impact on inflation of lower heating prices was dampened by the rise in electricity prices in 2013. Skill mismatches also emerged in some sectors, putting some upward pressure on wages, as a large part of unemployment in Lithuania is structural. However, the impact of wage increases on unit labour costs was partly offset by a pick-up in labour productivity.
The latest available forecasts from major international institutions project inflation to increase gradually and to range from 1.0% to 1.3% in 2014 and from 1.8% to 2.4% in 2015 (see Table 3b). The balance of risks surrounding the forecasts for the years ahead is on the upside. In particular, there is the possibility of higher global prices for food and energy and stronger than expected increases in wages as the slack in the labour market diminishes, but there are downside risks stemming from likely administered price reductions related to envisaged price cuts of imported gas. Developments in global commodity prices for food and energy tend to have a relatively large impact on consumer prices in Lithuania. A further tightening of the labour market, together with growing skill mismatches, or a further significant increase in the minimum wage, would put some upward pressure on wages.

123ECB
Convergence ReportJune 2014
L ITHUANIA
Looking further ahead, maintaining low inflation rates on a sustainable basis in Lithuania will be challenging in the medium term, given monetary policy’s limited room for manoeuvre. Developments during the boom period of 2005-07 highlight that it may be difficult to control domestic price pressures and avoid renewed economic overheating. The catching-up process is likely to drive up the inflation differential between Lithuania and the euro area over the medium term, given that GDP per capita and price levels are still lower in Lithuania than in the euro area (see Table 2). However, it is difficult to assess the exact magnitude of the inflation effect resulting from this catching-up process. Nevertheless, the income and price level convergence is likely to continue. This, in turn, would manifest itself in terms of higher domestic inflation, given the absence of flexibility in the nominal exchange rate. Indeed, in the context of the process of economic convergence, it cannot be ruled out that significant demand pressure may emerge again, although the ongoing deleveraging process, strengthened fiscal governance and macro-prudential frameworks (including the implementation of the “responsible lending guidelines” of Lietuvos bankas) reduce this risk for the future. Therefore, given the lack of nominal exchange rate flexibility and the limitations of alternative counter-cyclical policy instruments, it may be difficult to prevent another build-up of macroeconomic imbalances, including high rates of inflation.
Overall, although the 12-month average rate of HICP inflation in Lithuania is well below thereferencevalue,thereareconcernsregardingthesustainabilityofinflationconvergence.
Achieving an environment that is conducive to sustainable convergence in Lithuania requires, among other things, the conduct of economic policies geared towards ensuring overall sustainable macroeconomic stability, including price stability. Regarding macroeconomic imbalances, the European Commission did not select Lithuania for an in-depth review in its Alert Mechanism Report 2014. At the same time, given monetary policy’s limited room for manoeuvre owing to the lack of nominal exchange rate flexibility, it is imperative that other policy areas provide the economy with the wherewithal to cope with country-specific shocks in order to prevent the reoccurrence of macroeconomic imbalances. More specifically, progress in the areas below will help to achieve an environment that is conducive to sustainable price stability and promote competitiveness and employment growth.
With regard to labour markets, reforms are needed to mitigate structural disincentives to work (such as the relatively costly dismissal procedures and the relatively high tax wedge) and to help counter the still sizeable labour outflows. Moreover, further wage restraint is needed to lock in the competitiveness gains achieved in recent years. To address other structural issues, further productivity-enhancing structural reforms are needed, focusing, for example, on supporting the reorientation of resources towards the tradable sector. Such reforms may also help to attract more foreign direct investment, which could strengthen the competitive position of the tradable sector. Lithuania’s high energy intensity and dependence on imports of energy from abroad continue to push up the level of volatility in inflation, and further steps are needed to increase domestic production of energy.
The overall governance and institutional framework needs to be such that it facilitates competitiveness gains. This means implementing measures to reduce the size of the shadow economy (e.g. by introducing a ceiling on cash transactions), to increase public administration efficiency and to fight corruption. Reforms to reduce costs and improve efficiency in the energy sector are also required.
124ECBConvergence ReportJune 2014
Finally, confidence in the soundness of the financial sector needs to be strengthened further. The intervention by Lietuvos bankas in two domestically-owned banks and several credit unions in recent years underscores the importance of effective supervision. The process of broadening the mandate of Lietuvos bankas to include macro-prudential policy should be completed. Close monitoring of the impact of the new bankruptcy law and further progress on the resolution of non-performing loans is needed. Financial sector policies should also be geared towards safeguarding financial stability and ensure that the financial sector makes a sound contribution to economic growth. In order to minimise the potential risks to financial stability associated with a high proportion of foreign currency loans, which are denominated predominantly in euro, it is necessary for Lithuania to fully implement the recommendation of the ESRB on lending in foreign currencies,8 with which it was considered to be largely compliant in the follow-up report published by the ESRB in November 2013. Close cooperation between home and host country supervisory authorities is important to ensure the effective implementation of the measures. Finally, financial stability could benefit from Lithuania’s participation in the SSM, which will take up its prudential supervisory tasks in November 2014.
5.4.2 FISCAL DEVELOPMENTS
Lithuania is not subject to an EU Council decision on the existence of an excessive deficit. In the reference year 2013 the general government budget balance recorded a deficit of 2.1% of GDP, i.e. below the 3% reference value. The general government gross debt-to-GDP ratio was 39.4%, i.e. well below the 60% reference value (see Table 4). Compared with the previous year, the deficit and debt ratios decreased by 1.1 percentage point. The deficit ratio is forecast by the European Commission to remain at 2.1% in 2014, while the government debt ratio is projected to increase to 41.8%. With regard to other fiscal factors, the deficit ratio did not exceed the ratio of public investment to GDP in 2013, nor is it expected to in 2014.
Looking at developments in Lithuania’s budgetary position over the period from 2004 to 2013, after declining to 0.4% in 2006, the deficit-to-GDP ratio started to rise and recorded a sharp increase in 2009, when it reached 9.4%. Since then, this upward trend has reversed (see Table 5 and Chart 2a). Against the background of the rise in the budget deficit above the reference value in 2008, the ECOFIN Council decided on 7 July 2009 that an excessive deficit situation existed in Lithuania and set 2011 as the deadline for correcting it. Its recommendation of 12 February 2010 extended this deadline to 2012. The ECOFIN Council abrogated the excessive deficit procedure on 21 June 2013.
As shown in greater detail in Chart 2b, European Commission estimates indicate that cyclical factors helped in improving the budget balance after 2009. Non-cyclical factors tended to contribute to an increase in the budget deficit before 2009 and a decrease between 2010 and 2013, suggesting that fiscal policy was not expansionary during the latter period. Since 2009 the Lithuanian government has implemented significant consolidation measures in order to reduce the fiscal deficit. Though there are other factors, these measures mainly reflect spending cuts to reduce social benefit payments and to contain public spending in general. Taking into account temporary and one-off factors between 2007 and 2013, the underlying changes in the budget deficit seem to reflect a deterioration in Lithuania’s structural budgetary position until 2009 and an improvement thereafter as a result of significant consolidation efforts. These efforts, combined with robust economic growth, have borne fruit, as indicated by a substantial reduction in the deficit-to-GDP ratio from 9.4% in 2009 to 2.1% in 2013.
8 See Recommendation (ESRB/2011/1) of the European Systemic Risk Board of 21 September 2011 on lending in foreign currencies.
125ECB
Convergence ReportJune 2014
L ITHUANIA
However, fiscal policies have yet to build up sufficient buffers with respect to the 3% of GDP deficit threshold value, as envisaged in the 2014 convergence programme update.
Turning to developments in general government gross debt, the debt-to-GDP ratio increased cumulatively by 20.1 percentage points between 2004 and 2013, decreasing gradually until 2008 and recording sharp increases in 2009-10, before declining somewhat in 2013 (see Chart 3a and Table 6). As shown in greater detail in Chart 3b, primary deficits were the main driver of the increase in the debt ratio between 2009 and 2012. The impact of deficit-debt adjustments was volatile, with both debt-increasing and debt-decreasing effects in individual years before 2013 (see Table 7). The growth-interest rate differential had a dampening effect on the debt ratio before 2008 and in 2011 and 2012, but a debt-increasing effect in 2009 and, to a lesser extent, 2010. In 2013 the decrease in the general government debt-to-GDP ratio reflected the favourable deficit-debt adjustment, which more than offset the impact stemming from the primary deficit ratio, while the growth-interest rate differential was broadly neutral.
As regards Lithuania’s general government debt structure, the share of government debt with a short-term maturity was rather volatile until 2010, but it remained low at 5.6% in 2013 (see Table 6). Taking into account the level of the debt ratio, fiscal balances are relatively insensitive to changes in interest rates. At the same time, the proportion of foreign currency-denominated government debt is high (76.7% in 2013). However, it is fully denominated in euro, the anchor currency of Lithuania’s currency board arrangement. This leaves fiscal balances relatively insensitive to changes in exchange rates other than the EUR/LTL exchange rate. Despite some fluctuations, the share of debt denominated in euro and other foreign currency has decreased since 2009, pointing to a decline in debt-related vulnerabilities. At the same time, however, while the capital injections by the Lithuanian government into the financial sector increased the government debt-to-GDP ratio by 2.4% between 2008 and 2013, the government did not incur contingent liabilities resulting from interventions to support financial institutions and financial markets during the crisis (see Section 5.9).
Moving on to examine trends in other fiscal indicators, Chart 4 and Table 5 show that the general government total expenditure-to-GDP ratio increased slightly from 34.0% in 2004 to 34.4% in 2013. It peaked at 44.9% of GDP in 2009, when GDP contracted significantly, while expenditure declined in nominal terms, correcting part of the large increase seen in the preceding period. During the entire period under consideration, “social benefits other than in kind” recorded the largest increase in terms of ratio to GDP. At the same time, total government revenue declined slightly from 32.5% in 2004 to 32.2% of GDP in 2013. The development in total revenue masks a shift from direct taxes to social security contributions.
Looking ahead, Lithuania’s medium-term fiscal policy strategy, as presented in the 2014 convergence programme update of 16 April 2014, envisages a decline in the deficit ratio to 1.9% of GDP in 2014 and 0.9% of GDP in 2015 that will turn to a small surplus in 2016 and a surplus of 1.1% of GDP in 2017. Moreover, the government gross debt ratio is expected to decrease to 34.8% of GDP in 2017, while the structural deficit is projected to be reduced below the medium-term objective (specified in line with the Stability and Growth Pact) of no more than 1% of GDP by 2015. According to the European Commission’s spring 2014 projections, the structural deficit will remain above the medium-term objective throughout the projection horizon.
126ECBConvergence ReportJune 2014
On 2 March 2012 Lithuania signed the Treaty on Stability, Coordination and Governance in the Economic and Monetary Union (TSCG), committing, inter alia, to apply (and include in its national legislation) the fiscal rules specified under Title III, “Fiscal Compact”, as referred to in Box 2 of Chapter 2.
As regards fiscal governance, Lithuania’s fiscal framework is being improved, but the legislative process had not yet been finalised before the cut-off date of this report. The Lithuanian fiscal framework failed to prevent pro-cyclical fiscal policy in the years of high growth and the rules were not sufficiently binding. Therefore, there is a need to improve monitoring, accountability and execution of the budgetary process, and reinforce the binding character of the medium-term framework. The Lithuanian parliament is preparing a constitutional law on the implementation of the fiscal compact (the draft constitutional law was approved by the Government on 23 April 2014) aiming at ensuring the sustainability of general government sector finances and a stable development of the economy. The medium-term budgetary framework should be enhanced by introducing more stringent forward-looking elements and mechanisms to avoid pro-cyclicality. Particular emphasis should be put on reinforcing expenditure discipline through enforceable ceilings in the medium-term budgetary framework, improving the monitoring of budget execution throughout the year and strengthening transparency by, among other things, the timely reporting of central government and social security expenditure and ensuring comparability of budgetary indicators on a cash and accrual basis. On the revenue side, further increasing tax compliance would help in reaching the medium-term objective. In this respect, an introduction of cash transaction ceilings could further reduce the shadow economy. Full compliance with the provisions for an enhanced national governance framework under Council Directive 2011/85/EU and with the Treaty on Stability, Coordination and Governance in the Economic and Monetary Union, as referred to in Box 2 of Chapter 2, should be ensured. In particular, strict control of central and municipal government expenditure needs to be maintained.
Turning to factors that will have an impact on Lithuania’s public finances over the long term, a marked ageing of the population is expected, as highlighted in Table 8. According to the 2012 projections by the European Commission and the EU’s Economic Policy Committee, starting from a level of 19.2% of GDP in 2010, Lithuania is likely to experience a significant increase in strictly age-related public expenditure amounting to 7.4 percentage points of GDP by the year 2060, well above the EU average of 4.8 percentage points.9
Turning to fiscal challenges, Lithuania must bring its budget deficit down to meet the medium-term objective, as well as maintaining sound fiscal policies thereafter. It also needs to continue implementing its consolidation strategy. In this context, fiscal risks related to state-owned enterprises and low tax compliance need to be addressed. Lithuania’s fiscal policy strategy should be embedded in a strengthened fiscal framework, with an emphasis on improving the medium-term budgetary framework. It should also increase fiscal buffers and enforce expenditure ceilings, thus helping to avoid pro-cyclical fiscal policies in the future. At the same time, Lithuania should make every effort to fully comply with its obligations under the enhanced Stability and Growth Pact, and to effectively implement the provisions of the Treaty on Stability, Coordination and Governance in the Economic and Monetary Union. Over the longer run, the risks to medium-term fiscal sustainability warrant structural fiscal reforms that focus on avoiding pro-cyclical policies,
9 European Commission and Economic Policy Committee, “The 2012 Ageing Report: Economic and budgetary projections for the EU-27 Member States (2010-2060)”.
127ECB
Convergence ReportJune 2014
L ITHUANIA
improving the sustainability of the pension system, tax administration, municipalities’ fiscal responsibility and the overall quality of economic governance.
5.4.3 EXCHANGE RATE DEVELOPMENTS
The Lithuanian litas joined ERM II on 28 June 2004 and was therefore participating in ERM II for the entire two-year reference period from 16 May 2012 to 15 May 2014 (see Table 9a). Lithuania joined ERM II with its existing currency board arrangement in place, as a unilateral commitment, thus placing no additional obligations on the ECB. A standard fluctuation band of ±15% was adopted around the central rate of 3.45280 litas per euro. The agreement on participation in ERM II was based on a number of policy commitments by the Lithuanian authorities, relating, among other things, to pursuing sound fiscal policies, containing credit growth to ensure the sustainability of the current account balance and implementing further structural reforms. Over the reference period the litas continued to be stable and did not exhibit any deviation from its central rate within ERM II (see Chart 5 and Table 9a). Furthermore, Lithuania has not changed its currency’s central rate against the euro on its own initiative. As implied by the currency board regime, Lietuvos bankas continued to regularly intervene in the foreign exchange market. Overall, its sales and purchases of foreign currency over the two-year reference period resulted in a net sale. Short-term interest rate differentials against the three-month EURIBOR averaged a modest level of around 0.5 percentage point from the start of the reference period to the three-month period ending in June 2013. Thereafter they declined to very low levels, standing at 0.1 percentage point in the three-month period ending in March 2014 (see Table 9b).
In a longer-term context, in April 2014 both the real effective exchange rate and the real bilateral exchange rate of the Lithuanian litas against the euro stood relatively close to the corresponding ten-year historical averages (see Table 10). However, these indicators should be interpreted with caution, as during this period Lithuania was subject to a process of economic convergence, which complicates any historical assessment of real exchange rate developments.
As regards other external developments, the deficit in the combined current and capital account of the balance of payments widened progressively from 6.4% of GDP in 2004 to very high levels in excess of 10% of GDP in 2007 and 2008 (see Table 11). After a strong fall in domestic demand, leading to lower imports, the deficit decreased substantially, and the combined current and capital account registered a large surplus of 7.1% of GDP in 2009. This sudden adjustment in 2009 was driven predominantly by a sharp reduction in the goods deficit, an improvement in the income balance, which temporarily registered a small surplus, and an increase in the services surplus. The external surplus declined to 2.7% of GDP in 2010, while a total deficit of 1.2% was recorded in 2011 owing to the widening deficits in the goods and income balances. Subsequently the combined current and capital account balance registered a surplus of 2.0% of GDP in 2012 and 3.7% in 2013 on account of export-driven improvements in the goods and services trade balances. The shifts recorded in Lithuania’s balance of payments over the past decade have also been reflected in net capital flows in the financial account. In the period from 2005 to 2008 Lithuania received large net inflows of other investment (mostly comprising deposits and loans), peaking at 12.9% of GDP in 2007. Since 2009 these flows have partly reversed, resulting at times in large net outflows of other investment, amounting to 5.1% of GDP in 2012 and 1.9% in 2013. Lithuania’s portfolio investment balance registered net inflows of 2.8% of GDP in 2012 and net outflows of 4.1% in 2013. Against this background, gross external debt increased substantially from 42.1% of GDP in 2004 to 83.9% in 2009, but declined thereafter to 75.4% in 2012 and 67.1% in 2013. At the same time Lithuania’s
128ECBConvergence ReportJune 2014
net international investment position deteriorated from -34.4% of GDP in 2004 to -57.3% in 2009, but gradually improved to -52.8% in 2012 and -45.7% in 2013. Lithuania is a small open economy; the ratio of foreign trade in goods and services to GDP increased from 51.8% of GDP in 2004 to 86.9% in 2013 for exports and from 58.7% of GDP in 2004 to 85.7% in 2013 for imports. Over the same period Lithuania’s share in world exports increased from 0.10% to 0.17%.
With regard to measures of economic integration with the euro area, in 2013 exports of goods to the euro area constituted 38.0% of total goods exports, whereas the corresponding figure for imports was higher, at 40.1%. The share of euro area countries in Lithuania’s stock of inward direct investment stood at 40.9% in 2013, and their share in its stock of portfolio investment liabilities was 48.2% in 2012. The share of Lithuania’s stock of assets invested in the euro area amounted to 66.8% in 2013 in the case of direct investment and 76.9% for portfolio investment in 2012 (see Table 12).
With regard to the fulfilment of the commitments made by the Lithuanian authorities upon entry in ERM II in June 2004, the following observations can be made. Fiscal policies since entry in ERM II have not been prudent enough, as they failed to contribute sufficiently to containing the emergence of significant macroeconomic imbalances, and adequate fiscal buffers were not built up during good economic times. Since 2009, against the background of a notable deterioration in the general government budgetary position and a sharp output adjustment, comprehensive fiscal consolidation measures have been implemented and budgetary consolidation has progressed. In the boom period up to 2008, the tightened reserve and prudential requirements failed to effectively contain excessive borrowing. Following the contraction in economic activity in 2009, credit growth started to decline and turned negative, with the ratio of non-performing loans picking up strongly, before stabilising in 2010 and improving since 2011. Lietuvos bankas has introduced further measures to reduce the risk of renewed lending booms, including the “responsible lending guidelines”, which came into force in November 2011. Macro-prudential measures are under way to improve the resilience of the banking sector. As regards structural reforms, moderate wage growth and an increase in labour productivity improved competiveness during the adjustment. However, further measures to promote productivity and employment growth, as highlighted in Section 5.4.1, are needed to ensure that the gains in competitiveness achieved over the past few years are sustained.
5.4.4 LONG-TERM INTEREST RATE DEVELOPMENTS
Long-term interest rates in Lithuania were 3.6% on average over the reference period from May 2013 to April 2014 and were thus well below the 6.2% reference value for the interest rate convergence criterion (see Table 13).
Long-term interest rates followed a downward trend from 2004 until 2006 (see Chart 6a).10 At the beginning of 2006 this trend reversed and long-term interest rates increased. In 2008, the global financial and economic crisis, rising domestic imbalances, the downgrading of credit ratings and declining liquidity affected markets negatively, and long-term interest rates picked up rapidly. Subsequently, they reached a plateau of 14.5% in February 2009 and stayed at that level until December 2009, as no trading took place. Since then the economy has bounced back, and there has been some trading in the secondary markets as well as renewed activity in the primary markets. Long-term interest rates declined, to stand at just above 5% in 2010 before increasing to 5.8% at
10 The developments should be interpreted with caution as, until October 2007, long-term interest rate statistics in Lithuania were compiled using primary market data.
129ECB
Convergence ReportJune 2014
L ITHUANIA
the end of 2011, partly owing to global financial market turmoil. 11 Subsequently, long-term interest rates declined sharply until May 2013 as the economy continued to expand, albeit at a slower pace, fiscal balances improved, and inflation declined sharply. In addition, some credit ratings improved. At the same time global risk aversion declined, thus supporting the decline in long-term interest rates. From May 2013 onwards and throughout the reference period, long-term interest rates were volatile in light of financial market uncertainty related to the possible reduction in asset purchases by the Federal Reserve System. They stood at 3.3% at the end of the reference period.
The differential between Lithuania’s long-term interest rates and the euro area average was relatively low until 2008 (see Chart 6b). The main factors underlying the low stable level of the differential were the positive developments in the Lithuanian economy and Lithuania’s smooth entry into the ERM II mechanism, with the existing currency board arrangement remaining in place. However, a turning point came towards the end of 2008, when the differential started to rise sharply, reaching 10.0 percentage points in 2009, following the build-up of macroeconomic imbalances, declining appetite for risk among investors, the downgrading of credit ratings and decreasing liquidity. In 2010 and early 2011 the interest rate differential with the euro area average tightened strongly, down to 0.4 percentage point, as a result of the recovery in output and fiscal consolidation. Thereafter, the differential increased slightly as a result of a sharper decline in long-term interest rates for the euro area than for Lithuania and stood at 0.9 percentage point at the end of the reference period (and 1.6 percentage points with respect to the AAA euro area yield).
At the end of 2013 the Lithuanian capital market was much smaller than the euro area and still underdeveloped. Stock market capitalisation was 9.2% of GDP in 2013 and thus similar to other countries in the region (see Table 14). The corporate sector’s market-based indebtedness (0.4% of GDP in 2013) is very low in comparison with the euro area. Banks play a relatively large role in the economy of Lithuania, and foreign-owned banks play a major role in the banking market. The value of outstanding bank credit to the private sector as a percentage of GDP increased significantly until 2009, before declining to 45.1% in 2013. This is less than half that of the euro area. The majority of loans to the private sector are in foreign currencies, mostly in euro. The banking system is almost exclusively foreign-owned, with the majority of assets being managed by the Scandinavian banking groups. In addition, the international claims of euro area banks in the country accounted for 9.2% of total liabilities in 2013. The banking sector has withstood the termination of operations of several domestic market participants, with supervisory interventions preserving financial stability. Risks to the financial stability of the banking sector are mainly external and relate to foreign demand developments, euro area strains and the health of Scandinavian economies.
11 The assessment of long-term interest rates requires caution as the liquidity of the secondary market for domestic bonds during the reference period was low and the bonds’ maturities over some periods were much shorter than ten years. It is therefore possible that changes in benchmark bonds have significantly influenced long-term interest rates.


131ECB
Convergence ReportJune 2014
L ITHUANIA
LITHUANIA
1 PRICE DEVELOPMENTS Table 1 HICP inflation 132Chart 1 Price developments 132Table 2 Measures of inflation and related indicators 132Table 3 Recent inflation trends and forecasts 133
(a) Recent trends in the HICP 133(b) Inflation forecasts 133
2 FISCAL DEVELOPMENTS Table 4 General government fiscal position 134Table 5 General government budgetary position 134Chart 2 General government surplus (+)/deficit (-) 135
(a) Levels 135(b) Annual change and underlying factors 135
Table 6 General government gross debt – structural features 135Chart 3 General government gross debt 136
(a) Levels 136(b) Annual change and underlying factors 136
Chart 4 General government expenditure and revenue 136Table 7 General government deficit-debt adjustment 137Table 8 Projections of the ageing-induced fiscal burden 137
3 EXCHANGE RATE DEVELOPMENTS Table 9 (a) Exchange rate stability 138
(b) Key indicators of exchange rate pressure for the Lithuanian litas 138Chart 5 Lithuanian litas: nominal exchange rate development against the euro 138
(a) Deviation from ERM II central rate 138(a) Exchange rate over the last ten years 138
Table 10 Lithuanian litas: real exchange rate developments 139Table 11 External developments 139Table 12 Indicators of integration with the euro area 139
4 LONG-TERM INTEREST RATE DEVELOPMENTS Table 13 Long-term interest rates (LTIRs) 140Chart 6 Long-term interest rate (LTIR) 140
(a) Long-term interest rate (LTIR) 140(b) LTIR and HICP inflation differentials vis-à-vis the euro area 140
Table 14 Selected indicators of financial development and integration 140
LIST OF TABLES AND CHARTS

132ECBConvergence ReportJune 2014
1 PRICE DEVELOPMENTSTable 1 HICP inflation
(annual percentage changes)
2014 May 2013to Apr. 2014Jan. Feb. Mar. Apr.
HICP inflation 0.2 0.3 0.4 0.3 0.6Reference value 1) 1.7Euro area 2) 0.8 0.7 0.5 0.7 1.0
Source: European Commission (Eurostat).1) The basis of the calculation for the period May 2013-April 2014
is the unweighted arithmetic average of the annual percentage changes in the HICP for Latvia, Portugal and Ireland plus 1.5 percentage points.
2) The euro area is included for information only.
Chart 1 Price developments
(average annual percentage changes)
-15
-10
-5
0
5
10
15
-15
-10
-5
0
5
10
15
2012 20132004 2005 2006 2007 2008 2009 2010 2011
HICPunit labour costsimport deflator
Source: European Commission (Eurostat).
Table 2 Measures of inflation and related indicators
(annual percentage changes, unless otherwise stated)
2004 2005 2006 2007 2008 2009 2010 2011 2012 2013
Measures of inflationHICP 1.2 2.7 3.8 5.8 11.1 4.2 1.2 4.1 3.2 1.2HICP excluding unprocessed food and energy 0.7 1.3 2.4 5.2 9.3 3.7 0.0 2.4 2.4 1.4HICP at constant tax rates 1) 0.5 2.5 3.8 5.5 10.1 0.2 -0.3 4.2 3.0 1.2CPI 1.2 2.7 3.7 5.7 10.9 4.5 1.3 4.1 3.1 1.0Private consumption deflator -0.2 2.3 4.7 5.9 10.9 4.5 1.3 4.1 3.1 1.0GDP deflator 2.5 6.6 6.6 8.6 9.6 -3.4 2.3 5.4 2.6 1.7Producer prices 2) 2.5 5.9 6.9 9.4 15.9 -6.6 4.0 10.4 5.6 -0.4Related indicatorsReal GDP growth 7.4 7.8 7.8 9.8 2.9 -14.8 1.6 6.0 3.7 3.3GDP per capita in PPS 3) (euro area = 100) 47.4 50.2 53.1 57.1 59.4 53.5 57.1 62.1 66.2 .Comparative price levels (euro area = 100) 51.9 53.7 56.3 59.3 63.9 63.3 61.6 62.5 62.6 .Output gap 4) 2.5 4.4 6.2 9.1 6.8 -9.7 -8.2 -3.5 -1.3 -0.7Unemployment rate (%) 5) 11.6 8.5 5.8 4.3 5.8 13.8 17.8 15.4 13.4 11.8Unit labour costs, whole economy 3.3 6.0 10.2 6.6 10.4 -1.5 -7.0 0.7 1.9 3.8Compensation per employee, whole economy 10.9 11.5 16.7 13.9 14.3 -9.9 7.2 6.3 3.8 5.9Labour productivity, whole economy 7.4 5.2 5.9 6.8 3.6 -8.6 15.3 5.5 1.9 2.0Imports of goods and services deflator -0.9 7.5 8.3 4.9 8.9 -10.4 9.7 12.8 4.2 -1.5Nominal effective exchange rate 6) 1.3 -1.4 -0.4 0.5 0.3 2.7 -2.9 0.0 -1.6 1.1Money supply (M3) 7) - 30.4 22.8 22.3 -0.3 0.4 8.4 14.8 7.7 4.8Lending from banks 8) - 63.6 41.4 43.5 18.1 -8.5 -6.5 -1.1 2.3 -0.9Stock prices (OMX Vilnius Index) 65.9 55.1 9.8 4.4 -65.1 46.0 56.5 -27.1 18.8 18.7Residential property prices 14.8 52.2 41.1 35.7 11.4 -31.2 -12.5 1.3 -3.3 3.6
Sources: European Commission (Eurostat), national data (CPI, money supply, lending from banks and residential property prices) and European Commission (output gap).1) The difference between the “HICP” and the “HICP at constant tax rates” shows the theoretical impact of changes in indirect taxes
(e.g. VAT and excise duties) on the overall rate of inflation. This impact assumes a full and instantaneous pass-through of tax rate changes on the price paid by the consumer.
2) Domestic sales, total industry excluding construction.3) PPS stands for purchasing power standards.4) Percentage difference of potential GDP: a positive (negative) sign indicates that actual GDP is above (below) potential GDP.5) The definition conforms to ILO guidelines.6) A positive (negative) sign indicates an appreciation (depreciation).7) The series includes repurchase agreements with central counterparties.8) Not adjusted for the derecognition of loans from the MFI statistical balance sheet due to their sale or securitisation.
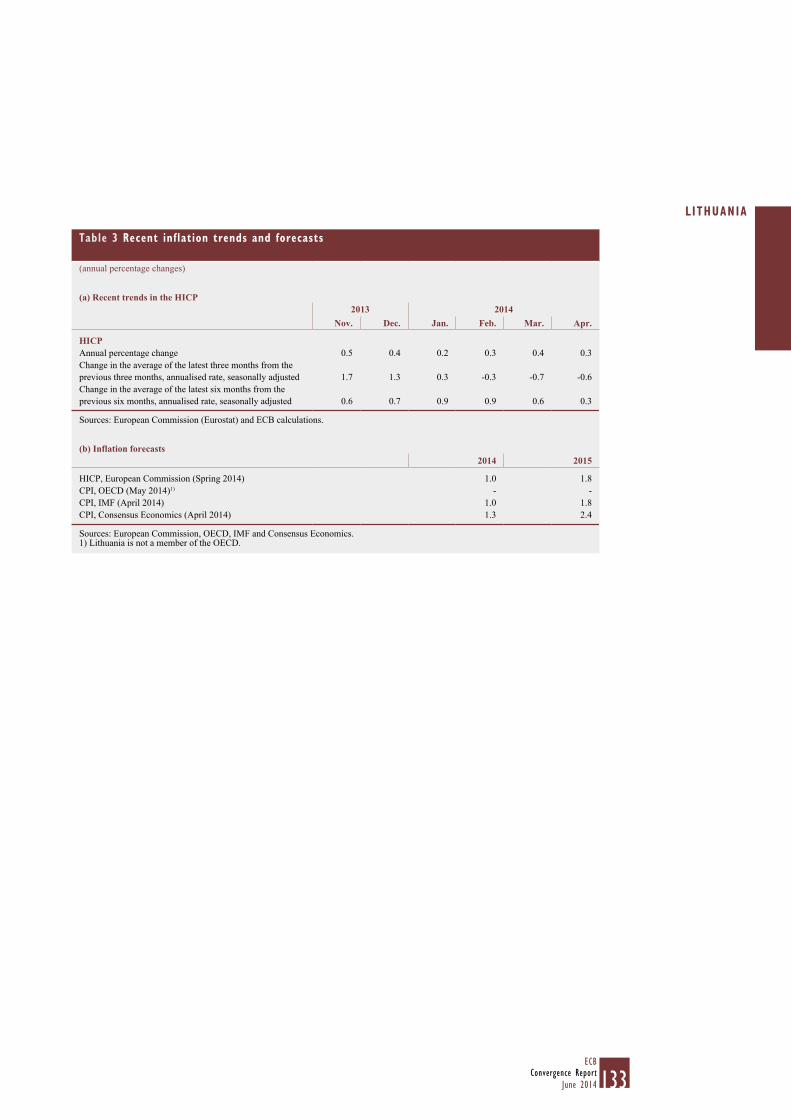
133ECB
Convergence ReportJune 2014
L ITHUANIA
Table 3 Recent inflation trends and forecasts
(annual percentage changes)
(a) Recent trends in the HICP2013 2014
Nov. Dec. Jan. Feb. Mar. Apr.
HICPAnnual percentage change 0.5 0.4 0.2 0.3 0.4 0.3Change in the average of the latest three months from theprevious three months, annualised rate, seasonally adjusted 1.7 1.3 0.3 -0.3 -0.7 -0.6Change in the average of the latest six months from theprevious six months, annualised rate, seasonally adjusted 0.6 0.7 0.9 0.9 0.6 0.3
Sources: European Commission (Eurostat) and ECB calculations.
(b) Inflation forecasts2014 2015
HICP, European Commission (Spring 2014) 1.0 1.8CPI, OECD (May 2014)1) - -CPI, IMF (April 2014) 1.0 1.8CPI, Consensus Economics (April 2014) 1.3 2.4
Sources: European Commission, OECD, IMF and Consensus Economics.1) Lithuania is not a member of the OECD.
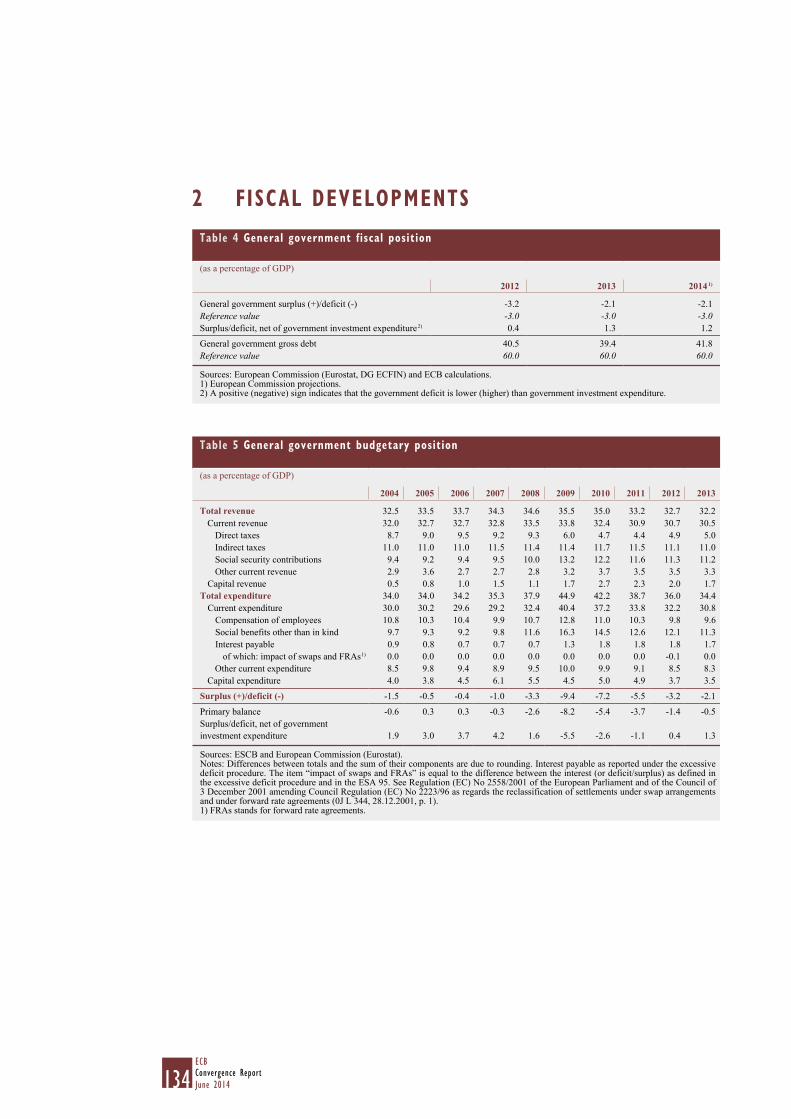
134ECBConvergence ReportJune 2014
2 FISCAL DEVELOPMENTSTable 4 General government fiscal position
(as a percentage of GDP)
2012 2013 2014 1)
General government surplus (+)/deficit (-) -3.2 -2.1 -2.1Reference value -3.0 -3.0 -3.0Surplus/deficit, net of government investment expenditure 2) 0.4 1.3 1.2
General government gross debt 40.5 39.4 41.8Reference value 60.0 60.0 60.0
Sources: European Commission (Eurostat, DG ECFIN) and ECB calculations.1) European Commission projections.2) A positive (negative) sign indicates that the government deficit is lower (higher) than government investment expenditure.
Table 5 General government budgetary position
(as a percentage of GDP)
2004 2005 2006 2007 2008 2009 2010 2011 2012 2013
Total revenue 32.5 33.5 33.7 34.3 34.6 35.5 35.0 33.2 32.7 32.2Current revenue 32.0 32.7 32.7 32.8 33.5 33.8 32.4 30.9 30.7 30.5
Direct taxes 8.7 9.0 9.5 9.2 9.3 6.0 4.7 4.4 4.9 5.0Indirect taxes 11.0 11.0 11.0 11.5 11.4 11.4 11.7 11.5 11.1 11.0Social security contributions 9.4 9.2 9.4 9.5 10.0 13.2 12.2 11.6 11.3 11.2Other current revenue 2.9 3.6 2.7 2.7 2.8 3.2 3.7 3.5 3.5 3.3
Capital revenue 0.5 0.8 1.0 1.5 1.1 1.7 2.7 2.3 2.0 1.7Total expenditure 34.0 34.0 34.2 35.3 37.9 44.9 42.2 38.7 36.0 34.4
Current expenditure 30.0 30.2 29.6 29.2 32.4 40.4 37.2 33.8 32.2 30.8Compensation of employees 10.8 10.3 10.4 9.9 10.7 12.8 11.0 10.3 9.8 9.6Social benefits other than in kind 9.7 9.3 9.2 9.8 11.6 16.3 14.5 12.6 12.1 11.3Interest payable 0.9 0.8 0.7 0.7 0.7 1.3 1.8 1.8 1.8 1.7
of which: impact of swaps and FRAs 1) 0.0 0.0 0.0 0.0 0.0 0.0 0.0 0.0 -0.1 0.0Other current expenditure 8.5 9.8 9.4 8.9 9.5 10.0 9.9 9.1 8.5 8.3
Capital expenditure 4.0 3.8 4.5 6.1 5.5 4.5 5.0 4.9 3.7 3.5
Surplus (+)/deficit (-) -1.5 -0.5 -0.4 -1.0 -3.3 -9.4 -7.2 -5.5 -3.2 -2.1
Primary balance -0.6 0.3 0.3 -0.3 -2.6 -8.2 -5.4 -3.7 -1.4 -0.5Surplus/deficit, net of government investment expenditure 1.9 3.0 3.7 4.2 1.6 -5.5 -2.6 -1.1 0.4 1.3
Sources: ESCB and European Commission (Eurostat).Notes: Differences between totals and the sum of their components are due to rounding. Interest payable as reported under the excessive deficit procedure. The item “impact of swaps and FRAs” is equal to the difference between the interest (or deficit/surplus) as defined in the excessive deficit procedure and in the ESA 95. See Regulation (EC) No 2558/2001 of the European Parliament and of the Council of 3 December 2001 amending Council Regulation (EC) No 2223/96 as regards the reclassification of settlements under swap arrangements and under forward rate agreements (0J L 344, 28.12.2001, p. 1).1) FRAs stands for forward rate agreements.
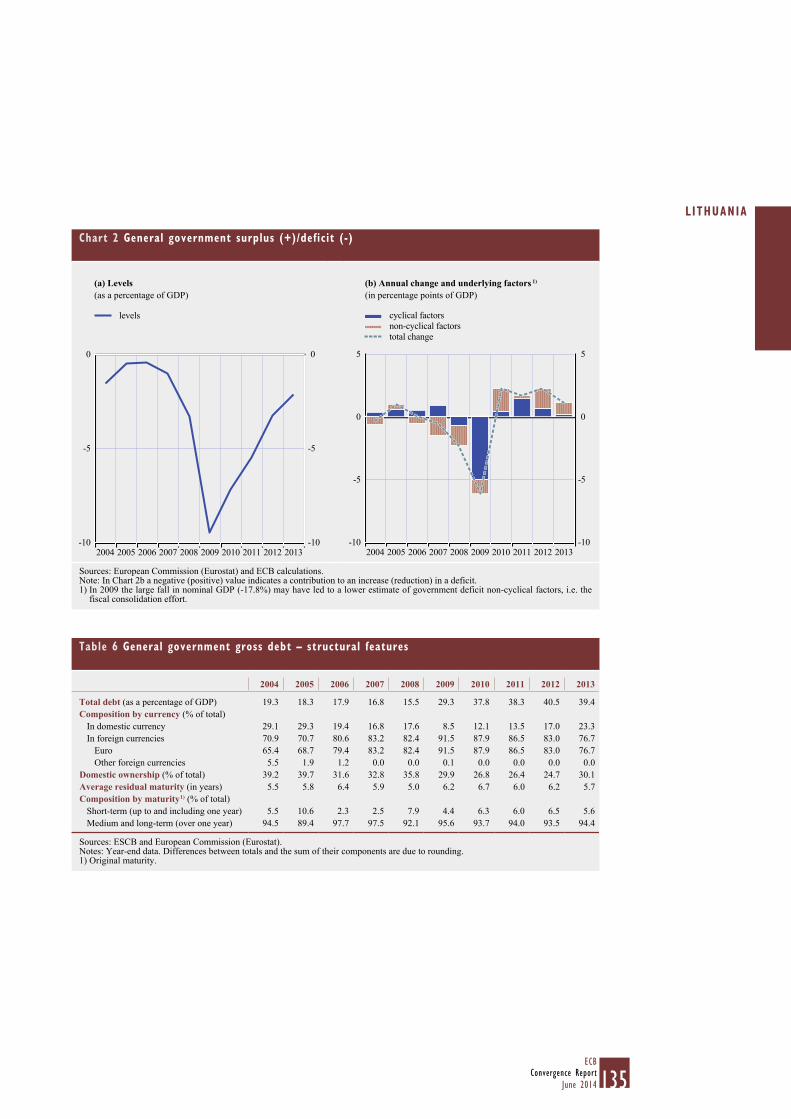
135ECB
Convergence ReportJune 2014
L ITHUANIA
Chart 2 General government surplus (+)/deficit (-)
(a) Levels(as a percentage of GDP)
(b) Annual change and underlying factors 1)
(in percentage points of GDP)
-10
-5
0
-10
-5
0
levels
20122004 2005 2007 2009 2011 20132006 2008 2010-10
-5
0
5
-10
-5
0
5
20122004 2006 20082005 2007 2009 2010 2011 2013
cyclical factorsnon-cyclical factorstotal change
Sources: European Commission (Eurostat) and ECB calculations.Note: In Chart 2b a negative (positive) value indicates a contribution to an increase (reduction) in a deficit.1) In 2009 the large fall in nominal GDP (-17.8%) may have led to a lower estimate of government deficit non-cyclical factors, i.e. the
fiscal consolidation effort.
Table 6 General government gross debt – structural features
2004 2005 2006 2007 2008 2009 2010 2011 2012 2013
Total debt (as a percentage of GDP) 19.3 18.3 17.9 16.8 15.5 29.3 37.8 38.3 40.5 39.4Composition by currency (% of total)
In domestic currency 29.1 29.3 19.4 16.8 17.6 8.5 12.1 13.5 17.0 23.3In foreign currencies 70.9 70.7 80.6 83.2 82.4 91.5 87.9 86.5 83.0 76.7
Euro 65.4 68.7 79.4 83.2 82.4 91.5 87.9 86.5 83.0 76.7Other foreign currencies 5.5 1.9 1.2 0.0 0.0 0.1 0.0 0.0 0.0 0.0
Domestic ownership (% of total) 39.2 39.7 31.6 32.8 35.8 29.9 26.8 26.4 24.7 30.1Average residual maturity (in years) 5.5 5.8 6.4 5.9 5.0 6.2 6.7 6.0 6.2 5.7Composition by maturity 1) (% of total)
Short-term (up to and including one year) 5.5 10.6 2.3 2.5 7.9 4.4 6.3 6.0 6.5 5.6Medium and long-term (over one year) 94.5 89.4 97.7 97.5 92.1 95.6 93.7 94.0 93.5 94.4
Sources: ESCB and European Commission (Eurostat).Notes: Year-end data. Differences between totals and the sum of their components are due to rounding.1) Original maturity.
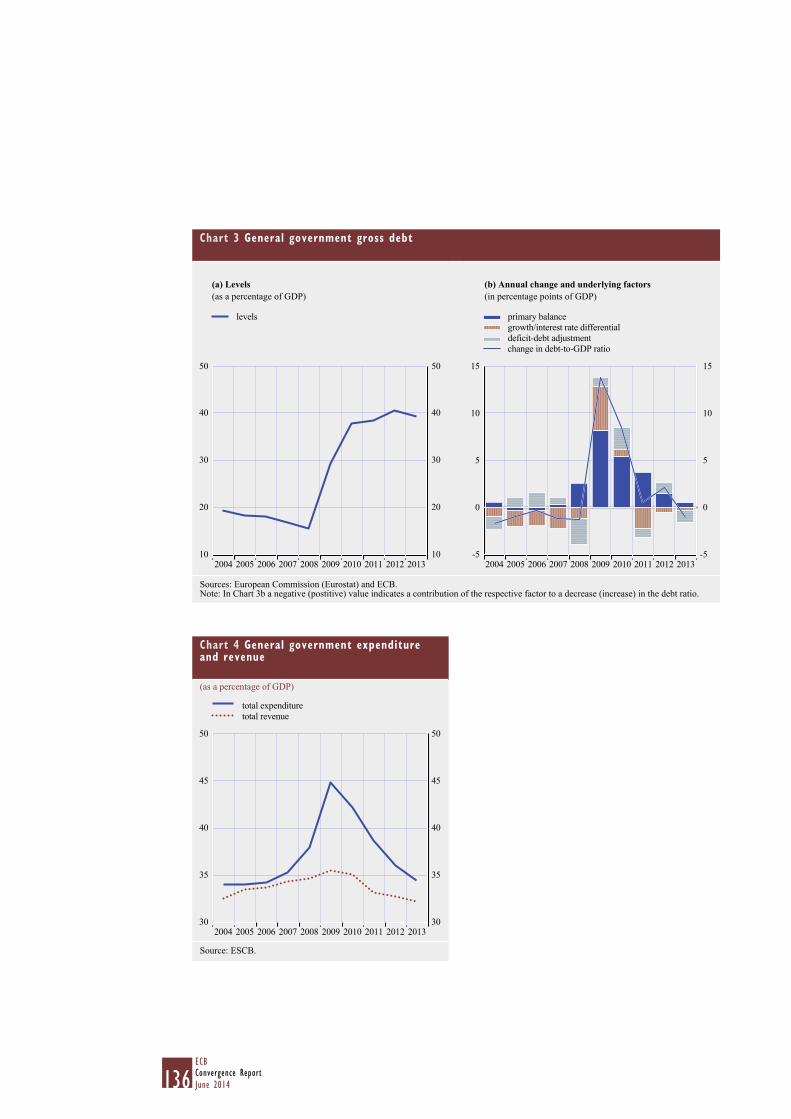
136ECBConvergence ReportJune 2014
Chart 3 General government gross debt
(a) Levels(as a percentage of GDP)
(b) Annual change and underlying factors(in percentage points of GDP)
10
20
30
40
50
10
20
30
40
50
2004 2005 2006 2007 2008 2009 2010 2011 2012 2013
levels
-5
0
5
10
15
-5
0
5
10
15
20122004 2005 2007 2009 2011 20132006 2008 2010
primary balancegrowth/interest rate differentialdeficit-debt adjustmentchange in debt-to-GDP ratio
Sources: European Commission (Eurostat) and ECB.Note: In Chart 3b a negative (postitive) value indicates a contribution of the respective factor to a decrease (increase) in the debt ratio.
Chart 4 General government expenditure and revenue
(as a percentage of GDP)
30
35
40
45
50
30
35
40
45
50
total expendituretotal revenue
2012 20132004 2005 2006 2007 2008 2009 2010 2011
Source: ESCB.

137ECB
Convergence ReportJune 2014
L ITHUANIA
Table 7 General government deficit-debt adjustment
(as a percentage of GDP)
2004 2005 2006 2007 2008 2009 2010 2011 2012 2013
Change in general government debt 1) 0.2 1.5 2.0 1.8 0.6 10.4 9.6 4.5 4.5 0.9General government surplus (+)/deficit (-) -1.5 -0.5 -0.4 -1.0 -3.3 -9.4 -7.2 -5.5 -3.2 -2.1
Deficit-debt adjustment -1.3 1.0 1.6 0.8 -2.7 1.0 2.4 -0.9 1.2 -1.3
Net acquisitions (+)/net sales (-) of financial assets -1.1 0.6 0.5 0.9 -2.0 2.0 2.3 -0.6 1.2 -0.9Currency and deposits -0.5 0.5 3.0 -0.1 -2.3 2.8 1.4 -3.3 2.5 -1.6Loans and securities other than shares -0.3 -0.2 -0.2 0.0 -0.1 -0.1 -0.2 2.2 -0.6 0.4Shares and other equity -0.6 -0.3 -2.7 -0.1 0.0 -0.8 -0.2 0.0 -0.2 0.0
Privatisations -0.6 -0.3 -2.7 -0.1 0.0 -0.8 -0.2 0.0 -0.2 0.0Equity injections 0.0 0.0 0.0 0.0 0.0 0.0 0.0 0.0 0.0 0.0Other 0.0 -0.1 0.0 0.0 0.0 0.0 0.0 0.0 0.0 0.0
Other financial assets 0.4 0.6 0.4 1.1 0.3 0.2 1.4 0.5 -0.6 0.4Valuation changes of general government debt 0.0 0.0 -0.4 0.0 0.1 0.0 0.1 -0.1 -0.2 -0.2
Foreign exchange holding gains (-)/losses (+) -0.1 0.1 0.0 0.0 0.0 0.0 0.1 0.0 0.0 0.0Other valuation effects 2) 0.0 -0.1 -0.4 0.0 0.1 0.0 0.0 -0.1 -0.2 -0.2
Other 3) -0.2 0.5 1.4 -0.1 -0.7 -0.9 0.0 -0.2 0.2 -0.2
Sources: ESCB and European Commission (Eurostat).Note: Differences between totals and the sum of their components are due to rounding.1) Annual change in debt in period t as a percentage of GDP in period t, i.e. [debt(t) - debt(t-1)]/GDP(t).2) Includes the difference between the nominal and market valuation of general government debt.3) Transactions in other accounts payable (government liabilities), sector reclassifications and statistical discrepancies. This item may alsocover certain cases of debt assumption and settlements under swaps and forward rate agreements.
Table 8 Projections of the ageing-induced fiscal burden
(percentages)
2010 2020 2030 2040 2050 2060
Elderly dependency ratio (population aged 65 and over as a proportion of the population aged 15-64) 25.6 31.8 47.3 55.7 51.9 46.2Age-related government expenditure (in percentage points of GDP) 1) 19.2 18.3 19.9 21.6 23.9 26.6
Sources: European Commission (Eurostat) and The 2012 Ageing Report: Economic and budgetary projections for the 27 EU Member States (2010-2060), a joint report prepared by the European Commission (DG ECFIN) and the Economic Policy Committee.1) The Ageing Working Group (AWG) risk scenario, strictly age-related item.
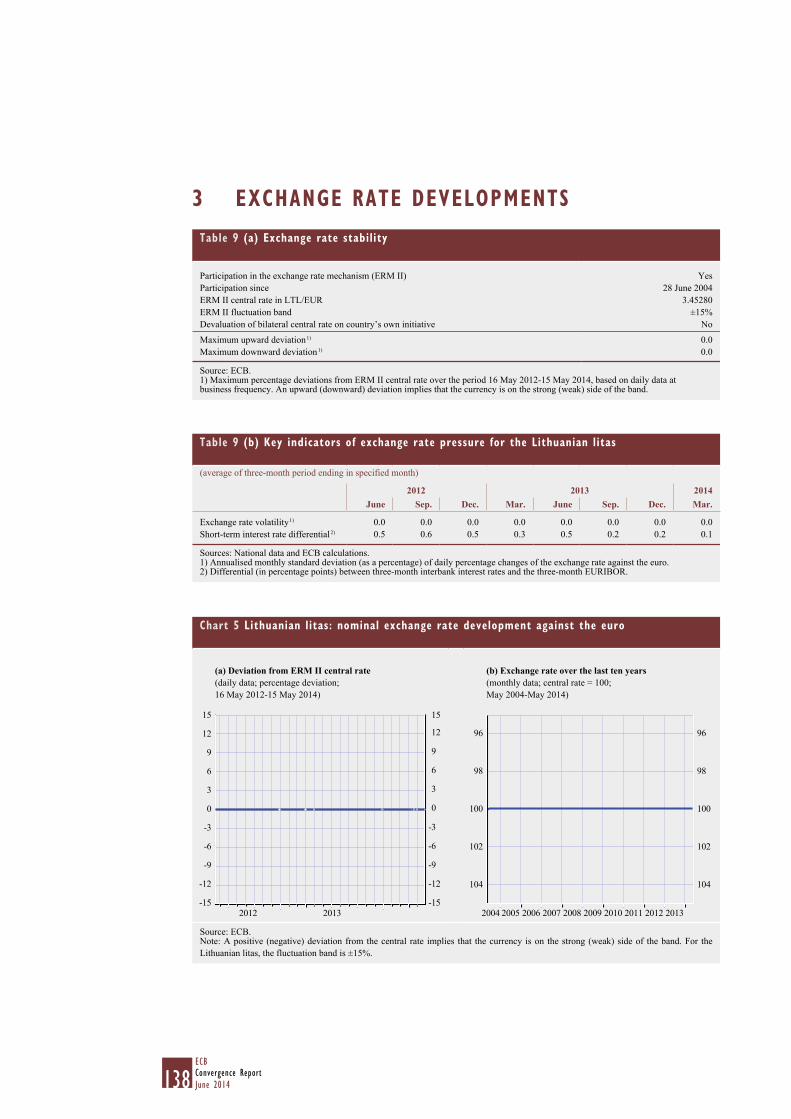
138ECBConvergence ReportJune 2014
3 EXCHANGE RATE DEVELOPMENTSTable 9 (a) Exchange rate stability
Participation in the exchange rate mechanism (ERM II) YesParticipation since 28 June 2004ERM II central rate in LTL/EUR 3.45280ERM II fluctuation band ±15%Devaluation of bilateral central rate on country’s own initiative No
Maximum upward deviation 1) 0.0Maximum downward deviation 1) 0.0
Source: ECB.1) Maximum percentage deviations from ERM II central rate over the period 16 May 2012-15 May 2014, based on daily data atbusiness frequency. An upward (downward) deviation implies that the currency is on the strong (weak) side of the band.
Chart 5 Lithuanian litas: nominal exchange rate development against the euro
(a) Deviation from ERM II central rate(daily data; percentage deviation; 16 May 2012-15 May 2014)
(b) Exchange rate over the last ten years(monthly data; central rate = 100; May 2004-May 2014)
-15
-12
-9
-6
-3
0
3
6
9
12
15
-15
-12
-9
-6
-3
0
3
6
9
12
15
2012 2013
104
102
100
98
96 96
104
102
100
98
2012 20132004 2005 2006 2007 2008 2009 2010 2011
Source: ECB.Note: A positive (negative) deviation from the central rate implies that the currency is on the strong (weak) side of the band. For the Lithuanian litas, the fluctuation band is ±15%.
Table 9 (b) Key indicators of exchange rate pressure for the Lithuanian litas
(average of three-month period ending in specified month)
2012 2013 2014June Sep. Dec. Mar. June Sep. Dec. Mar.
Exchange rate volatility 1) 0.0 0.0 0.0 0.0 0.0 0.0 0.0 0.0Short-term interest rate differential 2) 0.5 0.6 0.5 0.3 0.5 0.2 0.2 0.1
Sources: National data and ECB calculations.1) Annualised monthly standard deviation (as a percentage) of daily percentage changes of the exchange rate against the euro.2) Differential (in percentage points) between three-month interbank interest rates and the three-month EURIBOR.

139ECB
Convergence ReportJune 2014
L ITHUANIA
Table 10 Lithuanian litas: real exchange rate developments
(monthly data; percentage deviation in April 2014 from the ten-year average calculated for the period May 2004-April 2014)
Apr. 2014
Real bilateral exchange rate against the euro1) 6.5Memo items:
Nominal effective exchange rate 2) 0.4Real effective exchange rate 1), 2) 5.9
Source: ECB.Note: A positive (negative) sign indicates an appreciation (depreciation).1) Based on HICP and CPI developments.2) Effective exchange rate against the euro, the currencies of the non-euro area EU Member States and those of ten other major trading
partners.
Table 11 External developments
(as a percentage of GDP, unless otherwise stated)
2004 2005 2006 2007 2008 2009 2010 2011 2012 2013
Balance of paymentsCurrent account and capital account balance 1) -6.4 -5.8 -9.4 -12.7 -11.1 7.1 2.7 -1.2 2.0 3.7
Current account balance -7.6 -7.1 -10.6 -14.4 -12.9 3.7 0.1 -3.7 -0.2 1.5Goods balance -10.5 -11.2 -13.8 -14.9 -13.0 -3.3 -4.8 -5.8 -2.8 -3.5Services balance 3.6 4.0 3.6 1.6 1.3 1.6 2.9 3.2 3.7 4.6Income balance -2.7 -2.4 -2.7 -4.1 -3.4 1.1 -2.8 -4.6 -4.1 -3.9Current transfers balance 2.0 2.5 2.4 2.9 2.2 4.4 4.8 3.5 3.0 4.2
Capital account balance 1.2 1.3 1.2 1.7 1.8 3.4 2.7 2.5 2.2 2.2Combined direct and portfolio investment balance 1) 3.2 1.6 4.2 2.9 2.9 2.7 8.0 7.2 3.5 -3.1
Direct investment balance 2.3 2.6 5.0 3.6 3.4 -0.6 2.2 3.2 0.7 0.9Portfolio investment balance 0.9 -1.0 -0.8 -0.7 -0.5 3.3 5.8 3.9 2.8 -4.1
Other investment balance 1.8 7.0 11.0 12.9 5.8 -10.3 -9.2 -1.5 -5.1 -1.9Reserve assets 0.5 -2.6 -4.9 -3.0 2.4 0.3 -1.3 -4.4 -0.4 1.3Exports of goods and services 51.8 57.2 58.7 53.7 59.6 54.1 67.6 77.2 83.9 86.9Imports of goods and services 58.7 64.4 68.9 67.0 71.3 55.8 69.5 79.8 82.9 85.7Net international investment position 2) -34.4 -42.6 -48.9 -55.8 -51.6 -57.3 -55.2 -52.3 -52.8 -45.7Gross external debt 2) 42.1 50.5 59.9 71.5 71.0 83.9 82.9 77.4 75.4 67.1Memo item:Export market shares 3) 0.10 0.12 0.12 0.12 0.14 0.13 0.13 0.15 0.16 0.17
Source: ECB.1) Differences between totals and the sum of their components are due to rounding.2) End-of-period outstanding amounts.3) As a percentage of total world goods and services exports.
Table 12 Indicators of integration with the euro area
(as a percentage of the total, unless otherwise stated)
2004 2005 2006 2007 2008 2009 2010 2011 2012 2013
External trade with the euro areaExports of goods 45.9 44.8 42.8 44.2 40.4 43.8 40.3 43.2 41.3 38.0Imports of goods 44.0 40.0 41.9 45.7 38.0 39.3 38.5 38.8 38.2 40.1Investment position with the euro areaInward direct investment 1) 40.5 35.5 34.3 36.1 50.1 46.4 44.9 37.7 40.2 40.9Outward direct investment 1) 70.8 54.0 42.5 46.4 46.5 50.0 57.3 59.1 65.0 66.8Portfolio investment liabilities 1) 91.2 99.7 88.4 86.6 77.1 71.8 53.8 54.8 48.2 .Portfolio investment assets 1) 62.2 47.5 65.1 63.7 60.1 73.7 75.2 73.7 76.9 .
Memo items: External trade with the EU
Exports of goods 67.3 65.7 63.7 64.8 60.4 64.4 61.0 61.4 60.5 57.4Imports of goods 63.5 59.5 62.8 68.4 57.6 59.1 56.6 56.8 57.7 59.3
Sources: ESCB, European Commission (Eurostat) and IMF.1) End-of-period outstanding amounts.

140ECBConvergence ReportJune 2014
4 LONG-TERM INTEREST RATE DEVELOPMENTSTable 13 Long-term interest rates (LTIRs)
(percentages; average of observations through period)
2014 May 2013 to Apr. 2014Jan. Feb. Mar. Apr.
Long-term interest rate 3.4 3.3 3.3 3.3 3.6Reference value 1) - - - - 6.2Euro area 2) 2.8 2.6 2.5 2.4 2.9Euro area (AAA) 3) 2.0 1.8 1.8 1.7 1.9
Sources: ECB and European Commission (Eurostat).1) The basis of the calculation for the period May 2013-April 2014 is the unweighted arithmetic average of the interest rate levels in
Ireland, Latvia and Portugal plus 2 percentage points.2) The euro area average is included for information only.3) The euro area AAA par yield curve for the ten-year residual maturity is included for information only.
Chart 6 Long-term interest rate (LTIR)
(a) Long-term interest rate (LTIR)(monthly averages in percentages)
(b) LTIR and HICP inflation differentials vis-à-vis the euro area(monthly averages in percentage points)
2
4
6
8
10
12
14
16
2
4
6
8
10
12
14
16
2012 20132004 2005 2006 2007 2008 2009 2010 2011
long-term interest rate
-5
0
5
10
15
-5
0
5
10
15
long-term interest rate differentialHICP inflation differential
2012 20132004 2005 2006 2007 2008 2009 2010 2011
Sources: ECB and European Commission (Eurostat).
Table 14 Selected indicators of financial development and integration
(as a percentage of GDP, unless otherwise stated)
2004 2005 2006 2007 2008 2009 2010 2011 2012 2013 Memo item: euro area
2013
Debt securities issued by corporations1) 1.4 2.0 2.4 3.6 3.9 4.1 2.2 1.5 1.1 0.4 95.3Stock market capitalisation2) 26.1 33.1 32.1 24.0 8.0 12.1 15.2 9.9 9.7 9.2 58.1MFI credit to non-government residents3) 28.1 40.4 49.4 59.4 62.2 69.2 62.3 52.1 49.3 45.1 125.0Claims of euro area MFIs on resident MFIs4) 14.3 15.4 15.1 12.3 14.2 13.6 9.4 12.9 10.6 9.2 7.0Private sector credit flow5) 8.9 14.5 18.7 23.1 10.7 -9.6 -5.4 -0.7 -0.3 . -0.4Private sector debt6) 40.4 50.2 62.3 75.5 77.9 84.9 75.9 66.2 62.5 . 164.5Financial sector liabilities7) 25.1 48.9 32.5 34.3 3.7 -3.7 0.0 8.9 -0.3 . -2.5
Sources: ESCB, European Commission (Eurostat), Federation of European Securities Exchanges, OMX and national stock exchanges.1) Outstanding amount of debt securities issued by resident non-financial corporations, MFIs and other financial corporations.2) Outstanding amounts of quoted shares issued by residents at the end of the period at market values.3) MFI (excluding NCB) credit to domestic non-MFI residents other than the general government. Credit includes outstanding amounts of
loans and debt securities.4) Outstanding amount of deposits and debt securities issued by domestic MFIs (excluding the NCB) held by euro area MFIs as a percentage
of total liabilities of domestic MFIs (excluding the NCB). Total liabilities exclude capital and reserves and remaining liabilities.5) Transactions in securities other than shares issued and loans taken out by institutional sectors: non-financial corporations, households
and non-profit institutions serving households.6) Outstanding amounts of securities other than shares issued and loans taken out by institutional sectors: non-financial corporations,
households and non-profit institutions serving households.7) Sum of all liabilities of the total financial sector. The indicator is expressed as a year-on-year percentage change.
141ECB
Convergence ReportJune 2014
HUNGARY
5.5 HUNGARY
5.5.1 PRICE DEVELOPMENTS
Over the reference period from May 2013 to April 2014, the 12-month average rate of HICP inflation in Hungary was 1.0%, i.e. well below the reference value of 1.7% for the criterion on price stability (see Table 1). On the basis of the most recent information, the 12-month average rate of HICP inflation is expected to decline in the coming months.
Looking back over a longer period the annual rate of consumer price inflation in Hungary has hovered at around 5% over the past ten years (see Chart 1) with some exceptions. In 2005 annual HICP inflation reached 3.5%, but as a result of, among other things, hikes in administered prices and indirect taxes, it then accelerated to 7.9% in 2007, peaking at 9% in March that year. Thereafter, inflation started to recede gradually, but successive commodity price shocks and frequent changes in indirect taxes and administered prices meant that consumer price inflation in Hungary was relatively volatile during the period under review. The impact of these factors is also clearly evident from the latest developments, as annual HICP inflation accelerated from 3.9% in 2011 to 5.7% in 2012, before decelerating to 1.7% in 2013.
Inflation developments reflect a number of important policy choices, most notably the orientation of monetary policy during the period under review towards the achievement of price stability, as enshrined in the central bank law. The inflation targeting framework of monetary policy was already implemented in 2001, along with a full liberalisation of the capital account, whereas the Hungarian forint remained pegged to the euro as the anchor currency, with a fluctuation band of ±15%. In the years that followed the inflation target changed a number of times, but since 2007 it has been 3%. In February 2008 the Magyar Nemzeti Bank, in agreement with the Hungarian government, decided to abolish the fluctuation bands and to adopt a floating exchange rate regime. Fiscal policy was expansionary until mid-2006 and, therefore, did not lend support to the achievement of inflation targets during that period. With the implementation of successive fiscal consolidation packages from mid-2006, fiscal policy also contributed to short-term inflationary impulses through large increases in administered prices and indirect taxes. Administered prices constitute a large share of Hungary’s HICP basket of goods and services, which stands at 17% this year. More recently, the contained increase in compensation per employee in the public sector is likely to have contributed to disinflation, but the imposition of special taxes by the government on various sectors (e.g. banking, energy, retail and telecommunications) is likely to have limited its impact.
Up to 2006 Hungary experienced robust economic growth, which was followed by a sharp economic slowdown that culminated in a deep recession in 2009. Thereafter, the economy recovered slightly but then fell into recession again. At the beginning of the global financial crisis in late 2008, Hungary’s large external financing needs necessitated an EU-IMF financial assistance programme. However, owing to a change of government in April 2010, this programme started to go off track in June that year. In 2010 and 2011 Hungary experienced a weak recovery that was driven by external demand, as domestic demand remained subdued. In 2012 the economy contracted again, by 1.7%, before returning to growth of 1.1% in 2013. The recovery in 2013 was supported by a good harvest, a boost in export performance owing to the launch of new production lines in the manufacturing sector and a higher level of investment activity co-financed with EU structural funds. The substantial growth in compensation per employee up to 2008 pushed up unit labour costs, which then fell in 2009-10 as a result of the wage restraint associated with the economic slowdown. This moderation in unit labour cost growth proved to be temporary, as a pick-up in
142ECBConvergence ReportJune 2014
growth in compensation per employee in 2011 and negative labour productivity growth in 2012 pushed up unit labour costs. In 2013 unit labour cost growth accelerated further on the back of substantial growth in compensation per employee, reflecting wage increases in the public sector. Import prices have fluctuated considerably in recent years, largely reflecting changes in both the effective exchange rate of the forint and commodity prices. The general pattern of inflation developments is also apparent from other relevant indices, such as the HICP excluding unprocessed food and energy. The growth rate of residential house prices in Hungary has been negative since 2009, reflecting the tightening of credit conditions, waning interest from foreign buyers and a growing oversupply of residential housing, a significant proportion of which is owned by financial institutions.
Looking at recent developments, the annual rate of HICP inflation has subsided further in early 2014 to stand at -0.2% in April (see Table 3a). Besides the subdued domestic demand, low inflation reflects a slowdown in food price inflation on the back of a good harvest, low imported inflation and declining energy prices reflecting the cuts in administered prices in 2013-14. A period of rapid disinflation prompted the Magyar Nemzeti Bank to cut its key interest rate by a total of 325 basis points from January 2013. Real GDP growth was robust from the beginning of 2013, supported by a boost in the export performance and a gradual recovery in domestic demand.
The latest available forecasts from major international institutions project inflation to gradually rise in 2014 and 2015 and to range from 0.5% to 1.0% and from 2.8% to 3.0% respectively (see Table 3b). In 2014 the scheduled further cuts in administered prices are expected to have a one-off downward impact on consumer prices, although the depreciation of the forint and increase in domestic demand could restrict their impact on prices. The labour market situation is improving steadily, owing mainly to the public work scheme – a government-sponsored job creation initiative – and a growing number of temporary work migrants. The risks to the inflation outlook are broadly balanced. On the upside, there may be a stronger than expected rise in global commodity prices and renewed tensions in global financial markets, while domestic policy uncertainty may exert further depreciation pressure on the forint and thus drive up prices for imported goods and services. On the downside, the ongoing balance sheet adjustment by banks and households and the fiscal burden on the services sector are expected to weigh on the recovery of domestic demand. Overall, the relatively high level of volatility in consumer price inflation as a result of developments in global commodity prices and, in particular, domestic policy measures, could have an adverse impact on inflation expectations in Hungary. Looking further ahead, the catching-up process is likely to have a bearing on inflation and/or the nominal exchange rate over the coming years, given that GDP per capita and price levels are still lower in Hungary than in the euro area (see Table 2). However, it is difficult to assess the exact size of the effect resulting from this catching-up process.
Overall, although the 12-month average rate of HICP inflation in Hungary is well below thereferencevalue,thereareconcernsregardingthesustainabilityofinflationconvergence.
Achieving an environment that is conducive to sustainable convergence in Hungary requires, among other things, a stability-oriented monetary policy, including a stable institutional environment that maintains market confidence while fully respecting the independence of the central bank. With regard to macroeconomic imbalances, the European Commission selected Hungary for an in-depth review in its Alert Mechanism Report 2014 in order to further examine the risks involved in the persisting imbalances. It concluded that “Hungary continues to experience macroeconomic imbalances, which require monitoring and decisive policy action”. More specifically, progress in
143ECB
Convergence ReportJune 2014
HUNGARY
the areas below will help to achieve an environment that is conducive to sustainable price stability and promote competitiveness and employment growth.
In terms of product market reforms, a successful catching-up strategy should be restored through concerted action aimed at achieving a stable and business-friendly regulatory environment, enhanced functioning of the institutions and rules on competition and public procurement, and lower entry costs for service companies. This would also help to further enhance Hungary’s absorption capacity of EU funds. In addition, full implementation is required of the European Commission’s recommendations pertaining to the energy regulator, energy price liberalisation and financial sustainability of the state-owned enterprises in the transport sector.12 Moreover, government initiatives to lower prices for public utilities should not harm the financial health of the public utilities or their incentives for future investment.
With regard to the labour market, Hungary should stick to its recent reform path and take measures to raise its still relatively low employment rate. For example, it could reduce the high tax wedge on labour, in particular for low-income workers. While the government-sponsored job creation scheme is helping to mobilise the workforce, it should also prepare participants for a return to open labour market jobs, otherwise they could remain permanently locked in the scheme. Wage increases should reflect labour productivity growth, labour market conditions and developments in competitor countries.
Financial sector policies should be geared towards ensuring that the financial sector makes a sound contribution to economic growth, while at the same time preventing excessive credit growth in the future. In order to minimise the potential risks to financial stability associated with a high proportion of foreign currency loans, it is necessary for Hungary to fully apply the recommendation of the ESRB on lending in foreign currencies,13 with which it was considered to be largely compliant in the follow-up report published by the ESRB in November 2013. Close cooperation between home and host country supervisory authorities is important to ensure the effective implementation of these measures. Finally, financial stability could benefit from Hungary’s participation in the SSM, which will take up its prudential supervisory tasks in November 2014.
The government should actively seek to improve foreign investor sentiment by adopting international best practices on central bank independence and respecting the existing contracts between private parties when proposing and implementing government policies. Macro-prudential measures to reduce the underlying vulnerabilities related to lending in foreign currencies should be well targeted and should avoid placing an undue burden on banks’ lending capacity and on public finances. In this respect, there needs to be close monitoring of the effects on financial stability of the debt relief scheme for holders of foreign-currency mortgages, which was introduced in 2011 and early 2012, and the “Funding for Growth” scheme, which was implemented in 2013. If the government were to proceed with its plans to restructure the remaining foreign currency loans, the measures should seek to strike the best possible balance in order to preserve fiscal discipline, maintain financial stability, avoid giving rise to moral hazard, ensure the adequacy of the country’s international reserves and guarantee certainty in the implementation of private contracts.
12 See COM(2013) 367 final.13 Recommendation (ESRB/2011/1) of the European Systemic Risk Board of 21 September 2011 on lending in foreign currencies.
144ECBConvergence ReportJune 2014
5.5.2 FISCAL DEVELOPMENTS
Hungary is not currently subject to an EU Council decision on the existence of an excessive deficit. In the reference year 2013 the general government budget balance showed a deficit of 2.2% of GDP, i.e. below the 3% reference value. The general government gross debt-to-GDP ratio was 79.2%, i.e. above the 60% reference value (see Table 4). When compared with the previous year, the budget balance ratio deteriorated by 0.1 percentage point and the public debt ratio improved by 0.6 percentage point. In 2014 the deficit ratio is forecast by the European Commission to increase to 2.9% and the government debt ratio to 80.3%. With regard to other fiscal factors, the deficit ratio did not exceed the ratio of public investment to GDP in 2013, nor is it expected to in 2014.
Looking at developments in Hungary’s budgetary position over the period from 2004 to 2013, the deficit-to-GDP ratio generally remained well above the 3% of GDP reference value each year until 2011, when Hungary recorded a surplus thanks to one-off and temporary revenue measures (of about 10% of GDP). These were primarily related to the transfer of pension assets from private pension schemes to the state pillar. In 2012 the balance reverted to deficit, although this was kept below the reference value throughout 2013. Thus, in June 2013 the EU Council abrogated the excessive deficit procedure (EDP) which had been in place since Hungary joined the EU in 2004.
As shown in greater detail in Chart 2b, European Commission estimates indicate that cyclical factors made a limited contribution to the change in the deficit ratio, with the notable exception of 2009, when they induced a large deterioration. Instead, non-cyclical factors broadly determined the volatile pattern of the general governement balance. Over the period under consideration, the available evidence suggests that temporary and one-off factors made a very sizeable contribution to the improvement in the budget balance in 2011 (as explained above) and had a relatively large effect in 2010 and 2012 (mainly following the introduction of, and subsequent increases in, a special levy on financial institutions and other sector-specific levies). The remainder of the non-cyclical changes in the budget balance, as captured by changes in the structural balance, are explained by permanent effects. They seem to reflect a structural deterioration in Hungary’s fiscal position until 2006, an improvement over the period 2007-09 (mainly while subject to an EU-IMF financial assistance programme), followed by another deterioration until 2012, when the structural balance improved significantly.
Turning to developments in general government gross debt, the debt-to-GDP ratio increased cumulatively by 19.7 percentage points between 2004 and 2013 (see Chart 3a and Table 6). As shown in greater detail in Chart 3b, primary deficits were the major driving factor behind debt developments before 2007, while the deficit-debt adjustment contributed most in 2008 (see Section 5.9). Since 2009 the increase in the debt ratio has mostly been driven by the negative growth-interest rate differential. The one-off large primary surplus in 2011 was almost entirely offset by the deficit-debt adjustment, which occurred primarily on account of the depreciation of the forint towards the end of the year. After stabilising in 2011, the debt ratio declined between 2012 and 2013 owing mainly to the primary surplus.
As regards developments in Hungary’s general government debt structure, the share of government debt with a short-term maturity declined steadily from 17.7% in 2004 to a low of 8.7% in 2011, before increasing to a noticeable 14.3% in 2013 (see Table 6). Taking into account the level of the debt ratio, fiscal balances are relatively sensitive to changes in interest rates. The proportion
145ECB
Convergence ReportJune 2014
HUNGARY
of government debt denominated in foreign currency is high (42.1% at end-2013) and, given the overall debt level, fiscal balances are highly sensitive to changes in exchange rates. The Hungarian government has not incurred contingent liabilities resulting from government interventions to support financial institutions and financial markets during the crisis (see Section 5.9). The financial aid granted to some domestic credit institutions in 2009 – in the form of foreign exchange loans and acquisitions of shares – had already been repaid by the end of 2011. While no further support has been given to the financial sector in response to the crisis since 2009 (other than an injection of capital into the Hungarian Development Bank as of the fourth quarter of 2011), the current government incurred contingent liabilities in relation to the mortgage relief granted to households under successive agreements concluded with the Hungarian Banking Association over the period 2011-13.
Moving on to examine trends in other fiscal indicators, Chart 4 and Table 5 show that the general government total expenditure-to-GDP ratio increased from 49.1% in 2004 to 49.8% in 2013. This level remains high in comparison with other countries with a similar level of per capita income and even compared with some highly advanced economies. The pattern of the expenditure ratio has been volatile, broadly reflecting the consecutive periods of fiscal expansion and consolidation, in addition to the cyclical component. During the period between 2004 and 2013 compensation of employees recorded a significant decline as a share of GDP, while interest payments recorded a more limited decline. Other current expenditure, capital expenditure and social benefits other than in kind (the largest budgetary expenditure item) increased their share of GDP, though the latter recorded a gradual decline after peaking in 2009. In 2012 the government over-achieved its structural consolidation target, mostly through additional expenditure cuts. Government revenue in relation to GDP increased cumulatively by 5 percentage points to 47.6% of GDP between 2004 and 2013. After the tax restructuring reform implemented in consultation with the International Monetary Fund and the European Commission in the second half of 2009, a further reduction in direct taxation took place in 2011 following the introduction of a flat personal income tax rate (of 16%). After an initial round of measures in 2010, the government continued to rely heavily on distortive tax measures in 2012 and 2013, including substantial hikes in the tax burden on non-tradable sectors (financial intermediaries, large retail, telecommunications and public utilities). In the latter category, several tax measures that were initially intended to be temporary have been extended or made permanent, with the consequences for the business climate and potential output likely, ceteris paribus, to be negative.
Looking ahead, Hungary’s medium-term fiscal policy strategy, as presented in the 2014-17 update of the convergence programme (dated April 2014, i.e. before the installation of the new government), envisaged a deficit ratio of 2.9% in 2014, with a further decline to 2.8% in 2015, to 2.5% in 2016 and finally to 1.9% in 2017. This decline would be supported by cyclical factors. The structural balance is projected to deteriorate in 2014 and not show any significant improvement until 2017. According to the European Commission’s projections, there is a risk of non-compliance with the debt reduction benchmark in 2014 and 2015. Between 2014 and 2015 the structural deficit will fall below the medium-term objective of -1.7%, which is the least demanding objective among all EU Member States. The 2014 budget continues to rely heavily on revenue measures and provides for a higher expenditure ratio than the 2013 convergence programme, contrary to the latest Council recommendations. Targeting a deficit of 2.9% of GDP (higher than in the 2013 convergence programme), it also implies fiscal loosening in structural terms compared with 2013 and contains a very limited safety margin to the EDP reference value.
146ECBConvergence ReportJune 2014
With regard to the fiscal prospects for Hungary, which has a public debt ratio above 60% of GDP (79.2% of GDP in 2013), Chart 5 presents some calculations of potential future debt ratios using alternative assumptions for the fiscal balance. Assuming that Hungary achieves the overall fiscal position and public debt ratio projected by the European Commission for 2014, a balanced budget from 2015 onwards would reduce public debt to below 60% of GDP by 2021. However, if the primary balance ratio remains constant at its projected 2014 level of 0.9% of GDP, public debt would be reduced to below 60% of GDP only in 2031. At the same time, maintaining the overall deficit ratio at its projected 2014 level of 2.9% of GDP would result in a very slow decline in the debt ratio (it would still be as high as 74.1% in 2024). These calculations are based on the assumption of a constant nominal rate of interest of 4.2% beyond 2013.14 The nominal GDP growth rate is as projected by the European Commission in its winter 2014 forecast for 2014 and 2015, remaining constant at the 2015 level thereafter. Deficit-debt adjustments are not taken into account in this exercise. While these mechanical calculations are purely illustrative and can by no means be regarded as forecasts, the indication that maintaining the overall deficit ratio at the 2014 level would lead to a very slow decline in the debt ratio highlights the need for effective implementation of further consolidation measures.
Hungary signed the Treaty on Stability, Coordination and Governance in the Economic and Monetary Union (TSCG) on 2 March 2012 and ratified it in March 2013. In ratifying it, Hungary chose to apply (and include in its national legislation) the fiscal rules specified under Title III (“Fiscal Compact”) only upon adoption of the euro.
As regards fiscal governance, in the context of the transposition of the “six-pack” Directive on minimum requirements for national budgetary frameworks (Council Directive 2011/85/EU), a number of amendments to the fiscal framework legislation were approved at the end of 2013. Notably, these cover the availability of fiscal data and planning documents, numerical rules and the medium-term budgetary framework. According to the European Commission’s assessment, the newly introduced fiscal rules ensure that Hungarian fiscal policy is consistent with the requirement of the Stability and Growth Pact, though some existing design flaws – in particular the overly generous escape clauses from fulfilling the 3% threshold – have not been corrected. Legislation was also introduced to strengthen medium-term budgetary planning, which was long overdue. As regards the Fiscal Council, after the weakening of its independent status and supervisory capacity in 2010, some functional improvements have been carried out. Most notably, however, the EU Council recommendation to broaden the mandatory remit of the Fiscal Council has not yet been implemented. Full compliance with the provisions for an enhanced national governance framework under Council Directive 2011/85/EU should be ensured.
Turning to factors that will have an impact on Hungary’s public finances over the long term, a sharp ageing of the population is expected, as highlighted in Table 8. According to the 2012 projections by the European Commission and the EU’s Economic Policy Committee, starting from a level of 22.0% of GDP in 2010, Hungary is likely to experience a noticeable increase in strictly age-related public expenditure amounting to 4.9 percentage points of GDP in the years to 2060, slightly above the EU average of 4.8 percentage points of GDP.15 The de facto abolition of the mandatory private pension pillar as of 2011 and the resulting takeover of pension liabilities by the National Pension Insurance Fund was included in this estimate. The growth of public pension expenditure
14 This assumption reflects past trends in the cost of outstanding public debt.15 European Commission and Economic Policy Committee, “The 2012 Ageing Report: Economic and budgetary projections for the EU-27
Member States (2010-2060)”.
147ECB
Convergence ReportJune 2014
HUNGARY
will be mitigated to a certain degree by legislation adopted in 2012, which increases the statutory retirement age, tightens the conditions for early retirement, introduces CPI indexation of benefits and reforms the disability pension scheme.
In terms of fiscal challenges, Hungary must ensure a sustainable reduction of the budget deficit through a growth-friendly consolidation mix, thereby putting the debt ratio on a clear downward path. In this respect, the new Hungarian government should specify additional structural consolidation measures for the medium term. Despite recent improvements, Hungary still has to strengthen its institutional fiscal framework. In particular, the role of the Fiscal Council and its de facto independence has yet to be strengthened. The newly approved legislative changes to make the medium-term budgetary framework more binding should be enforced effectively. Moreover, Hungary should make every effort to fully comply with its obligations under the enhanced Stability and Growth Pact. Over the longer run, the risks to medium-term fiscal sustainability warrant structural fiscal reforms that focus on avoiding pro-cyclical fiscal policies as well as improving the sustainability of the pension system, tax administration, municipalities’ fiscal responsibility and the overall quality of economic governance.
5.5.3 EXCHANGE RATE DEVELOPMENTS
In the two-year reference period from 16 May 2012 to 15 May 2014, the Hungarian forint did not participate in ERM II, but traded under a flexible exchange rate regime (see Table 9a). Over the reference period the Hungarian currency mostly traded around its May 2012 average exchange rate against the euro, which is used as a benchmark for illustrative purposes in the absence of an ERM II central rate. On 15 May 2014 the exchange rate stood at 303.62 forints per euro, i.e. 3.4% weaker than its average level in May 2012 (see Table 9a). Over the reference period the maximum upward deviation from this benchmark was 6.3%, while the maximum downward deviation amounted to 7.1% (see Chart 6 and Table 9a).
The exchange rate of the Hungarian forint against the euro showed a high degree of volatility, as measured by annualised standard deviations in daily percentage changes. Between May 2012 and August 2012 the Hungarian forint appreciated gradually against the euro by around 6% on account of improving global financial market conditions, growing investor confidence in the region and high positive interest rate differentials vis-à-vis euro area assets. After a short period of relative exchange rate stability, the forint depreciated by about 10% vis-à-vis the euro in late 2012 and the first quarter of 2013 amid a worsening economic outlook and easing monetary policy, as well as concerns about government debt sustainability and the adequacy of foreign exchange reserves, which were also reflected in a rating downgrade in November 2012. Thereafter the forint recovered some of its losses, but came under renewed pressure during a period of increased volatility in mid-2013 against the background of investor uncertainty about the tapering-off of quantitative easing in the United States and depreciated in early 2014 before recovering again from the end of the first quarter onwards. Over the reference period short-term interest rate differentials against the three-month EURIBOR stood at high levels, although they were declining gradually amid interest rate cuts by the Magyar Nemzeti Bank in an environment of decreasing inflation differentials vis-à-vis the euro area (see Table 9b).
Between November 2008 and late 2010 an international financial assistance arrangement of €20 billion was in place, led by the EU and the IMF. On 16 October 2008 the Magyar Nemzeti Bank and the ECB jointly announced an agreement on repurchase transactions to support Hungary’s liquidity needs, which – as it helped to reduce financial vulnerabilities – might also have
148ECBConvergence ReportJune 2014
contributed to reducing exchange rate pressures over the reference period. Moreover, in November 2011 Hungary requested further precautionary financial assistance from the EU and the IMF, but negotiations were limited to one official round in July 2012, as Hungary did not request further assistance and redeemed before schedule all reimbursements of the 2008-10 standby arrangement with the IMF.
In a longer-term context, in April 2014 both the real effective exchange rate and the real bilateral exchange rate of the Hungarian forint against the euro stood below the corresponding ten-year historical averages (see Table 10). However, these indicators should be interpreted with caution, as during this period Hungary was subject to a process of economic convergence, which complicates any historical assessment of real exchange rate developments.
As regards other external developments, Hungary’s current and capital account has adjusted sharply in recent years. After reporting a large deficit of, on average, 7.0% of GDP between 2004 and 2008, the combined current and capital account of the balance of payments reversed to reach a surplus of 0.9% in 2009 and widened gradually thereafter to 3.5% in 2012 and 6.5% in 2013 (see Table 11). The improvement in the current account primarily reflected an increase in the goods and services balance, mainly owing to robust export growth and the sustained weakness in domestic demand. By contrast, the income deficit remained broadly unchanged at above 6% of GDP in 2012 and 2013. The large current and capital account deficit had been financed mainly by net inflows in direct and portfolio investment until 2006, and, at the later stage of the strong growth period, also by very large inflows of other investment, mainly in the form of bank loans. The sharp adjustment in Hungary’s balance of payments was associated with a significant contraction of these capital inflows, in particular in the other investment account which recorded a deficit of 12.7% of GDP in 2012 and 10.6% in 2013. At the same time Hungary recorded small surpluses on the balances on foreign direct and portfolio investment. Against this background, gross external debt, which had increased sharply from 71.1% of GDP in 2004 to 150.0% in 2011, decreased to 129.6% of GDP in 2012 and 118.7% of GDP in 2013. At the same time Hungary’s net international investment position, which had also deteriorated sharply from -85.4% of GDP in 2004 to a trough of -117.2% in 2009, improved to -103.2% of GDP in 2012 and -93.0% of GDP in 2013. However, the country’s net foreign liabilities are still very high. Fiscal and structural policies therefore continue to be important for supporting external sustainability and the competitiveness of the economy. Hungary is a small open economy; the ratio of foreign trade in goods and services to GDP increased from 64.7% of GDP in 2004 to 95.9% in 2013 for exports and from 67.9% in 2004 to 88.0% in 2013 for imports. Over the same period Hungary’s share in world exports declined from 0.58% to 0.54%.
Concerning measures of economic integration with the euro area, in 2013 exports of goods to the euro area constituted 56.0% of total goods exports, whereas the corresponding figure for imports amounted to 55.3%. The share of euro area countries in Hungary’s inward direct investment stood at 71.1% in 2013 and in its portfolio investment liabilities at 47.8% in 2012. The share of Hungary’s assets invested in the euro area amounted to 31.4% in the case of direct investment in 2013 and 64.2% for portfolio investment in 2012 (see Table 12).
5.5.4 LONG-TERM INTEREST RATE DEVELOPMENTS
Long-term interest rates in Hungary were 5.8% on average over the reference period from May 2013 to April 2014 and were thus below the 6.2% reference value for the interest rate convergence criterion (see Table 13).

149ECB
Convergence ReportJune 2014
HUNGARY
Following a decline from 2004 until September 2005, long-term interest rates increased during 2006 as a result of renewed inflation and fiscal concerns (see Chart 7a). Plans for fiscal consolidation and favourable sentiment in financial markets fostered some declines of long-term interest rates in 2007, but in 2008 they increased again, reflecting increasing global risk aversion and further downgrades of the long-term credit rating at the end of 2008. In November 2008 an international financial assistance arrangement was put in place, but went off track in June 2010. As tensions in international financial markets gradually eased and liquidity recovered, long-term interest rates declined in 2009, but remained volatile throughout 2010, particularly during the increase in sovereign debt market tensions. During the second half of 2011, in the context of international financial market uncertainty, concerns about the country’s fiscal situation and government policies that had eroded foreign investor confidence were reflected in rating downgrades, a weakening currency and steadily increasing long-term interest rates. At the end of 2011 Hungary requested further possible EU-IMF financial assistance. From 2012 until May 2013, long-term interest rates decreased substantially from 9.0% to 5.1%. An improvement in the fiscal balance, as well as a decrease in global risk aversion and strong demand from foreign investors in 2012, contributed to the decline in long-term interest rates. In addition, monetary policy rates were lowered for 21 consecutive months starting in August 2012, partly as a response to a sharp decline in inflation during the 2012 recession. In May 2013 the declining trend of long-term interest rates suddenly reversed in light of financial market uncertainty related to the possible reduction in asset purchases by the Federal Reserve System. Since then, long-term interest rates have been volatile. At the end of the reference period they stood at 5.8%, reflecting mainly domestic imbalances.
The long-term interest rate differential with the euro area average fluctuated, largely in line with long-term interest rate developments, between 2.0 and 4.5 percentage points between 2004 and September 2008 (see Chart 7b). The spread increased in late 2008 to reach a historical high of 7.8 percentage points in March 2009, indicating increased risk aversion and concerns about domestic economic imbalances. The interest rate differential then declined strongly until May 2013 and has been volatile ever since. During the reference period it remained the highest among non-euro area EU Member States, reflecting unresolved concerns about, for example, debt sustainability, and stood at 3.2 percentage points with respect to the euro area average (and 3.9 percentage points with respect to the AAA euro area yield) in April 2014.
Regarding the market structure, Hungary’s capital market is smaller and much less developed than the euro area average (see Table 14). The outstanding amount of debt securities issued by corporations has increased in recent years and stood at 30.2% of GDP in 2013. The importance of the stock market for the financing of the corporate sector is limited compared with the financing provided by the banking sector. Foreign-owned banks play a major role in the banking sector, and the majority of loans to the private sector are in foreign currencies. The legacy of a large share of foreign currency loans, and in particular loans in Swiss francs to households, remains a major vulnerability. Government measures to shield unhedged borrowers from the impact of the forint depreciation have improved the debt servicing ability of households, but have passed on the risks from the households to banks and the sovereign. At the end of 2013, stock market capitalisation stood at 15.4% of GDP, while the value of outstanding bank loans to the private sector was equal to 50.4% of GDP following a sharp decline since 2010. However, all of these ratios remain low in comparison with the euro area. The international claims of euro area banks on banks in Hungary stood at 11.3% of total liabilities in 2013.

151ECB
Convergence ReportJune 2014
HUNGARY
HUNGARY
1 PRICE DEVELOPMENTSTable 1 HICP inflation 152Chart 1 Price developments 152Table 2 Measures of inflation and related indicators 152Table 3 Recent inflation trends and forecasts 153
(a) Recent trends in the HICP 153(b) Inflation forecasts 153
2 FISCAL DEVELOPMENTSTable 4 General government fiscal position 154Table 5 General government budgetary position 154Chart 2 General government surplus (+)/deficit (-) 155
(a) Levels 155(b) Annual change and underlying factors 155
Table 6 General government gross debt – structural features 155Chart 3 General government gross debt 156
(a) Levels 156(b) Annual change and underlying factors 156
Chart 4 General government expenditure and revenue 156Chart 5 Potential future debt ratios under alternative assumptions for fiscal balance ratios 156Table 7 General government deficit-debt adjustment 157Table 8 Projections of the ageing-induced fiscal burden 157
3 EXCHANGE RATE DEVELOPMENTSTable 9 (a) Exchange rate stability 158
(b) Key indicators of exchange rate pressure for the Hungarian forint 158Chart 6 Hungarian forint: nominal exchange rate development against the euro 158
(a) Exchange rate over the reference period 158(b) Exchange rate over the last ten years 158
Table 10 Hungarian forint: real exchange rate developments 159Table 11 External developments 159Table 12 Indicators of integration with the euro area 159
4 LONG-TERM INTEREST RATE DEVELOPMENTSTable 13 Long-term interest rates (LTIRs) 160Chart 7 Long-term interest rate (LTIR) 160
(a) Long-term interest rate (LTIR) 160(b) LTIR and HICP inflation differentials vis-à-vis the euro area 160
Table 14 Selected indicators of financial development and integration 160
LIST OF TABLES AND CHARTS

152ECBConvergence ReportJune 2014
1 PRICE DEVELOPMENTSChart 1 Price developments
(average annual percentage changes)
-5
0
5
10
-5
0
5
10
2004 2005 2006 2007 2008 2009 2010 2011 2012 2013
HICPunit labour costsimport deflator
Source: European Commission (Eurostat).
Table 1 HICP inflation
(annual percentage changes)
2014 May 2013 to Apr. 2014 Jan. Feb. Mar. Apr.
HICP inflation 0.8 0.3 0.2 -0.2 1.0 Reference value 1) 1.7 Euro area 2) 0.8 0.7 0.5 0.7 1.0
Source: European Commission (Eurostat).1) The basis of the calculation for the period May 2013-April 2014
is the unweighted arithmetic average of the annual percentage changes in the HICP for Latvia, Portugal and Ireland plus 1.5 percentage points.
2) The euro area is included for information only.
Table 2 Measures of inflation and related indicators
(annual percentage changes, unless otherwise stated)
2004 2005 2006 2007 2008 2009 2010 2011 2012 2013
Measures of inflationHICP 6.8 3.5 4.0 7.9 6.0 4.0 4.7 3.9 5.7 1.7 HICP excluding unprocessed food and energy 6.4 2.7 2.5 6.7 5.1 4.1 3.3 3.0 5.0 3.0 HICP at constant tax rates 1) 5.0 3.3 5.3 6.6 5.9 2.2 2.5 3.7 3.5 1.2 CPI 6.7 3.6 3.9 8.0 6.1 4.2 4.9 3.9 5.7 1.7 Private consumption deflator 5.6 3.6 3.5 6.9 5.3 3.9 3.9 4.2 6.1 1.7 GDP deflator 5.2 2.5 3.5 5.4 5.3 3.6 2.4 2.6 3.2 2.7 Producer prices 2) 8.4 6.1 8.4 6.4 11.8 1.5 7.3 6.1 5.3 -0.5 Related indicatorsReal GDP growth 4.8 4.0 3.9 0.1 0.9 -6.8 1.1 1.6 -1.7 1.1 GDP per capita in PPS 3) (euro area = 100) 57.9 58.1 58.0 56.7 58.9 60.2 60.8 61.8 61.6 . Comparative price levels (euro area = 100) 60.2 62.1 59.5 65.9 67.3 59.7 61.0 59.6 59.1 . Output gap 4) 3.1 3.9 5.2 3.2 2.5 -4.9 -3.9 -2.5 -4.2 -3.4 Unemployment rate (%) 5) 6.1 7.2 7.5 7.4 7.8 10.0 11.2 11.0 10.9 10.2 Unit labour costs, whole economy 4.2 2.7 2.0 6.2 4.4 2.8 -0.7 2.3 2.5 4.0 Compensation per employee, whole economy 10.3 7.1 5.6 5.5 7.2 -1.7 -0.5 3.6 0.8 4.7 Labour productivity, whole economy 5.8 4.3 3.4 -0.6 2.7 -4.4 0.2 1.3 -1.7 0.7 Imports of goods and services deflator -1.0 1.3 8.0 -4.3 1.7 1.4 1.9 5.1 4.1 -0.6 Nominal effective exchange rate 6) 2.3 0.3 -6.4 6.2 1.0 -9.5 -1.2 -1.2 -5.6 -1.2 Money supply (M3) 7) 12.6 13.6 13.7 11.7 6.8 3.3 2.6 2.3 -2.0 6.1 Lending from banks 8) 21.9 16.8 19.5 17.7 8.3 -5.4 -5.2 -13.2 -5.5 -4.1 Stock prices (Budapest BUX Index) 57.2 41.0 19.5 5.6 -53.3 73.4 0.5 -20.4 7.1 2.2 Residential property prices 9.1 0.9 -1.1 2.0 2.5 -5.3 -2.4 -3.4 -3.8 .
Sources: European Commission (Eurostat), national data (CPI, money supply, lending from banks and residential property prices) and European Commission (output gap).1) The difference between the “HICP” and the “HICP at constant tax rates” shows the theoretical impact of changes in indirect taxes
(e.g. VAT and excise duties) on the overall rate of inflation. This impact assumes a full and instantaneous pass-through of tax rate changes on the price paid by the consumer.
2) Domestic sales, total industry excluding construction.3) PPS stands for purchasing power standards.4) Percentage difference of potential GDP: a positive (negative) sign indicates that actual GDP is above (below) potential GDP.5) The definition conforms to ILO guidelines.6) A positive (negative) sign indicates an appreciation (depreciation).7) The series includes repurchase agreements with central counterparties.8) Not adjusted for the derecognition of loans from the MFI statistical balance sheet due to their sale or securitisation.
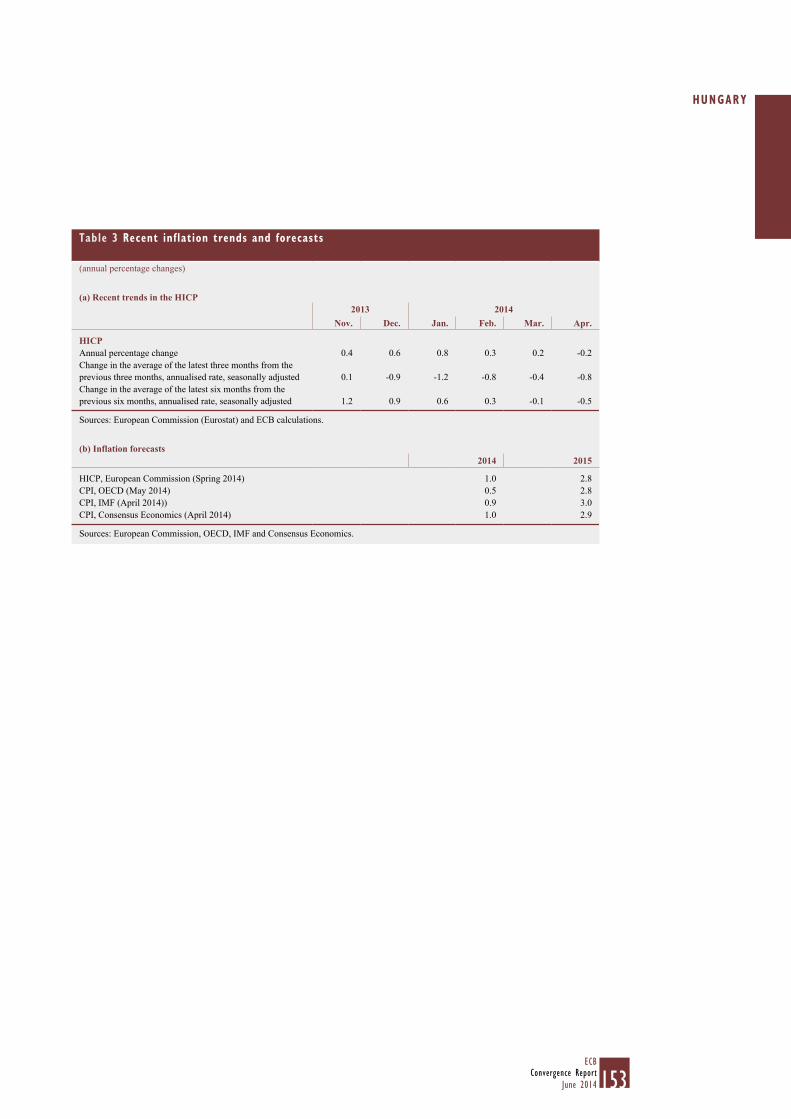
153ECB
Convergence ReportJune 2014
HUNGARY
Table 3 Recent inflation trends and forecasts
(annual percentage changes)
(a) Recent trends in the HICP2013 2014
Nov. Dec. Jan. Feb. Mar. Apr.
HICPAnnual percentage change 0.4 0.6 0.8 0.3 0.2 -0.2 Change in the average of the latest three months from the previous three months, annualised rate, seasonally adjusted 0.1 -0.9 -1.2 -0.8 -0.4 -0.8 Change in the average of the latest six months from the previous six months, annualised rate, seasonally adjusted 1.2 0.9 0.6 0.3 -0.1 -0.5
Sources: European Commission (Eurostat) and ECB calculations.
(b) Inflation forecasts2014 2015
HICP, European Commission (Spring 2014) 1.0 2.8 CPI, OECD (May 2014) 0.5 2.8 CPI, IMF (April 2014)) 0.9 3.0 CPI, Consensus Economics (April 2014) 1.0 2.9
Sources: European Commission, OECD, IMF and Consensus Economics.
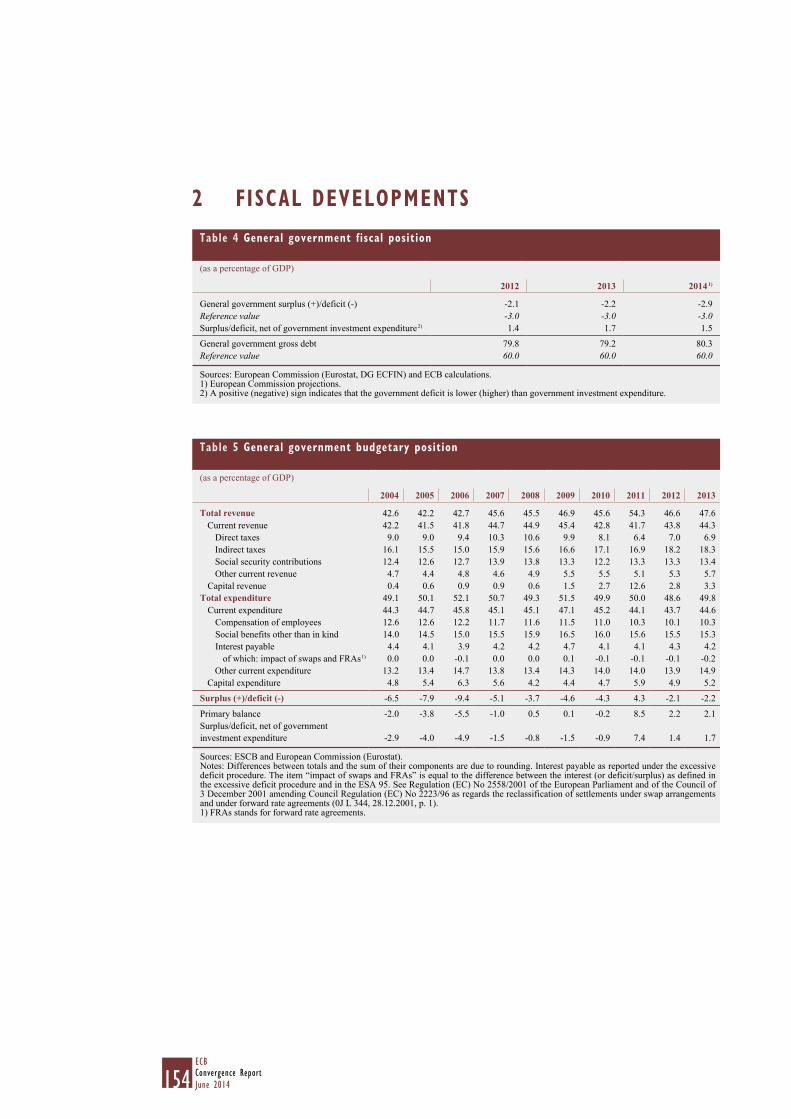
154ECBConvergence ReportJune 2014
2 FISCAL DEVELOPMENTSTable 4 General government fiscal position
(as a percentage of GDP)
2012 2013 2014 1)
General government surplus (+)/deficit (-) -2.1 -2.2 -2.9 Reference value -3.0 -3.0 -3.0 Surplus/deficit, net of government investment expenditure 2) 1.4 1.7 1.5
General government gross debt 79.8 79.2 80.3 Reference value 60.0 60.0 60.0
Sources: European Commission (Eurostat, DG ECFIN) and ECB calculations.1) European Commission projections.2) A positive (negative) sign indicates that the government deficit is lower (higher) than government investment expenditure.
Table 5 General government budgetary position
(as a percentage of GDP)
2004 2005 2006 2007 2008 2009 2010 2011 2012 2013
Total revenue 42.6 42.2 42.7 45.6 45.5 46.9 45.6 54.3 46.6 47.6 Current revenue 42.2 41.5 41.8 44.7 44.9 45.4 42.8 41.7 43.8 44.3
Direct taxes 9.0 9.0 9.4 10.3 10.6 9.9 8.1 6.4 7.0 6.9 Indirect taxes 16.1 15.5 15.0 15.9 15.6 16.6 17.1 16.9 18.2 18.3 Social security contributions 12.4 12.6 12.7 13.9 13.8 13.3 12.2 13.3 13.3 13.4 Other current revenue 4.7 4.4 4.8 4.6 4.9 5.5 5.5 5.1 5.3 5.7
Capital revenue 0.4 0.6 0.9 0.9 0.6 1.5 2.7 12.6 2.8 3.3 Total expenditure 49.1 50.1 52.1 50.7 49.3 51.5 49.9 50.0 48.6 49.8
Current expenditure 44.3 44.7 45.8 45.1 45.1 47.1 45.2 44.1 43.7 44.6 Compensation of employees 12.6 12.6 12.2 11.7 11.6 11.5 11.0 10.3 10.1 10.3 Social benefits other than in kind 14.0 14.5 15.0 15.5 15.9 16.5 16.0 15.6 15.5 15.3 Interest payable 4.4 4.1 3.9 4.2 4.2 4.7 4.1 4.1 4.3 4.2
of which: impact of swaps and FRAs 1) 0.0 0.0 -0.1 0.0 0.0 0.1 -0.1 -0.1 -0.1 -0.2 Other current expenditure 13.2 13.4 14.7 13.8 13.4 14.3 14.0 14.0 13.9 14.9
Capital expenditure 4.8 5.4 6.3 5.6 4.2 4.4 4.7 5.9 4.9 5.2
Surplus (+)/deficit (-) -6.5 -7.9 -9.4 -5.1 -3.7 -4.6 -4.3 4.3 -2.1 -2.2
Primary balance -2.0 -3.8 -5.5 -1.0 0.5 0.1 -0.2 8.5 2.2 2.1 Surplus/deficit, net of government investment expenditure -2.9 -4.0 -4.9 -1.5 -0.8 -1.5 -0.9 7.4 1.4 1.7
Sources: ESCB and European Commission (Eurostat).Notes: Differences between totals and the sum of their components are due to rounding. Interest payable as reported under the excessive deficit procedure. The item “impact of swaps and FRAs” is equal to the difference between the interest (or deficit/surplus) as defined in the excessive deficit procedure and in the ESA 95. See Regulation (EC) No 2558/2001 of the European Parliament and of the Council of 3 December 2001 amending Council Regulation (EC) No 2223/96 as regards the reclassification of settlements under swap arrangements and under forward rate agreements (0J L 344, 28.12.2001, p. 1).1) FRAs stands for forward rate agreements.
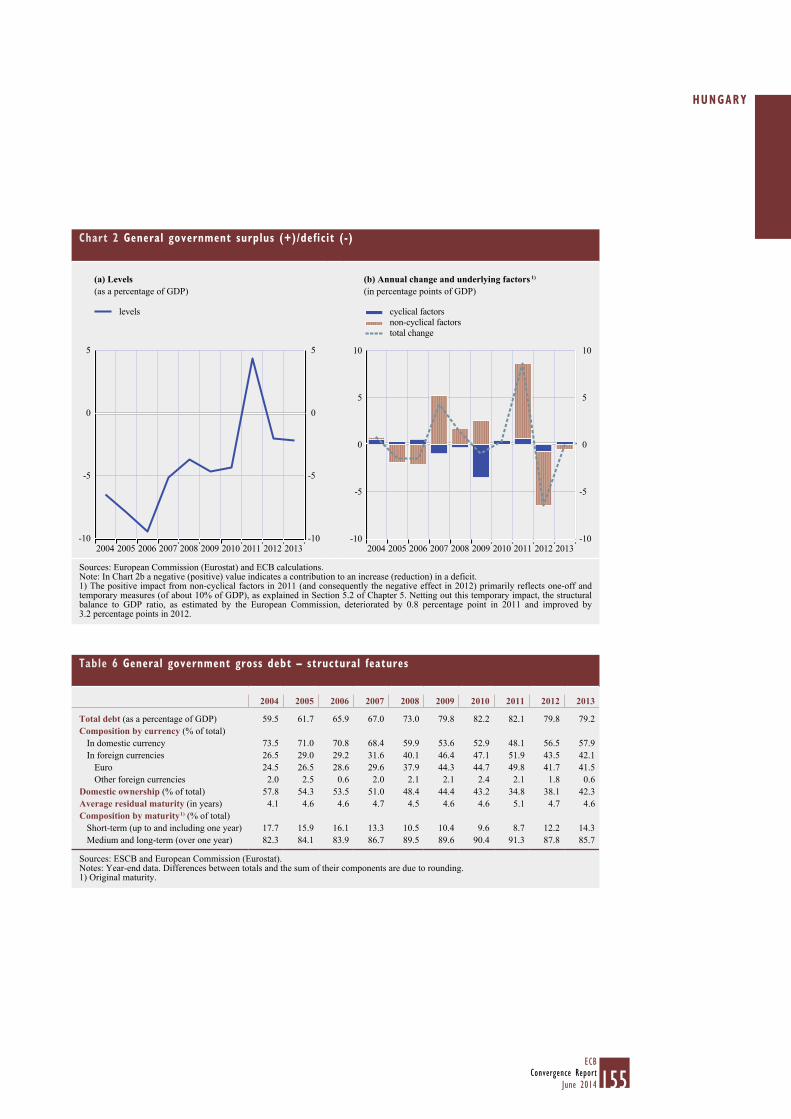
155ECB
Convergence ReportJune 2014
HUNGARY
Chart 2 General government surplus (+)/deficit (-)
(a) Levels(as a percentage of GDP)
(b) Annual change and underlying factors 1)
(in percentage points of GDP)
-10
-5
0
5
-10
-5
0
5
2004 2005 2006 2007 2008 2009 2010 2011 2012 2013
levels
-10
-5
0
5
10
-10
-5
0
5
10
2004 2005 2006 2007 2008 2009 2010 2011 2012 2013
cyclical factorsnon-cyclical factorstotal change
Sources: European Commission (Eurostat) and ECB calculations.Note: In Chart 2b a negative (positive) value indicates a contribution to an increase (reduction) in a deficit.1) The positive impact from non-cyclical factors in 2011 (and consequently the negative effect in 2012) primarily reflects one-off and temporary measures (of about 10% of GDP), as explained in Section 5.2 of Chapter 5. Netting out this temporary impact, the structural balance to GDP ratio, as estimated by the European Commission, deteriorated by 0.8 percentage point in 2011 and improved by 3.2 percentage points in 2012.
Table 6 General government gross debt – structural features
2004 2005 2006 2007 2008 2009 2010 2011 2012 2013
Total debt (as a percentage of GDP) 59.5 61.7 65.9 67.0 73.0 79.8 82.2 82.1 79.8 79.2 Composition by currency (% of total)
In domestic currency 73.5 71.0 70.8 68.4 59.9 53.6 52.9 48.1 56.5 57.9 In foreign currencies 26.5 29.0 29.2 31.6 40.1 46.4 47.1 51.9 43.5 42.1
Euro 24.5 26.5 28.6 29.6 37.9 44.3 44.7 49.8 41.7 41.5 Other foreign currencies 2.0 2.5 0.6 2.0 2.1 2.1 2.4 2.1 1.8 0.6
Domestic ownership (% of total) 57.8 54.3 53.5 51.0 48.4 44.4 43.2 34.8 38.1 42.3 Average residual maturity (in years) 4.1 4.6 4.6 4.7 4.5 4.6 4.6 5.1 4.7 4.6 Composition by maturity 1) (% of total)
Short-term (up to and including one year) 17.7 15.9 16.1 13.3 10.5 10.4 9.6 8.7 12.2 14.3 Medium and long-term (over one year) 82.3 84.1 83.9 86.7 89.5 89.6 90.4 91.3 87.8 85.7
Sources: ESCB and European Commission (Eurostat).Notes: Year-end data. Differences between totals and the sum of their components are due to rounding.1) Original maturity.
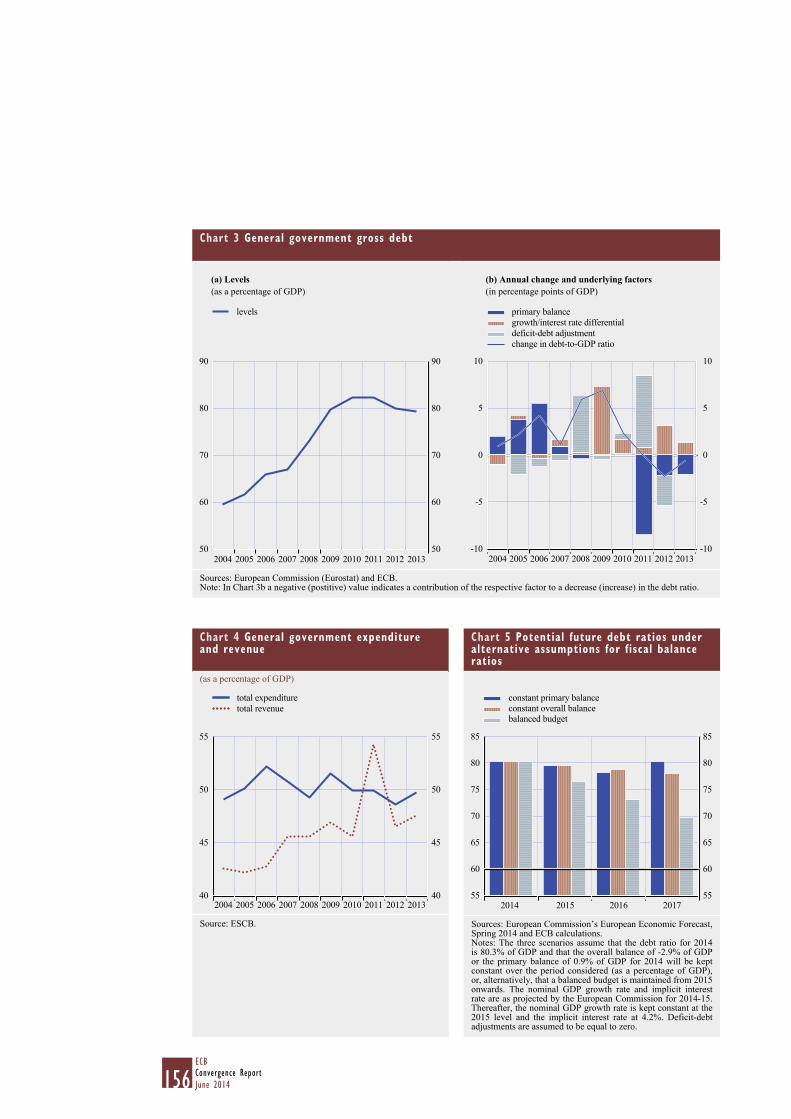
156ECBConvergence ReportJune 2014
Chart 3 General government gross debt
(a) Levels(as a percentage of GDP)
(b) Annual change and underlying factors(in percentage points of GDP)
50
60
70
80
90
50
60
70
80
90
levels
2004 2005 2006 2007 2008 2009 2010 2011 2012 2013-10
-5
0
5
10
-10
-5
0
5
10
2004 2005 2006 2007 2008 2009 2010 2011 2012 2013
primary balancegrowth/interest rate differentialdeficit-debt adjustmentchange in debt-to-GDP ratio
Sources: European Commission (Eurostat) and ECB.Note: In Chart 3b a negative (postitive) value indicates a contribution of the respective factor to a decrease (increase) in the debt ratio.
Chart 4 General government expenditure and revenue
(as a percentage of GDP)
40
45
50
55
40
45
50
55
2004 2005 2006 2007 2008 2009 2010 2011 2012 2013
total expendituretotal revenue
Source: ESCB.
Chart 5 Potential future debt ratios under alternative assumptions for fiscal balance ratios
55
60
65
70
75
80
85
55
60
65
70
75
80
85
constant primary balanceconstant overall balancebalanced budget
2014 2015 2016 2017
Sources: European Commission’s European Economic Forecast, Spring 2014 and ECB calculations.Notes: The three scenarios assume that the debt ratio for 2014 is 80.3% of GDP and that the overall balance of -2.9% of GDP or the primary balance of 0.9% of GDP for 2014 will be kept constant over the period considered (as a percentage of GDP), or, alternatively, that a balanced budget is maintained from 2015 onwards. The nominal GDP growth rate and implicit interest rate are as projected by the European Commission for 2014-15. Thereafter, the nominal GDP growth rate is kept constant at the 2015 level and the implicit interest rate at 4.2%. Deficit-debt adjustments are assumed to be equal to zero.
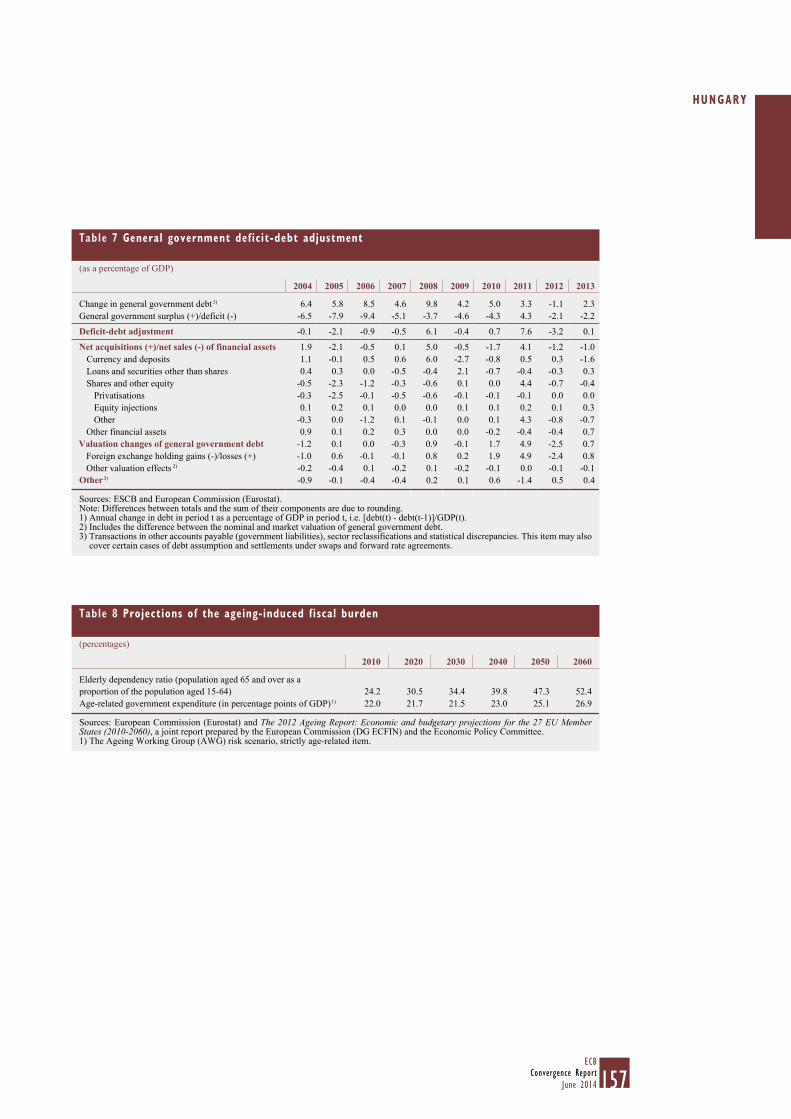
157ECB
Convergence ReportJune 2014
HUNGARY
Table 7 General government deficit-debt adjustment
(as a percentage of GDP)
2004 2005 2006 2007 2008 2009 2010 2011 2012 2013
Change in general government debt 1) 6.4 5.8 8.5 4.6 9.8 4.2 5.0 3.3 -1.1 2.3 General government surplus (+)/deficit (-) -6.5 -7.9 -9.4 -5.1 -3.7 -4.6 -4.3 4.3 -2.1 -2.2
Deficit-debt adjustment -0.1 -2.1 -0.9 -0.5 6.1 -0.4 0.7 7.6 -3.2 0.1
Net acquisitions (+)/net sales (-) of financial assets 1.9 -2.1 -0.5 0.1 5.0 -0.5 -1.7 4.1 -1.2 -1.0 Currency and deposits 1.1 -0.1 0.5 0.6 6.0 -2.7 -0.8 0.5 0.3 -1.6 Loans and securities other than shares 0.4 0.3 0.0 -0.5 -0.4 2.1 -0.7 -0.4 -0.3 0.3 Shares and other equity -0.5 -2.3 -1.2 -0.3 -0.6 0.1 0.0 4.4 -0.7 -0.4
Privatisations -0.3 -2.5 -0.1 -0.5 -0.6 -0.1 -0.1 -0.1 0.0 0.0 Equity injections 0.1 0.2 0.1 0.0 0.0 0.1 0.1 0.2 0.1 0.3 Other -0.3 0.0 -1.2 0.1 -0.1 0.0 0.1 4.3 -0.8 -0.7
Other financial assets 0.9 0.1 0.2 0.3 0.0 0.0 -0.2 -0.4 -0.4 0.7 Valuation changes of general government debt -1.2 0.1 0.0 -0.3 0.9 -0.1 1.7 4.9 -2.5 0.7
Foreign exchange holding gains (-)/losses (+) -1.0 0.6 -0.1 -0.1 0.8 0.2 1.9 4.9 -2.4 0.8 Other valuation effects 2) -0.2 -0.4 0.1 -0.2 0.1 -0.2 -0.1 0.0 -0.1 -0.1
Other 3) -0.9 -0.1 -0.4 -0.4 0.2 0.1 0.6 -1.4 0.5 0.4
Sources: ESCB and European Commission (Eurostat).Note: Differences between totals and the sum of their components are due to rounding.1) Annual change in debt in period t as a percentage of GDP in period t, i.e. [debt(t) - debt(t-1)]/GDP(t).2) Includes the difference between the nominal and market valuation of general government debt.3) Transactions in other accounts payable (government liabilities), sector reclassifications and statistical discrepancies. This item may also
cover certain cases of debt assumption and settlements under swaps and forward rate agreements.
Table 8 Projections of the ageing-induced fiscal burden
(percentages)
2010 2020 2030 2040 2050 2060
Elderly dependency ratio (population aged 65 and over as a proportion of the population aged 15-64) 24.2 30.5 34.4 39.8 47.3 52.4 Age-related government expenditure (in percentage points of GDP) 1) 22.0 21.7 21.5 23.0 25.1 26.9
Sources: European Commission (Eurostat) and The 2012 Ageing Report: Economic and budgetary projections for the 27 EU Member States (2010-2060), a joint report prepared by the European Commission (DG ECFIN) and the Economic Policy Committee.1) The Ageing Working Group (AWG) risk scenario, strictly age-related item.
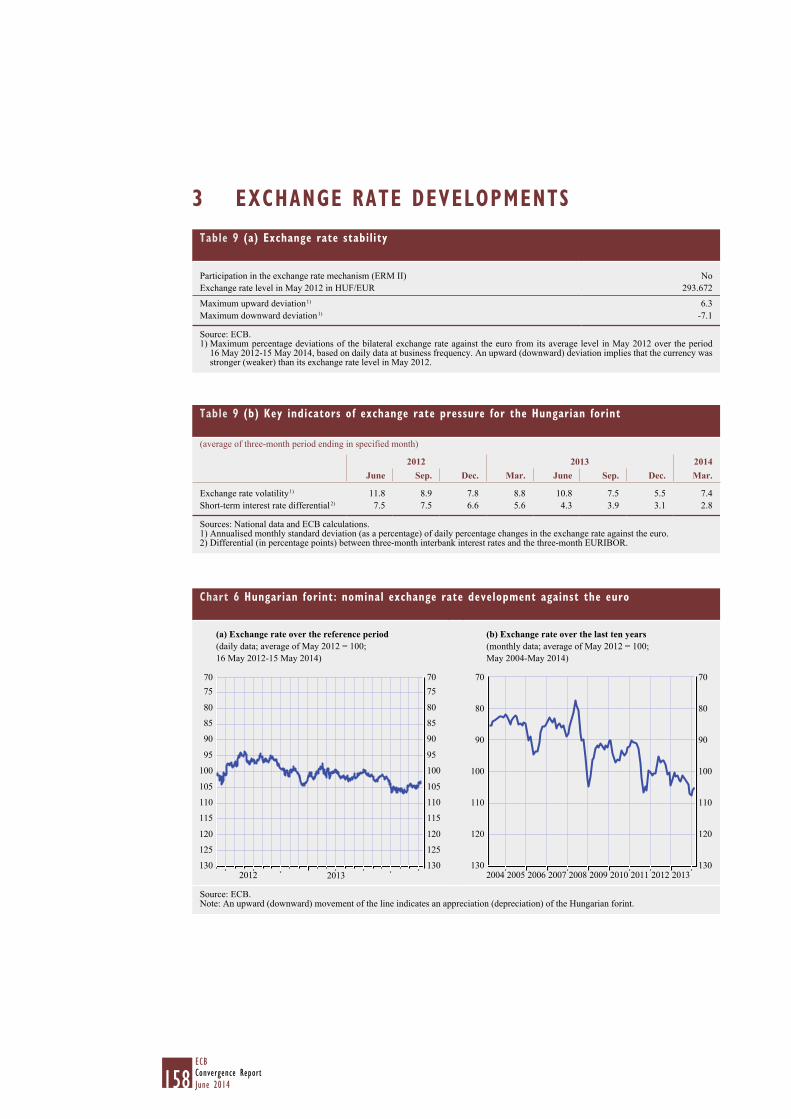
158ECBConvergence ReportJune 2014
3 EXCHANGE RATE DEVELOPMENTSTable 9 (a) Exchange rate stability
Participation in the exchange rate mechanism (ERM II) NoExchange rate level in May 2012 in HUF/EUR 293.672
Maximum upward deviation 1) 6.3Maximum downward deviation 1) -7.1
Source: ECB.1) Maximum percentage deviations of the bilateral exchange rate against the euro from its average level in May 2012 over the period
16 May 2012-15 May 2014, based on daily data at business frequency. An upward (downward) deviation implies that the currency was stronger (weaker) than its exchange rate level in May 2012.
Table 9 (b) Key indicators of exchange rate pressure for the Hungarian forint
(average of three-month period ending in specified month)
2012 2013 2014June Sep. Dec. Mar. June Sep. Dec. Mar.
Exchange rate volatility 1) 11.8 8.9 7.8 8.8 10.8 7.5 5.5 7.4 Short-term interest rate differential 2) 7.5 7.5 6.6 5.6 4.3 3.9 3.1 2.8
Sources: National data and ECB calculations.1) Annualised monthly standard deviation (as a percentage) of daily percentage changes in the exchange rate against the euro.2) Differential (in percentage points) between three-month interbank interest rates and the three-month EURIBOR.
Chart 6 Hungarian forint: nominal exchange rate development against the euro
(a) Exchange rate over the reference period (daily data; average of May 2012 = 100; 16 May 2012-15 May 2014)
(b) Exchange rate over the last ten years(monthly data; average of May 2012 = 100; May 2004-May 2014)
130
125
120
115
110
105
100
95
90
85
80
7570
130
125
120
115
110
105
100
95
90
85
80
7570
2012 2013130
120
110
100
90
70
80
130
120
110
100
90
70
80
2004 2005 2006 2007 2008 2009 2010 2011 2012 2013
Source: ECB.Note: An upward (downward) movement of the line indicates an appreciation (depreciation) of the Hungarian forint.
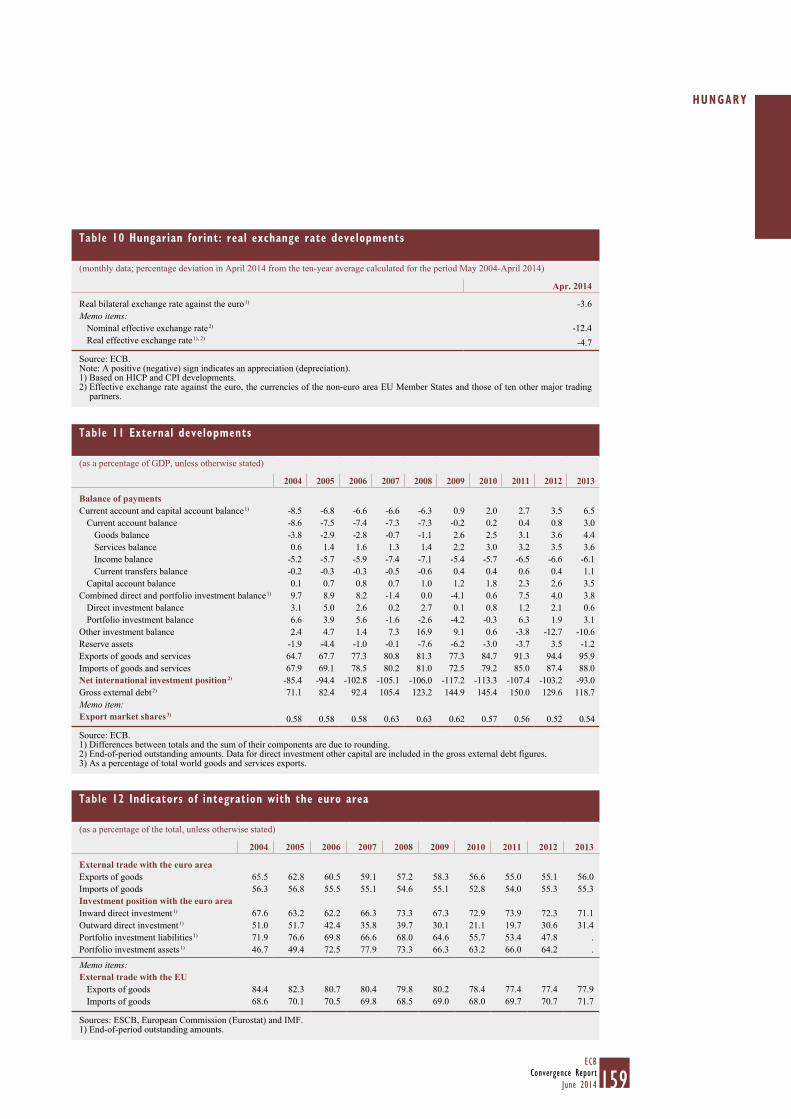
159ECB
Convergence ReportJune 2014
HUNGARY
Table 10 Hungarian forint: real exchange rate developments
(monthly data; percentage deviation in April 2014 from the ten-year average calculated for the period May 2004-April 2014)
Apr. 2014
Real bilateral exchange rate against the euro 1) -3.6Memo items:
Nominal effective exchange rate 2) -12.4 Real effective exchange rate 1), 2) -4.7
Source: ECB.Note: A positive (negative) sign indicates an appreciation (depreciation).1) Based on HICP and CPI developments.2) Effective exchange rate against the euro, the currencies of the non-euro area EU Member States and those of ten other major trading
partners.
Table 11 External developments
(as a percentage of GDP, unless otherwise stated)
2004 2005 2006 2007 2008 2009 2010 2011 2012 2013
Balance of paymentsCurrent account and capital account balance 1) -8.5 -6.8 -6.6 -6.6 -6.3 0.9 2.0 2.7 3.5 6.5
Current account balance -8.6 -7.5 -7.4 -7.3 -7.3 -0.2 0.2 0.4 0.8 3.0 Goods balance -3.8 -2.9 -2.8 -0.7 -1.1 2.6 2.5 3.1 3.6 4.4 Services balance 0.6 1.4 1.6 1.3 1.4 2.2 3.0 3.2 3.5 3.6 Income balance -5.2 -5.7 -5.9 -7.4 -7.1 -5.4 -5.7 -6.5 -6.6 -6.1 Current transfers balance -0.2 -0.3 -0.3 -0.5 -0.6 0.4 0.4 0.6 0.4 1.1
Capital account balance 0.1 0.7 0.8 0.7 1.0 1.2 1.8 2.3 2.6 3.5 Combined direct and portfolio investment balance 1) 9.7 8.9 8.2 -1.4 0.0 -4.1 0.6 7.5 4.0 3.8
Direct investment balance 3.1 5.0 2.6 0.2 2.7 0.1 0.8 1.2 2.1 0.6 Portfolio investment balance 6.6 3.9 5.6 -1.6 -2.6 -4.2 -0.3 6.3 1.9 3.1
Other investment balance 2.4 4.7 1.4 7.3 16.9 9.1 0.6 -3.8 -12.7 -10.6 Reserve assets -1.9 -4.4 -1.0 -0.1 -7.6 -6.2 -3.0 -3.7 3.5 -1.2 Exports of goods and services 64.7 67.7 77.3 80.8 81.3 77.3 84.7 91.3 94.4 95.9 Imports of goods and services 67.9 69.1 78.5 80.2 81.0 72.5 79.2 85.0 87.4 88.0 Net international investment position 2) -85.4 -94.4 -102.8 -105.1 -106.0 -117.2 -113.3 -107.4 -103.2 -93.0 Gross external debt 2) 71.1 82.4 92.4 105.4 123.2 144.9 145.4 150.0 129.6 118.7 Memo item:Export market shares 3) 0.58 0.58 0.58 0.63 0.63 0.62 0.57 0.56 0.52 0.54
Source: ECB.1) Differences between totals and the sum of their components are due to rounding.2) End-of-period outstanding amounts. Data for direct investment other capital are included in the gross external debt figures.3) As a percentage of total world goods and services exports.
Table 12 Indicators of integration with the euro area
(as a percentage of the total, unless otherwise stated)
2004 2005 2006 2007 2008 2009 2010 2011 2012 2013
External trade with the euro areaExports of goods 65.5 62.8 60.5 59.1 57.2 58.3 56.6 55.0 55.1 56.0 Imports of goods 56.3 56.8 55.5 55.1 54.6 55.1 52.8 54.0 55.3 55.3 Investment position with the euro areaInward direct investment 1) 67.6 63.2 62.2 66.3 73.3 67.3 72.9 73.9 72.3 71.1 Outward direct investment 1) 51.0 51.7 42.4 35.8 39.7 30.1 21.1 19.7 30.6 31.4 Portfolio investment liabilities 1) 71.9 76.6 69.8 66.6 68.0 64.6 55.7 53.4 47.8 . Portfolio investment assets 1) 46.7 49.4 72.5 77.9 73.3 66.3 63.2 66.0 64.2 .
Memo items: External trade with the EU
Exports of goods 84.4 82.3 80.7 80.4 79.8 80.2 78.4 77.4 77.4 77.9 Imports of goods 68.6 70.1 70.5 69.8 68.5 69.0 68.0 69.7 70.7 71.7
Sources: ESCB, European Commission (Eurostat) and IMF.1) End-of-period outstanding amounts.
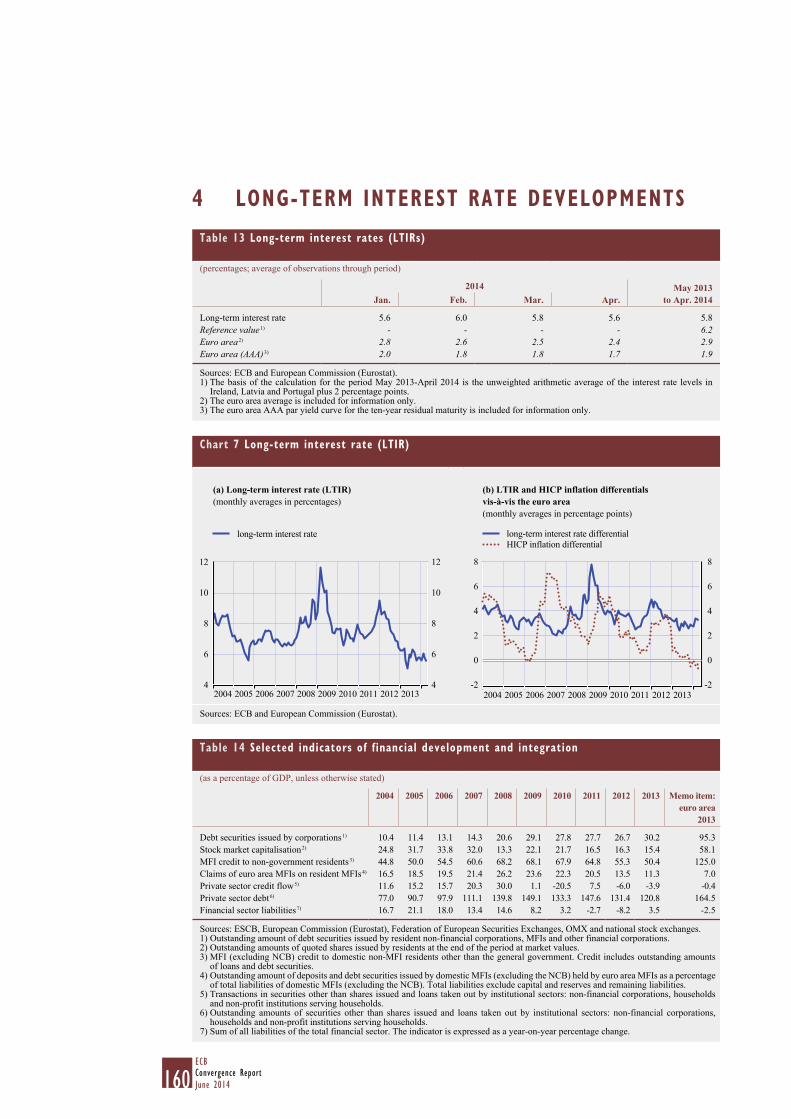
160ECBConvergence ReportJune 2014
4 LONG-TERM INTEREST RATE DEVELOPMENTSTable 13 Long-term interest rates (LTIRs)
(percentages; average of observations through period)
2014 May 2013 to Apr. 2014Jan. Feb. Mar. Apr.
Long-term interest rate 5.6 6.0 5.8 5.6 5.8 Reference value 1) - - - - 6.2 Euro area 2) 2.8 2.6 2.5 2.4 2.9 Euro area (AAA) 3) 2.0 1.8 1.8 1.7 1.9
Sources: ECB and European Commission (Eurostat).1) The basis of the calculation for the period May 2013-April 2014 is the unweighted arithmetic average of the interest rate levels in
Ireland, Latvia and Portugal plus 2 percentage points.2) The euro area average is included for information only.3) The euro area AAA par yield curve for the ten-year residual maturity is included for information only.
Chart 7 Long-term interest rate (LTIR)
(a) Long-term interest rate (LTIR)(monthly averages in percentages)
(b) LTIR and HICP inflation differentials vis-à-vis the euro area(monthly averages in percentage points)
4
6
8
10
12
4
6
8
10
12
long-term interest rate
2004 2005 2006 2007 2008 2009 2010 2011 2012 2013-2
0
2
4
6
8
-2
0
2
4
6
8
long-term interest rate differentialHICP inflation differential
2004 2005 2006 2007 2008 2009 2010 2011 2012 2013
Sources: ECB and European Commission (Eurostat).
Table 14 Selected indicators of financial development and integration
(as a percentage of GDP, unless otherwise stated)
2004 2005 2006 2007 2008 2009 2010 2011 2012 2013 Memo item: euro area
2013
Debt securities issued by corporations 1) 10.4 11.4 13.1 14.3 20.6 29.1 27.8 27.7 26.7 30.2 95.3 Stock market capitalisation 2) 24.8 31.7 33.8 32.0 13.3 22.1 21.7 16.5 16.3 15.4 58.1 MFI credit to non-government residents 3) 44.8 50.0 54.5 60.6 68.2 68.1 67.9 64.8 55.3 50.4 125.0 Claims of euro area MFIs on resident MFIs 4) 16.5 18.5 19.5 21.4 26.2 23.6 22.3 20.5 13.5 11.3 7.0 Private sector credit flow 5) 11.6 15.2 15.7 20.3 30.0 1.1 -20.5 7.5 -6.0 -3.9 -0.4 Private sector debt 6) 77.0 90.7 97.9 111.1 139.8 149.1 133.3 147.6 131.4 120.8 164.5 Financial sector liabilities 7) 16.7 21.1 18.0 13.4 14.6 8.2 3.2 -2.7 -8.2 3.5 -2.5
Sources: ESCB, European Commission (Eurostat), Federation of European Securities Exchanges, OMX and national stock exchanges.1) Outstanding amount of debt securities issued by resident non-financial corporations, MFIs and other financial corporations.2) Outstanding amounts of quoted shares issued by residents at the end of the period at market values.3) MFI (excluding NCB) credit to domestic non-MFI residents other than the general government. Credit includes outstanding amounts
of loans and debt securities.4) Outstanding amount of deposits and debt securities issued by domestic MFIs (excluding the NCB) held by euro area MFIs as a percentage
of total liabilities of domestic MFIs (excluding the NCB). Total liabilities exclude capital and reserves and remaining liabilities.5) Transactions in securities other than shares issued and loans taken out by institutional sectors: non-financial corporations, households
and non-profit institutions serving households.6) Outstanding amounts of securities other than shares issued and loans taken out by institutional sectors: non-financial corporations,
households and non-profit institutions serving households.7) Sum of all liabilities of the total financial sector. The indicator is expressed as a year-on-year percentage change.
161ECB
Convergence ReportJune 2014
POLAND
5.6 POLAND
5.6.1 PRICE DEVELOPMENTS
Over the reference period from May 2013 to April 2014, the 12-month average rate of HICP inflation in Poland was 0.6%, i.e. well below the reference value of 1.7% for the criterion on price stability (see Table 1). On the basis of the most recent information, the 12-month average rate of HICP inflation is expected to increase in the coming months.
Looking back over a longer period, annual consumer price inflation in Poland has fluctuated within a range of 0.8% and 4.2% over the past ten years (see Chart 1). Following a temporary rise in 2004, owing mainly to Poland’s accession to the EU, inflation declined to low levels in 2005 and 2006. At the end of 2006 price pressures picked up and inflation followed an upward trend, reaching levels above 4.0% in 2008. To a large extent, this was due to higher unit labour cost growth and changes in administered prices, as well as global food and energy price shocks. Inflation remained at an elevated level in 2009, partly reflecting the lagged impact of the sharp depreciation of the zloty after the collapse of Lehman Brothers in 2008, but declined gradually in 2010 supported by lower growth in import prices. In 2011 the surge in global commodity prices, the depreciation of the nominal exchange rate and a hike in the value added tax rate amid robust domestic demand contributed to a renewed increase in inflation. However, the significant weakening of domestic economic activity that started in 2012, combined with developments in global commodity prices, contributed to a sharp decline in inflation in 2013 to a historically low level.
The improvement in Poland’s medium-term inflation performance reflects a number of important policy choices, most notably the orientation of monetary policy towards the achievement of price stability, which is the primary objective of monetary policy, as enshrined in the central bank law. Narodowy Bank Polski operates a floating exchange rate system and since 1999 has had an inflation-targeting framework in place. The medium-term CPI inflation target has been 2.5% (±1 percentage point) since 2004. Inflation developments have been broadly supported by a number of reforms designed to strengthen financial market stability, increase labour market flexibility and enhance product market competition. While fiscal policy did not jeopardise the achievement of Narodowy Bank Polski’s inflation targets during 2005-07, it did not support it sufficiently between 2008 and 2010. From 2011 to 2013 the tightening of fiscal policy contributed to limiting inflationary pressures.
Inflation developments over the past ten years should be viewed against the background of sustained economic growth. From mid-2005 to mid-2008, a gradual upswing in economic activity driven by domestic demand was supported by improved labour market conditions and strong growth in credit to the private sector. In 2006 and 2007 real GDP expanded at an annual rate of well above 6%. Capacity pressures became apparent in 2007-08, in the form of perceptible rises in unit labour cost growth, widening current account deficits and a historically low unemployment rate. Combined with a sharp rise in food prices, strong gains in house prices and increases in administered prices, these factors contributed to the rebound in inflation from late 2006 to 2009. Capacity pressures declined with the onset of the global financial crisis. A relatively short-lived economic slowdown – Poland was the only EU country that avoided a decline in output in 2009 – and lower global commodity prices resulted in a temporary fall in annual HICP inflation to levels below 2% in the summer of 2010. Thereafter, inflationary pressures re-emerged, supported by the robust recovery in economic activity and despite increases in unemployment owing to a higher participation rate. Inflation
162ECBConvergence ReportJune 2014
increased rapidly to levels exceeding Narodowy Bank Polski’s target, which prompted Narodowy Bank Polski to increase interest rates by 1 percentage point in the first half of 2011 in order to prevent elevated inflation from becoming entrenched. Reflecting the weakness in domestic demand and unfavourable external conditions, the Polish economy slowed sharply in 2012-13. Despite decisive action by Narodowy Bank Polski – interest rates were cut by a total of 225 basis points from November 2012 to July 2013 – annual inflation declined rapidly and reached a trough of 0.2% in June 2013. The general pattern of inflation developments was also reflected in other relevant indices, such as the HICP excluding unprocessed food and energy (see Table 2). The fluctuation in import prices during the period under review was attributable to the degree of exchange rate volatility, which was mostly rather high. Overall, house prices became more moderate after sharp increases during the period 2005-09 and a slight correction in 2010.
Looking at recent developments, annual HICP inflation has remained subdued standing at 0.3% in April 2014 (see Table 3a). HICP inflation excluding unprocessed food and energy has also remained at low levels, hovering below 1% since mid-2013, despite the acceleration in real GDP growth to 3.3% in the first quarter of 2014. These historically low inflation rates partly reflect developments in global commodity prices and the persistent negative output gap in the Polish economy. In 2013 administered prices (including energy prices), which represent 14% of Poland’s HICP basket, contributed 0.2 percentage point to HICP inflation.
The latest available forecasts from major international institutions project inflation to gradually rise in 2014 and 2015, and to range from 1.1% to 1.5% and from 1.9% to 2.4% respectively (see Table 3b). It is anticipated that several factors will contribute to an increase in inflation in the Polish economy. In particular, the expected acceleration in real GDP growth in 2014, driven by domestic demand, is likely to support a gradual pick-up in inflation towards the central bank’s inflation target. Risks to the inflation outlook are broadly balanced. Upside risks relate mainly to developments in commodity prices, while downside risks are mostly associated with the pace of the economic recovery in Poland. Looking further ahead, the catching-up process is likely to have a bearing on inflation and/or the nominal exchange rate over the coming years, given that GDP per capita and price levels are still lower in Poland than in the euro area (see Table 2). However, it is difficult to assess the exact size of the effect resulting from this catching-up process.
Overall, although the 12-month average rate of HICP inflation in Poland is currently well below the reference value, there are concerns regarding the sustainability of inflation convergence.
Achieving an environment that is conducive to sustainable convergence in Poland requires, among other things, maintaining a price stability-oriented monetary policy in the medium term. Regarding macroeconomic imbalances, the European Commission did not select Poland for an in-depth review in its Alert Mechanism Report 2014. Although the Polish economy managed to weather the global crisis comparatively well, a number of structural issues remain unresolved. Specifically, progress in the areas below will contribute to the achievement of an environment that is conducive to sustainable price stability and promote competitiveness and employment growth.
With regard to structural reforms, efforts to speed up innovation and the privatisation process (particularly in key state-owned sectors such as mining, chemicals and energy), which are needed to enhance economic potential, should be complemented with steps to boost competition in product markets. More competitive product markets would also strengthen the economy’s resilience to potential shocks. In addition, improvements in the business environment could help to attract

163ECB
Convergence ReportJune 2014
POLAND
much-needed private investment. The continuation of the country’s infrastructure modernisation would boost potential output and support a more efficient allocation of resources.
In the labour market, a number of structural weaknesses need to be addressed, for example, by strengthening education and reducing labour market mismatches, as well as boosting the labour force participation rate. It is also essential that structural reforms are carried out to tackle disincentives to work, which stem, inter alia, from poorly designed family and pension policies, and to ensure that welfare benefits are linked to active job seeking by the recipients. Wage increases should continue to reflect labour productivity growth, labour market conditions and developments in competitor countries.
The growing reliance on potentially volatile portfolio inflows is a source of vulnerability, particularly at the current juncture. It is therefore important to encourage the financial sector to rely more heavily on domestic sources of funding. In order to minimise the potential risks to financial stability associated with a high proportion of foreign currency loans, it is necessary for Poland to continue to fully apply the recommendation of the ESRB on lending in foreign currencies,16 with which it was considered to be fully compliant in the follow-up report published by the ESRB in November 2013. Close cooperation between home and host country supervisory authorities is important to ensure the effective implementation of these measures. Financial sector policies should be geared towards safeguarding financial stability and ensure that the financial sector makes a sound contribution to economic growth. Finally, financial stability could benefit from Poland’s participation in the SSM, which will take up its prudential supervisory tasks in November 2014.
5.6.2 FISCAL DEVELOPMENTS
Poland is currently subject to an EU Council decision on the existence of an excessive deficit. In the reference year 2013 the general government budget balance recorded a deficit of 4.3% of GDP, i.e. well above the 3% reference value. The general government gross debt-to-GDP ratio was 57.0%, i.e. below the 60% reference value (see Table 4). Compared with the previous year, the budget balance ratio deteriorated by 0.4 percentage point, while the public debt ratio increased by 1.4 percentage points. The European Commission forecasts a budget surplus of 5.7% of GDP in 2014 owing to pension system reform, while the government debt ratio is projected to decline to 49.2%. With regard to other fiscal factors, the deficit ratio did exceed the ratio of public investment to GDP in 2013, but is not expected to in 2014.
Looking at developments in Poland’s budgetary position over the period from 2004 to 2013, the budget deficit increased sharply from 1.9% of GDP in 2007 to 7.8% of GDP in 2010. The budget deficit was reduced significantly during the following two years, before rising again in 2013 (see Table 5 and Chart 2a). As the deficit-to-GDP ratio rose above the 3% of GDP reference value in 2008, the ECOFIN Council decided on 7 July 2009 that an excessive deficit situation existed in Poland and set a deadline of 2012 for correcting it. The deadline was extended to 2014 in June 2013 and to 2015 in December 2013.
As shown in greater detail in Chart 2b, European Commission estimates indicate that cyclical factors contributed overall to reducing the budget deficit before 2008. Cyclical factors had a negative impact on the budget balance in 2009, a broadly neutral impact in 2010 and 2011 and a negative impact again in 2012 and 2013. Non-cyclical factors contributed to a strong deterioration
16 See Recommendation (ESRB/2011/1) of the European Systemic Risk Board of 21 September 2011 on lending in foreign currencies.
164ECBConvergence ReportJune 2014
in the budget balance between 2007 and 2009. The impact of non-cyclical factors on the budget balance turned positive in 2011 and 2012, when the Polish government implemented comprehensive fiscal consolidation measures. On the expenditure side, consolidation measures included a wage freeze for government employees as well as a temporary rule limiting the real growth of central government discretionary expenditure. In addition, local governments reduced their spending in order to comply with existing local government fiscal rules. On the revenue side, the measures comprised adjustments in pension contributions between the private and public pillars and increases in VAT and social contribution rates. Spending restraint continued in 2013, but was offset by a decline in tax revenue which was stronger than implied by the estimated impact of cyclical factors. In the absence of substantial temporary and one-off factors between 2004 and 2013, the underlying changes in the budget deficit seem to reflect a structural deterioration in Poland’s fiscal position until 2010, strong consolidation in 2011 and 2012 and a broadly neutral stance in 2013.
Turning to developments in general government gross debt, the debt-to-GDP ratio increased cumulatively by 11.3 percentage points between 2004 and 2013, although it was relatively stable until 2008 (see Chart 3a and Table 6). As shown in greater detail in Chart 3b, this increase relates, in particular, to developments in primary deficits, indicating a persistent link between primary deficits and adverse debt dynamics. At the same time, the impact of the deficit-debt adjustment was volatile, with both debt-increasing and debt-decreasing effects in individual years. The growth-interest rate differential had, on aggregate, a minor dampening effect on the debt ratio before 2011 and the opposite effect in 2012 and 2013. In 2013 the increase in the general government debt-to-GDP ratio reflected a continued primary deficit as well as a growth-interest rate differential effect, which was only partly offset by deficit-debt adjustments related to privatisation receipts.
As regards Poland’s general government debt structure, the share of government debt with a short-term maturity declined from 13.5% in 2004 to 0.1% in 2013 (see Table 6). Taking into account the level of the debt ratio, fiscal balances are insensitive to changes in interest rates. The proportion of government debt denominated in foreign currency is high (29.5% in 2013) and, given the overall debt level, the fiscal balances are relatively sensitive to changes in the exchange rate. During the crisis, the share of debt with a short-term maturity declined markedly, pointing to a decline in debt-related vulnerabilities. The share of debt denominated in foreign currency increased. At the same time, the Polish government has not incurred contingent liabilities resulting from government interventions to support financial institutions and financial markets during the crisis (see Section 5.9).
Moving on to examine trends in other fiscal indicators, Chart 4 and Table 5 show that the general government total expenditure-to-GDP ratio declined overall from 42.6% in 2004 to 41.9% in 2013. After peaking at 45.4% of GDP in 2010, the expenditure ratio declined as a result of declines in capital expenditure and all categories of current primary expenditure on the back of local government spending cuts driven by fiscal rules, a wage freeze in the public sector, a temporary expenditure rule in the central budget and a tightening of access to early retirement, which became law in 2008. Total government revenue as a share of GDP was volatile over the period under consideration, increasing slightly from 37.2% of GDP in 2004 to 37.5% of GDP in 2013. After peaking at 40.3% of GDP in 2007, the revenue-to-GDP ratio declined on the back of lower direct and indirect tax revenues, as well as other current revenues. These developments were outweighed in part by higher capital revenues and social security contributions.
Looking ahead, Poland’s medium-term fiscal policy strategy indicates the commitment of the government to bring the deficit below the reference value in 2015 and to reduce it gradually thereafter. According to the 2014-17 convergence programme update, the deficit is expected to
165ECB
Convergence ReportJune 2014
POLAND
be reduced to 2.5% of GDP in 2015 and then to 1.8% of GDP in 2016. The large budget surplus planned for 2014 fully reflects the transfer of assets from private pension funds to a public one of about 9% of GDP. The structural deficit is expected to decrease but remain above the medium-term objective of 1.0% of GDP (specified in line with the Stability and Growth Pact) in the entire 2014-2017 period. According to the European Commission’s projections, the structural deficit will remain significantly above the medium-term objective by 2015.
On 2 March 2012 Poland signed the Treaty on Stability, Coordination and Governance in the Economic and Monetary Union (TSCG), committing, inter alia, to apply (and include in its national legislation) the fiscal rules specified under Title III, “Fiscal Compact”. Overall, as regards fiscal governance, Poland has strengthened its fiscal framework over recent years, introducing a permanent expenditure rule and medium-term fiscal planning, to complement the constitutional debt ceiling, which has been in force since 1999.
Turning to factors with an impact on Poland’s public finances over the long term, a marked ageing of the population is expected, as highlighted in Table 8. According to the 2012 projections by the European Commission and the EU’s Economic Policy Committee, starting from a level of 21.4% of GDP in 2010, Poland is likely to experience a moderate increase in strictly age-related public expenditure amounting to 1.9 percentage points of GDP in the years to 2060, below the EU average.17 However, major changes in the pension system introduced in 2014 might result in a slight increase in age-related spending compared with these projections.
With respect to fiscal challenges, Poland must ensure a sustainable reduction in the budget deficit and correct the excessive deficit by 2015, in line with the EDP requirements. Specifically, a more comprehensive expenditure-based approach is needed to reduce the large structural deficit and to contain the rise in the debt ratio in a sustainable manner, while avoiding undue cuts in public investment. At the same time, Poland should make every effort to fully comply with the obligations under the enhanced Stability and Growth Pact, and to effectively implement the provisions of the TSCG. Over the longer run, the risks to medium-term fiscal sustainability warrant structural fiscal reforms that focus on avoiding pro-cyclical fiscal policies as well as improving tax administration.
5.6.3 EXCHANGE RATE DEVELOPMENTS
In the two-year reference period from 16 May 2012 to 15 May 2014, the Polish zloty did not participate in ERM II, but traded under a flexible exchange rate regime (see Table 9a). Over the reference period the Polish currency mostly traded above its May 2012 average exchange rate against the euro, which is used as a benchmark for illustrative purposes in the absence of an ERM II central rate. On 15 May 2014 the exchange rate stood at 4.1792 zlotys per euro, i.e. 2.7% stronger than its average level in May 2012. Over the reference period the maximum upward deviation from this benchmark was 6.0%, while the maximum downward deviation amounted to 2.8% (see Chart 5 and Table 9a). Narodowy Bank Polski sold foreign currency for zlotys on 7 June 2013 during a period of increased volatility.
During the reference period the exchange rate of the Polish zloty against the euro showed a relatively high degree of volatility, as measured by annualised standard deviations in daily percentage changes. Volatility peaked in the three-month period ending in September 2012 at a level of 9.2%,
17 European Commission and Economic Policy Committee, “The 2012 Ageing Report: Economic and budgetary projections for the EU-27 Member States (2010-2060)”.
166ECBConvergence ReportJune 2014
but declined thereafter. Between May 2012 and August 2012, the zloty appreciated gradually against the euro by around 7% on account of improving global financial market conditions, growing investor confidence in the region and a relatively high positive interest rate differential vis-à-vis euro area assets. After a period of relative exchange rate stability, the Polish zloty depreciated by about 6% vis-à-vis the euro during a period of increased volatility in mid-2013, in which Narodowy Bank Polski on one occasion sold foreign currency for zlotys against the background of investor uncertainty about the tapering-off of quantitative easing in the United States. Thereafter, until May 2014 the zloty strengthened gradually against the euro – by around 4% – amid an improving outlook for the Polish economy. Over the reference period, short-term interest rate differentials against the three-month EURIBOR remained at somewhat wide levels, on average, on account of higher monetary policy rates in Poland than in the euro area. The spreads decreased, however, from 4.7 percentage points in the three-month period ending in September 2012 to 2.4 percentage points in the three-month period ending in March 2014 amid several rate cuts by Narodowy Bank Polski (see Table 9b).
In late 2008 Narodowy Bank Polski and the ECB agreed on repurchase transactions, which would provide Narodowy Bank Polski with a facility to borrow up to €10 billion. Moreover, a Flexible Credit Line (FCL) arrangement by the IMF, designed to meet the demand for crisis-prevention and crisis-mitigation lending, has been in place since mid-2009. The precautionary arrangement totalling SDR 14 billion was initially approved in May 2009 for a one-year period, but was prolonged in mid-2010 for another six months. At the beginning of 2011 the IMF decided to prolong the existing FCL for a further two years and increase it to a total of SDR 19 billion. In January 2013 the IMF approved another successor two-year FCL arrangement amounting to SDR 22 billion. Poland has not received any disbursements from the FCL since its establishment. As these arrangements helped to reduce risks related to financial vulnerabilities, they might also have contributed to reducing the risk of exchange rate pressures.
In a longer-term context, in April 2014 both the real effective exchange rate and the real bilateral exchange rate of the Polish zloty against the euro stood close to the corresponding ten-year historical averages (see Table 10). However, these indicators should be interpreted with caution, as during this period Poland was subject to a process of economic convergence, which complicates any historical assessment of real exchange rate developments.
As regards other external developments, in 2007 and 2008 Poland reported large deficits in the combined current and capital account of its balance of payments (see Table 11). The combined current and capital account deficit increased gradually from 2.1% of GDP in 2005 to 5.4% in 2008 on account of a rising deficit in the goods balance associated with rapid growth in domestic demand. Following a strong depreciation of the zloty, the external deficit adjusted markedly in 2009 to 2.2% of GDP and around 3% of GDP in 2010 and 2011, respectively. The combined current and capital account balance improved further to a deficit of 1.5% of GDP in 2012 and a surplus of 1.0% in 2013. This mainly reflected an improvement in the goods balance on account of strengthening exports. On the financing side, Poland received net inflows in direct investment in the period from 2004 to 2012. While, with the exception of 2005, net direct investment inflows dominated in the period up to 2006, net inflows in other investment prevailed in 2007 and 2008. Since 2009 net inflows in portfolio investment have accounted for the largest part of Poland’s net financial inflows, with the exception of 2013, when net outflows of portfolio investment were recorded. Against this background, gross external debt increased from 42.0% of GDP in 2004 to 72.3% in 2011, before falling to 69.8% in 2013. At the same time Poland’s net international investment position deteriorated substantially, from -41.6% of GDP in 2004 to -66.5% in 2012 and -68.6%
167ECB
Convergence ReportJune 2014
POLAND
in 2013. Fiscal and structural policies therefore continue to be important for supporting external sustainability and the competitiveness of the economy. Poland is a small open economy; the ratio of foreign trade in goods and services to GDP increased from 37.5% in 2004 to 47.8% in 2013 for exports and from 39.8% in 2004 to 45.8% in 2013 for imports. Over the same period Poland’s share in world exports increased from 0.84% to 1.07%.
Concerning measures of economic integration with the euro area, in 2013 exports of goods to the euro area constituted 51.5% of total goods exports, whereas the corresponding figure for imports was slightly higher, at 54.5%. The share of euro area countries in Poland’s inward direct investment stood at 77.9% in 2013 and their share in its portfolio investment liabilities was 47.9% in 2012. The share of Poland’s assets invested in the euro area amounted to 61.8% in the case of direct investment in 2013 and 50.6% for portfolio investment in 2012 (see Table 12).
5.6.4 LONG-TERM INTEREST RATE DEVELOPMENTS
Long-term interest rates in Poland were 4.2% on average over the reference period from May 2013 to April 2014 and were thus well below the 6.2% reference value for the interest rate convergence criterion (see Table 13).
Long-term interest rates in Poland declined between 2004 and 2005 on the back of favourable inflation dynamics, mirroring developments in euro area yields (see Chart 6a). The reverse upward trend which ensued until mid-2008 reflected rising inflationary pressures. The global financial and economic crisis pushed up the country’s risk premium and triggered foreign capital outflows as well as liquidity strains in the government bond market. In May 2009 the IMF approved a precautionary arrangement under the Flexible Credit Line (FCL) for Poland to provide support during the global financial crisis. Poland has not received any disbursements from the FCL. The resilience of the Polish economy, reflected in positive growth figures during the global crisis, along with a significant improvement in the external balance, brought capital inflows to the local market, fostering declines in long-term interest rates in 2010. At the end of 2010, long-term interest rates increased somewhat, reflecting broader financial market tensions, but returned to a downward trend thereafter which lasted until mid-2013. In mid-2013, long-term interest rates rose to stand at 4.1% at the end of the reference period.
The differential between long-term interest rates in Poland and the euro area average has declined since mid-2004 (see Chart 6b). From July 2007, in the wake of the two rounds of the global financial market turmoil, the long-term interest rate differential widened considerably, but remained below the highs of 2004. From 2010 until mid-2013 the differential was on a declining trend, increasing somewhat afterwards. At the end of the reference period, the long-term interest rate differential amounted to 1.7 percentage points with respect to the euro area average (and 2.4 percentage points with respect to the euro area AAA yield).
The Polish financial sector can be regarded as smaller and much less developed than that of the euro area (see Table 14). Foreign-owned banks, primarily from the euro area, play a major role in the Polish banking sector. The amount of outstanding bank loans, which was previously relatively low, increased to stand at 54.2% of GDP at the end of 2013. The majority of loans to the private sector are denominated in local currency. Market-based credit to the corporate sector, as measured by the value of outstanding fixed-income securities issued by corporations, has increased in recent years and was 15.1% of GDP at the end of 2013. Stock market capitalisation partly recovered from declines during the crisis and stood at 35.3% of GDP in 2013, relatively high in comparison with

168ECBConvergence ReportJune 2014
other central European stock markets. The increased participation of pension and investment funds has contributed to the development of the stock market. The international claims of euro area banks in the country gradually increased until 2008 and subsequently declined, standing at 8.0% of total liabilities in 2013.
169ECB
Convergence ReportJune 2014
POLAND
POLAND
1 PRICE DEVELOPMENTS Table 1 HICP inflation 170Chart 1 Price developments 170Table 2 Measures of inflation and related indicators 170Table 3 Recent inflation trends and forecasts 171
(a) Recent trends in the HICP 171(b) Inflation forecasts 171
2 FISCAL DEVELOPMENTS Table 4 General government fiscal position 172Table 5 General government budgetary position 172Chart 2 General government surplus (+)/deficit (-) 173
(a) Levels 173(b) Annual change and underlying factors 173
Table 6 General government gross debt – structural features 173Chart 3 General government gross debt 174
(a) Levels 174(b) Annual change and underlying factors 174
Chart 4 General government expenditure and revenue 174Table 7 General government deficit-debt adjustment 175Table 8 Projections of the ageing-induced fiscal burden 175
3 EXCHANGE RATE DEVELOPMENTSTable 9 (a) Exchange rate stability 176
(b) Key indicators of exchange rate pressure for the Polish zloty 176Chart 5 Polish zloty: nominal exchange rate development against the euro 176
(a) Exchange rate over the reference period 176(b) Exchange rate over the last ten years 176
Table 10 Polish zloty: real exchange rate developments 177Table 11 External developments 177Table 12 Indicators of integration with the euro area 177
4 LONG-TERM INTEREST RATE DEVELOPMENTSTable 13 Long-term interest rates (LTIRs) 178Chart 6 Long-term interest rate (LTIR) 178
(a) Long-term interest rate (LTIR) 178(b) LTIR and HICP inflation differentials vis-à-vis the euro area 178
Table 14 Selected indicators of financial development and integration 178
LIST OF TABLES AND CHARTS
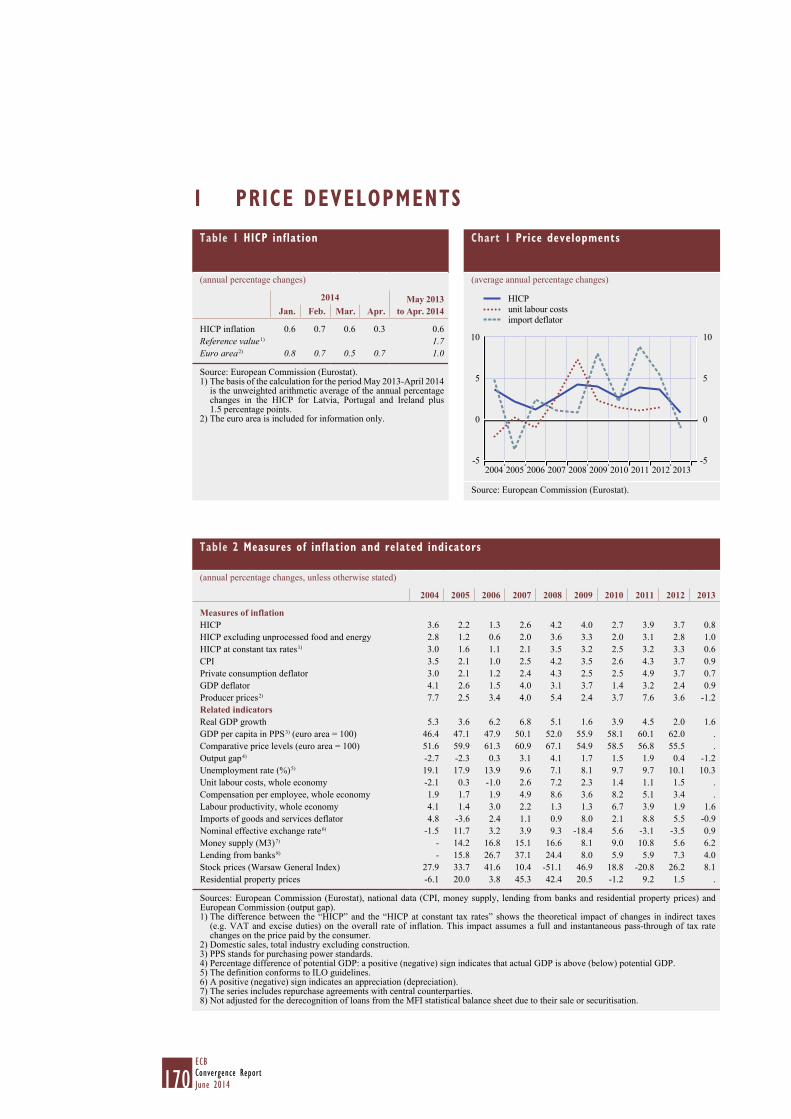
170ECBConvergence ReportJune 2014
1 PRICE DEVELOPMENTSChart 1 Price developments
(average annual percentage changes)
-5
0
5
10
-5
0
5
10
2012 2013
HICPunit labour costsimport deflator
2004 2005 2006 2007 2008 2009 2010 2011
Source: European Commission (Eurostat).
Table 1 HICP inflation
(annual percentage changes)
2014 May 2013 to Apr. 2014 Jan. Feb. Mar. Apr.
HICP inflation 0.6 0.7 0.6 0.3 0.6 Reference value 1) 1.7 Euro area 2) 0.8 0.7 0.5 0.7 1.0
Source: European Commission (Eurostat).1) The basis of the calculation for the period May 2013-April 2014
is the unweighted arithmetic average of the annual percentage changes in the HICP for Latvia, Portugal and Ireland plus 1.5 percentage points.
2) The euro area is included for information only.
Table 2 Measures of inflation and related indicators
(annual percentage changes, unless otherwise stated)
2004 2005 2006 2007 2008 2009 2010 2011 2012 2013
Measures of inflationHICP 3.6 2.2 1.3 2.6 4.2 4.0 2.7 3.9 3.7 0.8 HICP excluding unprocessed food and energy 2.8 1.2 0.6 2.0 3.6 3.3 2.0 3.1 2.8 1.0 HICP at constant tax rates 1) 3.0 1.6 1.1 2.1 3.5 3.2 2.5 3.2 3.3 0.6 CPI 3.5 2.1 1.0 2.5 4.2 3.5 2.6 4.3 3.7 0.9 Private consumption deflator 3.0 2.1 1.2 2.4 4.3 2.5 2.5 4.9 3.7 0.7 GDP deflator 4.1 2.6 1.5 4.0 3.1 3.7 1.4 3.2 2.4 0.9 Producer prices 2) 7.7 2.5 3.4 4.0 5.4 2.4 3.7 7.6 3.6 -1.2 Related indicatorsReal GDP growth 5.3 3.6 6.2 6.8 5.1 1.6 3.9 4.5 2.0 1.6 GDP per capita in PPS 3) (euro area = 100) 46.4 47.1 47.9 50.1 52.0 55.9 58.1 60.1 62.0 . Comparative price levels (euro area = 100) 51.6 59.9 61.3 60.9 67.1 54.9 58.5 56.8 55.5 . Output gap 4) -2.7 -2.3 0.3 3.1 4.1 1.7 1.5 1.9 0.4 -1.2 Unemployment rate (%) 5) 19.1 17.9 13.9 9.6 7.1 8.1 9.7 9.7 10.1 10.3 Unit labour costs, whole economy -2.1 0.3 -1.0 2.6 7.2 2.3 1.4 1.1 1.5 . Compensation per employee, whole economy 1.9 1.7 1.9 4.9 8.6 3.6 8.2 5.1 3.4 . Labour productivity, whole economy 4.1 1.4 3.0 2.2 1.3 1.3 6.7 3.9 1.9 1.6 Imports of goods and services deflator 4.8 -3.6 2.4 1.1 0.9 8.0 2.1 8.8 5.5 -0.9 Nominal effective exchange rate 6) -1.5 11.7 3.2 3.9 9.3 -18.4 5.6 -3.1 -3.5 0.9 Money supply (M3) 7) - 14.2 16.8 15.1 16.6 8.1 9.0 10.8 5.6 6.2 Lending from banks 8) - 15.8 26.7 37.1 24.4 8.0 5.9 5.9 7.3 4.0 Stock prices (Warsaw General Index) 27.9 33.7 41.6 10.4 -51.1 46.9 18.8 -20.8 26.2 8.1 Residential property prices -6.1 20.0 3.8 45.3 42.4 20.5 -1.2 9.2 1.5 .
Sources: European Commission (Eurostat), national data (CPI, money supply, lending from banks and residential property prices) and European Commission (output gap).1) The difference between the “HICP” and the “HICP at constant tax rates” shows the theoretical impact of changes in indirect taxes
(e.g. VAT and excise duties) on the overall rate of inflation. This impact assumes a full and instantaneous pass-through of tax rate changes on the price paid by the consumer.
2) Domestic sales, total industry excluding construction.3) PPS stands for purchasing power standards.4) Percentage difference of potential GDP: a positive (negative) sign indicates that actual GDP is above (below) potential GDP.5) The definition conforms to ILO guidelines.6) A positive (negative) sign indicates an appreciation (depreciation).7) The series includes repurchase agreements with central counterparties.8) Not adjusted for the derecognition of loans from the MFI statistical balance sheet due to their sale or securitisation.
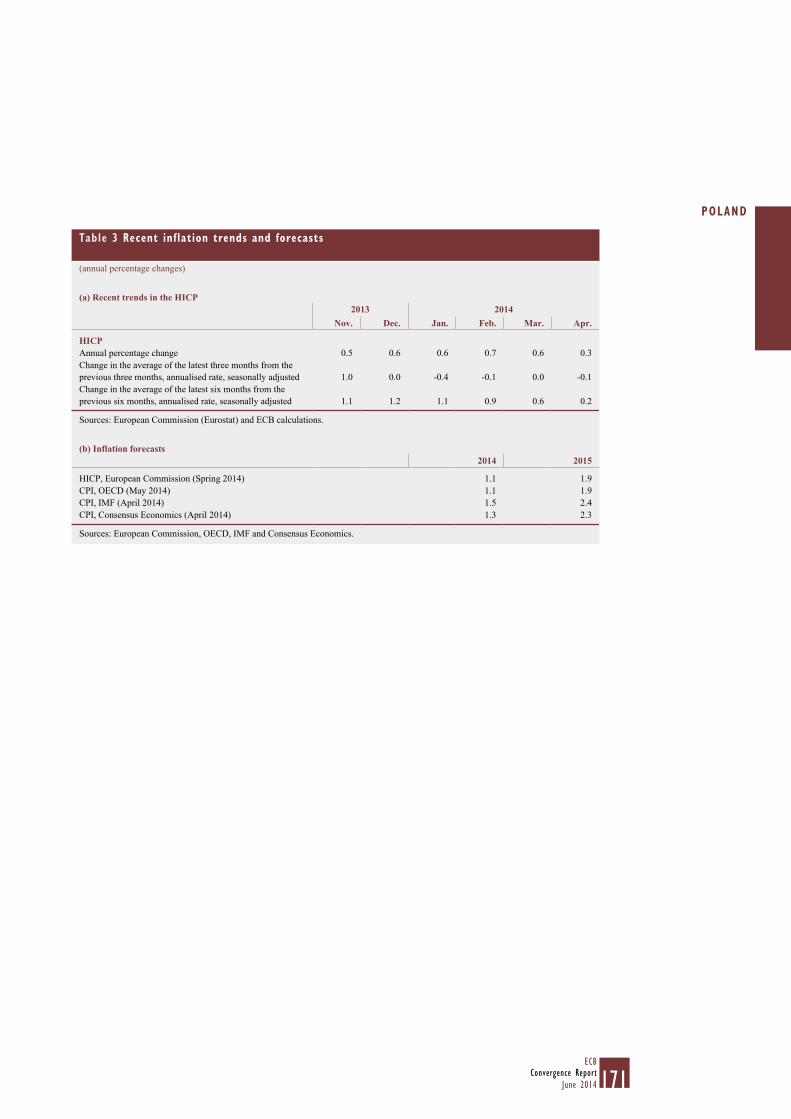
171ECB
Convergence ReportJune 2014
POLAND
Table 3 Recent inflation trends and forecasts
(annual percentage changes)
(a) Recent trends in the HICP2013 2014
Nov. Dec. Jan. Feb. Mar. Apr.
HICPAnnual percentage change 0.5 0.6 0.6 0.7 0.6 0.3 Change in the average of the latest three months from the previous three months, annualised rate, seasonally adjusted 1.0 0.0 -0.4 -0.1 0.0 -0.1 Change in the average of the latest six months from the previous six months, annualised rate, seasonally adjusted 1.1 1.2 1.1 0.9 0.6 0.2
Sources: European Commission (Eurostat) and ECB calculations.
(b) Inflation forecasts2014 2015
HICP, European Commission (Spring 2014) 1.1 1.9 CPI, OECD (May 2014) 1.1 1.9 CPI, IMF (April 2014) 1.5 2.4 CPI, Consensus Economics (April 2014) 1.3 2.3
Sources: European Commission, OECD, IMF and Consensus Economics.

172ECBConvergence ReportJune 2014
2 FISCAL DEVELOPMENTSTable 4 General government fiscal position
(as a percentage of GDP)
2012 2013 2014 1)
General government surplus (+)/deficit (-) -3.9 -4.3 5.7 Reference value -3.0 -3.0 -3.0 Surplus/deficit, net of government investment expenditure 2) 0.7 -0.5 9.5
General government gross debt 55.6 57.0 49.2 Reference value 60.0 60.0 60.0
Sources: European Commission (Eurostat, DG ECFIN) and ECB calculations.1) European Commission projections.2) A positive (negative) sign indicates that the government deficit is lower (higher) than government investment expenditure.
Table 5 General government budgetary position
(as a percentage of GDP)
2004 2005 2006 2007 2008 2009 2010 2011 2012 2013
Total revenue 37.2 39.4 40.2 40.3 39.5 37.2 37.5 38.4 38.3 37.5 Current revenue 37.2 38.8 39.7 39.8 39.1 36.6 36.3 36.6 37.0 36.5
Direct taxes 6.5 7.0 7.5 8.6 8.6 7.4 6.9 7.0 7.2 7.0 Indirect taxes 12.9 13.6 14.2 14.1 14.2 12.8 13.6 13.8 12.9 12.6 Social security contributions 12.3 12.3 12.2 12.0 11.3 11.3 11.1 11.4 12.3 12.2 Other current revenue 5.5 5.9 5.8 5.2 5.0 5.0 4.7 4.4 4.6 4.6
Capital revenue 0.1 0.6 0.5 0.5 0.5 0.6 1.3 1.8 1.3 1.0 Total expenditure 42.6 43.4 43.9 42.2 43.2 44.6 45.4 43.4 42.2 41.9
Current expenditure 38.7 39.0 39.0 37.3 37.7 38.4 39.0 37.2 37.2 37.7 Compensation of employees 10.1 10.0 9.8 9.6 10.0 10.3 10.2 9.7 9.4 9.3 Social benefits other than in kind 16.0 15.7 15.2 14.2 14.0 14.7 14.8 14.1 14.2 14.6 Interest payable 2.8 2.8 2.7 2.3 2.2 2.6 2.7 2.7 2.8 2.6
of which: impact of swaps and FRAs 1) 0.0 0.0 0.0 0.0 0.0 0.0 0.0 0.0 0.0 0.0 Other current expenditure 9.9 10.5 11.4 11.2 11.5 10.7 11.3 10.7 10.8 11.2
Capital expenditure 3.9 4.4 4.8 4.8 5.5 6.2 6.4 6.2 4.9 4.1
Surplus (+)/deficit (-) -5.4 -4.1 -3.6 -1.9 -3.7 -7.5 -7.8 -5.1 -3.9 -4.3
Primary balance -2.6 -1.3 -1.0 0.4 -1.5 -4.8 -5.1 -2.4 -1.0 -1.7 Surplus/deficit, net of government investment expenditure -2.0 -0.7 0.3 2.3 0.9 -2.3 -2.2 0.7 0.7 -0.5
Sources: ESCB and European Commission (Eurostat).Notes: Differences between totals and the sum of their components are due to rounding. Interest payable as reported under the excessive deficit procedure. The item “impact of swaps and FRAs” is equal to the difference between the interest (or deficit/surplus) as defined in the excessive deficit procedure and in the ESA 95. See Regulation (EC) No 2558/2001 of the European Parliament and of the Council of 3 December 2001 amending Council Regulation (EC) No 2223/96 as regards the reclassification of settlements under swap arrangements and under forward rate agreements (0J L 344, 28.12.2001, p. 1).1) FRAs stands for forward rate agreements.
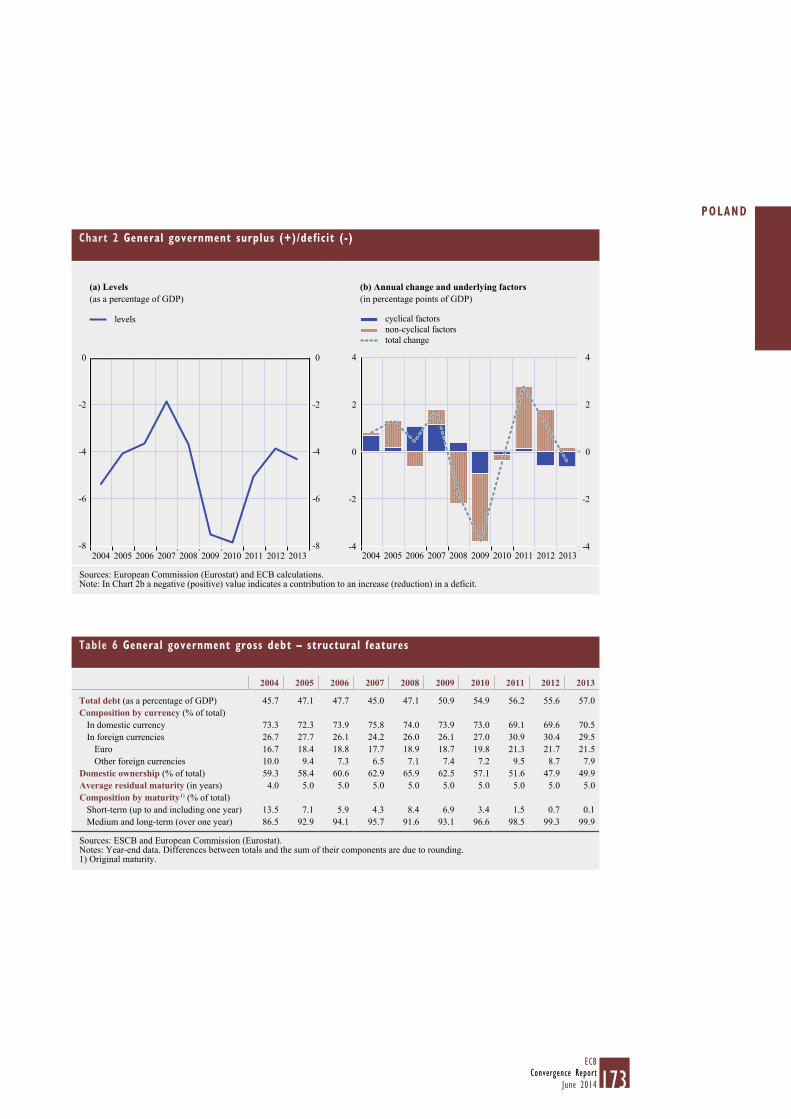
173ECB
Convergence ReportJune 2014
POLAND
Chart 2 General government surplus (+)/deficit (-)
(a) Levels(as a percentage of GDP)
(b) Annual change and underlying factors
(in percentage points of GDP)
-8
-6
-4
-2
0
-8
-6
-4
-2
0
levels
2012 20132004 2005 2006 2007 2008 2009 2010 2011-4
-2
0
2
4
-4
-2
0
2
4
cyclical factorsnon-cyclical factorstotal change
2012 20132004 2005 2006 2007 2008 2009 2010 2011
Sources: European Commission (Eurostat) and ECB calculations.Note: In Chart 2b a negative (positive) value indicates a contribution to an increase (reduction) in a deficit.
Table 6 General government gross debt – structural features
2004 2005 2006 2007 2008 2009 2010 2011 2012 2013
Total debt (as a percentage of GDP) 45.7 47.1 47.7 45.0 47.1 50.9 54.9 56.2 55.6 57.0 Composition by currency (% of total)
In domestic currency 73.3 72.3 73.9 75.8 74.0 73.9 73.0 69.1 69.6 70.5 In foreign currencies 26.7 27.7 26.1 24.2 26.0 26.1 27.0 30.9 30.4 29.5
Euro 16.7 18.4 18.8 17.7 18.9 18.7 19.8 21.3 21.7 21.5 Other foreign currencies 10.0 9.4 7.3 6.5 7.1 7.4 7.2 9.5 8.7 7.9
Domestic ownership (% of total) 59.3 58.4 60.6 62.9 65.9 62.5 57.1 51.6 47.9 49.9 Average residual maturity (in years) 4.0 5.0 5.0 5.0 5.0 5.0 5.0 5.0 5.0 5.0 Composition by maturity 1) (% of total)
Short-term (up to and including one year) 13.5 7.1 5.9 4.3 8.4 6.9 3.4 1.5 0.7 0.1 Medium and long-term (over one year) 86.5 92.9 94.1 95.7 91.6 93.1 96.6 98.5 99.3 99.9
Sources: ESCB and European Commission (Eurostat).Notes: Year-end data. Differences between totals and the sum of their components are due to rounding.1) Original maturity.
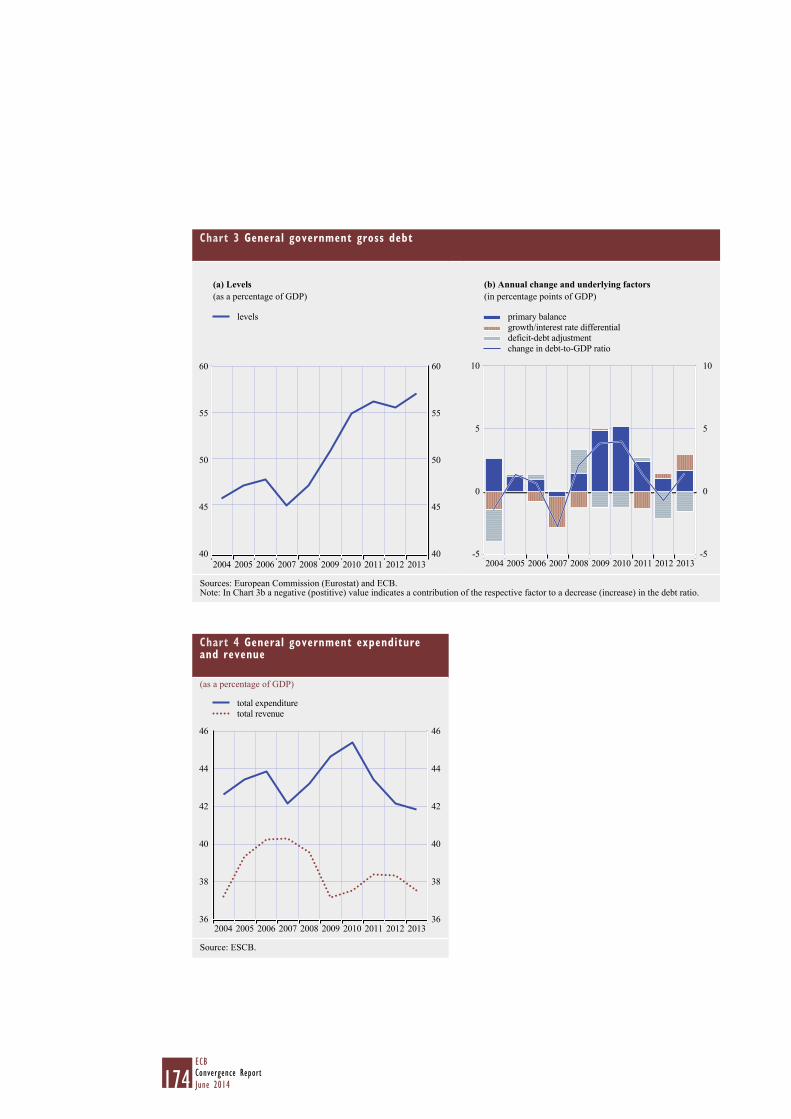
174ECBConvergence ReportJune 2014
Chart 3 General government gross debt
(a) Levels(as a percentage of GDP)
(b) Annual change and underlying factors(in percentage points of GDP)
60
55
50
45
40
60
55
50
45
402004 2005 2006 2007 2008 2009 2010 2011 2012 2013
levels
-5
0
5
10
-5
0
5
10
primary balancegrowth/interest rate differentialdeficit-debt adjustmentchange in debt-to-GDP ratio
2012 20132004 2005 2007 20092006 2008 2010 2011
Sources: European Commission (Eurostat) and ECB.Note: In Chart 3b a negative (postitive) value indicates a contribution of the respective factor to a decrease (increase) in the debt ratio.
Chart 4 General government expenditure and revenue
(as a percentage of GDP)
36
38
40
42
44
46
36
38
40
42
44
46
2012 2013
total expendituretotal revenue
2004 2005 20072006 2008 2009 2010 2011
Source: ESCB.
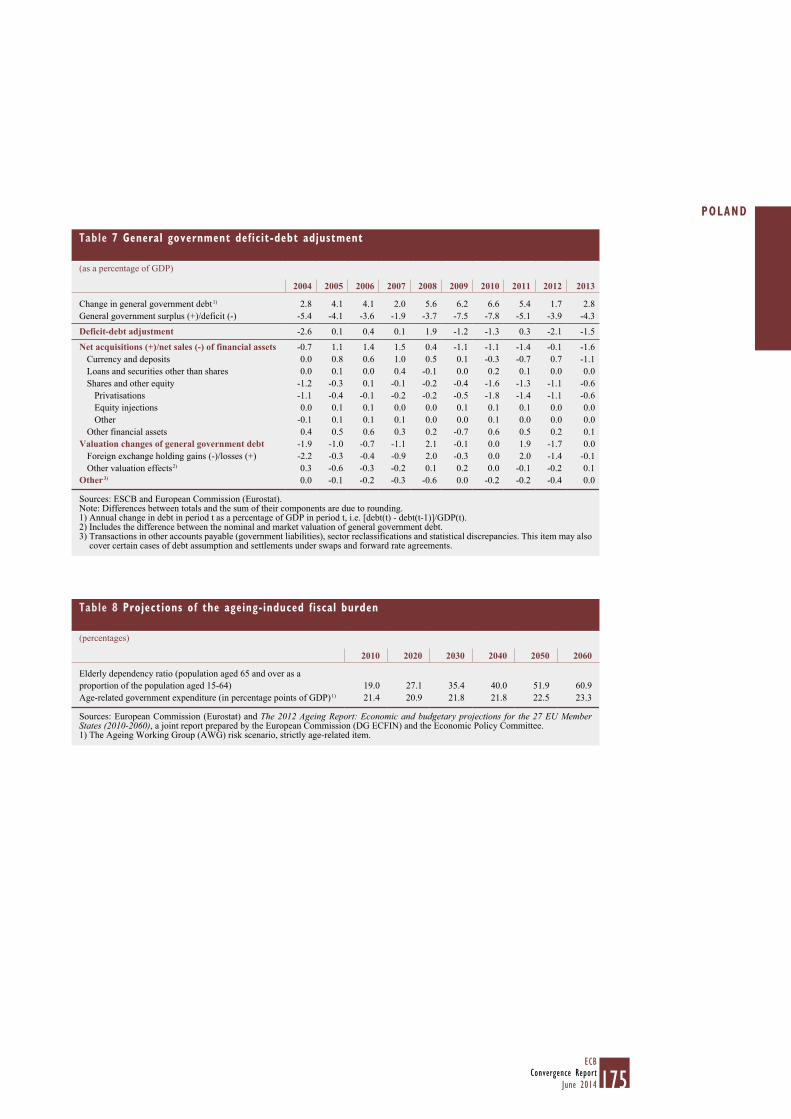
175ECB
Convergence ReportJune 2014
POLAND
Table 7 General government deficit-debt adjustment
(as a percentage of GDP)
2004 2005 2006 2007 2008 2009 2010 2011 2012 2013
Change in general government debt 1) 2.8 4.1 4.1 2.0 5.6 6.2 6.6 5.4 1.7 2.8 General government surplus (+)/deficit (-) -5.4 -4.1 -3.6 -1.9 -3.7 -7.5 -7.8 -5.1 -3.9 -4.3
Deficit-debt adjustment -2.6 0.1 0.4 0.1 1.9 -1.2 -1.3 0.3 -2.1 -1.5
Net acquisitions (+)/net sales (-) of financial assets -0.7 1.1 1.4 1.5 0.4 -1.1 -1.1 -1.4 -0.1 -1.6 Currency and deposits 0.0 0.8 0.6 1.0 0.5 0.1 -0.3 -0.7 0.7 -1.1 Loans and securities other than shares 0.0 0.1 0.0 0.4 -0.1 0.0 0.2 0.1 0.0 0.0 Shares and other equity -1.2 -0.3 0.1 -0.1 -0.2 -0.4 -1.6 -1.3 -1.1 -0.6
Privatisations -1.1 -0.4 -0.1 -0.2 -0.2 -0.5 -1.8 -1.4 -1.1 -0.6 Equity injections 0.0 0.1 0.1 0.0 0.0 0.1 0.1 0.1 0.0 0.0 Other -0.1 0.1 0.1 0.1 0.0 0.0 0.1 0.0 0.0 0.0
Other financial assets 0.4 0.5 0.6 0.3 0.2 -0.7 0.6 0.5 0.2 0.1 Valuation changes of general government debt -1.9 -1.0 -0.7 -1.1 2.1 -0.1 0.0 1.9 -1.7 0.0
Foreign exchange holding gains (-)/losses (+) -2.2 -0.3 -0.4 -0.9 2.0 -0.3 0.0 2.0 -1.4 -0.1 Other valuation effects 2) 0.3 -0.6 -0.3 -0.2 0.1 0.2 0.0 -0.1 -0.2 0.1
Other 3) 0.0 -0.1 -0.2 -0.3 -0.6 0.0 -0.2 -0.2 -0.4 0.0
Sources: ESCB and European Commission (Eurostat).Note: Differences between totals and the sum of their components are due to rounding.1) Annual change in debt in period t as a percentage of GDP in period t, i.e. [debt(t) - debt(t-1)]/GDP(t).2) Includes the difference between the nominal and market valuation of general government debt.3) Transactions in other accounts payable (government liabilities), sector reclassifications and statistical discrepancies. This item may also
cover certain cases of debt assumption and settlements under swaps and forward rate agreements.
Table 8 Projections of the ageing-induced fiscal burden
(percentages)
2010 2020 2030 2040 2050 2060
Elderly dependency ratio (population aged 65 and over as a proportion of the population aged 15-64) 19.0 27.1 35.4 40.0 51.9 60.9 Age-related government expenditure (in percentage points of GDP) 1) 21.4 20.9 21.8 21.8 22.5 23.3
Sources: European Commission (Eurostat) and The 2012 Ageing Report: Economic and budgetary projections for the 27 EU Member States (2010-2060), a joint report prepared by the European Commission (DG ECFIN) and the Economic Policy Committee.1) The Ageing Working Group (AWG) risk scenario, strictly age-related item.
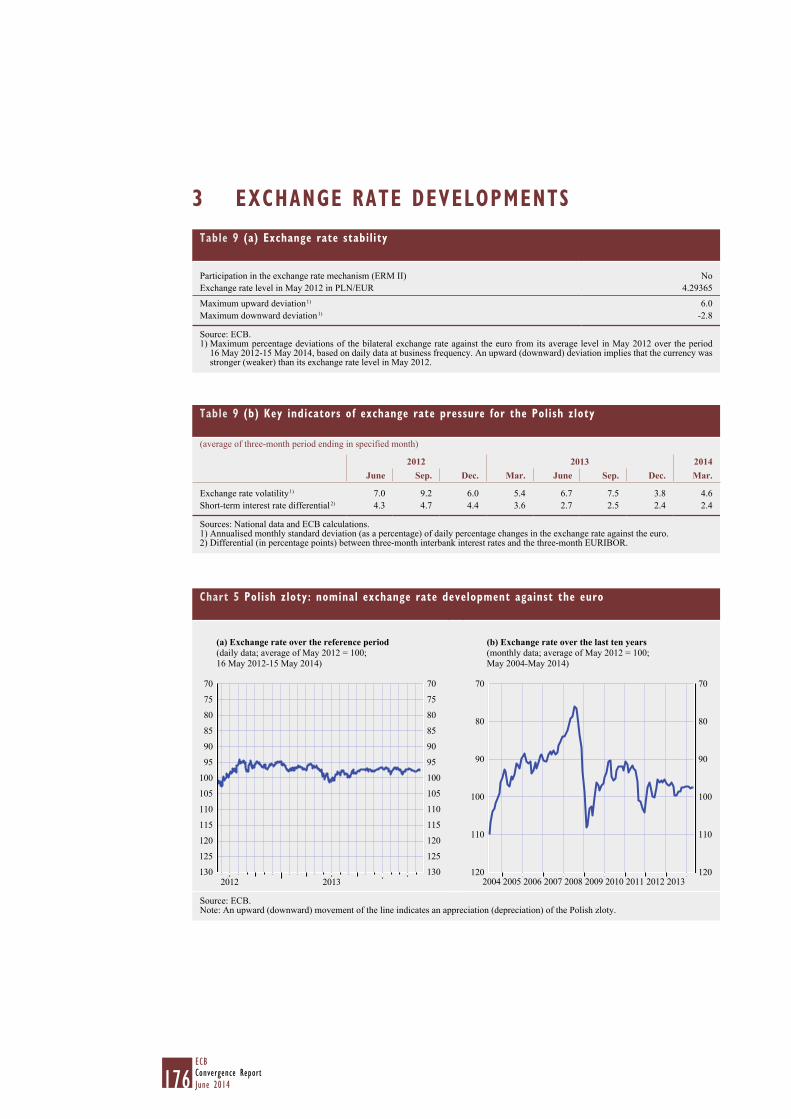
176ECBConvergence ReportJune 2014
3 EXCHANGE RATE DEVELOPMENTS
Chart 5 Polish zloty: nominal exchange rate development against the euro
(a) Exchange rate over the reference period (daily data; average of May 2012 = 100; 16 May 2012-15 May 2014)
(b) Exchange rate over the last ten years (monthly data; average of May 2012 = 100; May 2004-May 2014)
130
125
120
115
110
105
100
95
90
85
80
75
70
130
125
120
115
110
105
100
95
90
85
80
75
70
2012 2013120
110
100
90
70
80
120
110
100
90
70
80
2012 20132006 20072004 2005 2008 2009 2010 2011
Source: ECB.Note: An upward (downward) movement of the line indicates an appreciation (depreciation) of the Polish zloty.
Table 9 (a) Exchange rate stability
Participation in the exchange rate mechanism (ERM II) NoExchange rate level in May 2012 in PLN/EUR 4.29365
Maximum upward deviation 1) 6.0Maximum downward deviation 1) -2.8
Source: ECB.1) Maximum percentage deviations of the bilateral exchange rate against the euro from its average level in May 2012 over the period
16 May 2012-15 May 2014, based on daily data at business frequency. An upward (downward) deviation implies that the currency was stronger (weaker) than its exchange rate level in May 2012.
Table 9 (b) Key indicators of exchange rate pressure for the Polish zloty
(average of three-month period ending in specified month)
2012 2013 2014June Sep. Dec. Mar. June Sep. Dec. Mar.
Exchange rate volatility 1) 7.0 9.2 6.0 5.4 6.7 7.5 3.8 4.6Short-term interest rate differential 2) 4.3 4.7 4.4 3.6 2.7 2.5 2.4 2.4
Sources: National data and ECB calculations.1) Annualised monthly standard deviation (as a percentage) of daily percentage changes in the exchange rate against the euro.2) Differential (in percentage points) between three-month interbank interest rates and the three-month EURIBOR.

177ECB
Convergence ReportJune 2014
POLAND
Table 10 Polish zloty: real exchange rate developments
(monthly data; percentage deviation in April 2014 from the ten-year average calculated for the period May 2004-April 2014)
Apr. 2014
Real bilateral exchange rate against the euro 1) -0.4 Memo items:
Nominal effective exchange rate 2) -3.8 Real effective exchange rate 1), 2) -1.2
Source: ECB.Note: A positive (negative) sign indicates an appreciation (depreciation).1) Based on HICP and CPI developments.2) Effective exchange rate against the euro, the currencies of the non-euro area EU Member States and those of ten other major trading
partners.
Table 11 External developments
(as a percentage of GDP, unless otherwise stated)
2004 2005 2006 2007 2008 2009 2010 2011 2012 2013
Balance of paymentsCurrent account and capital account balance 1) -4.8 -2.1 -3.2 -5.1 -5.4 -2.2 -3.3 -3.0 -1.5 1.0
Current account balance -5.3 -2.4 -3.8 -6.2 -6.6 -3.9 -5.1 -5.0 -3.7 -1.3 Goods balance -2.4 -1.0 -2.1 -4.4 -5.8 -1.7 -2.5 -2.7 -1.4 0.6 Services balance 0.0 0.2 0.2 1.1 1.0 1.1 0.7 1.1 1.2 1.3 Income balance -3.3 -2.2 -2.8 -3.8 -2.4 -3.8 -4.1 -4.5 -4.6 -4.2 Current transfers balance 0.4 0.6 0.9 1.0 0.6 0.6 0.8 1.2 1.1 1.0
Capital account balance 0.5 0.3 0.6 1.1 1.1 1.6 1.8 2.0 2.2 2.3 Combined direct and portfolio investment balance 1) 8.4 6.3 2.3 2.8 1.3 5.2 6.8 5.6 5.2 -0.3
Direct investment balance 4.7 2.3 3.1 4.3 2.0 1.9 1.4 2.4 1.1 -0.2 Portfolio investment balance 3.7 4.1 -0.8 -1.5 -0.6 3.2 5.4 3.2 4.1 -0.1
Other investment balance -5.0 -1.4 1.8 6.5 6.0 3.1 2.0 0.5 -1.2 0.8 Reserve assets -0.4 -2.7 -0.8 -3.0 0.8 -3.3 -3.3 -1.2 -2.3 -0.2 Exports of goods and services 37.5 37.1 40.3 40.8 39.9 39.4 42.2 45.1 46.6 47.8 Imports of goods and services 39.8 37.9 42.3 44.1 44.7 40.0 44.1 46.7 46.8 45.8 Net international investment position 2) -41.6 -42.5 -45.7 -50.1 -56.3 -58.8 -65.4 -64.0 -66.5 -68.6 Gross external debt 2) 42.0 44.1 46.6 48.4 56.8 59.4 66.4 72.3 71.0 69.8 Memo item:Export market shares 3) 0.84 0.87 0.93 1.00 1.07 1.08 1.05 1.04 1.01 1.07
Source: ECB.1) Differences between totals and the sum of their components are due to rounding.2) End-of-period outstanding amounts.3) As a percentage of total world goods and services exports.
Table 12 Indicators of integration with the euro area
(as a percentage of the total, unless otherwise stated)
2004 2005 2006 2007 2008 2009 2010 2011 2012 2013
External trade with the euro areaExports of goods 59.5 57.6 56.5 55.8 54.9 57.2 56.3 54.7 52.7 51.5 Imports of goods 60.4 61.2 58.7 59.0 58.4 58.6 56.8 55.9 54.2 54.5 Investment position with the euro area Inward direct investment 1) 75.0 74.5 74.3 74.0 74.4 74.2 74.1 75.5 75.9 77.9 Outward direct investment 1) 46.9 23.7 43.3 35.8 41.2 44.6 46.6 52.7 56.5 61.8 Portfolio investment liabilities 1) 52.1 58.3 57.3 54.2 58.0 52.9 52.2 50.4 47.9 . Portfolio investment assets 1) 26.0 26.6 35.0 53.5 53.0 52.9 53.1 53.1 50.6 .
Memo items: External trade with the EU
Exports of goods 80.8 78.9 79.3 79.2 78.2 79.9 79.3 78.2 76.2 74.8 Imports of goods 75.3 75.4 73.1 73.4 71.9 72.7 70.8 70.0 67.7 68.6
Sources: ESCB, European Commission (Eurostat) and IMF.1) End-of-period outstanding amounts.
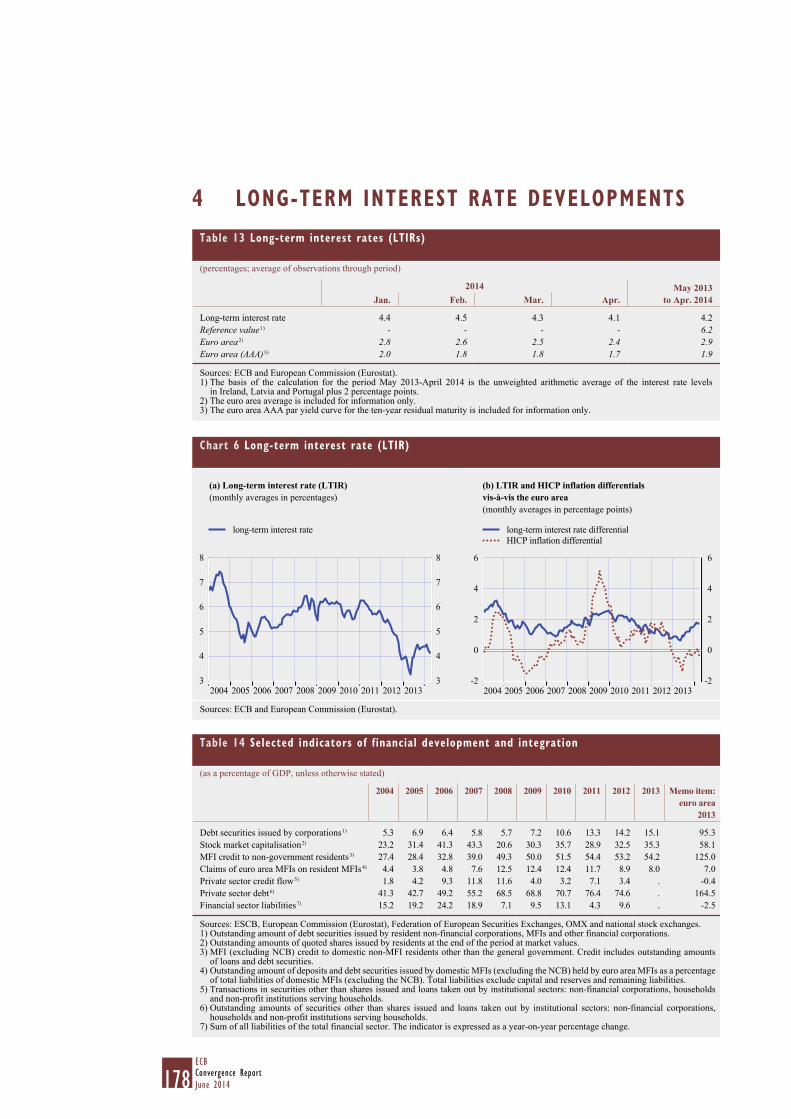
178ECBConvergence ReportJune 2014
4 LONG-TERM INTEREST RATE DEVELOPMENTS
Chart 6 Long-term interest rate (LTIR)
(a) Long-term interest rate (LTIR)(monthly averages in percentages)
(b) LTIR and HICP inflation differentials vis-à-vis the euro area(monthly averages in percentage points)
3
4
5
6
7
8
3
4
5
6
7
8
2010 2011 2012 2013
long-term interest rate
2004 2005 2006 2007 2008 2009-2
0
2
4
6
-2
0
2
4
6
2012 20132004 2005 2006 2007 2008 2009 2010 2011
long-term interest rate differentialHICP inflation differential
Sources: ECB and European Commission (Eurostat).
Table 13 Long-term interest rates (LTIRs)
(percentages; average of observations through period)
2014 May 2013 to Apr. 2014Jan. Feb. Mar. Apr.
Long-term interest rate 4.4 4.5 4.3 4.1 4.2 Reference value 1) - - - - 6.2 Euro area 2) 2.8 2.6 2.5 2.4 2.9 Euro area (AAA) 3) 2.0 1.8 1.8 1.7 1.9
Sources: ECB and European Commission (Eurostat).1) The basis of the calculation for the period May 2013-April 2014 is the unweighted arithmetic average of the interest rate levels
in Ireland, Latvia and Portugal plus 2 percentage points.2) The euro area average is included for information only.3) The euro area AAA par yield curve for the ten-year residual maturity is included for information only.
Table 14 Selected indicators of financial development and integration
(as a percentage of GDP, unless otherwise stated)
2004 2005 2006 2007 2008 2009 2010 2011 2012 2013 Memo item: euro area
2013
Debt securities issued by corporations 1) 5.3 6.9 6.4 5.8 5.7 7.2 10.6 13.3 14.2 15.1 95.3 Stock market capitalisation 2) 23.2 31.4 41.3 43.3 20.6 30.3 35.7 28.9 32.5 35.3 58.1 MFI credit to non-government residents 3) 27.4 28.4 32.8 39.0 49.3 50.0 51.5 54.4 53.2 54.2 125.0 Claims of euro area MFIs on resident MFIs 4) 4.4 3.8 4.8 7.6 12.5 12.4 12.4 11.7 8.9 8.0 7.0 Private sector credit flow 5) 1.8 4.2 9.3 11.8 11.6 4.0 3.2 7.1 3.4 . -0.4 Private sector debt 6) 41.3 42.7 49.2 55.2 68.5 68.8 70.7 76.4 74.6 . 164.5 Financial sector liabilities 7) 15.2 19.2 24.2 18.9 7.1 9.5 13.1 4.3 9.6 . -2.5
Sources: ESCB, European Commission (Eurostat), Federation of European Securities Exchanges, OMX and national stock exchanges.1) Outstanding amount of debt securities issued by resident non-financial corporations, MFIs and other financial corporations.2) Outstanding amounts of quoted shares issued by residents at the end of the period at market values.3) MFI (excluding NCB) credit to domestic non-MFI residents other than the general government. Credit includes outstanding amounts
of loans and debt securities.4) Outstanding amount of deposits and debt securities issued by domestic MFIs (excluding the NCB) held by euro area MFIs as a percentage
of total liabilities of domestic MFIs (excluding the NCB). Total liabilities exclude capital and reserves and remaining liabilities.5) Transactions in securities other than shares issued and loans taken out by institutional sectors: non-financial corporations, households
and non-profit institutions serving households.6) Outstanding amounts of securities other than shares issued and loans taken out by institutional sectors: non-financial corporations,
households and non-profit institutions serving households.7) Sum of all liabilities of the total financial sector. The indicator is expressed as a year-on-year percentage change.
179ECB
Convergence ReportJune 2014
ROMANIA
5.7 ROMANIA
5.7.1 PRICE DEVELOPMENTS
Over the reference period from May 2013 to April 2014, the 12-month average rate of HICP inflation in Romania was 2.1%, i.e. above the reference value of 1.7% for the criterion on price stability (see Table 1). On the basis of the most recent information, the 12-month average rate of HICP inflation is expected to increase in the coming months.
Looking back over a longer period, the average annual rate of HICP inflation in Romania decreased from very high levels in the early 2000s up to 2007, when the downward trend was reversed. In 2009 inflation fell again and broadly stabilised at an elevated level, before declining to historically low levels in 2012 and 2013 (see Chart 1). More specifically, annual HICP inflation declined from 11.9% in 2004 to 4.9% in 2007, before picking up to 7.9% in 2008, owing to the combined effects of supply-side shocks and demand pressures. In 2009 inflation once again fell somewhat, reflecting lower commodity prices and the contraction in economic activity, which more than offset the impact of a significant depreciation of the leu. From 2009 to 2011 average annual HICP inflation ranged between 5.6% and 6.1%, mirroring closely the developments in energy and food prices, which together represented roughly 50% of Romania’s HICP basket of goods and services, as well as increases in excise duties in 2009-10 and in the value added tax (VAT) rate in 2010. In 2012 and 2013 it fell to 3.4% and 3.2% respectively owing to weak domestic demand, a good harvest in 2013 and a reduction in the VAT rate on flour and bakery products in September 2013.
These inflation developments took place against the background of a number of important policy choices, most notably the orientation of monetary policy towards the achievement of price stability, asenshrinedinthecentralbanklaw.In2005BancaNaţionalăaRomânieishiftedtoaninflation-targeting framework combined with a managed floating exchange rate regime. The annual CPI inflation target was initially set at 7.5% and was reduced gradually to stand at 3.5% in 2009 and 2010, 3.0% in 2011 and 2012, and 2.5% from 2013 onwards, with a 1 percentage point variation band around the central target. Following a certain amount of fiscal consolidation between 2002 and 2005, the fiscal deficit started to rise again as of 2006 and recorded sharp increases in 2008 and 2009. However, from 2010 the Romanian government implemented more forcefully the fiscal consolidation measures agreed in the context of the three EU-IMF financial assistance programmes. The current two-year precautionary financial assistance programme was approved at the end of September 2013.
Inflation dynamics over the past ten years should be viewed against a background of overheating in the economy from 2004 to 2008, which was followed by a sharp contraction in economic activity in 2009 and 2010, and a moderate recovery from 2011 to 2013 (see Table 2). Labour market conditions reflected economic developments, although the impact of the business cycle on unemployment was more muted. During the period 2004-08 unemployment declined and wage growth significantly outpaced productivity growth, which in turn drove up unit labour cost growth to double-digit levels. Thereafter, the unemployment rate picked up again, from 5.8% in 2008 to 7.3% in 2013. Wage growth peaked at 31.9% in 2008. Following three years of wage cuts from 2009 to 2011, including a 25% cut in public sector wages in 2010, compensation per employee rose again thereafter, with average annual growth rates of 3.6% in 2012 and 6.2% in 2013. At the same time unit labour cost growth fell from 22.9% in 2008 to 2.5% in 2013. After three years of low, and in some cases negative, annual rates of change in unit labour costs from 2009 to 2011, unit labour cost growth picked up to 4.4% in 2012, owing to a 0.8% fall in labour productivity growth.
180ECBConvergence ReportJune 2014
As labour productivity growth went up to 3.7% in 2013, unit labour cost growth decreased again to 2.5%. These developments are attributable, inter alia, to a reduction in public sector employment, a full restoration of public sector wages and large increases in minimum wages. In addition, there is uncertainty surrounding the quality of private sector wage data, particularly given the scale of the informal economy. House prices continued to decline from their peak in 2007, falling by a total of more than 60% up to 2013, with the dynamics of the house price declines having significantly decelerated in recent years. Overall, import prices remained rather volatile during the period under review, mainly reflecting developments in commodity prices and the volatility of the effective exchange rate (EER).
Looking at recent developments, annual HICP inflation broadly followed a downward path from its peak of 5.4% in September 2012 to 1.1% in September 2013, before picking up somewhat to 1.6% in April 2014 (see Table 3a) following an increase in excise duties on fuel. The overall marked decline is attributable to a reduction in the VAT rate on flour and bakery products, easing pressures from energy and food prices on the back of global price developments, a very good harvest, downward base effects and the disinflation pressures exerted by the negative output gap and falling inflation expectations. From 2011 HICP inflation excluding unprocessed food and energy decelerated more strongly than overall inflation. This partly reflects moderate increases in administered prices, which account for 14% of Romania’s HICP basket of goods and services, following the ongoing deregulation of prices for electricity and natural gas in the context of the EU-IMF precautionary financial assistance programme. The EER of the leu depreciated from mid-2011 to the end of 2012, thus adding to import price inflation. However, from 2013 the situation reversed, with the import price deflator once more slipping into negative territory. Recent inflation developments should be viewed in the light of sluggish domestic demand, despite a clearly improved macroeconomic outlook. Supported by strong increases in exports (including to outside the EU) and a good harvest, real GDP grew by 3.5%, on average, in 2013, after a very moderate 0.6% in 2012. The sharp decline in the inflation rate – temporarily even to levels below the lower side of the targeting band – and a favourableinflationoutlookenabledBancaNaţionalăaRomânieitocutkeyinterestratesbyatotalof 175 basis points between July 2013 and February 2014 to a record low of 3.5%.
The latest available forecasts from major international institutions project average annual inflation to rise gradually from historically low levels and to range from 2.2% to 2.5% in 2014 and from 3.0% to 3.3% in 2015 (see Table 3b). Inflationary pressures in Romania are expected to remain contained, given the weakness in domestic demand and the fragile international environment, which should also contribute to moderate wage increases in the private sector. Annual HICP inflation is expected to fall further in the coming months, owing to downward base effects, a persistently negative output gap and low food prices. Following an increase of excise duties on fuel, inflation is projected to pick up again as of April 2014 towards the upper side of the targeting band, as the favourable effects of measures such as the VAT cut in September 2013 are expected to wane. Thereafter, inflation is expected to stabilise within the inflation targeting band. While the immediate risks to the inflation outlook are broadly balanced, upside risks prevail in the medium term. They relate to a stronger than expected rise in global commodity prices and depreciation pressures on the leu resulting from renewed tensions in global financial markets. Risks from domestic sources are associated with the impact of further deregulation of energy prices and hikes in excise duties, as well as persistent uncertainty regarding the progress made on implementing the structural reform measures agreed in the context of the precautionary financial assistance programme. Moreover, there are risks stemming from possible fiscal slippages in the context of the presidential elections scheduled for December 2014. Weaker than expected economic activity constitutes a downside risk to the inflation outlook. Looking further ahead, the catching-up process is likely to have a bearing

181ECB
Convergence ReportJune 2014
ROMANIA
on inflation and/or the nominal exchange rate over the coming years, given that GDP per capita and price levels are still significantly lower in Romania than in the euro area (see Table 2). However, it is difficult to assess the exact magnitude of the effect resulting from this catching-up process.
Achieving an environment that is conducive to sustainable convergence in Romania requires, among other things, a stability-oriented monetary policy and persistence with structural reforms in line with Romania’s commitments under the EU-IMF financial assistance programmes. Regarding macroeconomic imbalances, the country is subject to surveillance under a macroeconomic adjustment programme supported by financial assistance. Specifically, progress in the areas below will help to achieve an environment that is conducive to sustainable price stability and promote competitiveness and employment growth.
With regard to structural reforms, the government should continue with product market reforms to boost investment and competition. The deregulation of energy prices, improvements to the quality of the energy and transportation infrastructure, and the reform of state-owned enterprises should continue as planned. There is also a need for further improvements to the institutional, judicial, regulatory and business environment, including the fight against corruption, which would also help to enhance Romania’s absorption capacity of EU funds. In terms of the competitiveness of the economy, it is essential to enhance labour flexibility and to better align wage growth with productivity gains. Measures aimed at reducing youth and long-term unemployment should be implemented, and training and education improved.
Financial sector policies should be geared towards continuing to safeguard financial stability, thereby ensuring a sound contribution to economic growth from the financial sector. In order to minimise the potential risks to financial stability associated with a high proportion of foreign currency loans, it is necessary for Romania to continue to fully apply the recommendation of the ESRB on lending in foreign currencies,18 with which it was considered to be fully compliant in the follow-up report published by the ESRB in November 2013. Close cooperation between home and host country supervisory authorities is important to ensure the effective implementation of these measures. Finally, financial stability could benefit from Romania’s participation in the SSM, which will take up its prudential supervisory tasks in November 2014.
5.7.2 FISCAL DEVELOPMENTS
Romania is not currently subject to an EU Council decision on the existence of an excessive deficit. In the reference year 2013 the general government budget balance showed a deficit of 2.3% of GDP, i.e. below the 3% reference value. The general government gross debt-to-GDP ratio was 38.4%, i.e. well below the 60% reference value (see Table 4). The budget balance ratio improved by 0.7 percentage point compared with the previous year, while the public debt ratio increased by 0.4 percentage point. In 2014 the deficit ratio is forecast by the European Commission to decline to 2.2% and the government debt ratio to increase to 39.9%. With regard to other fiscal factors, the deficit ratio did not exceed the ratio of public investment to GDP in 2013, nor is it expected to exceed it in 2014.
Looking at developments in Romania’s budgetary position over the period from 2004 to 2013, after standing at 1.2% in 2004 and 2005, the deficit-to-GDP ratio began to rise and recorded sharp increases in 2008 and 2009 (when it reached 9.0% of GDP). This upward trend has been reversed
18 See Recommendation (ESRB/2011/1) of the European Systemic Risk Board of 21 September 2011 on lending in foreign currencies.
182ECBConvergence ReportJune 2014
since 2010 (see Table 5 and Chart 2a). As the deficit-to-GDP ratio rose above the 3% of GDP reference value in 2008, the ECOFIN Council decided on 7 July 2009 that an excessive deficit situation existed in Romania and initially set the deadline for correcting it for 2011. This deadline was extended to 2012 following the ECOFIN Council’s recommendation of 12 February 2010. The excessive deficit procedure for Romania was abrogated in June 2013, as the country reached a deficit of 3% of GDP in 2012.
European Commission estimates indicate that in 2009 and 2010, when the financial and economic crisis heavily affected public finances, cyclical factors had a negative, albeit declining, impact on the budget balance (see Chart 2b). Non-cyclical factors contributed to an increase in the budget deficit overall from before 2009, but particularly in 2008. This trend has been reversed since 2010, when the Romanian government implemented more forcefully fiscal consolidation measures agreed under the financial assistance programme led by the EU and the IMF. Fiscal consolidation packages included sizeable increases in indirect tax rates and substantial wage cuts in the public sector, as well as in most social transfers, excluding pensions. Moreover, the pace of adjustment in public sector employment was significantly faster than expected. In the absence of any substantial temporary and one-off factors before 2010, the underlying changes in the budget deficit seem to reflect a structural deterioration in Romania’s fiscal position until 2009 and consolidation thereafter.
Turning to developments in general government gross debt, the debt-to-GDP ratio increased cumulatively by 19.7 percentage points between 2004 and 2013, particularly between 2009 and 2012 (see Chart 3a and Table 6). Among the factors underlying the annual change in the debt ratio, the primary budget balance started to have a debt-increasing impact from 2006 onwards, reaching a peak in 2009 (see Chart 3b). Similarly, the growth-interest rate differential had a debt-increasing impact between 2009 and 2010, which was a result of deteriorating macroeconomic and financial conditions. In 2013 the slight increase in the general government debt-to-GDP ratio mainly reflected a persistently small primary deficit ratio.
As regards Romania’s general government debt structure, the share of government debt with a short-term maturity declined from 16.2% in 2004 to 9.4% in 2006, before increasing to 24.5% in 2010 and then declining again to 6.2% in 2013 (see Table 6). Taking into account the level of the debt ratio, fiscal balances are relatively insensitive to changes in interest rates. The proportion of government debt denominated in foreign currency is high (56.6% in 2013). Given the overall debt level, fiscal balances are also relatively sensitive to changes in exchange rates. During the crisis that hit Romania in 2009, the share of debt with a short-term maturity continued to rise, pointing to an increase in debt-related vulnerabilities, before starting to decline again in 2011. The share of debt denominated in foreign currency remained relatively stable. At the same time, the Romanian government has not incurred contingent liabilities resulting from government interventions to support financial institutions and financial markets during the crisis (see Section 5.9).
With regard to other fiscal indicators (see Chart 4 and Table 5), the general government total expenditure-to-GDP ratio increased from 33.6% in 2004 to 35% in 2013. After peaking at 41.1% of GDP in 2009, the expenditure ratio declined between 2010 and 2013, mainly as a result of lower compensation of employees reflecting sizeable wage and employment reductions in the public sector, as well as social benefits other than in kind. Capital spending increased as a ratio of GDP in the review period, but has been declining since 2012. Total government revenue as a share of GDP increased slightly from 32.3% of GDP in 2004 to 32.7% in 2013. After peaking at 35.3% of GDP in 2007, the total revenue-to-GDP ratio declined towards the end of 2008 and in 2009 following the financial and economic crisis. This trend was reversed in 2010, mainly as a result of significant
183ECB
Convergence ReportJune 2014
ROMANIA
indirect tax hikes, which had a positive carry-over effect in 2011. Total government revenue then stabilised at current levels.
Looking ahead, Romania’s medium-term fiscal policy strategy, as presented in the 2014 convergence programme (dated April 2014), envisages a decline in the deficit ratio to 2.2% of GDP in 2014. The deficit has to be reduced to 2.2% of GDP in 2014 in accordance with Romania’s commitments under the EU-IMF precautionary financial assistance programme. The new target exceeds the original target of 2.0% of GDP (in both cash and ESA terms) by 0.2 percentage point in order to allow for higher EU co-financing. The convergence programme foresees a gradual reduction of the deficit ratio to 1.1% by 2017. The projected fiscal consolidation for 2014 mainly anticipates measures on the revenue side – such as increases in excise taxes and the property tax – to ensure that deficit targets are reached. The budget law envisages moderate increases in public sector wages and pensions, which are partly contingent on revenue collection. However, fiscal outturns are shrouded in uncertainty in view of the presidential elections scheduled for December 2014. According to the 2014 convergence programme, Romania’s medium-term objective is a deficit of 1% of GDP in structural terms. The 2014 convergence programme projects the medium-term objective to be reached in 2015. According to the European Commission’s projections, the structural deficit will, however, remain above the medium-term objective in 2015.
On 2 March 2012 Romania signed the Treaty on Stability, Coordination and Governance in the Economic and Monetary Union (TSCG), committing, inter alia, to apply (and include in its national legislation) the fiscal rules specified under Title III, “Fiscal Compact”, as referred to in Box 2 of Chapter 2.
As regards fiscal governance, Romania has implemented several reforms over the past few years as part of the EU-IMF financial assistance programmes, including the setting-up of an independent fiscal council, the amendment of the Fiscal Responsibility Law to implement the Treaty on Stability, Coordination and Governance, and a reform of the tax collection agency (ANAF). However, further efforts are necessary to ensure the new institutional fiscal framework functions properly, particularly at local level. The build-up of arrears in public companies needs continued scrutiny, as this may incur upside risk to the government deficit and debt (see Section 5.9). Full compliance with the provisions for an enhanced national governance framework under Council Directive 2011/85/EU and with the Treaty on Stability, Coordination and Governance in the Economic and Monetary Union, as referred to in Box 2 of Chapter 2, should be ensured.
Turning to factors that will have an impact on Romania’s public finances over the long term, a steep ageing of the population is expected, as highlighted in Table 8. According to the 2012 projections by the European Commission and the EU’s Economic Policy Committee, starting from a level of 17.6% of GDP in 2010, Romania is likely to experience a significant increase in strictly age-related public expenditure amounting to 6.5 percentage points of GDP in the years to 2060 – above the EU average – in spite of a comprehensive pension reform adopted in 2010.19 Under the EU-IMF financial assistance programme, preparations are being made to reform the health sector.
Turning to fiscal challenges, Romania must ensure rapid convergence towards its medium-term objective and fulfil the commitments agreed in the context of the EU-IMF financial assistance programme. This requires the continuation of a prudent expenditure and revenue policy in the
19 European Commission and Economic Policy Committee, “The 2012 Ageing Report: Economic and budgetary projections for the EU-27 Member States (2010-2060)”.
184ECBConvergence ReportJune 2014
medium term. Despite some recent progress, Romania should take more determined measures to reduce payment arrears (as defined in ESA 95 terms) of the general consolidated budget and prevent the accumulation of new arrears, in particular in the health sector. On the revenue side, the government should continue its efforts to further improve the absorption rate of EU funds, which could support adjustment in a growth-friendly way. Romania’s fiscal policy strategy should be supported by the rigorous implementation of its revised fiscal framework. At the same time, Romania should make every effort to fully comply with its obligations under the enhanced Stability and Growth Pact. Over the longer run, the risks to medium term fiscal sustainability warrant structural fiscal reforms that focus on avoiding pro-cyclical fiscal policies as well as improving the sustainability of the pension system, tax administration, municipalities’ fiscal responsibility and the overall quality of economic governance.
5.7.3 EXCHANGE RATE DEVELOPMENTS
In the two-year reference period from 16 May 2012 to 15 May 2014, the Romanian leu did not participate in ERM II, but traded under a flexible exchange rate regime involving a managed floating of the currency (see Table 9a). Over the reference period the Romanian currency mostly traded around its May 2012 average exchange rate against the euro, which is used as a benchmark for illustrative purposes in the absence of an ERM II central rate. On 15 May 2014 the exchange rate stood at 4.4328 lei per euro, i.e. 0.2% stronger than its average level in May 2012. Over the reference period the maximum upward deviation from this benchmark was 3.1%, while the maximum downward deviation amounted to 4.6% (see Chart 5 and Table 9a).
The exchange rate of the Romanian leu against the euro showed a relatively high degree of volatility, as measured by annualised standard deviations in daily percentage changes. During the first half of the reference period between May 2012 and May 2013, the Romanian leu appreciated by about 2.5% on account of improving global financial market conditions, growing investor confidence in the region and a relatively high positive interest rate differential vis-à-vis euro area assets. Thereafter the leu depreciated by about 5% during a period of increased volatility in mid-2013 against the background of investor uncertainty regarding the tapering-off of quantitative easing in the United States. After a gradual normalisation of financial market conditions, the leu strengthened somewhat amid an improving outlook for the Romanian economy and stabilised around its average level at the beginning of the reference period. At the same time short-term interest rate differentials against the three-month EURIBOR remained, on average, at a high level, although declining gradually amidinterestratecutsbyBancaNaţionalăaRomânieiinanenvironmentofdecreasinginflationdifferentials vis-à-vis the euro area (see Table 9b).
In 2009 an international financial assistance package led by the EU and the IMF was agreed for Romania, which was followed in 2011 by a precautionary financial assistance programme by the EU and the IMF, totalling €5 billion. In late 2013 this was replaced by a further precautionary financial assistance programme by the EU and the IMF, totalling €4 billion. During the reference period Romania did not draw on the resources of the precautionary arrangements. As these agreements helped to reduce financial vulnerabilities, they might also have contributed to reducing exchange rate pressures over the reference period.
In a longer-term context, in April 2014 both the real effective exchange rate and the real bilateral exchange rate of the Romanian leu against the euro stood relatively close to the corresponding ten-year historical averages (see Table 10). However, these indicators should be interpreted with

185ECB
Convergence ReportJune 2014
ROMANIA
caution, as during this period Romania was subject to a process of economic convergence, which complicates any historical assessment of real exchange rate developments.
As regards other external developments, Romania’s current and capital account has adjusted substantially in recent years. After reporting a progressive increase in the external deficit between 2004 and 2007, reaching double-digit levels in the period from 2006 to 2008, the combined current and capital account deficit declined to 3.6% of GDP in 2009, improving further to 3.0% of GDP in 2012 and turning into a surplus of 1.2% of GDP in 2013 (see Table 11). The improvement in the current and capital account balance primarily reflected the sharp decline in the goods deficit, which was mainly driven by strong export performance and moderate domestic demand. The external deficit has been financed mainly by net inflows in direct and portfolio investment. By contrast, net inflows in other investment turned negative in 2012 and 2013. Against this background, gross external debt increased substantially from 34.5% of GDP in 2004 to 77.1% in 2011 and thereafter declined to 75.3% in 2012 and 68.6% in 2013. At the same time the country’s net international investment position deteriorated substantially from -26.4% of GDP in 2004 to -67.5% in 2012, but improved to -62.3% of GDP in 2013. Fiscal and structural policies therefore continue to be important for supporting external sustainability and the competitiveness of the economy. Romania is a small open economy; the ratio of its foreign trade in goods and services to GDP increased from 35.8% in 2004 to 42.4% in 2013 for exports and decreased from 44.8% in 2004 to 42.9% in 2013 for imports. Over the same period Romania’s share in world exports increased from 0.24% to 0.35%.
Concerning measures of economic integration with the euro area, in 2013 exports of goods to the euro area constituted 51.1% of total goods exports, whereas the corresponding figure for imports amounted to 53.4%. The share of euro area countries in Romania’s inward direct investment stood at 80.6% in 2013, and their share in its portfolio investment liabilities was 50.7% in 2012. The share of Romania’s assets invested in the euro area amounted to 21.2% in the case of direct investment in 2013 and 64.1% for portfolio investment in 2012 (see Table 12).
5.7.4 LONG-TERM INTEREST RATE DEVELOPMENTS
Long-term interest rates in Romania were 5.3% on average over the reference period from May 2013 to April 2014 and were thus below the 6.2% reference value for the interest rate convergence criterion (see Table 13).
Long-term interest rates in Romania were broadly stable in a range close to 7% between 2005 and mid-2008 (see Chart 6a).20 From August 2008 long-term interest rates increased against the backdrop of deteriorating economic activity and a pass-through of an upward trend in the monetary policy interest rate. With the onset of tensions in global financial markets, the long-term interest rate increased significantly, reflecting a rise in the country risk premium and liquidity strains in the market. Romania’s vulnerability to significant external and internal imbalances and its poorer economic outlook at the time were further reflected in the downgrade of its sovereign credit rating by some rating agencies to below investment grade level. Long-term interest rates peaked at 11.5% in July 2009. Also in this period, the joint EU-IMF multilateral adjustment programme was approved. Long-term interest rates were subsequently placed on a downward trend, supported by easing inflationary pressures and a decline in the monetary policy rate, and reached a low of 6.7% in early 2011, shortly before the expiration of the multilateral adjustment programme. Romanian
20 Data are available on the reference long-term interest rate for Romania from 2005 onwards.
186ECBConvergence ReportJune 2014
authorities then signed a new programme with the EU and IMF, which was treated as precautionary. The improved outlook for the economy, including the soundness of public finances, also led one major credit rating agency to restore the rating of Romania’s sovereign long-term debt to investment grade in mid-2011. This was followed by the successful issuance of a 30-year bond at the beginning of 2014. Since mid-2011, long-term interest rates have been on a broadly declining trend, which accelerated between end-2012 and the first part of 2013 against declining risk premia and stronger investor appetite for Romanian government securities, yet stabilised during the reference period despite some upward pressure in global bond markets amid policy rate cuts implemented by Banca NaţionalăaRomânieiinthecontextoftheimprovedinflationoutlook.Attheendofthereferenceperiod long-term interest rates in Romania stood at 5.2%.
The long-term interest rate differential between Romania and the euro area average fluctuated between 2.2 and 4.0 percentage points between 2005 and 2007 (see Chart 6b). Subsequently, it increased in parallel with changes in the inflation differential between Romania and the euro area, peaking at 7.7 percentage points in August 2009. From late 2009, the long-term interest rate differential embarked on a sharp downward trend before stabilising in a range between around 2.0 and 3.5 percentage points, where it has remained since November 2010, albeit increasing slightly since late 2013. The long-term interest rate differential with the euro area average stood at 2.8 percentage points (and 3.5 percentage points with respect to the AAA euro area yield) at the end of the reference period.
As regards financial market developments, capital markets in Romania are much smaller and still underdeveloped relative to those of the euro area (see Table 14). By international standards, the corporate bond market is still at an early stage in terms of issuance volume, with the amount of outstanding debt securities issued by corporations (a measure of market-based indebtedness) reaching just 0.3% of GDP at the end of 2013. Stock market capitalisation stood at 11.6% of GDP in 2013, compared with the 17%-18% ratio which Romania typically posted during the 2005-07 period, marked by financial and credit expansion. Bank financing as measured by credit to non-government residents, expressed as a ratio to GDP, remains less developed than in peer countries, amounting to 34.8% of GDP at the end of 2013. Foreign-owned banks, primarily from the euro area, play a major role in the Romanian banking sector, with the majority of loans to the private sector denominated in foreign currencies. The international claims of euro area banks in the country are relatively high, at 20.1% of total domestic liabilities in 2013.

187ECB
Convergence ReportJune 2014
ROMANIA
ROMANIA
1 PRICE DEVELOPMENTSTable 1 HICP inflation 188Chart 1 Price developments 188Table 2 Measures of inflation and related indicators 188Table 3 Recent inflation trends and forecasts 189
(a) Recent trends in the HICP 189(b) Inflation forecasts 189
2 FISCAL DEVELOPMENTSTable 4 General government fiscal position 190Table 5 General government budgetary position 190Chart 2 General government surplus (+)/deficit (-) 191
(a) Levels 191(b) Annual change and underlying factors 191
Table 6 General government gross debt – structural features 191Chart 3 General government gross debt 192
(a) Levels 192(b) Annual change and underlying factors 192
Chart 4 General government expenditure and revenue 192Table 7 General government deficit-debt adjustment 193Table 8 Projections of the ageing-induced fiscal burden 193
3 EXCHANGE RATE DEVELOPMENTSTable 9 (a) Exchange rate stability 194
(b) Key indicators of exchange rate pressure for the Romanian leu 194Chart 5 Romanian leu: nominal exchange rate development against the euro 194
(a) Exchange rate over the reference period 194(b) Exchange rate over the last ten years 194
Table 10 Romanian leu: real exchange rate developments 195Table 11 External developments 195Table 12 Indicators of integration with the euro area 195
4 LONG-TERM INTEREST RATE DEVELOPMENTSTable 13 Long-term interest rates (LTIRs) 196Chart 6 Long-term interest rate (LTIR) 196
(a) Long-term interest rate (LTIR) 196(b) LTIR and HICP inflation differentials vis-à-vis the euro area 196
Table 14 Selected indicators of financial development and integration 196
LIST OF TABLES AND CHARTS
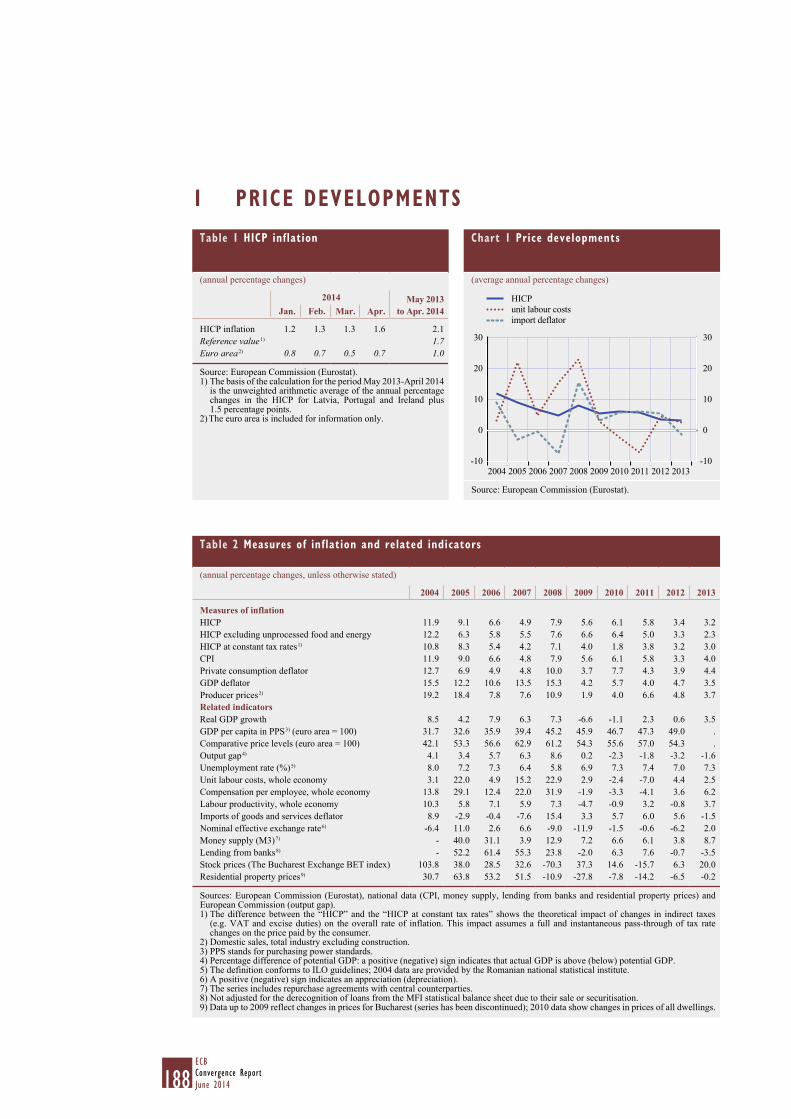
188ECBConvergence ReportJune 2014
1 PRICE DEVELOPMENTSChart 1 Price developments
(average annual percentage changes)
-10
0
10
20
30
-10
0
10
20
30
HICPunit labour costsimport deflator
2012 20132004 2005 2006 2007 2008 2009 2010 2011
Source: European Commission (Eurostat).
Table 1 HICP inflation
(annual percentage changes)
2014 May 2013 to Apr. 2014 Jan. Feb. Mar. Apr.
HICP inflation 1.2 1.3 1.3 1.6 2.1 Reference value 1) 1.7 Euro area 2) 0.8 0.7 0.5 0.7 1.0
Source: European Commission (Eurostat).1) The basis of the calculation for the period May 2013-April 2014
is the unweighted arithmetic average of the annual percentage changes in the HICP for Latvia, Portugal and Ireland plus 1.5 percentage points.
2) The euro area is included for information only.
Table 2 Measures of inflation and related indicators
(annual percentage changes, unless otherwise stated)
2004 2005 2006 2007 2008 2009 2010 2011 2012 2013
Measures of inflationHICP 11.9 9.1 6.6 4.9 7.9 5.6 6.1 5.8 3.4 3.2 HICP excluding unprocessed food and energy 12.2 6.3 5.8 5.5 7.6 6.6 6.4 5.0 3.3 2.3 HICP at constant tax rates 1) 10.8 8.3 5.4 4.2 7.1 4.0 1.8 3.8 3.2 3.0 CPI 11.9 9.0 6.6 4.8 7.9 5.6 6.1 5.8 3.3 4.0 Private consumption deflator 12.7 6.9 4.9 4.8 10.0 3.7 7.7 4.3 3.9 4.4 GDP deflator 15.5 12.2 10.6 13.5 15.3 4.2 5.7 4.0 4.7 3.5 Producer prices 2) 19.2 18.4 7.8 7.6 10.9 1.9 4.0 6.6 4.8 3.7 Related indicatorsReal GDP growth 8.5 4.2 7.9 6.3 7.3 -6.6 -1.1 2.3 0.6 3.5 GDP per capita in PPS 3) (euro area = 100) 31.7 32.6 35.9 39.4 45.2 45.9 46.7 47.3 49.0 . Comparative price levels (euro area = 100) 42.1 53.3 56.6 62.9 61.2 54.3 55.6 57.0 54.3 . Output gap 4) 4.1 3.4 5.7 6.3 8.6 0.2 -2.3 -1.8 -3.2 -1.6 Unemployment rate (%) 5) 8.0 7.2 7.3 6.4 5.8 6.9 7.3 7.4 7.0 7.3 Unit labour costs, whole economy 3.1 22.0 4.9 15.2 22.9 2.9 -2.4 -7.0 4.4 2.5 Compensation per employee, whole economy 13.8 29.1 12.4 22.0 31.9 -1.9 -3.3 -4.1 3.6 6.2 Labour productivity, whole economy 10.3 5.8 7.1 5.9 7.3 -4.7 -0.9 3.2 -0.8 3.7 Imports of goods and services deflator 8.9 -2.9 -0.4 -7.6 15.4 3.3 5.7 6.0 5.6 -1.5 Nominal effective exchange rate 6) -6.4 11.0 2.6 6.6 -9.0 -11.9 -1.5 -0.6 -6.2 2.0 Money supply (M3) 7) - 40.0 31.1 3.9 12.9 7.2 6.6 6.1 3.8 8.7 Lending from banks 8) - 52.2 61.4 55.3 23.8 -2.0 6.3 7.6 -0.7 -3.5 Stock prices (The Bucharest Exchange BET index) 103.8 38.0 28.5 32.6 -70.3 37.3 14.6 -15.7 6.3 20.0 Residential property prices 9) 30.7 63.8 53.2 51.5 -10.9 -27.8 -7.8 -14.2 -6.5 -0.2
Sources: European Commission (Eurostat), national data (CPI, money supply, lending from banks and residential property prices) and European Commission (output gap).1) The difference between the “HICP” and the “HICP at constant tax rates” shows the theoretical impact of changes in indirect taxes
(e.g. VAT and excise duties) on the overall rate of inflation. This impact assumes a full and instantaneous pass-through of tax rate changes on the price paid by the consumer.
2) Domestic sales, total industry excluding construction.3) PPS stands for purchasing power standards.4) Percentage difference of potential GDP: a positive (negative) sign indicates that actual GDP is above (below) potential GDP.5) The definition conforms to ILO guidelines; 2004 data are provided by the Romanian national statistical institute.6) A positive (negative) sign indicates an appreciation (depreciation).7) The series includes repurchase agreements with central counterparties.8) Not adjusted for the derecognition of loans from the MFI statistical balance sheet due to their sale or securitisation.9) Data up to 2009 reflect changes in prices for Bucharest (series has been discontinued); 2010 data show changes in prices of all dwellings.

189ECB
Convergence ReportJune 2014
ROMANIA
Table 3 Recent inflation trends and forecasts
(annual percentage changes)
(a) Recent trends in the HICP2013 2014
Nov. Dec. Jan. Feb. Mar. Apr.
HICPAnnual percentage change 1.3 1.3 1.2 1.3 1.3 1.6 Change in the average of the latest three months from the previous three months, annualised rate, seasonally adjusted -1.1 0.3 1.5 2.8 3.1 3.2 Change in the average of the latest six months from the previous six months, annualised rate, seasonally adjusted 0.9 0.3 0.3 0.5 0.8 1.3
Sources: European Commission (Eurostat) and ECB calculations.
(b) Inflation forecasts2014 2015
HICP, European Commission (Spring 2014) 2.5 3.3 CPI, OECD (May 2014)1) - -CPI, IMF (April 2014) 2.2 3.1CPI, Consensus Economics (April 2014) 2.2 3.0
Sources: European Commission, OECD, IMF and Consensus Economics.1) Romania is not a member of the OECD.

190ECBConvergence ReportJune 2014
2 FISCAL DEVELOPMENTSTable 4 General government fiscal position
(as a percentage of GDP)
2012 2013 2014 1)
General government surplus (+)/deficit (-) -3.0 -2.3 -2.2 Reference value -3.0 -3.0 -3.0 Surplus/deficit, net of government investment expenditure 2) 1.8 2.2 2.1
General government gross debt 38.0 38.4 39.9 Reference value 60.0 60.0 60.0
Sources: European Commission (Eurostat, DG ECFIN) and ECB calculations.1) European Commission projections.2) A positive (negative) sign indicates that the government deficit is lower (higher) than government investment expenditure.
Table 5 General government budgetary position
(as a percentage of GDP)
2004 2005 2006 2007 2008 2009 2010 2011 2012 2013
Total revenue 32.3 32.4 33.3 35.3 33.6 32.1 33.3 33.9 33.7 32.7 Current revenue 31.9 32.1 33.2 34.1 32.8 31.8 32.6 33.2 32.8 32.1
Direct taxes 6.4 5.3 6.0 6.7 6.7 6.5 6.1 6.2 6.1 6.0 Indirect taxes 11.7 12.9 12.8 12.3 11.7 10.7 11.9 13.0 13.2 12.7 Social security contributions 9.7 10.3 10.3 10.5 10.1 10.2 9.5 9.1 9.0 8.8 Other current revenue 4.2 3.6 4.0 4.6 4.3 4.3 5.2 4.9 4.6 4.6
Capital revenue 0.4 0.3 0.1 1.2 0.8 0.3 0.7 0.7 0.8 0.6 Total expenditure 33.6 33.6 35.5 38.2 39.3 41.1 40.1 39.4 36.7 35.0
Current expenditure 28.5 28.7 28.9 30.5 31.6 34.8 33.5 31.5 30.9 29.6 Compensation of employees 8.1 8.7 9.3 9.7 10.5 10.9 9.7 7.9 7.8 8.1 Social benefits other than in kind 8.7 8.9 8.8 9.2 10.4 12.7 12.9 12.0 11.3 10.8 Interest payable 1.5 1.2 0.8 0.7 0.7 1.5 1.5 1.6 1.8 1.8
of which: impact of swaps and FRAs 1) 0.0 0.0 0.0 0.0 0.0 0.0 0.0 0.0 0.0 0.0 Other current expenditure 10.2 9.9 10.0 10.9 10.0 9.6 9.4 10.0 9.9 8.9
Capital expenditure 5.0 4.9 6.6 7.7 7.7 6.3 6.6 7.9 5.8 5.3
Surplus (+)/deficit (-) -1.2 -1.2 -2.2 -2.9 -5.7 -9.0 -6.8 -5.5 -3.0 -2.3
Primary balance 0.3 0.1 -1.4 -2.2 -5.0 -7.5 -5.3 -3.9 -1.2 -0.5 Surplus/deficit, net of government investment expenditure 1.8 2.7 2.9 3.2 0.9 -3.1 -1.1 -0.1 1.8 2.2
Sources: ESCB and European Commission (Eurostat).Notes: Differences between totals and the sum of their components are due to rounding. Interest payable as reported under the excessive deficit procedure. The item “impact of swaps and FRAs” is equal to the difference between the interest (or deficit/surplus) as defined in the excessive deficit procedure and in the ESA 95. See Regulation (EC) No 2558/2001 of the European Parliament and of the Council of 3 December 2001 amending Council Regulation (EC) No 2223/96 as regards the reclassification of settlements under swap arrangements and under forward rate agreements (0J L 344, 28.12.2001, p. 1).1) FRAs stands for forward rate agreements.
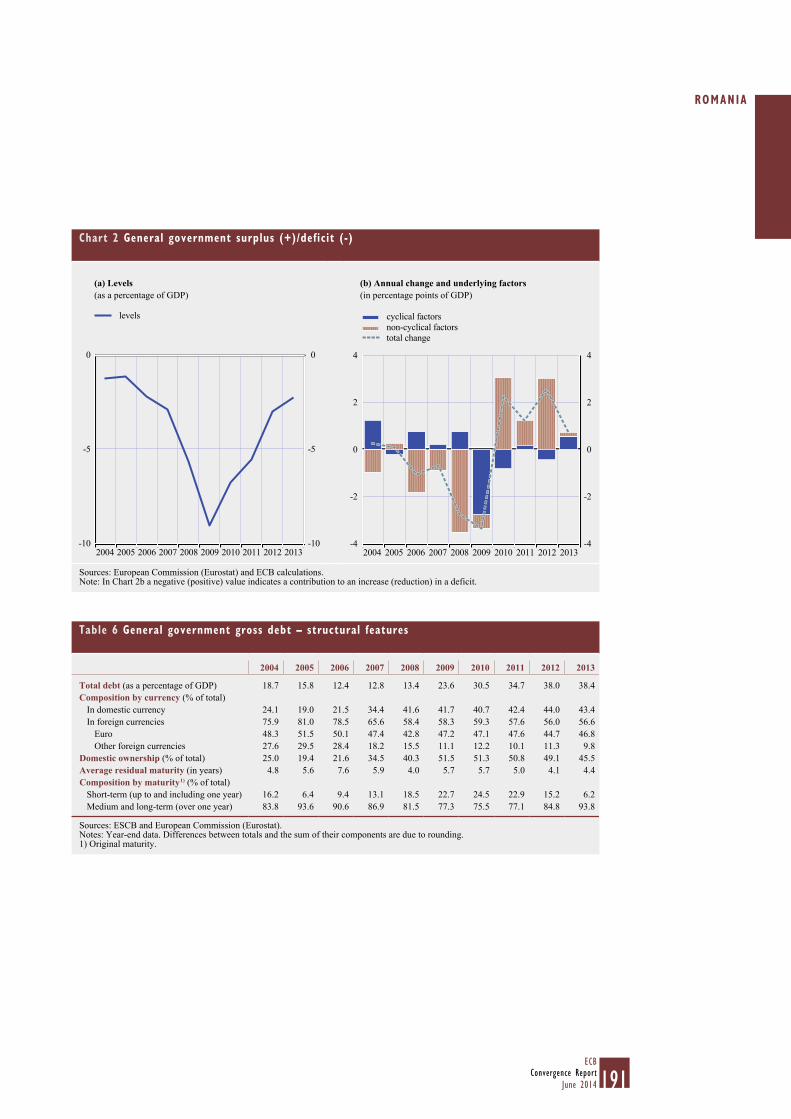
191ECB
Convergence ReportJune 2014
ROMANIA
Chart 2 General government surplus (+)/deficit (-)
(a) Levels(as a percentage of GDP)
(b) Annual change and underlying factors(in percentage points of GDP)
-10
-5
0
-10
-5
0
2012 20132004 2005 2006 2007 2008 2009 2010 2011
levels
-4
-2
0
2
4
-4
-2
0
2
4
2012 2013
cyclical factorsnon-cyclical factorstotal change
2004 2005 2006 2007 2008 2009 2010 2011
Sources: European Commission (Eurostat) and ECB calculations.Note: In Chart 2b a negative (positive) value indicates a contribution to an increase (reduction) in a deficit.
Table 6 General government gross debt – structural features
2004 2005 2006 2007 2008 2009 2010 2011 2012 2013
Total debt (as a percentage of GDP) 18.7 15.8 12.4 12.8 13.4 23.6 30.5 34.7 38.0 38.4 Composition by currency (% of total)
In domestic currency 24.1 19.0 21.5 34.4 41.6 41.7 40.7 42.4 44.0 43.4 In foreign currencies 75.9 81.0 78.5 65.6 58.4 58.3 59.3 57.6 56.0 56.6
Euro 48.3 51.5 50.1 47.4 42.8 47.2 47.1 47.6 44.7 46.8 Other foreign currencies 27.6 29.5 28.4 18.2 15.5 11.1 12.2 10.1 11.3 9.8
Domestic ownership (% of total) 25.0 19.4 21.6 34.5 40.3 51.5 51.3 50.8 49.1 45.5 Average residual maturity (in years) 4.8 5.6 7.6 5.9 4.0 5.7 5.7 5.0 4.1 4.4 Composition by maturity 1) (% of total)
Short-term (up to and including one year) 16.2 6.4 9.4 13.1 18.5 22.7 24.5 22.9 15.2 6.2 Medium and long-term (over one year) 83.8 93.6 90.6 86.9 81.5 77.3 75.5 77.1 84.8 93.8
Sources: ESCB and European Commission (Eurostat).Notes: Year-end data. Differences between totals and the sum of their components are due to rounding.1) Original maturity.
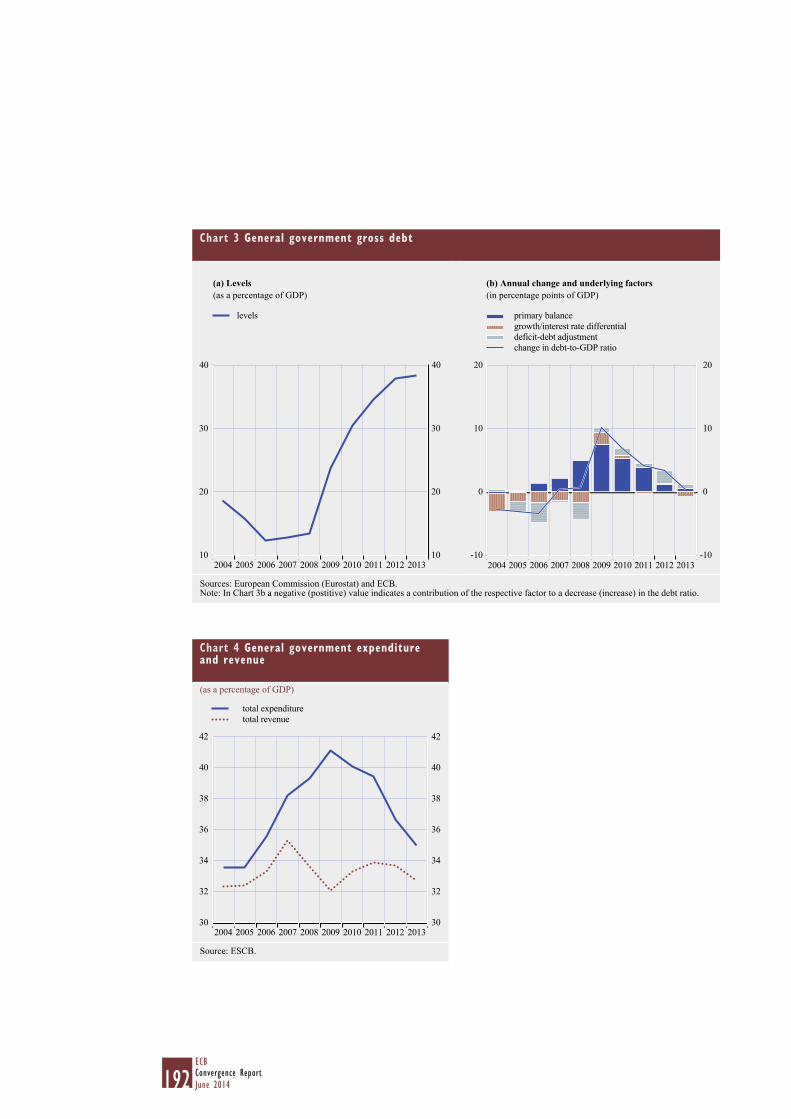
192ECBConvergence ReportJune 2014
Chart 3 General government gross debt
(a) Levels(as a percentage of GDP)
(b) Annual change and underlying factors(in percentage points of GDP)
10
20
30
40
10
20
30
40
2012 20132004 2005 2006 2007 2008 2009 2010 2011
levels
-10
0
10
20
-10
0
10
20
2012 2013
primary balancegrowth/interest rate differentialdeficit-debt adjustmentchange in debt-to-GDP ratio
2004 2005 2006 2007 2008 2009 2010 2011
Sources: European Commission (Eurostat) and ECB.Note: In Chart 3b a negative (postitive) value indicates a contribution of the respective factor to a decrease (increase) in the debt ratio.
Chart 4 General government expenditure and revenue
(as a percentage of GDP)
30
32
34
36
38
40
42
30
32
34
36
38
40
42
2012 2013
total expendituretotal revenue
2004 2005 2006 2007 2008 2009 2010 2011
Source: ESCB.
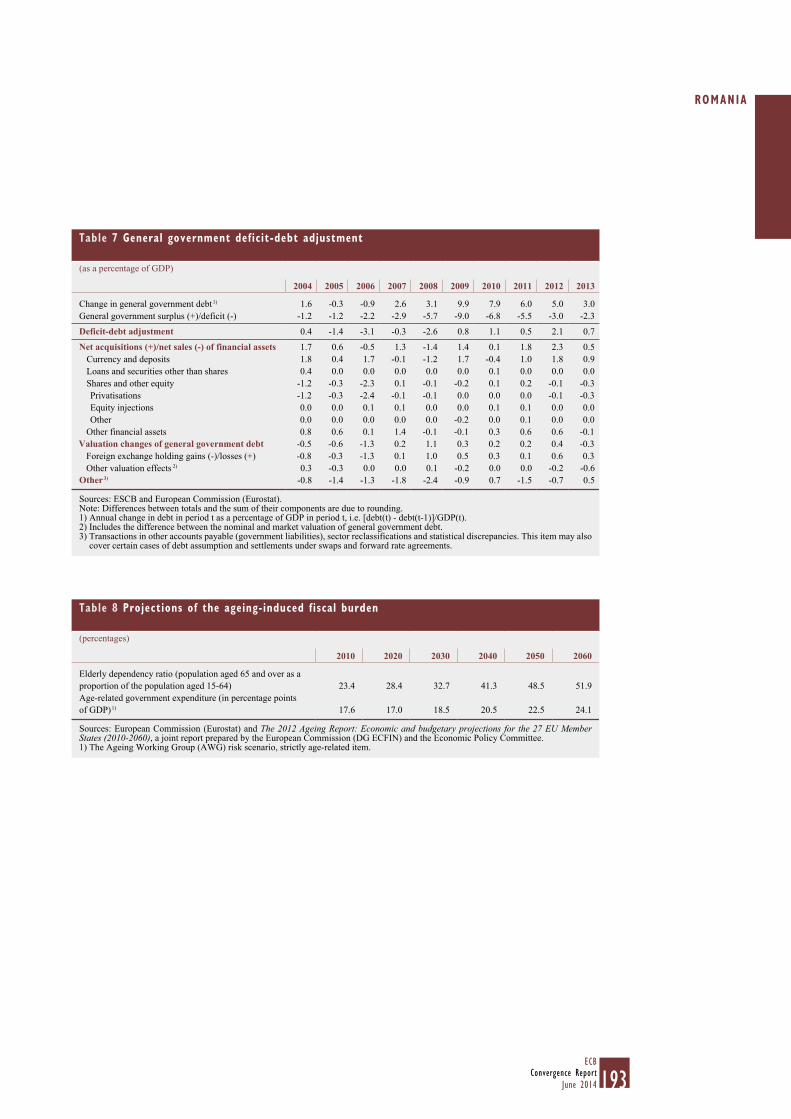
193ECB
Convergence ReportJune 2014
ROMANIA
Table 7 General government deficit-debt adjustment
(as a percentage of GDP)
2004 2005 2006 2007 2008 2009 2010 2011 2012 2013
Change in general government debt 1) 1.6 -0.3 -0.9 2.6 3.1 9.9 7.9 6.0 5.0 3.0 General government surplus (+)/deficit (-) -1.2 -1.2 -2.2 -2.9 -5.7 -9.0 -6.8 -5.5 -3.0 -2.3
Deficit-debt adjustment 0.4 -1.4 -3.1 -0.3 -2.6 0.8 1.1 0.5 2.1 0.7
Net acquisitions (+)/net sales (-) of financial assets 1.7 0.6 -0.5 1.3 -1.4 1.4 0.1 1.8 2.3 0.5 Currency and deposits 1.8 0.4 1.7 -0.1 -1.2 1.7 -0.4 1.0 1.8 0.9 Loans and securities other than shares 0.4 0.0 0.0 0.0 0.0 0.0 0.1 0.0 0.0 0.0 Shares and other equity -1.2 -0.3 -2.3 0.1 -0.1 -0.2 0.1 0.2 -0.1 -0.3 Privatisations -1.2 -0.3 -2.4 -0.1 -0.1 0.0 0.0 0.0 -0.1 -0.3 Equity injections 0.0 0.0 0.1 0.1 0.0 0.0 0.1 0.1 0.0 0.0 Other 0.0 0.0 0.0 0.0 0.0 -0.2 0.0 0.1 0.0 0.0
Other financial assets 0.8 0.6 0.1 1.4 -0.1 -0.1 0.3 0.6 0.6 -0.1 Valuation changes of general government debt -0.5 -0.6 -1.3 0.2 1.1 0.3 0.2 0.2 0.4 -0.3
Foreign exchange holding gains (-)/losses (+) -0.8 -0.3 -1.3 0.1 1.0 0.5 0.3 0.1 0.6 0.3 Other valuation effects 2) 0.3 -0.3 0.0 0.0 0.1 -0.2 0.0 0.0 -0.2 -0.6
Other 3) -0.8 -1.4 -1.3 -1.8 -2.4 -0.9 0.7 -1.5 -0.7 0.5
Sources: ESCB and European Commission (Eurostat).Note: Differences between totals and the sum of their components are due to rounding.1) Annual change in debt in period t as a percentage of GDP in period t, i.e. [debt(t) - debt(t-1)]/GDP(t).2) Includes the difference between the nominal and market valuation of general government debt.3) Transactions in other accounts payable (government liabilities), sector reclassifications and statistical discrepancies. This item may also
cover certain cases of debt assumption and settlements under swaps and forward rate agreements.
Table 8 Projections of the ageing-induced fiscal burden
(percentages)
2010 2020 2030 2040 2050 2060
Elderly dependency ratio (population aged 65 and over as a proportion of the population aged 15-64) 23.4 28.4 32.7 41.3 48.5 51.9 Age-related government expenditure (in percentage points of GDP) 1) 17.6 17.0 18.5 20.5 22.5 24.1
Sources: European Commission (Eurostat) and The 2012 Ageing Report: Economic and budgetary projections for the 27 EU Member States (2010-2060), a joint report prepared by the European Commission (DG ECFIN) and the Economic Policy Committee.1) The Ageing Working Group (AWG) risk scenario, strictly age-related item.
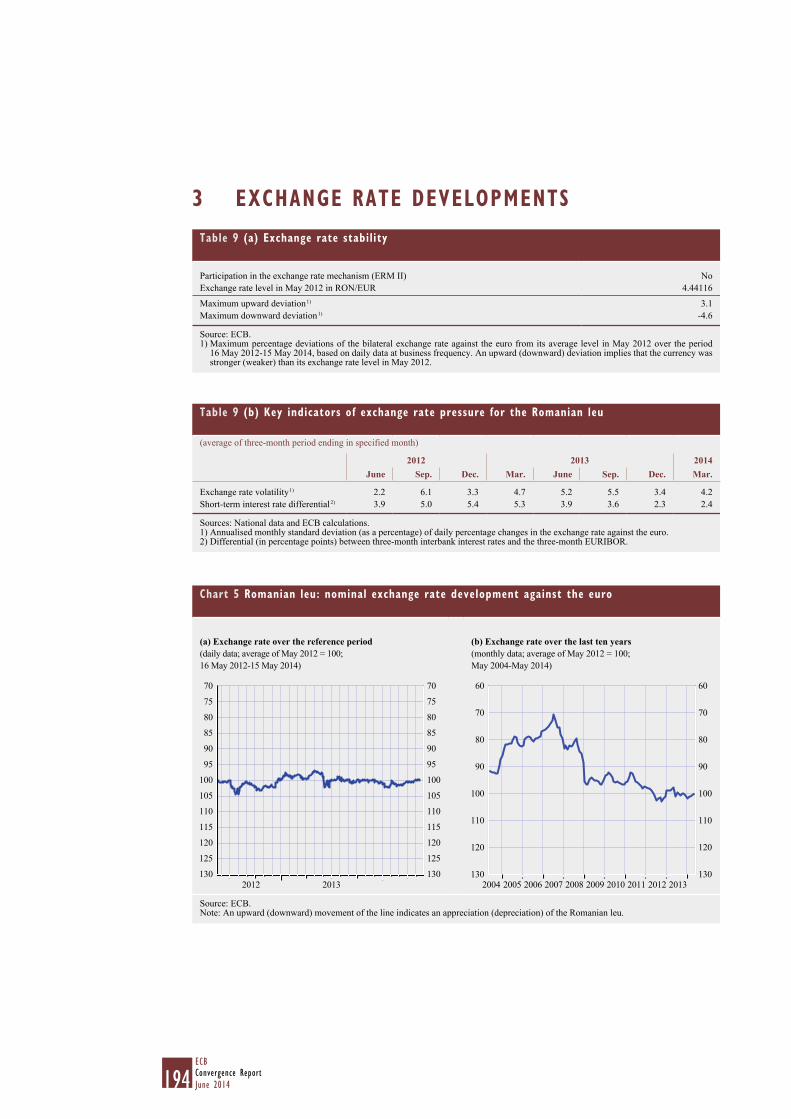
194ECBConvergence ReportJune 2014
3 EXCHANGE RATE DEVELOPMENTSTable 9 (a) Exchange rate stability
Participation in the exchange rate mechanism (ERM II) NoExchange rate level in May 2012 in RON/EUR 4.44116
Maximum upward deviation 1) 3.1Maximum downward deviation 1) -4.6
Source: ECB.1) Maximum percentage deviations of the bilateral exchange rate against the euro from its average level in May 2012 over the period
16 May 2012-15 May 2014, based on daily data at business frequency. An upward (downward) deviation implies that the currency was stronger (weaker) than its exchange rate level in May 2012.
Table 9 (b) Key indicators of exchange rate pressure for the Romanian leu
(average of three-month period ending in specified month)
2012 2013 2014June Sep. Dec. Mar. June Sep. Dec. Mar.
Exchange rate volatility 1) 2.2 6.1 3.3 4.7 5.2 5.5 3.4 4.2 Short-term interest rate differential 2) 3.9 5.0 5.4 5.3 3.9 3.6 2.3 2.4
Sources: National data and ECB calculations.1) Annualised monthly standard deviation (as a percentage) of daily percentage changes in the exchange rate against the euro.2) Differential (in percentage points) between three-month interbank interest rates and the three-month EURIBOR.
Chart 5 Romanian leu: nominal exchange rate development against the euro
(a) Exchange rate over the reference period(daily data; average of May 2012 = 100; 16 May 2012-15 May 2014)
(b) Exchange rate over the last ten years(monthly data; average of May 2012 = 100; May 2004-May 2014)
130
125
120
115
110
105
100
95
90
85
80
75
70
130
125
120
115
110
105
100
95
90
85
80
75
70
2012 2013130
120
110
100
90
80
60
130
120
110
100
90
80
60
70 70
2012 20132004 2005 2006 2007 2008 2009 2010 2011
Source: ECB.Note: An upward (downward) movement of the line indicates an appreciation (depreciation) of the Romanian leu.
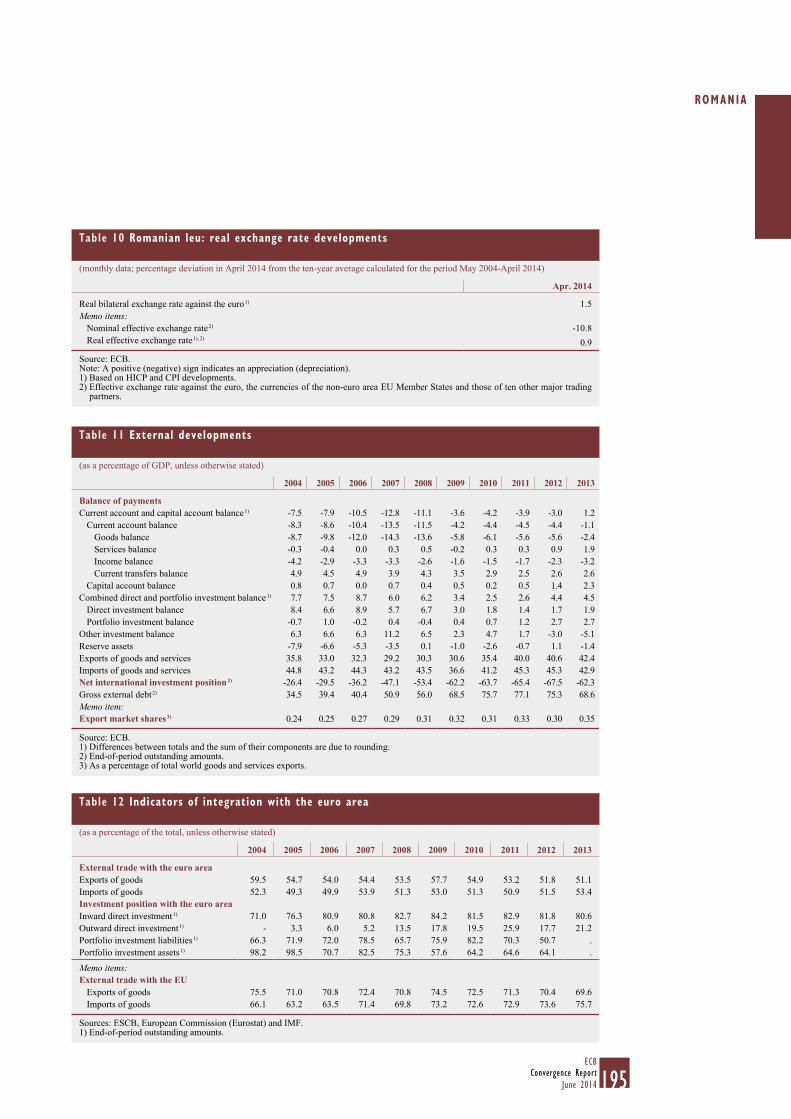
195ECB
Convergence ReportJune 2014
ROMANIA
Table 10 Romanian leu: real exchange rate developments
(monthly data; percentage deviation in April 2014 from the ten-year average calculated for the period May 2004-April 2014)
Apr. 2014
Real bilateral exchange rate against the euro 1) 1.5Memo items:
Nominal effective exchange rate 2) -10.8Real effective exchange rate 1), 2) 0.9
Source: ECB.Note: A positive (negative) sign indicates an appreciation (depreciation).1) Based on HICP and CPI developments.2) Effective exchange rate against the euro, the currencies of the non-euro area EU Member States and those of ten other major trading
partners.
Table 11 External developments
(as a percentage of GDP, unless otherwise stated)
2004 2005 2006 2007 2008 2009 2010 2011 2012 2013
Balance of paymentsCurrent account and capital account balance 1) -7.5 -7.9 -10.5 -12.8 -11.1 -3.6 -4.2 -3.9 -3.0 1.2
Current account balance -8.3 -8.6 -10.4 -13.5 -11.5 -4.2 -4.4 -4.5 -4.4 -1.1 Goods balance -8.7 -9.8 -12.0 -14.3 -13.6 -5.8 -6.1 -5.6 -5.6 -2.4 Services balance -0.3 -0.4 0.0 0.3 0.5 -0.2 0.3 0.3 0.9 1.9 Income balance -4.2 -2.9 -3.3 -3.3 -2.6 -1.6 -1.5 -1.7 -2.3 -3.2 Current transfers balance 4.9 4.5 4.9 3.9 4.3 3.5 2.9 2.5 2.6 2.6
Capital account balance 0.8 0.7 0.0 0.7 0.4 0.5 0.2 0.5 1.4 2.3 Combined direct and portfolio investment balance 1) 7.7 7.5 8.7 6.0 6.2 3.4 2.5 2.6 4.4 4.5
Direct investment balance 8.4 6.6 8.9 5.7 6.7 3.0 1.8 1.4 1.7 1.9 Portfolio investment balance -0.7 1.0 -0.2 0.4 -0.4 0.4 0.7 1.2 2.7 2.7
Other investment balance 6.3 6.6 6.3 11.2 6.5 2.3 4.7 1.7 -3.0 -5.1 Reserve assets -7.9 -6.6 -5.3 -3.5 0.1 -1.0 -2.6 -0.7 1.1 -1.4 Exports of goods and services 35.8 33.0 32.3 29.2 30.3 30.6 35.4 40.0 40.6 42.4 Imports of goods and services 44.8 43.2 44.3 43.2 43.5 36.6 41.2 45.3 45.3 42.9 Net international investment position 2) -26.4 -29.5 -36.2 -47.1 -53.4 -62.2 -63.7 -65.4 -67.5 -62.3 Gross external debt 2) 34.5 39.4 40.4 50.9 56.0 68.5 75.7 77.1 75.3 68.6 Memo item:Export market shares 3) 0.24 0.25 0.27 0.29 0.31 0.32 0.31 0.33 0.30 0.35
Source: ECB.1) Differences between totals and the sum of their components are due to rounding.2) End-of-period outstanding amounts.3) As a percentage of total world goods and services exports.
Table 12 Indicators of integration with the euro area
(as a percentage of the total, unless otherwise stated)
2004 2005 2006 2007 2008 2009 2010 2011 2012 2013
External trade with the euro areaExports of goods 59.5 54.7 54.0 54.4 53.5 57.7 54.9 53.2 51.8 51.1 Imports of goods 52.3 49.3 49.9 53.9 51.3 53.0 51.3 50.9 51.5 53.4 Investment position with the euro areaInward direct investment 1) 71.0 76.3 80.9 80.8 82.7 84.2 81.5 82.9 81.8 80.6 Outward direct investment 1) - 3.3 6.0 5.2 13.5 17.8 19.5 25.9 17.7 21.2 Portfolio investment liabilities 1) 66.3 71.9 72.0 78.5 65.7 75.9 82.2 70.3 50.7 . Portfolio investment assets 1) 98.2 98.5 70.7 82.5 75.3 57.6 64.2 64.6 64.1 .
Memo items: External trade with the EU
Exports of goods 75.5 71.0 70.8 72.4 70.8 74.5 72.5 71.3 70.4 69.6 Imports of goods 66.1 63.2 63.5 71.4 69.8 73.2 72.6 72.9 73.6 75.7
Sources: ESCB, European Commission (Eurostat) and IMF.1) End-of-period outstanding amounts.
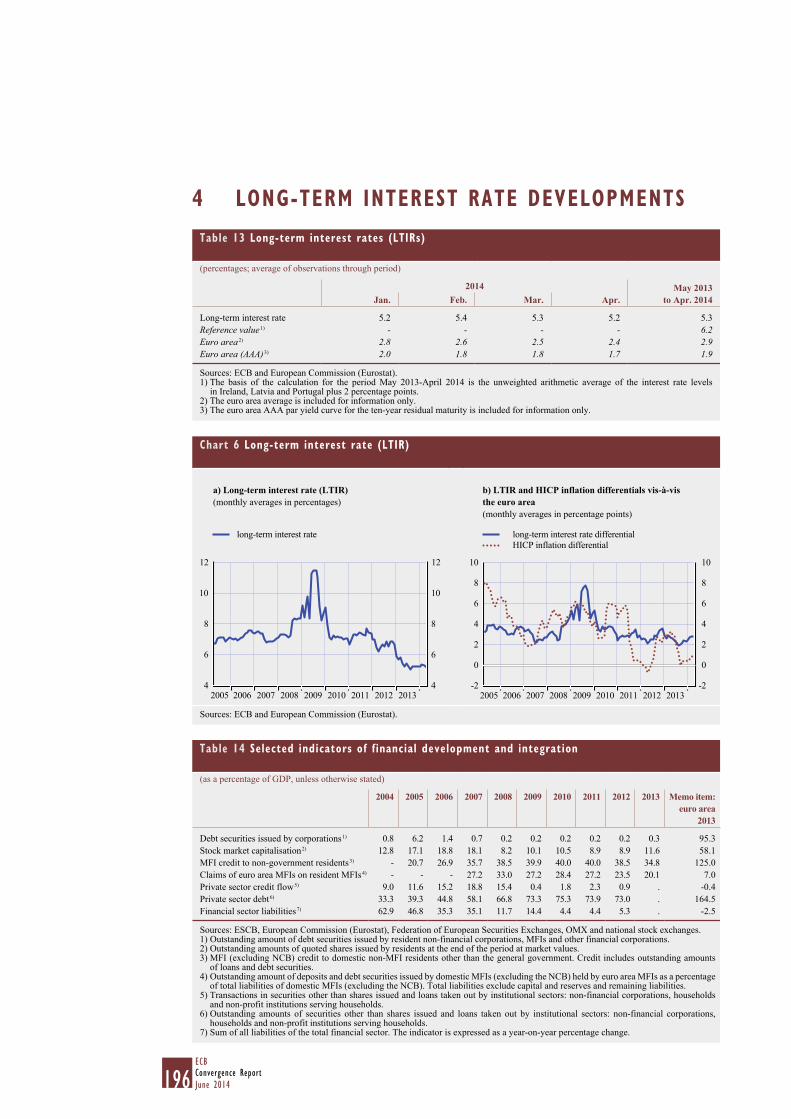
196ECBConvergence ReportJune 2014
4 LONG-TERM INTEREST RATE DEVELOPMENTSTable 13 Long-term interest rates (LTIRs)
(percentages; average of observations through period)
2014 May 2013 to Apr. 2014Jan. Feb. Mar. Apr.
Long-term interest rate 5.2 5.4 5.3 5.2 5.3 Reference value 1) - - - - 6.2 Euro area 2) 2.8 2.6 2.5 2.4 2.9 Euro area (AAA) 3) 2.0 1.8 1.8 1.7 1.9
Sources: ECB and European Commission (Eurostat).1) The basis of the calculation for the period May 2013-April 2014 is the unweighted arithmetic average of the interest rate levels
in Ireland, Latvia and Portugal plus 2 percentage points.2) The euro area average is included for information only.3) The euro area AAA par yield curve for the ten-year residual maturity is included for information only.
Chart 6 Long-term interest rate (LTIR)
a) Long-term interest rate (LTIR)(monthly averages in percentages)
b) LTIR and HICP inflation differentials vis-à-vis the euro area(monthly averages in percentage points)
4
6
8
10
12
4
6
8
10
12
2012
long-term interest rate
20062005 2008 2010 20132007 2009 2011-2
0
2
4
6
8
10
-2
0
2
4
6
8
10
2012 2013
long-term interest rate differentialHICP inflation differential
20062005 2007 2008 2009 2010 2011
Sources: ECB and European Commission (Eurostat).
Table 14 Selected indicators of financial development and integration
(as a percentage of GDP, unless otherwise stated)
2004 2005 2006 2007 2008 2009 2010 2011 2012 2013 Memo item: euro area
2013
Debt securities issued by corporations 1) 0.8 6.2 1.4 0.7 0.2 0.2 0.2 0.2 0.2 0.3 95.3 Stock market capitalisation 2) 12.8 17.1 18.8 18.1 8.2 10.1 10.5 8.9 8.9 11.6 58.1 MFI credit to non-government residents 3) - 20.7 26.9 35.7 38.5 39.9 40.0 40.0 38.5 34.8 125.0 Claims of euro area MFIs on resident MFIs 4) - - - 27.2 33.0 27.2 28.4 27.2 23.5 20.1 7.0 Private sector credit flow 5) 9.0 11.6 15.2 18.8 15.4 0.4 1.8 2.3 0.9 . -0.4 Private sector debt 6) 33.3 39.3 44.8 58.1 66.8 73.3 75.3 73.9 73.0 . 164.5 Financial sector liabilities 7) 62.9 46.8 35.3 35.1 11.7 14.4 4.4 4.4 5.3 . -2.5
Sources: ESCB, European Commission (Eurostat), Federation of European Securities Exchanges, OMX and national stock exchanges.1) Outstanding amount of debt securities issued by resident non-financial corporations, MFIs and other financial corporations.2) Outstanding amounts of quoted shares issued by residents at the end of the period at market values.3) MFI (excluding NCB) credit to domestic non-MFI residents other than the general government. Credit includes outstanding amounts
of loans and debt securities.4) Outstanding amount of deposits and debt securities issued by domestic MFIs (excluding the NCB) held by euro area MFIs as a percentage
of total liabilities of domestic MFIs (excluding the NCB). Total liabilities exclude capital and reserves and remaining liabilities.5) Transactions in securities other than shares issued and loans taken out by institutional sectors: non-financial corporations, households
and non-profit institutions serving households.6) Outstanding amounts of securities other than shares issued and loans taken out by institutional sectors: non-financial corporations,
households and non-profit institutions serving households.7) Sum of all liabilities of the total financial sector. The indicator is expressed as a year-on-year percentage change.

197ECB
Convergence ReportJune 2014
SWEDEN
5.8 SWEDEN
5.8.1 PRICE DEVELOPMENTS
Over the reference period from May 2013 to April 2014, the 12-month average rate of HICP inflation in Sweden was 0.3%, i.e. well below the reference value of 1.7% for the criterion on price stability (see Table 1). Looking ahead, the 12-month average rate of HICP inflation is expected to increase over the next few months.
Looking back over a longer period, inflation developments in Sweden have generally been moderate, with the rate of HICP inflation averaging 1.5% over the past ten years (see Chart 1). This reflects the credibility of monetary policy in Sweden, which is underpinned by moderate wage formation and the country’s status as an advanced economy. During this period average annual HICP inflation exceeded 2.0% only in 2008, mirroring developments in global commodity prices and in wage growth that was out of line with productivity developments. In 2013 average annual HICP inflation stood at 0.4%.
Sweden’s long-term inflation performance reflects a number of economic policy choices, most notably the orientation of monetary policy towards the achievement of price stability. Sveriges Riksbank has an inflation target that is quantified as an annual rise of 2% in the CPI with no tolerance margin. The monetary policy strategy changed in June 2010, as the tolerance margin of ±1 percentage point was removed from the policy objective. Prudent fiscal policy and moderate wage formation have generally lent support to the achievement of price stability in Sweden.
Inflation dynamics over the past ten years should be viewed against a background of two broad phases. The period leading up to the global financial crisis was characterised by very robust economic growth driven by external demand. A steady decline in the unemployment rate in turn boosted domestic demand. The resulting substantial rise in house prices, along with the acceleration in the growth of unit labour costs, the global energy and food price shock and the sharp depreciation of the krona, exerted upward pressure on HICP inflation, which rose from 0.8% in 2005 to 3.3% in 2008 (see Table 2). After a steep decline in 2009, economic activity recovered sharply in 2010. In 2011 and 2012 GDP growth moderated, reflecting weaker investment and subdued external demand, but started to recover in 2013. During this post-crisis period inflation decelerated substantially, reflecting the steady appreciation of the krona, which reached a ten-year high against the euro in mid-2012, and subdued unit labour cost growth in 2010 and 2011. Lower prices for imports contained inflationary pressures in 2012, even as unit labour costs increased significantly on the back of strong wage growth. The contraction in import prices continued in 2013 despite the depreciation of the krona against the euro. Domestically, house prices and unit labour costs accelerated. However, cost pressures could not be passed through to consumer prices, owing to depressed domestic and external demand, in particular from the Nordic countries and the euro area. Low import prices in combination with the weak pass-through of domestic cost pressures explain the low level of HICP inflation in 2013. The general pattern of inflation developments was also reflected in other relevant indices, such as the HICP excluding unprocessed food and energy.
Looking at recent developments, the annual rate of HICP inflation stood at moderate levels in the last quarter of 2013 and in early 2014, and was well below the inflation target of Sveriges Riksbank. During the fourth quarter of 2013 annual HICP inflation rose very slightly from its trough of 0.2% in October 2013. In early 2014 it declined, moving into negative territory, before reaching 0.3% in
198ECBConvergence ReportJune 2014
April (see Table 3a). This pattern was mainly attributable to declining energy prices and subdued increases in services prices. The fall in profit shares in both the services and goods producing industries signalled that the business sector was still having difficulty backing cost increases with higher prices. Thus, inflation did not reflect the rebound in real GDP growth, which accelerated to 1.5% in 2013. Despite this rise in real GDP growth, the unemployment rate increased slightly in early 2014. Economic activity was supported by monetary policy, as the repo rate was kept at the low level of 1% from 2012 to December 2013, when it was reduced further to 0.75%.
The latest available forecasts from major international institutions project inflation to remain broadly unchanged in 2014 before increasing in 2015, and to range from 0.1% to 0.5% and from 1.4% to 1.8% respectively (see Table 3b). This inflation outlook is based on expectations of an economic recovery and of capacity utilisation getting closer to its potential. Stronger demand from both domestic consumers and Swedish export markets is likely to facilitate the pass-through of cost pressures via higher price mark-ups. Furthermore, wage negotiations concluded in late 2013 for the following three years indicate wage increases slightly above the average recorded over the past ten years, which should help to bring inflation closer to the target. Overall, risks to the inflation outlook are broadly balanced. Upside risks relate to a stronger than expected rebound in investment activity and to increasing global commodity prices. The main downside risk relates to a correction of house prices, which could dampen domestic demand. Exchange rate fluctuations are an additional source of uncertainty surrounding the inflation forecast. The fact that the price level in Sweden is still relatively high compared with the euro area average (see Table 2) suggests that further trade integration and increased competition may have a downward impact on price dynamics.
Maintaining price stability is a prerequisite for sustainable economic growth in Sweden over the medium term. This requires, among other things, maintaining a price stability-oriented monetary policy and moderate wage formation. It is essential to further improve the functioning of the labour market, which has been severely affected by the global financial and economic crisis. Reforms should focus on assisting groups vulnerable to unemployment, such as individuals with low educational attainment and immigrants, in order to address the recent deterioration in matching efficiency between workers and vacancies.
Rigidities in the housing market have contributed to excessive price developments and are acting as a disincentive to investment. Product market policies should aim to alleviate these constraints on the supply of housing by easing restrictive and time-consuming planning and zoning procedures. Financial sector policies should first and foremost aim to reduce household indebtedness. In particular, a reform of mortgage interest rate deductibility from the income tax could help to curb the high levels of indebtedness. To further improve the resilience of the banking sector, the Swedish authorities could also consider reducing banks’ exposure to mortgage loans, for example by further increasing the risk weight floor for mortgages. Finally, financial stability could benefit from Sweden’s participation in the SSM, which will take up its prudential supervisory tasks in November 2014.
With regard to macroeconomic imbalances, the European Commission selected Sweden for an in-depth review in its Alert Mechanism Report 2014, mainly on account of developments regarding household indebtedness coupled with inefficiencies in the housing market and the large current account surplus. It concluded that “Sweden continues to experience macroeconomic imbalances, which require monitoring and policy action”.
199ECB
Convergence ReportJune 2014
SWEDEN
5.8.2 FISCAL DEVELOPMENTS
Sweden is not currently subject to an EU Council decision on the existence of an excessive deficit. In the reference year 2013 the general government budget balance recorded a deficit of 1.1% of GDP, i.e. well below the 3% deficit reference value. The general government gross debt-to-GDP ratio was 40.6% of GDP, i.e. below the 60% reference value (see Table 4). Compared with the previous year, the budget balance deteriorated by 0.5 percentage point and the government debt ratio rose by 2.3 percentage points. According to European Commission projections, the budget deficit will be 1.8% of GDP in 2014, while the government debt ratio will increase slightly to 41.6% in the same period.
Over the period from 2004 to 2013 the budgetary position in Sweden was generally in surplus, except in 2009 and 2012-13 (see Table 5 and Chart 2a). As shown in greater detail in Chart 2b, European Commission estimates indicate that cyclical factors had a negative impact in 2008-09 and 2012-13. Non-cyclical factors tended to contribute to an improvement in the budgetary position in 2008-09, while they seem to have contributed to a deterioration in the budgetary position overall since 2010. During the financial and economic crisis in 2008 and 2009, the Swedish government gave the automatic stabilisers room to operate, which partly explains the large deficit-increasing impact of cyclical factors in those years. In addition, the Swedish government implemented fiscal stimulus measures, particularly in 2009. In 2010 and 2011 the increase in the surplus ratio was a result of positive cyclical developments, while non-cyclical factors broadly had a surplus-decreasing effect. In the absence of any substantial temporary and one-off factors, the underlying changes in the fiscal position primarily reflected a sizeable structural improvement in Sweden’s structural budgetary position until 2009, and some deterioration thereafter.
Turning to developments in general government gross debt, the debt-to-GDP ratio declined cumulatively by 9.7 percentage points between 2004 and 2013 (see Chart 3a and Table 6). This can mainly be explained by the primary surpluses over the period (see Chart 3b). The growth-interest rate differential contributed to a debt reduction, except in the years 2008 and 2009. In 2013 the general government debt-to-GDP ratio increased slightly owing almost entirely to a notable debt-increasing deficit-debt adjustment, mainly reflecting loans to strengthen the currency reserves of Sveriges Riksbank.
As regards Sweden’s general government debt structure, the share of public debt with a short-term maturity was relatively high in the period under review, but fell to 21.7% in 2013 (see Table 6). Fiscal balances are, however, relatively insensitive to changes in interest rates, given the low level of debt. At the same time, the proportion of government debt denominated in foreign currency was 28.8% in 2013. Given the level of the government debt-to-GDP ratio, however, fiscal balances are also relatively insensitive to changes in exchange rates. At the same time, the Swedish government has incurred contingent liabilities of about 0.9 percentage point of GDP resulting from government interventions to support financial institutions and financial markets during the crisis (see Section 5.9).
Moving on to examine trends in other fiscal indicators, Chart 4 and Table 5 show that the general government total expenditure ratio declined from 54% of GDP in 2004 to 52.6% in 2013. The ratio declined until 2007, reflecting a fall in current expenditure. Thereafter, the downward trend reversed and the expenditure ratio increased steeply to 54.7% of GDP in 2009, which was primarily and broadly equally attributable to the decline in GDP (via the denominator effect) and
200ECBConvergence ReportJune 2014
to an increase in social benefits and other expenditure. Since 2009 the expenditure ratio has again declined somewhat, largely owing to lower current expenditure and social benefits other than in kind. At 52.6% of GDP in 2013, the expenditure ratio was high in comparison with other countries with a similar level of per capita income. Government revenue in relation to GDP fluctuated around 55% of GDP between 2004 and 2009. Since 2009 the total revenue-to-GDP ratio has declined noticeably to 51.5% of GDP in 2013, mainly reflecting lower revenues from direct taxes and social security contributions.
Looking ahead, according to Sweden’s medium-term fiscal strategy, as presented in the 2014 convergence programme, the Swedish government envisages a gradual improvement in the budget balance, culminating in a surplus of 0.7% of GDP by 2017. For 2015, the convergence programme suggests that the government expects the budget deficit to deteriorate slightly to 1.4% of GDP. The total revenue-to-GDP ratio is expected to decrease by 1.3 percentage points to 50.2% between 2013 and 2017. At the same time, the total expenditure ratio is expected to decline by 3.2 percentage points to 49.4% of GDP over the programme horizon, reflecting, inter alia, a reduction in the compensation of employees and social payments. Furthermore, government gross debt is projected to decrease over the programme horizon, reaching 34.8% of GDP in 2017. According to this fiscal strategy, the medium-term budgetary objective of a structural deficit of 1% of GDP (specified in line with the Stability and Growth Pact) over the cycle is projected to be met over the programme period. According to the European Commission’s projections, the structural balance will turn into a deficit in 2014, while still complying with the medium-term objective.
On 2 March 2012 Sweden signed the Treaty on Stability, Coordination and Governance in the Economic and Monetary Union (TSCG). Sweden has not declared its intention to be bound before adopting the euro by the fiscal rules specified under Title III, “Fiscal Compact” (see footnote 2 of Box 2 of Chapter 2).
Overall, as regards fiscal governance, Sweden has a strong rule-based fiscal framework consisting of, inter alia, an expenditure ceiling for central government, a general government structural surplus target (with the national target being stricter than the medium-term objective set in accordance with the Stability and Growth Pact) and a balanced budget requirement for local government.
Turning to factors that will have an impact on Sweden’s public finances over the long term, the country is facing a marked increase in the old-age dependency ratio, as indicated in Table 8. According to the 2012 projections of the European Commission and the EU’s Economic Policy Committee, starting from a level of 27.3% of GDP in 2010, Sweden is likely to experience an increase in strictly age-related government expenditure between 2010 and 2060 amounting to 4.4 percentage points, slightly below the EU average of 4.8 percentage points of GDP.21
As for fiscal challenges, Sweden should build on its strong track record and continue to anchor sound public finances in its rule-based fiscal framework in the years to come. Further improvements in fiscal performance should aim to reduce the supply-side repercussions of fiscal policies on the economy which stem, in particular, from labour market developments.
21 European Commission and Economic Policy Committee, “The 2012 Ageing Report: Economic and budgetary projections for the EU-27 Member States (2010-2060)”.
201ECB
Convergence ReportJune 2014
SWEDEN
5.8.3 EXCHANGE RATE DEVELOPMENTS
In the two-year reference period from 16 May 2012 to 15 May 2014, the Swedish krona did not participate in ERM II, but traded under a flexible exchange rate regime (see Table 9a). Over the reference period the Swedish currency mostly traded significantly above its May 2012 average exchange rate against the euro, which is used as a benchmark for illustrative purposes in the absence of an ERM II central rate. On 15 May 2014 the exchange rate stood at 8.9740 kronor per euro, i.e. 0.2% stronger than its average level in May 2012. Over the reference period the maximum upward deviation from this benchmark was 8.7%, while the maximum downward deviation amounted to 1.6% (see Chart 5 and Table 9a).
The exchange rate of the Swedish krona against the euro displayed, on average, a high degree of volatility over the reference period, as measured by annualised standard deviations in daily percentage changes. The currency appreciated by around 10% against the euro between May 2012 and August 2012 amid the strong performance of the Swedish economy and a positive interest rate differential vis-à-vis euro area assets. Thereafter, the krona depreciated by around 5% against the euro up to the end of 2012, partly owing to a worsening outlook for the Swedish economy. In the first quarter of 2013 the Swedish currency strengthened again by about 3% vis-à-vis the euro, before gradually depreciating by around 8% up to May 2014 on account of an improving economic outlook in the euro area. Over the reference period short-term interest rate differentials against the three-month EURIBOR decreased gradually from 1.5 percentage points in the three-month period ending in June 2012 to 0.6 percentage point in the three-month period ending in March 2014 (see Table 9b).
Over the reference period Sveriges Riksbank maintained a swap agreement with the ECB for borrowing up to €10 billion in exchange for Swedish kronor, which had been in place since 20 December 2007 with the aim of facilitating the functioning of financial markets and providing euro liquidity to the latter if needed. As this arrangement helped to reduce financial vulnerabilities, it might also have had an impact on the exchange rate of the Swedish krona.
In a longer-term context, in April 2014 both the real effective exchange rate and the real bilateral exchange rate of the Swedish krona against the euro stood close to the corresponding ten-year historical averages (see Table 10). As regards other external developments, since 2004 Sweden has accumulated large surpluses of, on average, around 7% of GDP in its combined current and capital account of the balance of payments, which reached 6.0% of GDP in 2013 (see Table 11), reflecting surpluses in the goods, services and income balances. As a result, Sweden has recorded persistently large net capital outflows in its financial account, in particular with regard to direct investment and other investment flows. Gross external debt increased sharply from 140.8% of GDP in 2004 to 213.5% in 2009, but decreased thereafter to 196.8% in 2013. At the same time the country’s net international investment position improved from -24.9% of GDP in 2004 to -12.1% in 2012 and -5.0% in 2013. Sweden is a small open economy; the ratio of foreign trade in goods and services to GDP decreased slightly from 44.4% of GDP in 2004 to 44.2% in 2013 for exports and increased from 36.6% in 2004 to 39.1% in 2013 for imports. Over the same period Sweden’s share in world exports decreased from 1.42% to 1.07%.
Concerning measures of economic integration with the euro area, in 2013 exports of goods to the euro area constituted 39.8% of total goods exports, whereas the corresponding figure for imports was higher at 48.7%. The share of euro area countries in Sweden’s inward direct investment stood
202ECBConvergence ReportJune 2014
at 57.4% in 2013 and in its portfolio investment liabilities at 41.5% in 2012. The share of Sweden’s assets invested in the euro area amounted to 41.6% in the case of direct investment in 2013 and 42.6% in the case of portfolio investment in 2012 (see Table 12).
5.8.4 LONG-TERM INTEREST RATE DEVELOPMENTS
Long-term interest rates in Sweden were 2.2% on average over the reference period from May 2013 to April 2014 and were thus well below the 6.2% reference value for the interest rate convergence criterion (see Table 13).
Following a decline in 2004 and most of 2005, Sweden’s long-term interest rates began to increase thereafter and reached 4.5% in mid-2007, principally as a result of strong growth (see Chart 6a). Amid the global financial and economic crisis, inflation in Sweden started to fall at the end of 2008 and long-term interest rates declined to 2.7% in December of that year. In the course of the euro area sovereign debt crisis, Swedish long-term interest rates fell to a historically low level of 1.3%, partly reflecting the high perceived creditworthiness of the Swedish government and strong demand for Swedish krona assets amid safe-haven portfolio shifts. From mid-2012 they increased as safe-haven effects abated in the context of an easing of euro area financial market tensions. From May 2013, long-term interest rates increased in line with long-term interest rate developments in major global economies, and were 2.1% at the end of the reference period.
The interest rate differential between Swedish and average euro area long-term interest rates (see Chart 6b) was slightly positive during 2004, mostly reflecting a more pronounced fall in euro area bond rates. From mid-2005 to 2007, the differential was slightly negative and relatively stable. In 2008, the interest rate differential with the euro area average started to widen significantly, to reach -3.0% in late 2011. Thereafter it narrowed again as a result of the decline in euro area long-term interest rates and, to a lesser extent, the increase in Swedish long-term interest rates. It stood at -0.3 percentage point at the end of the reference period (and 0.4 percentage point with respect to the AAA euro area yield).
The Swedish capital market is highly developed. The debt securities issued by corporations stood at 136.3% of GDP at the end of 2013, well above the euro area average (see Table 14). Similarly, stock market capitalisation (124.8% of GDP) was also well above the euro area average. In terms of bank credit to non-government residents, the indicator for the Swedish financial sector surpassed that of the euro area and amounted to 136.2% of GDP at the end of 2013. Foreign-owned banks have only a limited role in the Swedish banking sector, and the majority of loans to the private sector are in local currency. Loans of euro area banks to banks in the country stood at 8.4% of total liabilities in 2013.
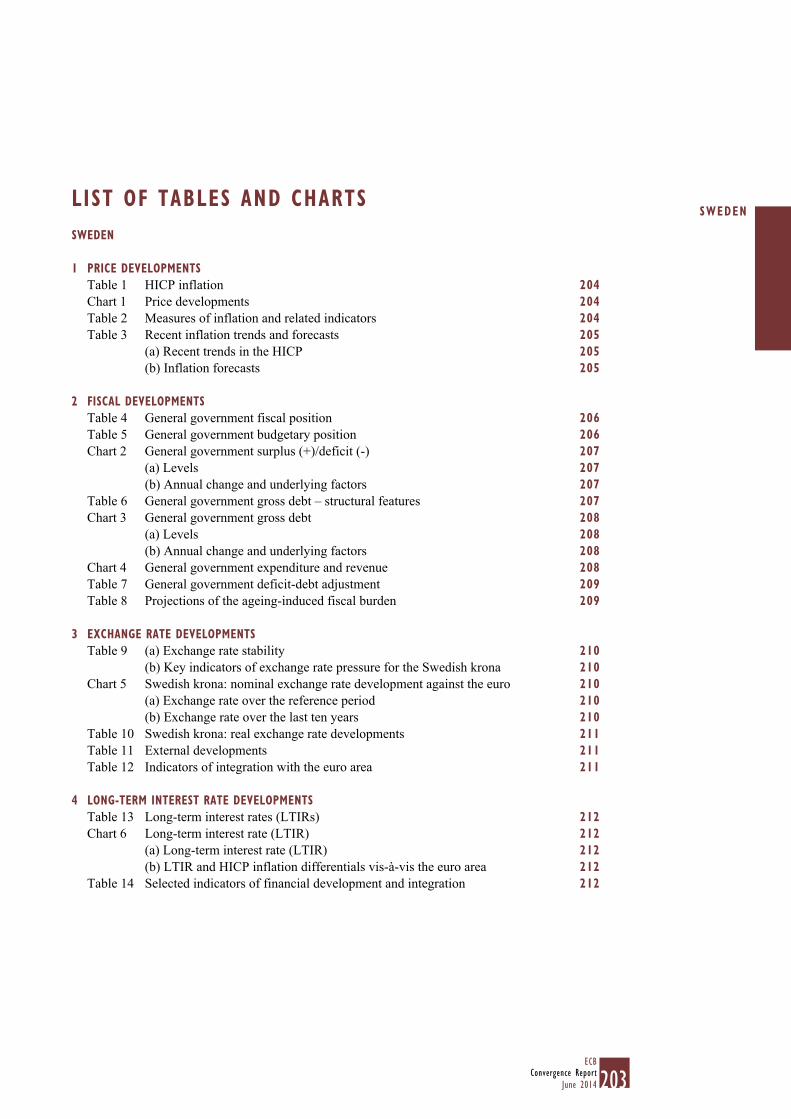
203ECB
Convergence ReportJune 2014
SWEDEN
SWEDEN
1 PRICE DEVELOPMENTSTable 1 HICP inflation 204Chart 1 Price developments 204Table 2 Measures of inflation and related indicators 204Table 3 Recent inflation trends and forecasts 205
(a) Recent trends in the HICP 205(b) Inflation forecasts 205
2 FISCAL DEVELOPMENTSTable 4 General government fiscal position 206Table 5 General government budgetary position 206Chart 2 General government surplus (+)/deficit (-) 207
(a) Levels 207(b) Annual change and underlying factors 207
Table 6 General government gross debt – structural features 207Chart 3 General government gross debt 208
(a) Levels 208(b) Annual change and underlying factors 208
Chart 4 General government expenditure and revenue 208Table 7 General government deficit-debt adjustment 209Table 8 Projections of the ageing-induced fiscal burden 209
3 EXCHANGE RATE DEVELOPMENTSTable 9 (a) Exchange rate stability 210
(b) Key indicators of exchange rate pressure for the Swedish krona 210Chart 5 Swedish krona: nominal exchange rate development against the euro 210
(a) Exchange rate over the reference period 210(b) Exchange rate over the last ten years 210
Table 10 Swedish krona: real exchange rate developments 211Table 11 External developments 211Table 12 Indicators of integration with the euro area 211
4 LONG-TERM INTEREST RATE DEVELOPMENTSTable 13 Long-term interest rates (LTIRs) 212Chart 6 Long-term interest rate (LTIR) 212
(a) Long-term interest rate (LTIR) 212(b) LTIR and HICP inflation differentials vis-à-vis the euro area 212
Table 14 Selected indicators of financial development and integration 212
LIST OF TABLES AND CHARTS

204ECBConvergence ReportJune 2014
1 PRICE DEVELOPMENTSTable 1 HICP inflation
(annual percentage changes)
2014 May 2013 to Apr. 2014 Jan. Feb. Mar. Apr.
HICP inflation 0.2 0.1 -0.4 0.3 0.3 Reference value 1) 1.7 Euro area 2) 0.8 0.7 0.5 0.7 1.0
Source: European Commission (Eurostat).1) The basis of the calculation for the period May 2013-April 2014
is the unweighted arithmetic average of the annual percentage changes in the HICP for Latvia, Portugal and Ireland plus 1.5 percentage points.
2) The euro area is included for information only.
Chart 1 Price developments
(average annual percentage changes)
-4
-2
0
2
4
6
-4
-2
0
2
4
6
2012 2013
HICPunit labour costsimport deflator
2004 2005 2006 2007 2008 2009 2010 2011
Source: European Commission (Eurostat).
Table 2 Measures of inflation and related indicators
(annual percentage changes, unless otherwise stated)
2004 2005 2006 2007 2008 2009 2010 2011 2012 2013
Measures of inflationHICP 1.0 0.8 1.5 1.7 3.3 1.9 1.9 1.4 0.9 0.4 HICP excluding unprocessed food and energy 0.8 0.2 0.5 1.8 2.3 2.3 1.5 1.1 1.0 0.5 HICP at constant tax rates 1) 0.9 0.7 1.4 1.3 2.7 1.8 1.9 1.4 1.3 0.4 CPI 0.4 0.5 1.4 2.2 3.4 -0.5 1.2 3.0 0.9 0.0 Private consumption deflator 0.8 1.1 1.2 1.4 3.1 2.1 1.5 1.7 1.2 0.6 GDP deflator 0.3 0.9 1.9 2.8 3.1 2.1 0.8 1.3 1.0 0.8 Producer prices 2) 1.8 3.9 6.1 3.6 6.1 -0.3 3.0 0.9 -0.3 -0.7 Related indicatorsReal GDP growth 4.2 3.2 4.3 3.3 -0.6 -5.0 6.6 2.9 0.9 1.5 GDP per capita in PPS 3) (euro area = 100) 116.3 112.0 113.1 115.2 114.1 110.8 113.8 115.2 116.6 . Comparative price levels (euro area = 100) 117.9 116.7 116.3 114.1 109.4 101.7 116.0 121.8 126.0 . Output gap 4) -0.1 0.5 2.1 3.0 0.4 -5.8 -1.5 -0.4 -1.4 -2.0 Unemployment rate (%) 5) 7.4 7.6 7.0 6.1 6.2 8.3 8.6 7.8 8.0 8.0 Unit labour costs, whole economy -0.9 0.2 -0.5 4.2 3.1 4.4 -2.3 0.1 2.9 0.7 Compensation per employee, whole economy 4.0 3.1 2.1 5.2 1.5 1.6 3.1 0.9 3.1 1.2 Labour productivity, whole economy 5.0 2.9 2.6 1.0 -1.5 -2.7 5.5 0.8 0.2 0.5 Imports of goods and services deflator 0.9 4.6 3.3 0.6 4.4 0.2 0.2 -0.4 -1.0 -2.8 Nominal effective exchange rate 6) 2.0 -2.6 0.3 1.6 -2.1 -8.8 7.8 5.6 1.0 2.7 Money supply (M3) 7) 3.6 11.5 15.8 16.6 7.1 -2.2 6.8 6.5 3.8 2.5 Lending from banks 8) 5.9 11.0 11.4 14.4 7.5 3.3 7.3 5.5 3.6 3.0 Stock prices (Sweden OMX Index) 16.6 29.4 19.5 -5.7 -38.8 43.7 21.4 -14.5 11.8 20.7 Residential property prices 9.3 9.0 12.2 10.4 3.3 1.6 7.8 0.7 -1.4 3.1
Sources: European Commission (Eurostat), national data (CPI, money supply, lending from banks and residential property prices) and European Commission (output gap).1) The difference between the “HICP” and the “HICP at constant tax rates” shows the theoretical impact of changes in indirect taxes
(e.g. VAT and excise duties) on the overall rate of inflation. This impact assumes a full and instantaneous pass-through of tax rate changes on the price paid by the consumer.
2) Domestic sales, total industry excluding construction.3) PPS stands for purchasing power standards.4) Percentage difference of potential GDP: a positive (negative) sign indicates that actual GDP is above (below) potential GDP.5) The definition conforms to ILO guidelines.6) A positive (negative) sign indicates an appreciation (depreciation).7) The series includes repurchase agreements with central counterparties.8) Not adjusted for the derecognition of loans from the MFI statistical balance sheet due to their sale or securitisation.

205ECB
Convergence ReportJune 2014
SWEDEN
Table 3 Recent inflation trends and forecasts
(annual percentage changes)
(a) Recent trends in the HICP2013 2014
Nov. Dec. Jan. Feb. Mar. Apr.
HICPAnnual percentage change 0.3 0.4 0.2 0.1 -0.4 0.3 Change in the average of the latest three months from the previous three months, annualised rate, seasonally adjusted -0.4 -0.6 -0.5 -0.2 -1.1 -0.9 Change in the average of the latest six months from the previous six months, annualised rate, seasonally adjusted 0.6 0.7 0.4 0.1 -0.2 -0.3
Sources: European Commission (Eurostat) and ECB calculations.
(b) Inflation forecasts2014 2015
HICP, European Commission (Spring 2014) 0.5 1.5 CPI, OECD (May 2014) 0.1 1.4 CPI, IMF (April 2014) 0.4 1.6 CPI, Consensus Economics (April 2014) 0.3 1.8
Sources: European Commission, OECD, IMF and Consensus Economics.

206ECBConvergence ReportJune 2014
2 FISCAL DEVELOPMENTSTable 4 General government fiscal position
(as a percentage of GDP)
2012 2013 2014 1)
General government surplus (+)/deficit (-) -0.6 -1.1 -1.8 Reference value -3.0 -3.0 -3.0 Surplus/deficit, net of government investment expenditure 2) 3.0 2.2 1.6
General government gross debt 38.3 40.6 41.6 Reference value 60.0 60.0 60.0
Sources: European Commission (Eurostat, DG ECFIN) and ECB calculations.1) European Commission projections.2) A positive (negative) sign indicates that the government deficit is lower (higher) than government investment expenditure.
Table 5 General government budgetary position
(as a percentage of GDP)
2004 2005 2006 2007 2008 2009 2010 2011 2012 2013
Total revenue 54.6 55.8 54.9 54.5 53.9 54.0 52.3 51.5 51.2 51.5 Current revenue 54.4 55.7 54.9 54.4 53.8 53.9 52.2 51.4 50.8 51.2
Direct taxes 20.8 22.0 22.2 21.2 19.8 19.6 19.2 18.5 18.1 18.5 Indirect taxes 16.2 16.3 16.5 16.5 17.9 18.7 17.8 18.6 18.5 18.8 Social security contributions 11.1 10.7 9.8 9.9 9.0 8.7 8.7 7.7 7.7 7.5 Other current revenue 6.3 6.7 6.4 6.8 7.1 7.0 6.5 6.5 6.4 6.4
Capital revenue 0.2 0.1 0.1 0.1 0.1 0.1 0.1 0.1 0.4 0.4 Total expenditure 54.0 53.6 52.6 50.9 51.7 54.7 52.0 51.3 51.8 52.6
Current expenditure 50.9 50.4 49.4 47.8 48.4 51.1 48.5 47.7 48.1 49.0 Compensation of employees 15.8 15.6 15.1 14.9 14.8 15.2 14.5 14.0 14.3 14.4 Social benefits other than in kind 16.0 15.7 15.2 14.4 14.4 15.7 14.7 14.1 14.5 14.8 Interest payable 1.6 1.6 1.6 1.7 1.7 1.0 0.8 1.0 0.7 0.6
of which: impact of swaps and FRAs 1) -0.2 -0.2 -0.1 0.0 0.0 -0.3 -0.3 -0.2 -0.2 -0.2 Other current expenditure 17.5 17.5 17.5 16.8 17.6 19.3 18.4 18.6 18.6 19.2
Capital expenditure 3.0 3.3 3.2 3.2 3.3 3.6 3.5 3.6 3.7 3.6
Surplus (+)/deficit (-) 0.6 2.2 2.3 3.6 2.2 -0.7 0.3 0.2 -0.6 -1.1
Primary balance 2.2 3.8 3.9 5.3 3.8 0.2 1.1 1.2 0.2 -0.5 Surplus/deficit, net of government investment expenditure 3.6 5.2 5.4 6.7 5.5 2.8 3.8 3.6 3.0 2.2
Sources: ESCB and European Commission (Eurostat).Notes: Differences between totals and the sum of their components are due to rounding. Interest payable as reported under the excessive deficit procedure. The item “impact of swaps and FRAs” is equal to the difference between the interest (or deficit/surplus) as defined in the excessive deficit procedure and in the ESA 95. See Regulation (EC) No 2558/2001 of the European Parliament and of the Council of 3 December 2001 amending Council Regulation (EC) No 2223/96 as regards the reclassification of settlements under swap arrangements and under forward rate agreements (0J L 344, 28.12.2001, p. 1).1) FRAs stands for forward rate agreements.
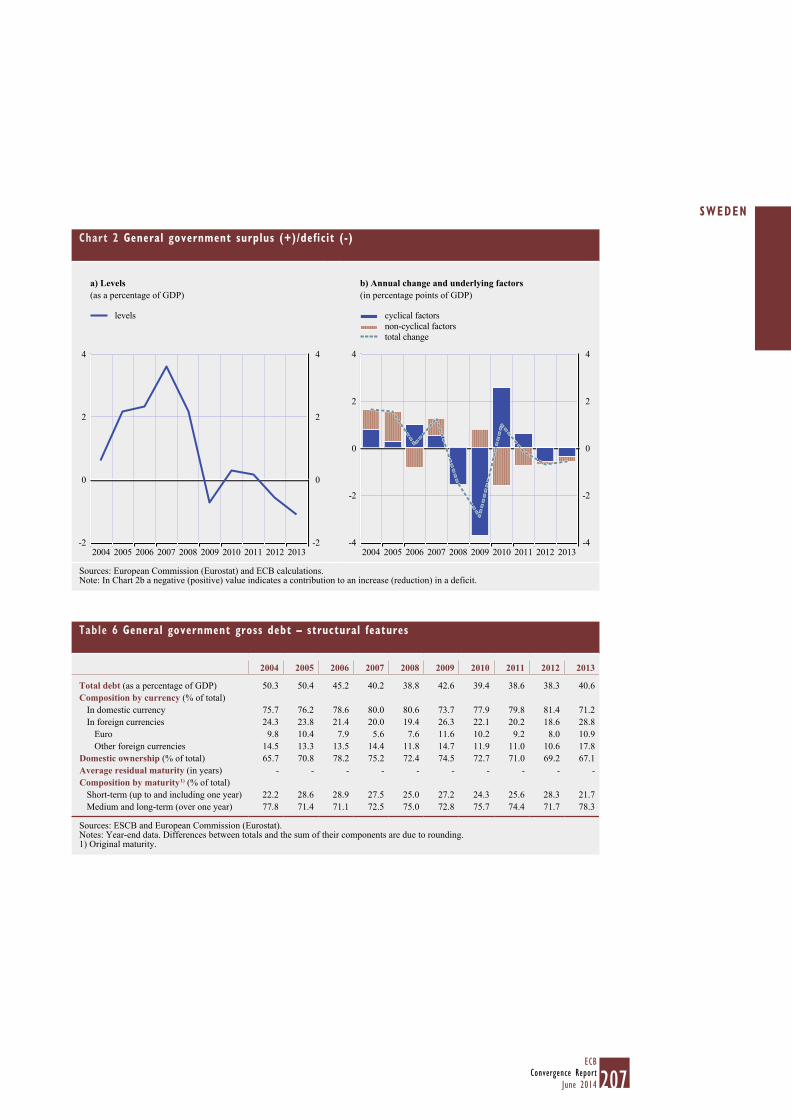
207ECB
Convergence ReportJune 2014
SWEDEN
Chart 2 General government surplus (+)/deficit (-)
a) Levels(as a percentage of GDP)
b) Annual change and underlying factors
(in percentage points of GDP)
-2
0
2
4
-2
0
2
4
2012 20132004 2005 2006 2007 2008 2009 2010 2011
levels
-4
-2
0
2
4
-4
-2
0
2
4
2012 20132004 2005 2006 2007 2008 2009 2010 2011
cyclical factorsnon-cyclical factorstotal change
Sources: European Commission (Eurostat) and ECB calculations.Note: In Chart 2b a negative (positive) value indicates a contribution to an increase (reduction) in a deficit.
Table 6 General government gross debt – structural features
2004 2005 2006 2007 2008 2009 2010 2011 2012 2013
Total debt (as a percentage of GDP) 50.3 50.4 45.2 40.2 38.8 42.6 39.4 38.6 38.3 40.6 Composition by currency (% of total)
In domestic currency 75.7 76.2 78.6 80.0 80.6 73.7 77.9 79.8 81.4 71.2 In foreign currencies 24.3 23.8 21.4 20.0 19.4 26.3 22.1 20.2 18.6 28.8
Euro 9.8 10.4 7.9 5.6 7.6 11.6 10.2 9.2 8.0 10.9 Other foreign currencies 14.5 13.3 13.5 14.4 11.8 14.7 11.9 11.0 10.6 17.8
Domestic ownership (% of total) 65.7 70.8 78.2 75.2 72.4 74.5 72.7 71.0 69.2 67.1 Average residual maturity (in years) - - - - - - - - - -Composition by maturity 1) (% of total)
Short-term (up to and including one year) 22.2 28.6 28.9 27.5 25.0 27.2 24.3 25.6 28.3 21.7 Medium and long-term (over one year) 77.8 71.4 71.1 72.5 75.0 72.8 75.7 74.4 71.7 78.3
Sources: ESCB and European Commission (Eurostat).Notes: Year-end data. Differences between totals and the sum of their components are due to rounding.1) Original maturity.
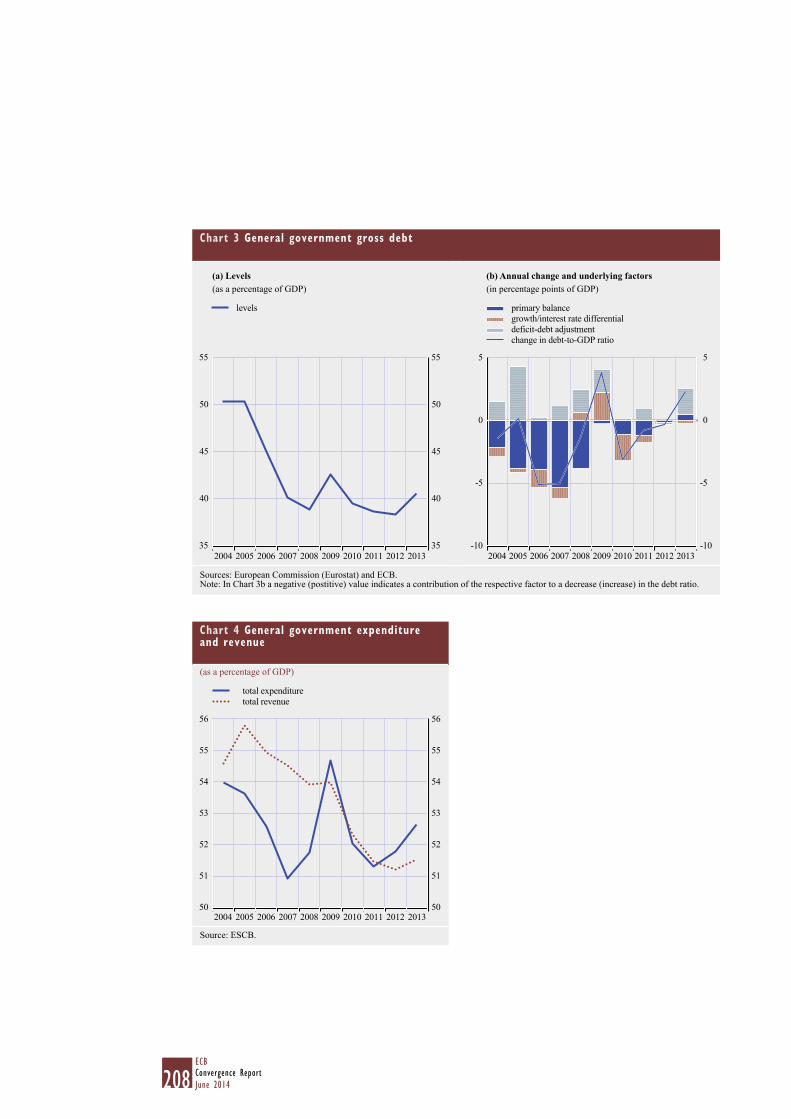
208ECBConvergence ReportJune 2014
Chart 3 General government gross debt
(a) Levels(as a percentage of GDP)
(b) Annual change and underlying factors(in percentage points of GDP)
35
40
45
50
55
35
40
45
50
55
2012
levels
2004 2005 2007 2009 2011 20132006 2008 2010-10
-5
0
5
-10
-5
0
5
2012
primary balancegrowth/interest rate differentialdeficit-debt adjustmentchange in debt-to-GDP ratio
2004 2005 2007 2009 2011 20132006 2008 2010
Sources: European Commission (Eurostat) and ECB.Note: In Chart 3b a negative (postitive) value indicates a contribution of the respective factor to a decrease (increase) in the debt ratio.
Chart 4 General government expenditure and revenue
(as a percentage of GDP)
50
51
52
53
54
55
56
50
51
52
53
54
55
56
2004
total expendituretotal revenue
20122010200820062005 2013201120092007
Source: ESCB.
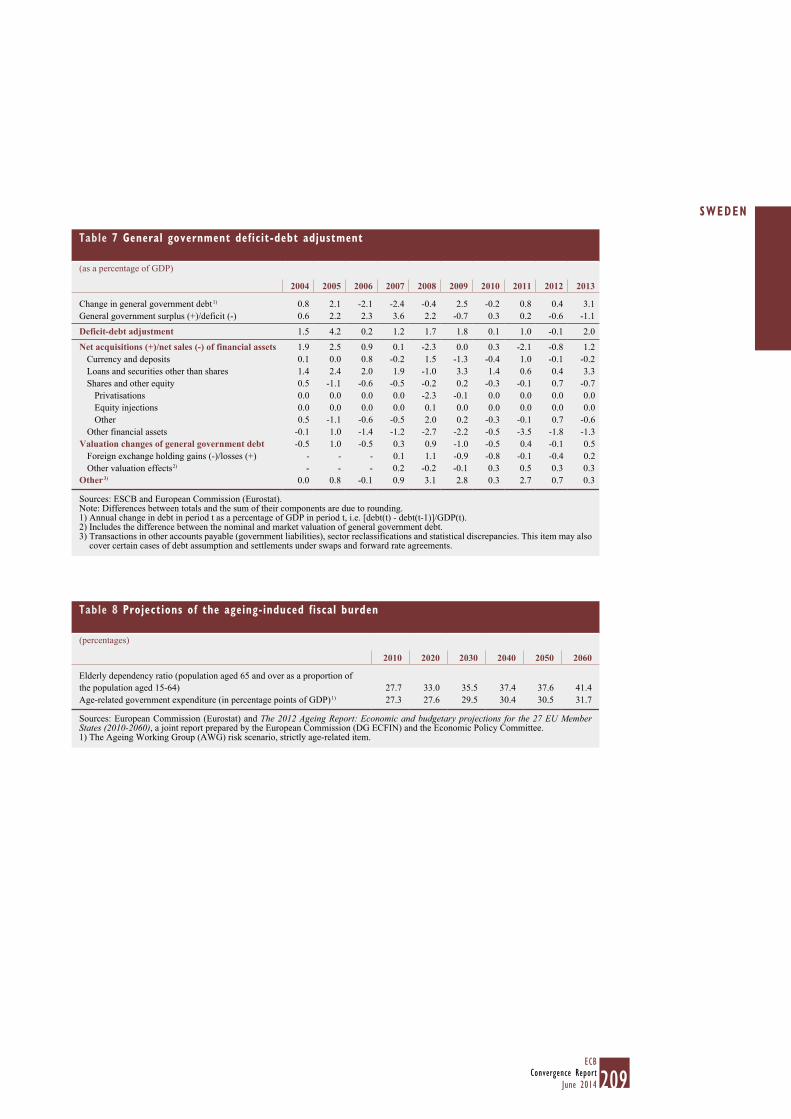
209ECB
Convergence ReportJune 2014
SWEDEN
Table 7 General government deficit-debt adjustment
(as a percentage of GDP)
2004 2005 2006 2007 2008 2009 2010 2011 2012 2013
Change in general government debt 1) 0.8 2.1 -2.1 -2.4 -0.4 2.5 -0.2 0.8 0.4 3.1 General government surplus (+)/deficit (-) 0.6 2.2 2.3 3.6 2.2 -0.7 0.3 0.2 -0.6 -1.1
Deficit-debt adjustment 1.5 4.2 0.2 1.2 1.7 1.8 0.1 1.0 -0.1 2.0
Net acquisitions (+)/net sales (-) of financial assets 1.9 2.5 0.9 0.1 -2.3 0.0 0.3 -2.1 -0.8 1.2 Currency and deposits 0.1 0.0 0.8 -0.2 1.5 -1.3 -0.4 1.0 -0.1 -0.2 Loans and securities other than shares 1.4 2.4 2.0 1.9 -1.0 3.3 1.4 0.6 0.4 3.3 Shares and other equity 0.5 -1.1 -0.6 -0.5 -0.2 0.2 -0.3 -0.1 0.7 -0.7
Privatisations 0.0 0.0 0.0 0.0 -2.3 -0.1 0.0 0.0 0.0 0.0 Equity injections 0.0 0.0 0.0 0.0 0.1 0.0 0.0 0.0 0.0 0.0 Other 0.5 -1.1 -0.6 -0.5 2.0 0.2 -0.3 -0.1 0.7 -0.6
Other financial assets -0.1 1.0 -1.4 -1.2 -2.7 -2.2 -0.5 -3.5 -1.8 -1.3 Valuation changes of general government debt -0.5 1.0 -0.5 0.3 0.9 -1.0 -0.5 0.4 -0.1 0.5
Foreign exchange holding gains (-)/losses (+) - - - 0.1 1.1 -0.9 -0.8 -0.1 -0.4 0.2 Other valuation effects 2) - - - 0.2 -0.2 -0.1 0.3 0.5 0.3 0.3
Other 3) 0.0 0.8 -0.1 0.9 3.1 2.8 0.3 2.7 0.7 0.3
Sources: ESCB and European Commission (Eurostat).Note: Differences between totals and the sum of their components are due to rounding.1) Annual change in debt in period t as a percentage of GDP in period t, i.e. [debt(t) - debt(t-1)]/GDP(t).2) Includes the difference between the nominal and market valuation of general government debt.3) Transactions in other accounts payable (government liabilities), sector reclassifications and statistical discrepancies. This item may also
cover certain cases of debt assumption and settlements under swaps and forward rate agreements.
Table 8 Projections of the ageing-induced fiscal burden
(percentages)
2010 2020 2030 2040 2050 2060
Elderly dependency ratio (population aged 65 and over as a proportion of the population aged 15-64) 27.7 33.0 35.5 37.4 37.6 41.4 Age-related government expenditure (in percentage points of GDP) 1) 27.3 27.6 29.5 30.4 30.5 31.7
Sources: European Commission (Eurostat) and The 2012 Ageing Report: Economic and budgetary projections for the 27 EU Member States (2010-2060), a joint report prepared by the European Commission (DG ECFIN) and the Economic Policy Committee.1) The Ageing Working Group (AWG) risk scenario, strictly age-related item.
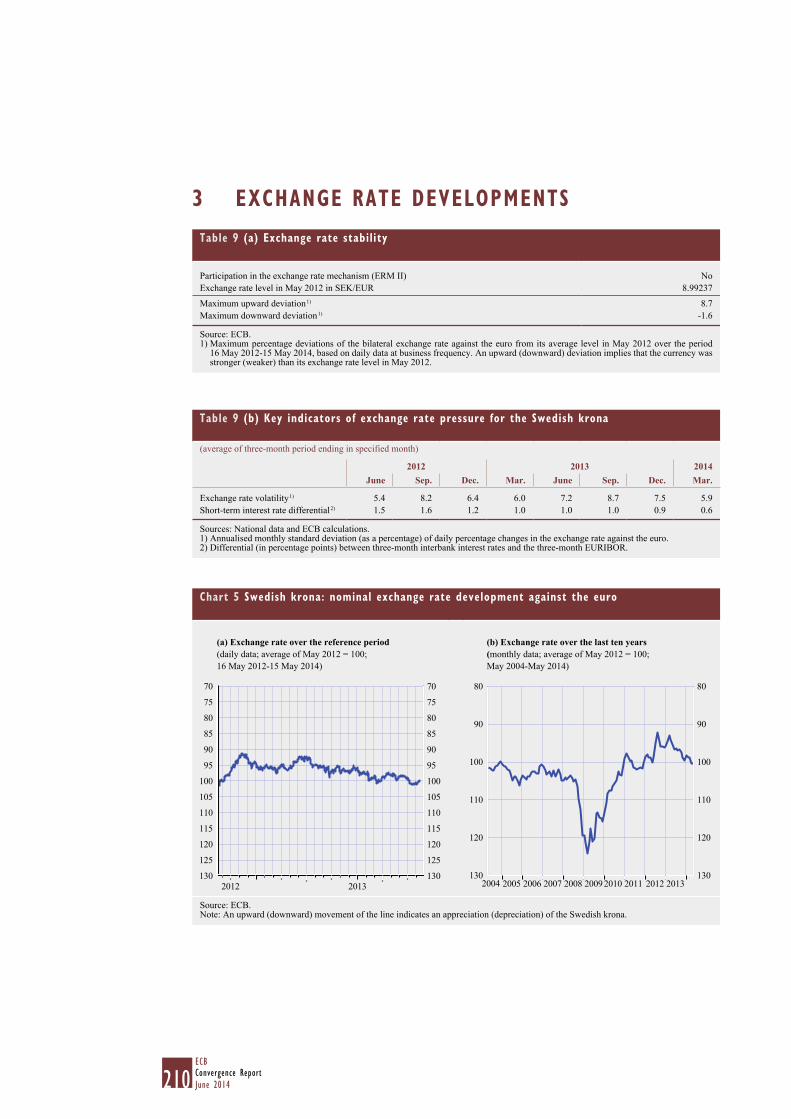
210ECBConvergence ReportJune 2014
3 EXCHANGE RATE DEVELOPMENTSTable 9 (a) Exchange rate stability
Participation in the exchange rate mechanism (ERM II) NoExchange rate level in May 2012 in SEK/EUR 8.99237
Maximum upward deviation 1) 8.7Maximum downward deviation 1) -1.6
Source: ECB.1) Maximum percentage deviations of the bilateral exchange rate against the euro from its average level in May 2012 over the period
16 May 2012-15 May 2014, based on daily data at business frequency. An upward (downward) deviation implies that the currency was stronger (weaker) than its exchange rate level in May 2012.
Table 9 (b) Key indicators of exchange rate pressure for the Swedish krona
(average of three-month period ending in specified month)
2012 2013 2014June Sep. Dec. Mar. June Sep. Dec. Mar.
Exchange rate volatility 1) 5.4 8.2 6.4 6.0 7.2 8.7 7.5 5.9 Short-term interest rate differential 2) 1.5 1.6 1.2 1.0 1.0 1.0 0.9 0.6
Sources: National data and ECB calculations.1) Annualised monthly standard deviation (as a percentage) of daily percentage changes in the exchange rate against the euro.2) Differential (in percentage points) between three-month interbank interest rates and the three-month EURIBOR.
Chart 5 Swedish krona: nominal exchange rate development against the euro
(a) Exchange rate over the reference period(daily data; average of May 2012 = 100; 16 May 2012-15 May 2014)
(b) Exchange rate over the last ten years(monthly data; average of May 2012 = 100; May 2004-May 2014)
130
125
120
115
110
105
100
95
90
85
80
75
70
130
125
120
115
110
105
100
95
90
85
80
75
70
2012 2013130
120
110
100
90
80
130
120
110
100
90
80
2012 20132004 2005 2006 2007 2008 20092010 2011
Source: ECB.Note: An upward (downward) movement of the line indicates an appreciation (depreciation) of the Swedish krona.
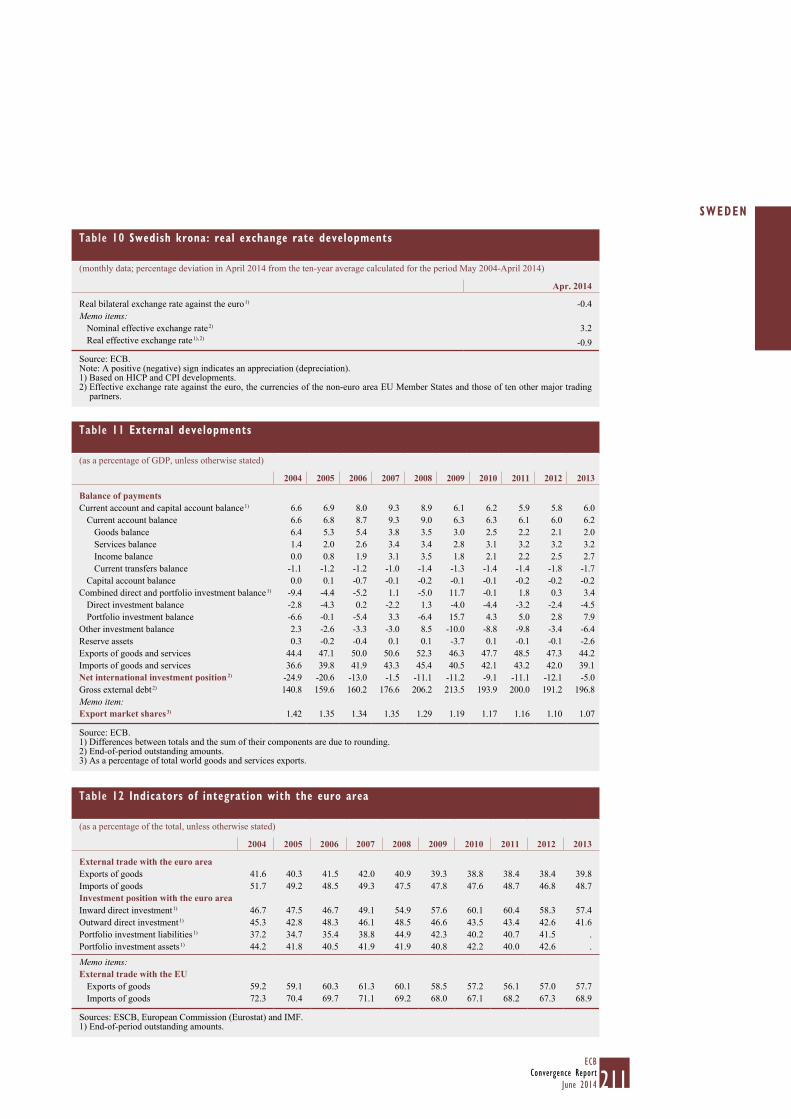
211ECB
Convergence ReportJune 2014
SWEDEN
Table 10 Swedish krona: real exchange rate developments
(monthly data; percentage deviation in April 2014 from the ten-year average calculated for the period May 2004-April 2014)
Apr. 2014
Real bilateral exchange rate against the euro 1) -0.4Memo items:
Nominal effective exchange rate 2) 3.2Real effective exchange rate 1), 2) -0.9
Source: ECB.Note: A positive (negative) sign indicates an appreciation (depreciation).1) Based on HICP and CPI developments.2) Effective exchange rate against the euro, the currencies of the non-euro area EU Member States and those of ten other major trading
partners.
Table 11 External developments
(as a percentage of GDP, unless otherwise stated)
2004 2005 2006 2007 2008 2009 2010 2011 2012 2013
Balance of paymentsCurrent account and capital account balance 1) 6.6 6.9 8.0 9.3 8.9 6.1 6.2 5.9 5.8 6.0
Current account balance 6.6 6.8 8.7 9.3 9.0 6.3 6.3 6.1 6.0 6.2 Goods balance 6.4 5.3 5.4 3.8 3.5 3.0 2.5 2.2 2.1 2.0 Services balance 1.4 2.0 2.6 3.4 3.4 2.8 3.1 3.2 3.2 3.2 Income balance 0.0 0.8 1.9 3.1 3.5 1.8 2.1 2.2 2.5 2.7 Current transfers balance -1.1 -1.2 -1.2 -1.0 -1.4 -1.3 -1.4 -1.4 -1.8 -1.7
Capital account balance 0.0 0.1 -0.7 -0.1 -0.2 -0.1 -0.1 -0.2 -0.2 -0.2 Combined direct and portfolio investment balance 1) -9.4 -4.4 -5.2 1.1 -5.0 11.7 -0.1 1.8 0.3 3.4
Direct investment balance -2.8 -4.3 0.2 -2.2 1.3 -4.0 -4.4 -3.2 -2.4 -4.5 Portfolio investment balance -6.6 -0.1 -5.4 3.3 -6.4 15.7 4.3 5.0 2.8 7.9
Other investment balance 2.3 -2.6 -3.3 -3.0 8.5 -10.0 -8.8 -9.8 -3.4 -6.4 Reserve assets 0.3 -0.2 -0.4 0.1 0.1 -3.7 0.1 -0.1 -0.1 -2.6 Exports of goods and services 44.4 47.1 50.0 50.6 52.3 46.3 47.7 48.5 47.3 44.2 Imports of goods and services 36.6 39.8 41.9 43.3 45.4 40.5 42.1 43.2 42.0 39.1 Net international investment position 2) -24.9 -20.6 -13.0 -1.5 -11.1 -11.2 -9.1 -11.1 -12.1 -5.0 Gross external debt 2) 140.8 159.6 160.2 176.6 206.2 213.5 193.9 200.0 191.2 196.8 Memo item: Export market shares 3) 1.42 1.35 1.34 1.35 1.29 1.19 1.17 1.16 1.10 1.07
Source: ECB.1) Differences between totals and the sum of their components are due to rounding.2) End-of-period outstanding amounts.3) As a percentage of total world goods and services exports.
Table 12 Indicators of integration with the euro area
(as a percentage of the total, unless otherwise stated)
2004 2005 2006 2007 2008 2009 2010 2011 2012 2013
External trade with the euro areaExports of goods 41.6 40.3 41.5 42.0 40.9 39.3 38.8 38.4 38.4 39.8 Imports of goods 51.7 49.2 48.5 49.3 47.5 47.8 47.6 48.7 46.8 48.7 Investment position with the euro areaInward direct investment 1) 46.7 47.5 46.7 49.1 54.9 57.6 60.1 60.4 58.3 57.4 Outward direct investment 1) 45.3 42.8 48.3 46.1 48.5 46.6 43.5 43.4 42.6 41.6 Portfolio investment liabilities 1) 37.2 34.7 35.4 38.8 44.9 42.3 40.2 40.7 41.5 . Portfolio investment assets 1) 44.2 41.8 40.5 41.9 41.9 40.8 42.2 40.0 42.6 .
Memo items: External trade with the EU
Exports of goods 59.2 59.1 60.3 61.3 60.1 58.5 57.2 56.1 57.0 57.7 Imports of goods 72.3 70.4 69.7 71.1 69.2 68.0 67.1 68.2 67.3 68.9
Sources: ESCB, European Commission (Eurostat) and IMF.1) End-of-period outstanding amounts.
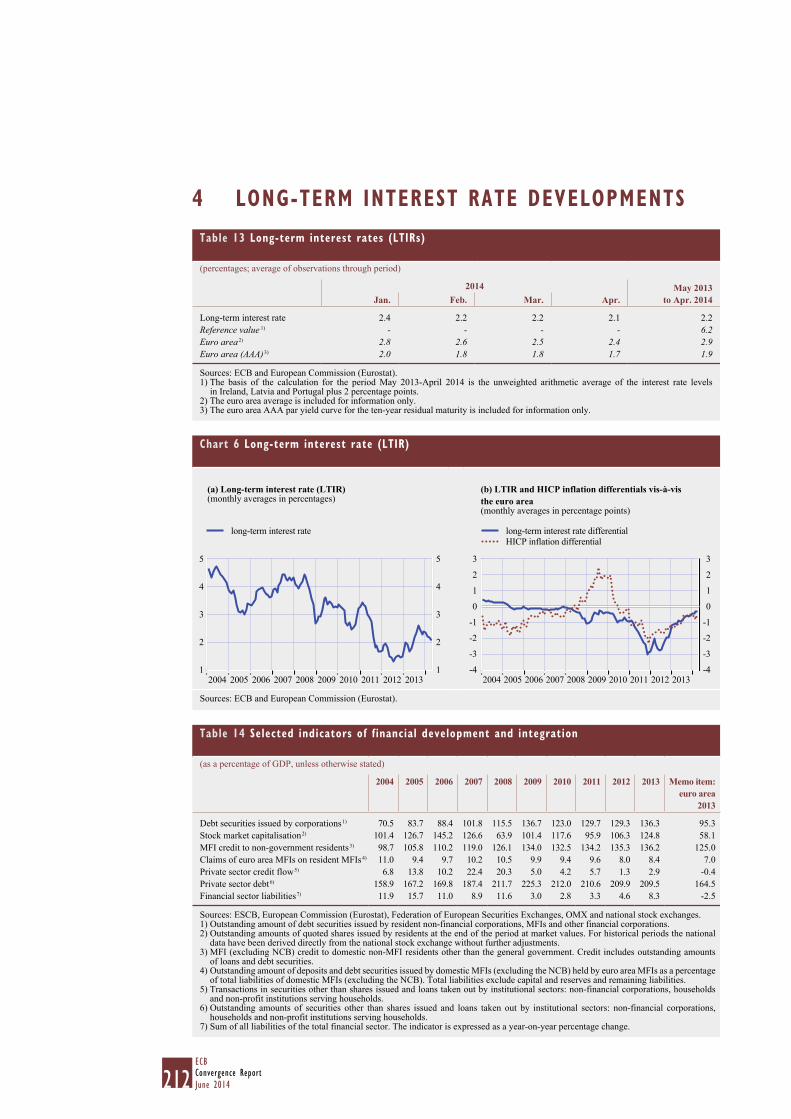
212ECBConvergence ReportJune 2014
4 LONG-TERM INTEREST RATE DEVELOPMENTSTable 13 Long-term interest rates (LTIRs)
(percentages; average of observations through period)
2014 May 2013 to Apr. 2014Jan. Feb. Mar. Apr.
Long-term interest rate 2.4 2.2 2.2 2.1 2.2 Reference value 1) - - - - 6.2 Euro area 2) 2.8 2.6 2.5 2.4 2.9 Euro area (AAA) 3) 2.0 1.8 1.8 1.7 1.9
Sources: ECB and European Commission (Eurostat).1) The basis of the calculation for the period May 2013-April 2014 is the unweighted arithmetic average of the interest rate levels
in Ireland, Latvia and Portugal plus 2 percentage points.2) The euro area average is included for information only.3) The euro area AAA par yield curve for the ten-year residual maturity is included for information only.
Chart 6 Long-term interest rate (LTIR)
(a) Long-term interest rate (LTIR)(monthly averages in percentages)
(b) LTIR and HICP inflation differentials vis-à-vis the euro area(monthly averages in percentage points)
1
2
3
4
5
1
2
3
4
5
2004
long-term interest rate
20122010200820062005 2013201120092007-4
-3
-2
-1
0
1
2
3
-4
-3
-2
-1
0
1
2
3
2004 20122010200820062005 2013201120092007
long-term interest rate differentialHICP inflation differential
Sources: ECB and European Commission (Eurostat).
Table 14 Selected indicators of financial development and integration
(as a percentage of GDP, unless otherwise stated)
2004 2005 2006 2007 2008 2009 2010 2011 2012 2013 Memo item: euro area
2013
Debt securities issued by corporations 1) 70.5 83.7 88.4 101.8 115.5 136.7 123.0 129.7 129.3 136.3 95.3 Stock market capitalisation 2) 101.4 126.7 145.2 126.6 63.9 101.4 117.6 95.9 106.3 124.8 58.1 MFI credit to non-government residents 3) 98.7 105.8 110.2 119.0 126.1 134.0 132.5 134.2 135.3 136.2 125.0 Claims of euro area MFIs on resident MFIs 4) 11.0 9.4 9.7 10.2 10.5 9.9 9.4 9.6 8.0 8.4 7.0 Private sector credit flow 5) 6.8 13.8 10.2 22.4 20.3 5.0 4.2 5.7 1.3 2.9 -0.4 Private sector debt 6) 158.9 167.2 169.8 187.4 211.7 225.3 212.0 210.6 209.9 209.5 164.5 Financial sector liabilities 7) 11.9 15.7 11.0 8.9 11.6 3.0 2.8 3.3 4.6 8.3 -2.5
Sources: ESCB, European Commission (Eurostat), Federation of European Securities Exchanges, OMX and national stock exchanges.1) Outstanding amount of debt securities issued by resident non-financial corporations, MFIs and other financial corporations.2) Outstanding amounts of quoted shares issued by residents at the end of the period at market values. For historical periods the national
data have been derived directly from the national stock exchange without further adjustments.3) MFI (excluding NCB) credit to domestic non-MFI residents other than the general government. Credit includes outstanding amounts
of loans and debt securities.4) Outstanding amount of deposits and debt securities issued by domestic MFIs (excluding the NCB) held by euro area MFIs as a percentage
of total liabilities of domestic MFIs (excluding the NCB). Total liabilities exclude capital and reserves and remaining liabilities.5) Transactions in securities other than shares issued and loans taken out by institutional sectors: non-financial corporations, households
and non-profit institutions serving households.6) Outstanding amounts of securities other than shares issued and loans taken out by institutional sectors: non-financial corporations,
households and non-profit institutions serving households.7) Sum of all liabilities of the total financial sector. The indicator is expressed as a year-on-year percentage change.
213ECB
Convergence ReportJune 2014
STAT IST ICAL METHODOLOGY
OF CONVERGENCE INDICATORS
5.9 STATISTICAL METHODOLOGY OF CONVERGENCE INDICATORS
The examination of the convergence process is highly dependent on the quality and integrity of the underlying statistics. The compilation and reporting of statistics, particularly government finance statistics (GFS), must not be subject to political considerations. Member States are invited to consider the quality and integrity of their statistics as a matter of priority, to ensure that a proper system of checks and balances is in place when compiling these statistics and to apply certain standards with respect to governance and quality in the domain of statistics.
National statistical authorities in each Member State and the EU statistical authority within the European Commission (Eurostat) should enjoy professional independence and ensure that European statistics are impartial and of a high quality. This is in line with the principles laid down in Article 338(2) of the Treaty, Regulation (EC) No 223/2009 of the European Parliament and of the Council of 11 March 2009 on European statistics22 (Regulation on European statistics) and the European Statistics Code of Practice endorsed by the Commission in 2005 and revised in September 201123 (the Code of Practice). Article 2(1) of the Regulation on European statistics states that the development, production and dissemination of European statistics shall be governed by the following statistical principles: a) professional independence; b) impartiality; c) objectivity; d) reliability; e) statistical confidentiality; and f) cost effectiveness. Pursuant to Article 11 of the Regulation, these statistical principles are further elaborated on in the Code of Practice.24
Against this background, the quality and integrity of the convergence indicators in terms of the underlying statistics are reviewed in the statistical section. This section refers to some institutional features of the national statistical institutes (NSIs) concerned and provides information on the statistical methodology of the convergence indicators, as well as on the compliance of the underlying statistics with the standards necessary for an appropriate assessment of the convergence process. Moreover, Sub-section 3.2 reviews in particular the public interventions to support financial institutions and financial markets during the financial crisis, as well as the financial support provided by international institutions or countries during the financial crisis.
5.9.1 INSTITUTIONAL FEATURES RELATING TO THE QUALITY OF STATISTICS FOR THE ASSESSMENT OF THE CONVERGENCE PROCESS
In recent years, the governance of the European Statistical System (ESS) has been improved, in particular with the adoption of the Code of Practice in 2005. Initially the implementation and monitoring of the Code relied to a large extent on a self-regulatory approach (self-assessments, peer reviews and national implementation plans). In 2009, the Regulation on European statistics entered into force and the European Statistical Governance Advisory Board (ESGAB) was established in order to provide an independent overview of the ESS with particular regard to implementing the Code of Practice. The ESGAB aims to enhance professional independence, integrity and accountability in the ESS, as well as the quality of European statistics. Its tasks include preparing an annual report for the European Parliament and the Council on the implementation of the Code of Practice insofar as it relates to Eurostat, including an assessment of the implementation of the Code in the ESS as a whole.
22 OJ L 87, 31.03.2009, p. 164.23 European Statistics Code of Practice endorsed by the Commission in its Recommendation of 25 May 2005 on the independence, integrity
and accountability of the national and Community statistical authorities (COM(2005) 217 final).24 See Articles 2(1) and 11 of the Regulation on European statistics.
214ECBConvergence ReportJune 2014
However, the experience gained in recent years highlighted some remaining weaknesses in the governance framework of the ESS which had to be addressed. These weaknesses were described in the Communication from the Commission to the European Parliament and the Council of 15 April 2011 entitled “Towards robust quality management for European Statistics”.25
In the specific context of the EU fiscal surveillance system and of the excessive deficit procedure (EDP), Council Regulation (EU) No 679/201026 granted Eurostat new competences for regularly monitoring and verifying public finance data, which it exercises by conducting more in-depth dialogue visits to Member States and by extending such visits to public entities supplying upstream public finance data to the NSIs.
Furthermore, the legislative package of six legal texts adopted to strengthen the economic governance structure of the euro area and the EU as a whole relies on high-quality statistical information, which needs to be produced under robust quality management.27
In this context, the Code of Practice was revised in September 2011 in order to distinguish between the principles to be implemented by ESS members and the principles relating to the institutional environment that are to be implemented by Member State governments.
Moreover, the Regulation on European statistics is currently under revision with a view to clarifying, among other things, that the principle of professional independence of NSIs applies unconditionally. Statistics must indeed be developed, produced and disseminated in an independent manner, free of any pressures from political or interest groups or from EU or national authorities, and existing institutional frameworks must not be allowed to restrict this principle.
Table 3 provides an overview of some of the institutional features relating to the quality of the statistics, namely the specification of the legal independence of the NSI, its administrative supervision and budget autonomy, its legal mandate for data collection and its legal provisions governing statistical confidentiality.
25 COM(2011) 211 final.26 Council Regulation (EU) No 679/2010 of 26 July 2010 amending Regulation (EC) No 479/2009 as regards the quality of statistical data in
the context of the excessive deficit procedure (OJ L 198, 30.07.2010, p. 4).27 On 13 December 2011, the reinforced Stability and Growth Pact entered into force with a new set of rules for economic and fiscal
surveillance. These new measures, known as the “six-pack”, consist of five regulations and one directive, proposed by the European Commission and approved by all EU Member States and the European Parliament in October 2011.
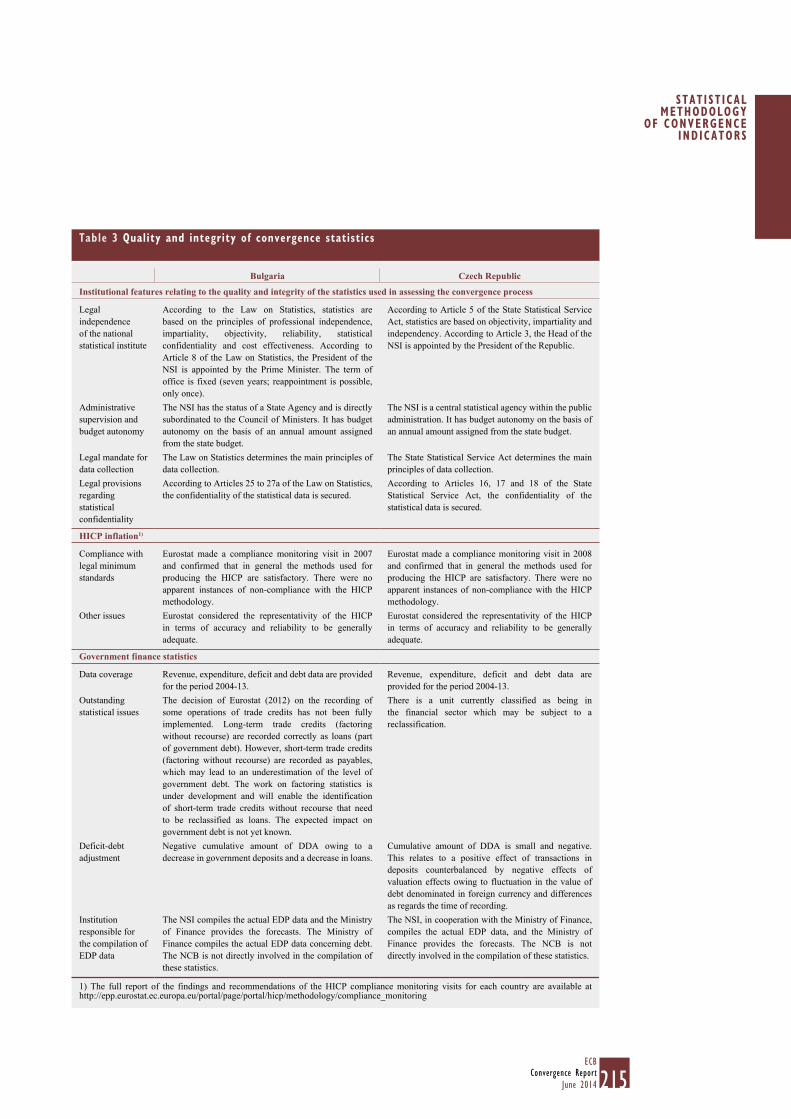
215ECB
Convergence ReportJune 2014
STAT IST ICAL METHODOLOGY
OF CONVERGENCE INDICATORS
Table 3 Quality and integrity of convergence statistics
Bulgaria Czech Republic
Institutional features relating to the quality and integrity of the statistics used in assessing the convergence process
Legal independence of the national statistical institute
According to the Law on Statistics, statistics are based on the principles of professional independence, impartiality, objectivity, reliability, statistical confidentiality and cost effectiveness. According to Article 8 of the Law on Statistics, the President of the NSI is appointed by the Prime Minister. The term of office is fixed (seven years; reappointment is possible, only once).
According to Article 5 of the State Statistical Service Act, statistics are based on objectivity, impartiality and independency. According to Article 3, the Head of the NSI is appointed by the President of the Republic.
Administrative supervision and budget autonomy
The NSI has the status of a State Agency and is directly subordinated to the Council of Ministers. It has budget autonomy on the basis of an annual amount assigned from the state budget.
The NSI is a central statistical agency within the public administration. It has budget autonomy on the basis of an annual amount assigned from the state budget.
Legal mandate for data collection
The Law on Statistics determines the main principles of data collection.
The State Statistical Service Act determines the main principles of data collection.
Legal provisions regarding statistical confidentiality
According to Articles 25 to 27a of the Law on Statistics, the confidentiality of the statistical data is secured.
According to Articles 16, 17 and 18 of the State Statistical Service Act, the confidentiality of the statistical data is secured.
HICP inflation1)
Compliance with legal minimum standards
Eurostat made a compliance monitoring visit in 2007 and confirmed that in general the methods used for producing the HICP are satisfactory. There were no apparent instances of non-compliance with the HICP methodology.
Eurostat made a compliance monitoring visit in 2008 and confirmed that in general the methods used for producing the HICP are satisfactory. There were no apparent instances of non-compliance with the HICP methodology.
Other issues Eurostat considered the representativity of the HICP in terms of accuracy and reliability to be generally adequate.
Eurostat considered the representativity of the HICP in terms of accuracy and reliability to be generally adequate.
Government finance statistics
Data coverage Revenue, expenditure, deficit and debt data are provided for the period 2004-13.
Revenue, expenditure, deficit and debt data are provided for the period 2004-13.
Outstanding statistical issues
The decision of Eurostat (2012) on the recording of some operations of trade credits has not been fully implemented. Long-term trade credits (factoring without recourse) are recorded correctly as loans (part of government debt). However, short-term trade credits (factoring without recourse) are recorded as payables, which may lead to an underestimation of the level of government debt. The work on factoring statistics is under development and will enable the identification of short-term trade credits without recourse that need to be reclassified as loans. The expected impact on government debt is not yet known.
There is a unit currently classified as being in the financial sector which may be subject to a reclassification.
Deficit-debt adjustment
Negative cumulative amount of DDA owing to a decrease in government deposits and a decrease in loans.
Cumulative amount of DDA is small and negative. This relates to a positive effect of transactions in deposits counterbalanced by negative effects of valuation effects owing to fluctuation in the value of debt denominated in foreign currency and differences as regards the time of recording.
Institution responsible for the compilation of EDP data
The NSI compiles the actual EDP data and the Ministry of Finance provides the forecasts. The Ministry of Finance compiles the actual EDP data concerning debt. The NCB is not directly involved in the compilation of these statistics.
The NSI, in cooperation with the Ministry of Finance, compiles the actual EDP data, and the Ministry of Finance provides the forecasts. The NCB is not directly involved in the compilation of these statistics.
1) The full report of the findings and recommendations of the HICP compliance monitoring visits for each country are available at http://epp.eurostat.ec.europa.eu/portal/page/portal/hicp/methodology/compliance_monitoring
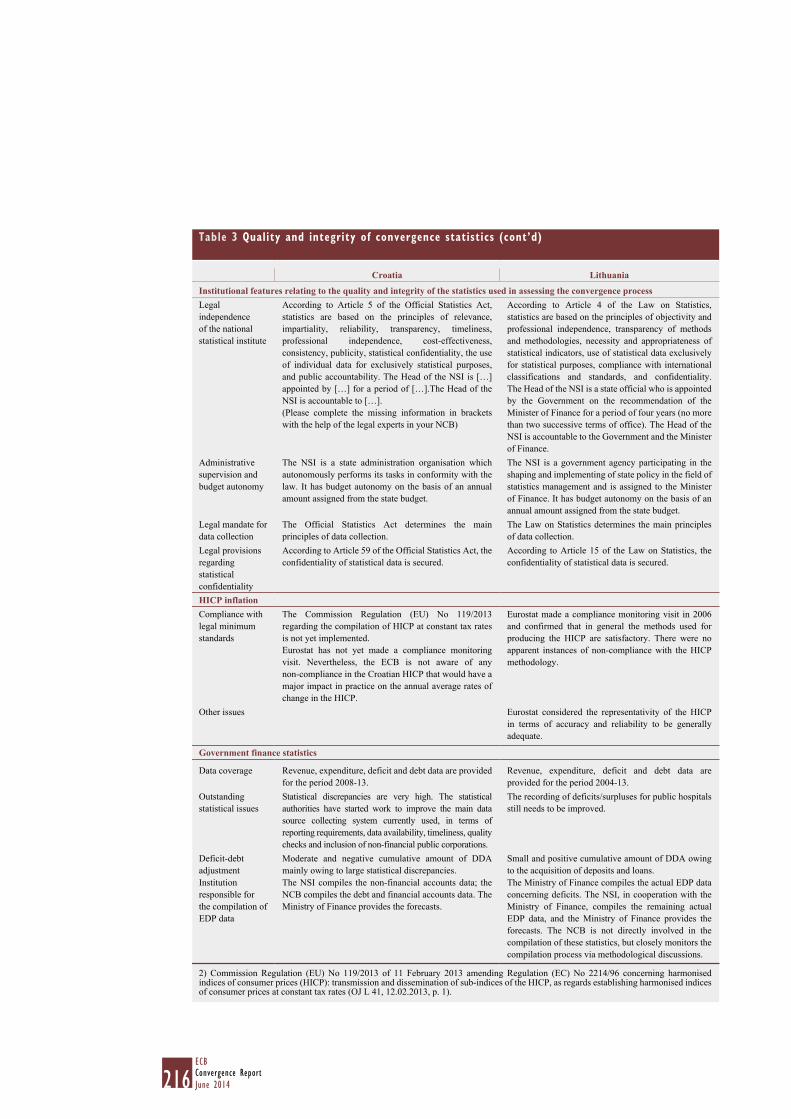
216ECBConvergence ReportJune 2014
Table 3 Quality and integrity of convergence statistics (cont’d)
Croatia Lithuania
Institutional features relating to the quality and integrity of the statistics used in assessing the convergence processLegal independence of the national statistical institute
According to Article 5 of the Official Statistics Act, statistics are based on the principles of relevance, impartiality, reliability, transparency, timeliness, professional independence, cost-effectiveness, consistency, publicity, statistical confidentiality, the use of individual data for exclusively statistical purposes, and public accountability. The Head of the NSI is […] appointed by […] for a period of […].The Head of the NSI is accountable to […].(Please complete the missing information in brackets with the help of the legal experts in your NCB)
According to Article 4 of the Law on Statistics, statistics are based on the principles of objectivity and professional independence, transparency of methods and methodologies, necessity and appropriateness of statistical indicators, use of statistical data exclusively for statistical purposes, compliance with international classifications and standards, and confidentiality. The Head of the NSI is a state official who is appointed by the Government on the recommendation of the Minister of Finance for a period of four years (no more than two successive terms of office). The Head of the NSI is accountable to the Government and the Minister of Finance.
Administrative supervision and budget autonomy
The NSI is a state administration organisation which autonomously performs its tasks in conformity with the law. It has budget autonomy on the basis of an annual amount assigned from the state budget.
The NSI is a government agency participating in the shaping and implementing of state policy in the field of statistics management and is assigned to the Minister of Finance. It has budget autonomy on the basis of an annual amount assigned from the state budget.
Legal mandate for data collection
The Official Statistics Act determines the main principles of data collection.
The Law on Statistics determines the main principles of data collection.
Legal provisions regarding statistical confidentiality
According to Article 59 of the Official Statistics Act, the confidentiality of statistical data is secured.
According to Article 15 of the Law on Statistics, the confidentiality of statistical data is secured.
HICP inflation Compliance with legal minimum standards
The Commission Regulation (EU) No 119/2013 regarding the compilation of HICP at constant tax rates is not yet implemented.Eurostat has not yet made a compliance monitoring visit. Nevertheless, the ECB is not aware of any non-compliance in the Croatian HICP that would have a major impact in practice on the annual average rates of change in the HICP.
Eurostat made a compliance monitoring visit in 2006 and confirmed that in general the methods used for producing the HICP are satisfactory. There were no apparent instances of non-compliance with the HICP methodology.
Other issues Eurostat considered the representativity of the HICP in terms of accuracy and reliability to be generally adequate.
Government finance statistics
Data coverage Revenue, expenditure, deficit and debt data are provided for the period 2008-13.
Revenue, expenditure, deficit and debt data are provided for the period 2004-13.
Outstanding statistical issues
Statistical discrepancies are very high. The statistical authorities have started work to improve the main data source collecting system currently used, in terms of reporting requirements, data availability, timeliness, quality checks and inclusion of non-financial public corporations.
The recording of deficits/surpluses for public hospitals still needs to be improved.
Deficit-debt adjustment
Moderate and negative cumulative amount of DDA mainly owing to large statistical discrepancies.
Small and positive cumulative amount of DDA owing to the acquisition of deposits and loans.
Institution responsible for the compilation of EDP data
The NSI compiles the non-financial accounts data; the NCB compiles the debt and financial accounts data. The Ministry of Finance provides the forecasts.
The Ministry of Finance compiles the actual EDP data concerning deficits. The NSI, in cooperation with the Ministry of Finance, compiles the remaining actual EDP data, and the Ministry of Finance provides the forecasts. The NCB is not directly involved in the compilation of these statistics, but closely monitors the compilation process via methodological discussions.
2) Commission Regulation (EU) No 119/2013 of 11 February 2013 amending Regulation (EC) No 2214/96 concerning harmonised indices of consumer prices (HICP): transmission and dissemination of sub-indices of the HICP, as regards establishing harmonised indices of consumer prices at constant tax rates (OJ L 41, 12.02.2013, p. 1).
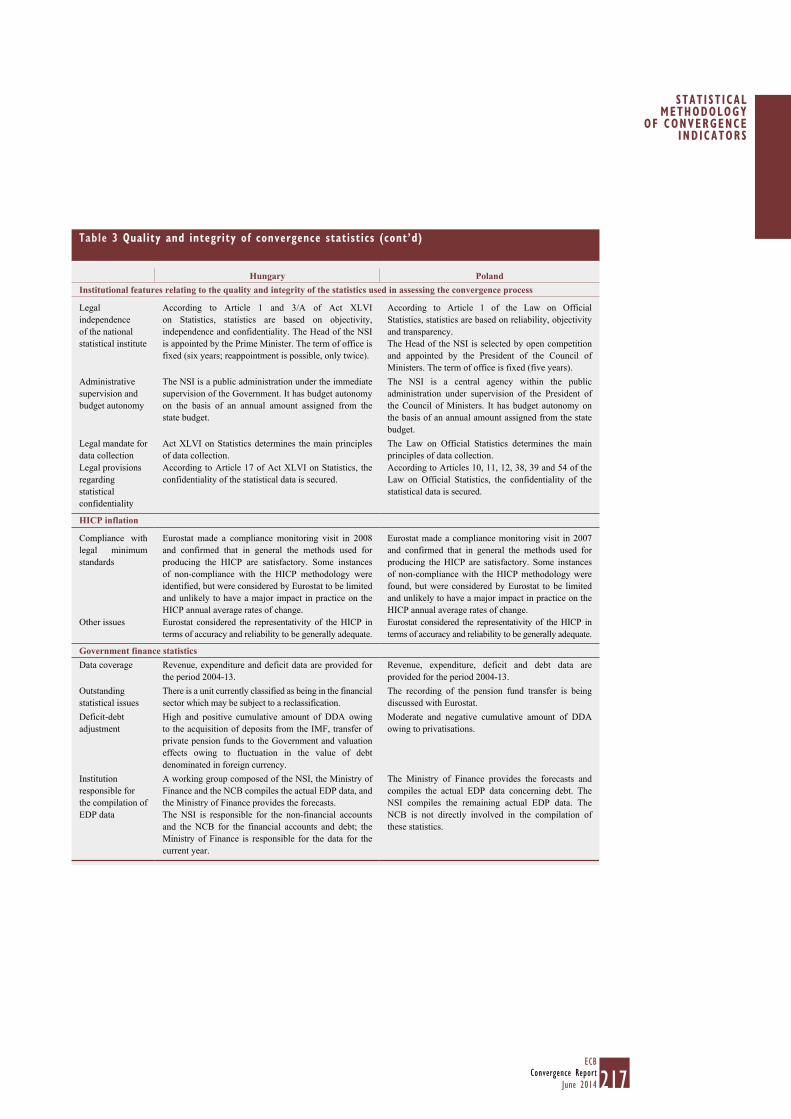
217ECB
Convergence ReportJune 2014
STAT IST ICAL METHODOLOGY
OF CONVERGENCE INDICATORS
Table 3 Quality and integrity of convergence statistics (cont’d)
Hungary PolandInstitutional features relating to the quality and integrity of the statistics used in assessing the convergence process
Legal independence of the national statistical institute
According to Article 1 and 3/A of Act XLVI on Statistics, statistics are based on objectivity, independence and confidentiality. The Head of the NSI is appointed by the Prime Minister. The term of office is fixed (six years; reappointment is possible, only twice).
According to Article 1 of the Law on Official Statistics, statistics are based on reliability, objectivity and transparency.The Head of the NSI is selected by open competition and appointed by the President of the Council of Ministers. The term of office is fixed (five years).
Administrative supervision and budget autonomy
The NSI is a public administration under the immediate supervision of the Government. It has budget autonomy on the basis of an annual amount assigned from the state budget.
The NSI is a central agency within the public administration under supervision of the President of the Council of Ministers. It has budget autonomy on the basis of an annual amount assigned from the state budget.
Legal mandate for data collection
Act XLVI on Statistics determines the main principles of data collection.
The Law on Official Statistics determines the main principles of data collection.
Legal provisions regarding statistical confidentiality
According to Article 17 of Act XLVI on Statistics, the confidentiality of the statistical data is secured.
According to Articles 10, 11, 12, 38, 39 and 54 of the Law on Official Statistics, the confidentiality of the statistical data is secured.
HICP inflation
Compliance with legal minimum standards
Eurostat made a compliance monitoring visit in 2008 and confirmed that in general the methods used for producing the HICP are satisfactory. Some instances of non-compliance with the HICP methodology were identified, but were considered by Eurostat to be limited and unlikely to have a major impact in practice on the HICP annual average rates of change.
Eurostat made a compliance monitoring visit in 2007 and confirmed that in general the methods used for producing the HICP are satisfactory. Some instances of non-compliance with the HICP methodology were found, but were considered by Eurostat to be limited and unlikely to have a major impact in practice on the HICP annual average rates of change.
Other issues Eurostat considered the representativity of the HICP in terms of accuracy and reliability to be generally adequate.
Eurostat considered the representativity of the HICP in terms of accuracy and reliability to be generally adequate.
Government finance statisticsData coverage Revenue, expenditure and deficit data are provided for
the period 2004-13.Revenue, expenditure, deficit and debt data are provided for the period 2004-13.
Outstanding statistical issues
There is a unit currently classified as being in the financial sector which may be subject to a reclassification.
The recording of the pension fund transfer is being discussed with Eurostat.
Deficit-debt adjustment
High and positive cumulative amount of DDA owing to the acquisition of deposits from the IMF, transfer of private pension funds to the Government and valuation effects owing to fluctuation in the value of debt denominated in foreign currency.
Moderate and negative cumulative amount of DDA owing to privatisations.
Institution responsible for the compilation of EDP data
A working group composed of the NSI, the Ministry of Finance and the NCB compiles the actual EDP data, and the Ministry of Finance provides the forecasts.The NSI is responsible for the non-financial accounts and the NCB for the financial accounts and debt; the Ministry of Finance is responsible for the data for the current year.
The Ministry of Finance provides the forecasts and compiles the actual EDP data concerning debt. The NSI compiles the remaining actual EDP data. The NCB is not directly involved in the compilation of these statistics.
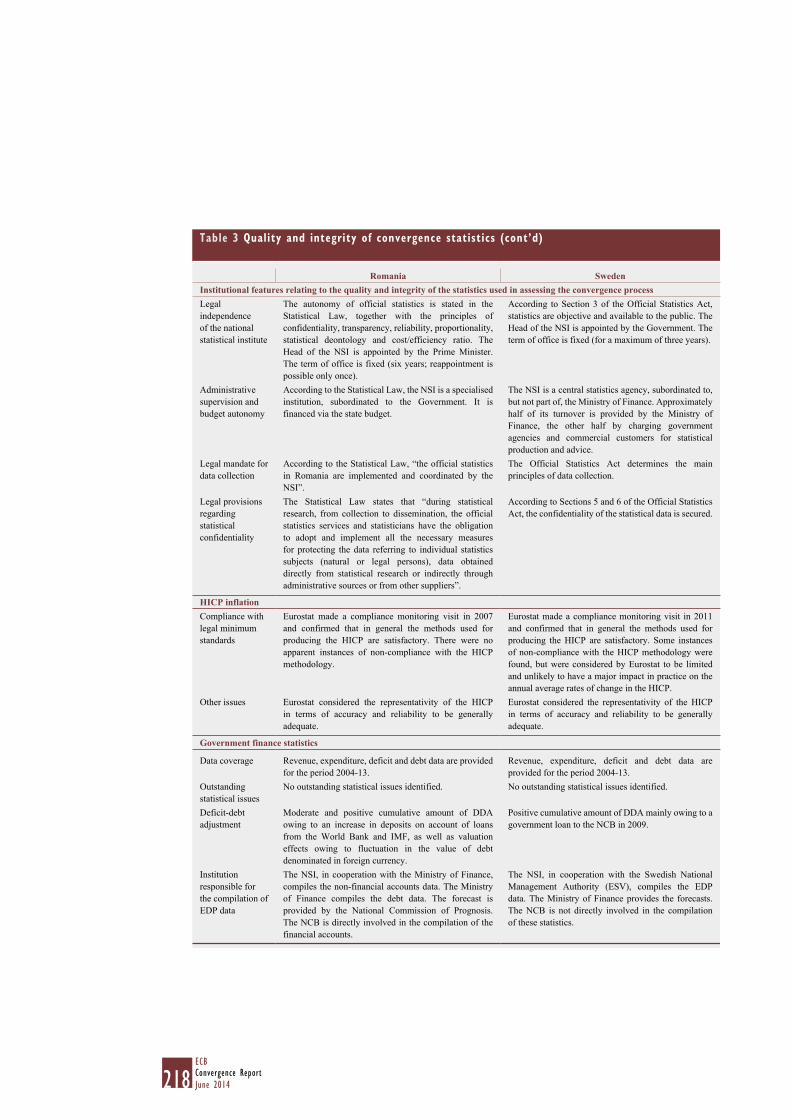
218ECBConvergence ReportJune 2014
Table 3 Quality and integrity of convergence statistics (cont’d)
Romania SwedenInstitutional features relating to the quality and integrity of the statistics used in assessing the convergence processLegal independence of the national statistical institute
The autonomy of official statistics is stated in the Statistical Law, together with the principles of confidentiality, transparency, reliability, proportionality, statistical deontology and cost/efficiency ratio. The Head of the NSI is appointed by the Prime Minister. The term of office is fixed (six years; reappointment is possible only once).
According to Section 3 of the Official Statistics Act, statistics are objective and available to the public. The Head of the NSI is appointed by the Government. The term of office is fixed (for a maximum of three years).
Administrative supervision and budget autonomy
According to the Statistical Law, the NSI is a specialised institution, subordinated to the Government. It is financed via the state budget.
The NSI is a central statistics agency, subordinated to, but not part of, the Ministry of Finance. Approximately half of its turnover is provided by the Ministry of Finance, the other half by charging government agencies and commercial customers for statistical production and advice.
Legal mandate for data collection
According to the Statistical Law, “the official statistics in Romania are implemented and coordinated by the NSI”.
The Official Statistics Act determines the main principles of data collection.
Legal provisions regarding statistical confidentiality
The Statistical Law states that “during statistical research, from collection to dissemination, the official statistics services and statisticians have the obligation to adopt and implement all the necessary measures for protecting the data referring to individual statistics subjects (natural or legal persons), data obtained directly from statistical research or indirectly through administrative sources or from other suppliers”.
According to Sections 5 and 6 of the Official Statistics Act, the confidentiality of the statistical data is secured.
HICP inflation Compliance with legal minimum standards
Eurostat made a compliance monitoring visit in 2007 and confirmed that in general the methods used for producing the HICP are satisfactory. There were no apparent instances of non-compliance with the HICP methodology.
Eurostat made a compliance monitoring visit in 2011 and confirmed that in general the methods used for producing the HICP are satisfactory. Some instances of non-compliance with the HICP methodology were found, but were considered by Eurostat to be limited and unlikely to have a major impact in practice on the annual average rates of change in the HICP.
Other issues Eurostat considered the representativity of the HICP in terms of accuracy and reliability to be generally adequate.
Eurostat considered the representativity of the HICP in terms of accuracy and reliability to be generally adequate.
Government finance statistics
Data coverage Revenue, expenditure, deficit and debt data are provided for the period 2004-13.
Revenue, expenditure, deficit and debt data are provided for the period 2004-13.
Outstanding statistical issues
No outstanding statistical issues identified. No outstanding statistical issues identified.
Deficit-debt adjustment
Moderate and positive cumulative amount of DDA owing to an increase in deposits on account of loans from the World Bank and IMF, as well as valuation effects owing to fluctuation in the value of debt denominated in foreign currency.
Positive cumulative amount of DDA mainly owing to a government loan to the NCB in 2009.
Institution responsible for the compilation of EDP data
The NSI, in cooperation with the Ministry of Finance, compiles the non-financial accounts data. The Ministry of Finance compiles the debt data. The forecast is provided by the National Commission of Prognosis. The NCB is directly involved in the compilation of the financial accounts.
The NSI, in cooperation with the Swedish National Management Authority (ESV), compiles the EDP data. The Ministry of Finance provides the forecasts. The NCB is not directly involved in the compilation of these statistics.

219ECB
Convergence ReportJune 2014
STAT IST ICAL METHODOLOGY
OF CONVERGENCE INDICATORS
5.9.2 HICP INFLATION
This section considers the methodology and quality of the statistics underlying the measurement of price developments, specifically the HICP. The HICP was developed for the purpose of assessing convergence in terms of price stability on a comparable basis. It is published for all EU Member States by Eurostat.28 The HICP covering the euro area as a whole has been the main measure of price developments for the single monetary policy of the ECB since January 1999.
Article 1 of Protocol (No 13) on the convergence criteria referred to in Article 140(1) of the Treaty requires price convergence to be measured by means of the CPI on a comparable basis, taking into account differences in national definitions. In October 1995, Council Regulation (EC) No 2494/95 concerning harmonized indices of consumer prices was adopted.29 Furthermore, the harmonisation measures introduced for HICPs have been based on several EU Council and European Commission regulations. HICPs use common standards for the coverage of the items, the territory and the population included (all these elements are major reasons for differences between national CPIs). Common standards have also been established in several other areas, for example the treatment of new goods and services.
The HICPs use annually updated expenditure weights (or, until 2011, less frequent updates if this did not have a significant effect on the index). They cover all goods and services included in household final monetary consumption expenditure, which is derived from the national accounts domestic concept of household final consumption expenditure, but excludes owner-occupied housing costs. The prices observed are the prices households actually pay for goods and services in monetary transactions and thus include all taxes (minus subsidies) on products, e.g. VAT and excise duties. Expenditure on health, education and social services are covered to the extent that they are financed (directly or through private insurance) by households and not reimbursed by the government.
Estimates of the development of administered prices in the HICP refer to prices which are directly set or significantly influenced by the government, including national regulators. They are based on a common definition and compilation and are published by Eurostat.
Eurostat must ensure that the statistical practices used to compile national HICPs comply with HICP methodological requirements and that good practices in the field of consumer price indices are being followed. Eurostat carries out compliance monitoring visits and publishes its findings in information notes made available on its website.
5.9.3 GOVERNMENT FINANCE STATISTICS
This section describes the methodology and quality of the statistics used to measure fiscal developments. Government finance statistics (GFS) are based mainly on national accounts concepts and should comply with the ESA 9530 and Council Regulation (EU) No 479/2009.31 Concepts such as “government”, “surplus/deficit”, “interest expenditure”, “investment”, “debt” and
28 For details on the HICP legislative framework, recommendations and information notes in force, see the Compendium of HICP reference documents, Publications Office of the European Union, Luxembourg, 2013.
29 OJ L 257, 27.10.1995, p. 1.30 See Council Regulation (EC) No 2223/96 of 25 June 1996 on the European system of national and regional accounts in the Community
(OJ L 310, 30.11.1996, p. 1).31 Council Regulation (EC) No 479/2009 of 25 May 2009 on the application of the Protocol on the excessive deficit procedure annexed to
the Treaty establishing the European Community (OJ L 145, 10.6.2009, p. 1).
220ECBConvergence ReportJune 2014
“gross domestic product (GDP)” with reference to the ESA 95 are defined in Protocol (No 12) on the excessive deficit procedure, as well as in Council Regulation (EU) No 479/2009. The ESA 95 is consistent with other international statistical standards, such as the System of National Accounts 1993 (1993 SNA). EDP statistics refer to the ESA 95 institutional sector “general government”. This comprises central government, state government (in Member States with a federal structure), local government and social security funds. It typically does not include public corporations.
The EDP general government deficit (-)/surplus (+) is equal to the ESA 95 “net lending (+)/net borrowing (-)” plus “net settlements under swaps and forward rate agreements”.32 ESA 95 net lending (+)/net borrowing (-) is equal to “total revenue” minus “total expenditure”. While most transactions among general government units related to revenue and expenditure are not consolidated, the distributive transactions “interest”, “other current transfers”, “investment grants” and “other capital transfers” are consolidated. The primary government deficit/surplus is the government deficit/surplus excluding interest expenditure.
The EDP general government debt is the sum of the outstanding gross liabilities at nominal value (face value) as classified in the ESA 95 categories “currency and deposits”, “securities other than shares excluding financial derivatives” (e.g. government bills, notes and bonds) and “loans”. It excludes financial derivatives, such as swaps, as well as trade credits and other liabilities not represented by a financial document, such as overpaid tax advances. However, in March 2008 Eurostat released a guidance note that includes accounting rules on the treatment of lump sums received by government under “off-market interest rate swaps”. This guidance states that such transactions are basically borrowing in disguise. The lump sum paid to government at the inception of an off-market swap should therefore be recorded as a loan to government in national accounts, and thus has an impact on government debt. In July 2012 Eurostat published a decision on the statistical recording of some operations related to trade credits incurred by government units. The decision stipulates that trade credits that are refinanced without recourse to the original holder and trade credits that are renegotiated beyond the simple extension of the initial maturity need to be reclassified as loans and are thus included in the EDP general government debt.
The EDP debt also excludes contingent liabilities, such as government guarantees and pension commitments. Estimates of such items have to be based on far-reaching assumptions and may vary widely. While government debt is a gross concept in the sense that neither financial nor non-financial assets are deducted from liabilities, it is consolidated within the general government sector and therefore does not include government debt held by other government units.
The measure of GDP used for compiling government deficit and debt ratios is the ESA 95 GDP at current market prices.
5.9.3.1 DATA COVERAGEIn April 2014 the European Commission transmitted to the ECB data on GFS (general government deficit/surplus and debt) for the period 2004-13, as well as forecasts for 2014. The NCBs of the Eurosystem provide the ECB with detailed GFS data under the ECB’s GFS Guideline.33 Although the Guideline is only legally binding for the euro area NCBs, the non-euro area NCBs also transmit
32 The inclusion of “net settlements under swaps and forward rate agreements” in the EDP deficit implies a discrepancy between the two balancing items, the EDP general government deficit (-)/surplus (+) and the ESA 95 net lending (+)/net borrowing (-). Settlements received by government reduce the EDP deficit, whereas settlements paid by government increase the EDP deficit.
33 Guideline ECB/2009/20 of 31 July 2009 on government finance statistics (OJ L 228, 01.09.2009, p. 25).
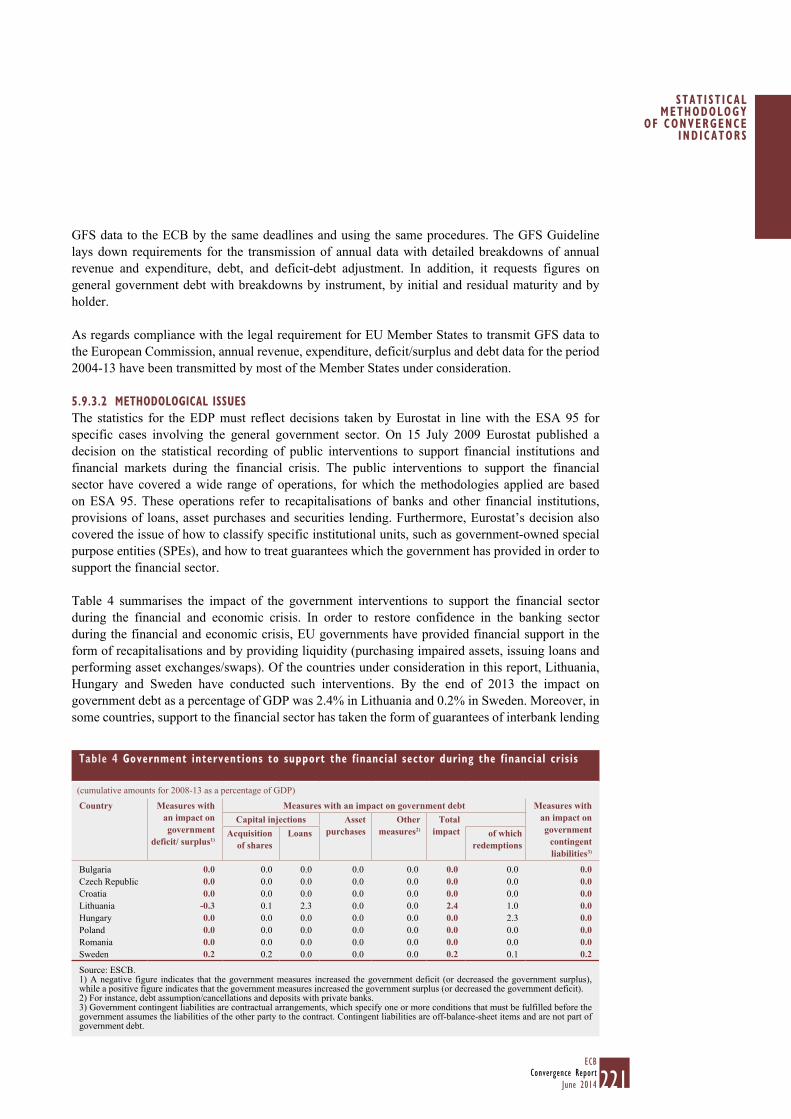
221ECB
Convergence ReportJune 2014
STAT IST ICAL METHODOLOGY
OF CONVERGENCE INDICATORS
GFS data to the ECB by the same deadlines and using the same procedures. The GFS Guideline lays down requirements for the transmission of annual data with detailed breakdowns of annual revenue and expenditure, debt, and deficit-debt adjustment. In addition, it requests figures on general government debt with breakdowns by instrument, by initial and residual maturity and by holder.
As regards compliance with the legal requirement for EU Member States to transmit GFS data to the European Commission, annual revenue, expenditure, deficit/surplus and debt data for the period 2004-13 have been transmitted by most of the Member States under consideration.
5.9.3.2 METHODOLOGICAL ISSUESThe statistics for the EDP must reflect decisions taken by Eurostat in line with the ESA 95 for specific cases involving the general government sector. On 15 July 2009 Eurostat published a decision on the statistical recording of public interventions to support financial institutions and financial markets during the financial crisis. The public interventions to support the financial sector have covered a wide range of operations, for which the methodologies applied are based on ESA 95. These operations refer to recapitalisations of banks and other financial institutions, provisions of loans, asset purchases and securities lending. Furthermore, Eurostat’s decision also covered the issue of how to classify specific institutional units, such as government-owned special purpose entities (SPEs), and how to treat guarantees which the government has provided in order to support the financial sector.
Table 4 summarises the impact of the government interventions to support the financial sector during the financial and economic crisis. In order to restore confidence in the banking sector during the financial and economic crisis, EU governments have provided financial support in the form of recapitalisations and by providing liquidity (purchasing impaired assets, issuing loans and performing asset exchanges/swaps). Of the countries under consideration in this report, Lithuania, Hungary and Sweden have conducted such interventions. By the end of 2013 the impact on government debt as a percentage of GDP was 2.4% in Lithuania and 0.2% in Sweden. Moreover, in some countries, support to the financial sector has taken the form of guarantees of interbank lending
Table 4 Government interventions to support the financial sector during the financial crisis
(cumulative amounts for 2008-13 as a percentage of GDP)
Country Measures with an impact on government
deficit/ surplus1)
Measures with an impact on government debt Measures with an impact on government
contingent liabilities3)
Capital injections Asset purchases
Other measures2)
Total impactAcquisition
of sharesLoans of which
redemptions
Bulgaria 0.0 0.0 0.0 0.0 0.0 0.0 0.0 0.0Czech Republic 0.0 0.0 0.0 0.0 0.0 0.0 0.0 0.0Croatia 0.0 0.0 0.0 0.0 0.0 0.0 0.0 0.0Lithuania -0.3 0.1 2.3 0.0 0.0 2.4 1.0 0.0Hungary 0.0 0.0 0.0 0.0 0.0 0.0 2.3 0.0Poland 0.0 0.0 0.0 0.0 0.0 0.0 0.0 0.0Romania 0.0 0.0 0.0 0.0 0.0 0.0 0.0 0.0Sweden 0.2 0.2 0.0 0.0 0.0 0.2 0.1 0.2
Source: ESCB.1) A negative figure indicates that the government measures increased the government deficit (or decreased the government surplus), while a positive figure indicates that the government measures increased the government surplus (or decreased the government deficit).2) For instance, debt assumption/cancellations and deposits with private banks.3) Government contingent liabilities are contractual arrangements, which specify one or more conditions that must be fulfilled before the government assumes the liabilities of the other party to the contract. Contingent liabilities are off-balance-sheet items and are not part of government debt.
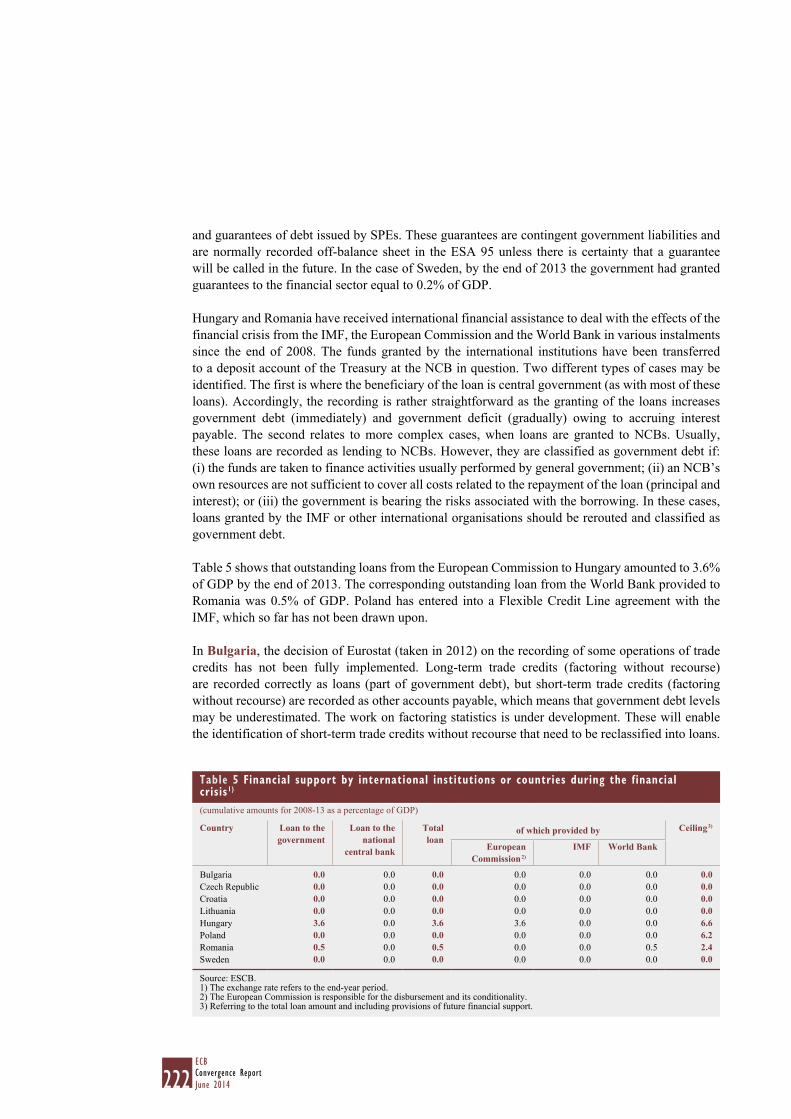
222ECBConvergence ReportJune 2014
and guarantees of debt issued by SPEs. These guarantees are contingent government liabilities and are normally recorded off-balance sheet in the ESA 95 unless there is certainty that a guarantee will be called in the future. In the case of Sweden, by the end of 2013 the government had granted guarantees to the financial sector equal to 0.2% of GDP.
Hungary and Romania have received international financial assistance to deal with the effects of the financial crisis from the IMF, the European Commission and the World Bank in various instalments since the end of 2008. The funds granted by the international institutions have been transferred to a deposit account of the Treasury at the NCB in question. Two different types of cases may be identified. The first is where the beneficiary of the loan is central government (as with most of these loans). Accordingly, the recording is rather straightforward as the granting of the loans increases government debt (immediately) and government deficit (gradually) owing to accruing interest payable. The second relates to more complex cases, when loans are granted to NCBs. Usually, these loans are recorded as lending to NCBs. However, they are classified as government debt if: (i) the funds are taken to finance activities usually performed by general government; (ii) an NCB’s own resources are not sufficient to cover all costs related to the repayment of the loan (principal and interest); or (iii) the government is bearing the risks associated with the borrowing. In these cases, loans granted by the IMF or other international organisations should be rerouted and classified as government debt.
Table 5 shows that outstanding loans from the European Commission to Hungary amounted to 3.6% of GDP by the end of 2013. The corresponding outstanding loan from the World Bank provided to Romania was 0.5% of GDP. Poland has entered into a Flexible Credit Line agreement with the IMF, which so far has not been drawn upon.
In Bulgaria, the decision of Eurostat (taken in 2012) on the recording of some operations of trade credits has not been fully implemented. Long-term trade credits (factoring without recourse) are recorded correctly as loans (part of government debt), but short-term trade credits (factoring without recourse) are recorded as other accounts payable, which means that government debt levels may be underestimated. The work on factoring statistics is under development. These will enable the identification of short-term trade credits without recourse that need to be reclassified into loans.
Table 5 Financial support by international institutions or countries during the financial crisis1)
(cumulative amounts for 2008-13 as a percentage of GDP)
Country Loan to the government
Loan to the national
central bank
Total loan
of which provided by Ceiling 3)
European Commission 2)
IMF World Bank
Bulgaria 0.0 0.0 0.0 0.0 0.0 0.0 0.0Czech Republic 0.0 0.0 0.0 0.0 0.0 0.0 0.0Croatia 0.0 0.0 0.0 0.0 0.0 0.0 0.0Lithuania 0.0 0.0 0.0 0.0 0.0 0.0 0.0Hungary 3.6 0.0 3.6 3.6 0.0 0.0 6.6Poland 0.0 0.0 0.0 0.0 0.0 0.0 6.2Romania 0.5 0.0 0.5 0.0 0.0 0.5 2.4Sweden 0.0 0.0 0.0 0.0 0.0 0.0 0.0
Source: ESCB.1) The exchange rate refers to the end-year period.2) The European Commission is responsible for the disbursement and its conditionality.3) Referring to the total loan amount and including provisions of future financial support.
223ECB
Convergence ReportJune 2014
STAT IST ICAL METHODOLOGY
OF CONVERGENCE INDICATORS
The expected impact on government debt is not yet known. The Ministry of Finance is involved in the compilation of the final general government debt data. The Bulgarian authorities are urged to reconsider the division of responsibilities in the field of general government statistics in order to comply with the European Statistics Code of Practice.
In the Czech Republic, the Czech Export Bank is currently classified as being in the financial sector, but it may be subject to a reclassification. The Czech statistical authorities are investigating this.
In Croatia, the Croatian authorities are continuing to work on improving the data collecting system.
In Lithuania, the Ministry of Finance is involved in the compilation of the final general government deficit data, although the Lithuanian statistical authorities have the clear responsibility to finalise the data and transmit them to the Commission. The Lithuanian authorities are urged to ensure that these arrangements are clarified in the forthcoming update of the Memorandum of Understanding between the Ministry of Finance and the National Statistical Office to ensure compliance with the European Statistics Code of Practice. The recording of deficits/surpluses for public hospitals and universities needs to be improved.
In Hungary, the classification of the Savings Cooperatives Integration Unit was a pending issue in 2013. In accordance with Eurostat advice it is now reclassified inside the central government sector.
In Poland, the statistical recording of the pension reform started in 2014 and the recording of a newly created Special Purpose Entity within the framework of the Polish Investment Programme are currently under examination. The Ministry of Finance is involved in the compilation of the final general government debt data. The Polish authorities are urged to reconsider the division of responsibilities in the field of general government statistics in order to comply with the European Statistics Code of Practice.
In Romania, the Ministry of Finance is involved in the compilation of the final general government debt data. The Romanian authorities are urged to reconsider the division of responsibilities in the field of general government statistics in order to comply with the European Statistics Code of Practice.
In Sweden, the Swedish National Financial Management Authority (ESV) became responsible for both the non-financial and financial accounts for the central government as of the 2012 compilation year. This change in institutional responsibilities is expected to contribute to the reduction of statistical discrepancies.
5.9.3.3 DEFICIT-DEBT ADJUSTMENT The change in government debt outstanding at the end of two consecutive years may diverge from the government deficit/surplus for the respective year for reasons explained in Box 6. A large or volatile deficit-debt adjustment does not necessarily indicate a quality issue, as long as its components are fully explained.
224ECBConvergence ReportJune 2014
Box 6
DEFICIT-DEBT ADJUSTMENT
The change in the debt level in any given period can be larger or smaller than the deficit. The difference between the change in debt and the deficit is known as the “deficit-debt adjustment” (DDA) or, more generally, as the “stock-flow adjustment” (SFA). As long as the components of the DDA are sound, the difference between the change in debt and the deficit does not raise concerns regarding data quality. Unexplained differences between the deficit and change in debt, however, could signal statistical shortages.
A positive DDA means that the increase in debt exceeds the deficit or that the reduction in debt is lower than the surplus. A negative DDA means that the increase in debt is less than the deficit or that the reduction in debt is greater than the surplus.
The DDA can be described in terms of three main pillars:
(i) The first and most important pillar in terms of amplitude consists of the transactions in main financial assets. These transactions include the net accumulation of currency and deposits held by the finance ministry or other government units at the central bank and other MFIs, shares held by government in public corporations, securities held by social security funds (investment in shares excluding privatisations), and loans. With a given deficit, government financial investment increases the borrowing requirement (the amount that government needs to borrow to finance its activities) and thereby also government debt. Conversely, a reduction in financial assets (as a result of privatisations for instance) tends to reduce the borrowing requirement as it generates cash, while leaving the deficit unchanged.
(ii) The second pillar consists of the valuation effects and other changes in the volume of debt. Government debt is measured at nominal value (or face value), even though new borrowings and the repayment of debt may be at prices which differ from the nominal value (issuances and redemptions below or above par). Moreover, as government debt is measured in the national currency, exchange rate changes modify the debt denominated in foreign currencies without affecting the deficit. Changes in the debt related to reclassification are recorded under other changes in the volume of debt. These include changes in the statistical classification of units from the government to a non-government sector (or the reverse).
(iii) The third pillar, named time of recording and other differences, refers to the time difference between the recording of expenditure and the related payments and between the recording of revenue and the related cash flow to government. For instance, taxes are recorded as government revenue at the time they are assessed, even though payment may take place somewhat later. The delayed payment of taxes does not reduce the government borrowing requirement, although the taxes themselves decrease the deficit. A large accumulation of delayed taxes may lead to concerns as to whether tax revenue is overstated owing to amounts that are unlikely to be collected. Other time of recording differences may arise on account of advance or delayed EU reimbursement of funds spent by the government on its behalf, or the gap between the delivery of military equipment (at which time the deficit is affected) and the time of payment.
225ECB
Convergence ReportJune 2014
STAT IST ICAL METHODOLOGY
OF CONVERGENCE INDICATORS
This third pillar also includes the statistical discrepancy between the calculation of the government deficit in the non-financial and financial accounts, and also any unexplained remaining factors, which may lead to doubts about the quality of the government accounts.
The cumulative amounts of the DDA over the period 2008 to 2013 were positive in Hungary (10.7% of GDP), Sweden (5.4% of GDP), Croatia (3.8% of GDP) and Romania (2.5% of GDP).
In Hungary, there were relatively high and exceptional acquisitions of currency and deposits (1.8% of GDP) owing to the IMF and EU deposit in 2008. The transfer of private pension funds to the government (about 10% of GDP in 2011), partly recorded as an acquisition of shares (about 4.4% of GDP in 2011 and 2.7% of GDP in the whole period), also contributed to the high level of DDA. This increase in the DDA has been partly offset by privatisations (-1.0% of GDP). The DDA was also high on account of valuation effects and other changes in the volume of debt. A positive value of 5.8% of GDP is recorded for the valuation effects of the debt owing to fluctuations in the value of government debt denominated in foreign currencies.
In the case of Sweden, the cumulative DDA was explained by the transactions in main financial assets (8.3% of GDP), and in particular by the acquisition of loans (6.7% of GDP), mainly owing to the issuance of two central government loans to Sveriges Riksbank in 2009 (3.1% of GDP) and 2013 (2.8% of GDP). The high positive effect was offset by other negative differences (-3.3% of GDP) mainly owing to liabilities in the insurance technical reserves (pensions) of the local governments (-1.2% of GDP) and net transactions in financial derivatives (-1.0% of GDP).
In Croatia, the cumulative DDA for the period under consideration amounted to 3.6% of GDP. The main reason for this was the acquisition of currency and deposits (4.5% of GDP) in 2013, largely arising from the sale of ten-year government bonds issued on the US market in November 2013.
In Romania, the cumulative amount of the DDA was 2.5% of GDP. The positive impact of transactions in main financial assets owing to the acquisition of currency and deposits (3.9% of GDP) and the valuation effects (2.1% of GDP) were offset by large other remaining factors (-3.5% of GDP), mainly explained by the changes in the accounts payable/receivable resulting from a combination of several factors.
Negative cumulative amounts of the DDA over the last five years could be observed for Bulgaria, the Czech Republic, Lithuania and Poland.
In Bulgaria, the cumulative amount of the DDA was -4.3% of GDP, which means that the increase in debt was smaller than the deficit. The transactions in main financial assets were mainly explained by the negative net acquisition of currency and deposits (-3.6% of GDP) and the negative impact of loans (-1.1% of GDP).
In Poland, the cumulative DDA for the period under consideration was moderate and negative (-4.0% of GDP). The large negative DDA owing to the privatisation of public companies (-5.6% of GDP) was partially compensated for by the valuation effects of debt (2.3% of GDP), which were due to the impact of exchange rate fluctuations on government debt denominated in foreign currency (mainly in 2008 and 2011).
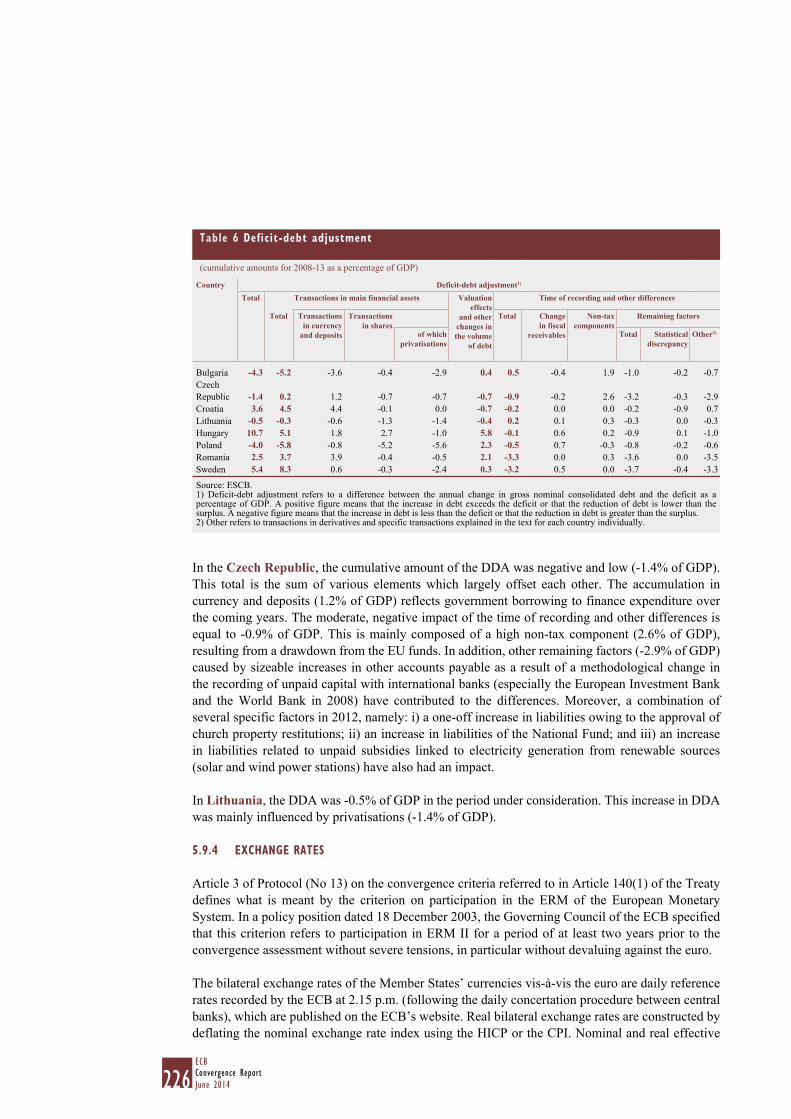
226ECBConvergence ReportJune 2014
In the Czech Republic, the cumulative amount of the DDA was negative and low (-1.4% of GDP). This total is the sum of various elements which largely offset each other. The accumulation in currency and deposits (1.2% of GDP) reflects government borrowing to finance expenditure over the coming years. The moderate, negative impact of the time of recording and other differences is equal to -0.9% of GDP. This is mainly composed of a high non-tax component (2.6% of GDP), resulting from a drawdown from the EU funds. In addition, other remaining factors (-2.9% of GDP) caused by sizeable increases in other accounts payable as a result of a methodological change in the recording of unpaid capital with international banks (especially the European Investment Bank and the World Bank in 2008) have contributed to the differences. Moreover, a combination of several specific factors in 2012, namely: i) a one-off increase in liabilities owing to the approval of church property restitutions; ii) an increase in liabilities of the National Fund; and iii) an increase in liabilities related to unpaid subsidies linked to electricity generation from renewable sources (solar and wind power stations) have also had an impact.
In Lithuania, the DDA was -0.5% of GDP in the period under consideration. This increase in DDA was mainly influenced by privatisations (-1.4% of GDP).
5.9.4 EXCHANGE RATES
Article 3 of Protocol (No 13) on the convergence criteria referred to in Article 140(1) of the Treaty defines what is meant by the criterion on participation in the ERM of the European Monetary System. In a policy position dated 18 December 2003, the Governing Council of the ECB specified that this criterion refers to participation in ERM II for a period of at least two years prior to the convergence assessment without severe tensions, in particular without devaluing against the euro.
The bilateral exchange rates of the Member States’ currencies vis-à-vis the euro are daily reference rates recorded by the ECB at 2.15 p.m. (following the daily concertation procedure between central banks), which are published on the ECB’s website. Real bilateral exchange rates are constructed by deflating the nominal exchange rate index using the HICP or the CPI. Nominal and real effective
Table 6 Deficit-debt adjustment
(cumulative amounts for 2008-13 as a percentage of GDP)
Country Deficit-debt adjustment1)
Total Transactions in main financial assets Valuation effects
and other changes in the volume
of debt
Time of recording and other differences
Total Transactions in currency
and deposits
Transactions in shares
Total Change in fiscal
receivables
Non-tax components
Remaining factors
of which privatisations
Total Statistical discrepancy
Other2)
Bulgaria -4.3 -5.2 -3.6 -0.4 -2.9 0.4 0.5 -0.4 1.9 -1.0 -0.2 -0.7Czech Republic -1.4 0.2 1.2 -0.7 -0.7 -0.7 -0.9 -0.2 2.6 -3.2 -0.3 -2.9Croatia 3.6 4.5 4.4 -0.1 0.0 -0.7 -0.2 0.0 0.0 -0.2 -0.9 0.7Lithuania -0.5 -0.3 -0.6 -1.3 -1.4 -0.4 0.2 0.1 0.3 -0.3 0.0 -0.3Hungary 10.7 5.1 1.8 2.7 -1.0 5.8 -0.1 0.6 0.2 -0.9 0.1 -1.0Poland -4.0 -5.8 -0.8 -5.2 -5.6 2.3 -0.5 0.7 -0.3 -0.8 -0.2 -0.6Romania 2.5 3.7 3.9 -0.4 -0.5 2.1 -3.3 0.0 0.3 -3.6 0.0 -3.5Sweden 5.4 8.3 0.6 -0.3 -2.4 0.3 -3.2 0.5 0.0 -3.7 -0.4 -3.3
Source: ESCB.1) Deficit-debt adjustment refers to a difference between the annual change in gross nominal consolidated debt and the deficit as a percentage of GDP. A positive figure means that the increase in debt exceeds the deficit or that the reduction of debt is lower than the surplus. A negative figure means that the increase in debt is less than the deficit or that the reduction in debt is greater than the surplus.2) Other refers to transactions in derivatives and specific transactions explained in the text for each country individually.
227ECB
Convergence ReportJune 2014
STAT IST ICAL METHODOLOGY
OF CONVERGENCE INDICATORS
exchange rates (EERs) are constructed by applying trade weights (based on a geometric weighting) to the bilateral nominal and real exchange rates of the Member States’ currencies vis-à-vis the currencies of selected trading partners. Both nominal and real EER statistics are calculated by the ECB. An increase in these indices corresponds to an appreciation of the Member State’s currency. Trade weights refer to trade in manufactured goods and are calculated to account for third-market effects. The EER indices are based on moving weights for the periods 1995-97, 1998-2000, 2001-03, 2004-06 and 2007-09. The EER indices are obtained by chain-linking the indicators based on each of these five sets of trade weights at the end of each three-year period. The base period of the resulting EER index is the first quarter of 1999. The group of trading partners comprises the euro area, non-euro area EU Member States, Australia, Canada, China, Hong Kong, Japan, Norway, Singapore, South Korea, Switzerland and the United States.
5.9.5 LONG-TERM INTEREST RATES
Article 4 of Protocol (No 13) on the convergence criteria referred to in Article 140(1) of the Treaty requires interest rates to be measured on the basis of long-term government bonds or comparable securities, taking into account differences in national definitions. While Article 5 assigns the responsibility for providing the statistical data for the application of the Protocol to the European Commission, the ECB, given its expertise in the area, assists in this process by defining representative long-term interest rates and collecting the data from the NCBs for transmission to the Commission. This is a continuation of the work carried out by the EMI as part of the preparations for Stage Three of EMU in close liaison with the Commission.
The conceptual work resulted in the definition of seven key features to be considered in the calculation of long-term interest rates, as presented in Table 7. Long-term interest rates refer to bonds denominated in national currency.
5.9.6 OTHER FACTORS
The last paragraph of Article 140(1) of the Treaty states that the reports of the European Commission and the ECB shall take account of, in addition to the four main criteria, the results of the integration of markets, the situation and development of the national balance of payments and an examination of the development of unit labour costs and other price indices. Whereas, for the four main criteria, Protocol (No 13) stipulates that the Commission will provide the data to be used for the assessment of compliance and describes those statistics in more detail, it makes no reference to the provision of statistics for these “other factors”.
Table 7 Statistical framework for defining long-term interest rates for the purpose of assessing convergence
Concept Recommendation
Bond issuer The bond should be issued by the central government. Maturity As close as possible to ten years’ residual maturity. Any replacement of bonds should minimise maturity drift;
the structural liquidity of the market must be considered. Coupon effects No direct adjustment. Taxation Gross of tax. Choice of bonds The selected bonds should be sufficiently liquid. This requirement should determine the choice between
benchmark or sample approaches, depending on national market conditions. Yield formula The “redemption yield” formula should be applied. Aggregation Where there is more than one bond in the sample, a simple average of the yields should be used to produce
the representative rate.
228ECBConvergence ReportJune 2014
As regards the results of the integration of markets, two sets of indicators are used, namely: i) statistics on financial development and integration referring to the structure of the financial system;34 and ii) statistics on (external) financial and non-financial integration with the euro area.35
The data underlying the indicator concerning the debt securities issued by resident corporations are reported by the respective NCBs in accordance with the methodology set out in Guideline ECB/2007/9 of 1 August 2007 on monetary, financial institutions and markets statistics.36 The indicator relating to the stock market capitalisation refers to quoted shares issued by resident corporations following the methodology given in the same Guideline.
The indicators concerning MFI credit to residents and claims of euro area MFIs on resident MFIs are based on available data collected by the ECB as part of the MFI balance sheet statistics collection framework. The data is obtained from the countries under review and, for the latter indicator, also from the euro area countries covered by Regulation (EC) No 25/2009 of the European Central Bank of 19 December 2008 concerning the balance sheet of the monetary financial institutions sector (ECB/2008/32).37 Historical data is compiled by the relevant NCBs, where appropriate. For the indicators mentioned, the statistical data relating to the euro area cover the countries that had adopted the euro at the time to which the statistics relate.
The private sector debt and credit flow indicators are derived from the annual sector accounts reported by the national statistical authorities under the ESA 95 Transmission Programme. Private sector debt includes amounts outstanding at the end of the year of securities issued and loans taken out by the institutional sectors of non-financial corporations (NFCs) and households (including non-profit institutions serving households, or NPISH). The private sector debt-to-GDP ratio is defined as the ratio of private sector debt to GDP at current market prices. Private sector credit flow includes annual transactions on securities issued and loans taken out by the institutional sectors of NFCs and households (including NPISH). The private sector credit flow-to-GDP ratio is defined as the ratio of private sector credit flow to GDP at current market prices. Both private sector debt and private sector credit flow data are presented in consolidated terms, i.e. data do not take into account transactions within the same sector.
The total financial sector liabilities indicator is defined as the year-on-year growth of the sum of all outstanding gross liabilities as classified in the ESA 95 Transmission Programme. The instruments comprising total financial sector liabilities are “currency and deposits”, “securities other than shares”, “loans”, “shares and other equity”, “insurance technical reserves” and “other accounts payable”. The indicator is expressed in non-consolidated terms, i.e. it takes into account liabilities between units within the financial sector.
With regard to the balance of payments and the international investment position, the statistics are compiled in accordance with the concepts and definitions laid down in the BPM5 and with methodological standards set out by the ECB and Eurostat. This report examines the sum of the current account balance and the balance on the capital account, which corresponds to the net lending/net borrowing of the total economy. In addition, it is worth noting that the distinction between current and capital transfers is not always straightforward in practice, as it depends on
34 Debt securities issued by resident corporations, stock market capitalisation, MFI credit to non-government residents and claims of euro area MFIs on resident MFIs.
35 External trade and investment position with the euro area.36 OJ L 341, 27.12.2007, p. 1.37 OJ L 15, 20.01.2009, p. 14.
229ECB
Convergence ReportJune 2014
STAT IST ICAL METHODOLOGY
OF CONVERGENCE INDICATORS
the recipient’s use of the transfer. In particular, this applies to the classification of the current and capital components of transfers between EU institutions and EU Member States.38
As far as foreign trade statistics are concerned, Member States provide Eurostat with harmonised data according to the “community concept” (i.e. for imports, the breakdown by trading partners is based on the country of consignment) and may therefore publish a different geographical breakdown at national level.
With regard to producer price indices, these data refer to domestic sales of total industry excluding construction. The statistics are collected on a harmonised basis under the EU regulation concerning short-term statistics.39
Statistics on unit labour costs (calculated as compensation per employee divided by GDP chain-linked volumes per person employed) are derived from data provided under the ESA 95 Transmission Programme.
Statistics on the harmonised unemployment rate (calculated as the number of unemployed over the labour force) take into account persons between the ages of 15 and 74.
38 For more details, see European Union balance of payments/international investment position statistical methods, ECB, Frankfurt am Main, May 2007.
39 Council Regulation (EC) No 1165/98 of 19 May 1998 concerning short-term statistics (OJ L 162, 5.6.1998, p. 1).

231ECB
Convergence ReportJune 2014
6 EXAMINATION OF COMPATIB IL ITY
OF NATIONAL LEGISLAT ION
WITH THE TREATIES
6 EXAMINATION OF COMPATIBILITY OF NATIONAL LEGISLATION WITH THE TREATIES
The following country assessments report only on those provisions of national legislation which the ECB considered to be problematic from the perspective of their compatibility with provisions on the independence of NCBs in the Treaty (Article 130) and the Statute (Articles 7 and 14.2), provisions on confidentiality (Article 37 of the Statute), prohibitions on monetary financing (Article 123 of the Treaty) and privileged access (Article 124 of the Treaty), and the single spelling of the euro as required by EU law. They also cover the perspective of legal integration of the NCBs into the Eurosystem (in particular as regards Articles 12.1 and 14.3 of the Statute).1
6.1 BULGARIA
6.1.1 COMPATIBILITY OF NATIONAL LEGISLATION
The following legislation forms the legal basis for Българска народна банка (Bulgarian National Bank) and its operations:
– the Bulgarian Constitution,2
– the Law on Българска народна банка (Bulgarian National Bank) (hereinafter the “Law”).3
The Law on the prevention and ascertainment of conflicts of interest (hereinafter the “Law on the prevention of conflicts of interest”)4 applies to public office holders.
There have been no major changes in relation to the points identified in the ECB’s Convergence Report of May 2012, and those comments are therefore repeated in this year’s assessment.
6.1.2 INDEPENDENCE OF THE NCB
With regard to the independence of Българска народна банка (Bulgarian National Bank), the Law and the Law on the prevention of conflicts of interests need to be adapted as set out below.
6.1.2.1 INSTITUTIONAL INDEPENDENCEArticle 44 of the Law prohibits the Council of Ministers and other bodies and institutions from giving instructions to Българска народна банка (Bulgarian National Bank), the Governor or the members of the Governing Council. It further prohibits Българска народна банка (Bulgarian National Bank), its Governor and the members of its Governing Council from seeking or taking instructions from the Council of Ministers or from any other body or institution. The ECB understands that the provision encompasses both national and foreign institutions in line with Article 130 of the Treaty and Article 7 of the Statute. For legal certainty reasons, at the first opportunity, this provision should be brought fully into line with Article 130 of the Treaty and Article 7 of the Statute.
6.1.2.2 PERSONAL INDEPENDENCEArticle 14(1) of the Law lists the grounds for dismissal of the members of the Governing Council, according to which the National Assembly or Bulgaria’s President may relieve a member of the Governing Council from office, including the Governor, if they: (i) no longer fulfil the conditions
1 According to Section 2.2.2.1 of this Convergence Report.2 Constitution of the Republic of Bulgaria, Darjaven vestnik issue 56, 13.7.1991. 3 Law on Българска народна банка (Bulgarian National Bank), Darjaven vestnik issue 46, 10.6.1997.4 Darjaven vestnik issue 94, 31.10.2008.
232ECBConvergence ReportJune 2014
required for the performance of their duties under Article 11(4);5 (ii) are in practice unable to perform their duties for more than six months; or (iii) have been guilty of serious professional misconduct.
The first sub-paragraph of Article 14(1) of the Law cross-refers to the conditions of appointment and election in Article 11(4). To avoid any circumvention of the conditions for dismissal of Governors as established by Article 14.2 of the Statute, the first sub-paragraph of Article 14(1) of the Law should only foresee conditions that are objective, clearly defined and linked to the performance of duties of the members of the Governing Council. Therefore, this provision needs to be revised so that it mirrors the wording of Article 14.2 of the Statute.
The second sub-paragraph of Article 14(1) of the Law is in addition to the two grounds for dismissal provided for in Article 14.2 of the Statute. The third sub-paragraph narrows the concept of “serious misconduct” in Article 14.2 of the Statute to “serious professional misconduct”. Article 14(1) of the Law needs to be adapted further in these respects to fully comply with Article 14.2 of the Statute.
The Law on the prevention of conflicts of interests provides that breach of its provisions and the existence of a conflict of interests are grounds for dismissal of the Governor, Deputy Governors and the other members of the Governing Council of Българска народна банка (Bulgarian National Bank). Thus, the Law on the prevention of conflicts of interests specifies grounds for dismissal that are in addition to the two grounds contained in Article 14.2 of the Statute. Therefore, the Law on the prevention of conflicts of interests is incompatible with the Treaty and the Statute and needs to be brought into line with them.6
Article 14(2) of the Law provides that if the duties of a Governing Council member cease before the expiry of the member’s term of office, another person will be elected or appointed for the remainder of the term of office. Article 14(2) of the Law is incompatible with Article 14.2 of the Statute establishing a minimum term of office of five years and should be adapted accordingly.
The Law is silent on the right of national courts to review a decision to dismiss any member, other than the Governor, of Българска народна банка (Bulgarian National Bank) decision-making bodies, who is involved in the performance of ESCB-related tasks. Even though this right may be available under general law, providing specifically for such a right of review could increase legal certainty.
Article 12(1) and (2) of the Law provide for the National Assembly’s powers to elect the Governor and the Deputy Governors of Българска народна банка (Bulgarian National Bank). In a 2009 case, the National Assembly claimed and acted upon the claim that it has the power to annul or amend its previous decisions, including decisions concerning the election of the Governor and Deputy Governors of Българска народна банка (Bulgarian National Bank) taken under Article 12(1) and (2) of the Law. In practice, any proper election or appointment of members of an NCB’s decision-making body should enable them to assume office following their election. Once elected or appointed, the Governor and the other members of the Governing Council of Българска народна банка (Bulgarian National Bank) may not be dismissed under conditions other than those mentioned in Article 14.2 of the Statute, even
5 Under Article 11(4) of the Law, a member of the Governing Council, including the Governor, may not: (i) be sentenced to imprisonment for a premeditated crime; (ii) declared bankrupt in their capacity as sole proprietor or general partner in a commercial company; (iii) have been a member of a managing or supervisory body of a company or cooperative in the two years prior to the said company or cooperative being declared insolvent; (iv) be sole proprietor, unlimited liability partner in a trading company, manager, trade proxy, trade representative, procurator, trade agent, liquidator or receiver, member of a management or controlling body of a trade company or a cooperative, with the exception of companies where Българска народна банка (Bulgarian National Bank) participates; (v) be a spouse of, live with, be a relative in direct or lateral line up to and including the fourth degree, or be connected by marriage up to and including the second degree to a member of the Governing Council.
6 See also Opinion CON/2009/13.

233ECB
Convergence ReportJune 2014
6 EXAMINATION OF COMPATIB IL ITY
OF NATIONAL LEGISLAT ION
WITH THE TREATIES
if they have not yet taken up their duties. Therefore, taking the above-mentioned case into account, the ECB reiterates that the Law should be revised to mirror the wording of Article 14.2 of the Statute and to provide specifically for a right of review of decisions removing members of Българска народна банка (Bulgarian National Bank) decision-making bodies from office.
6.1.3 CONFIDENTIALITY
Article 4(2) of the Law provides that Българска народна банка (Bulgarian National Bank) may not disclose or pass to third parties any information obtained which is of a confidential banking or commercial nature for banks and the other participants in the money turnover and credit relations, except in the cases provided for by the Law on the protection of classified information. Under Article 23(2) of the Law, the employees of Българска народна банка (Bulgarian National Bank) may not disclose any information concerning negotiations, contracts entered into, the level of assets on customers’ deposits and their operations, information received by Българска народна банка (Bulgarian National Bank), as well as any circumstances concerning the activities of Българска народна банка (Bulgarian National Bank) or its customers which constitute official, banking, commercial or other secrecy protected by law, even after the termination of their contracts of employment. Under Article 37 of the Statute, professional secrecy is an ESCB-wide matter. Therefore, the ECB assumes that Articles 4(2) and 23(2) of the Law are without prejudice to the confidentiality obligations towards the ECB and the ESCB.
6.1.4 MONETARY FINANCING AND PRIVILEGED ACCESS
Article 45(1) of the Law provides that Българска народна банка (Bulgarian National Bank) may not grant credits or guarantees in any form whatsoever, including through the purchase of debt instruments, to the Council of Ministers, municipalities, or to other government or municipal institutions, organisations and undertakings. Pursuant to Article 45(2) of the Law, this does not apply to the extension of credits to state-owned and municipal banks in emergency cases of liquidity risk that may affect the stability of the banking system. Article 45(1) and (2) of the Law need to be adjusted to be fully consistent with the Treaty. In particular, the range of public sector entities referred to in Article 45(1) of the Law needs to be extended to include central governments, regional, local or other public authorities, public undertakings and bodies governed by public law of other Member States and EU institutions and bodies to fully mirror the wording of Article 123 of the Treaty. Moreover, Article 45(1) of the Law needs to be slightly redrafted to ensure that it accurately reflects the prohibition of monetary financing to cover both (a) lending ‘to’ the range of public sector entities; and (b) purchases of debt instruments ‘from’ the range of public sector entities.
The prohibition of monetary financing prohibits the direct purchase of public sector debt, but such purchases in the secondary market are allowed, in principle, as long as such secondary market purchases are not used to circumvent the objective of Article 123 of the Treaty. For this reason the word ‘direct’ should be inserted in Article 45(1) of the Law.
Furthermore, while acknowledging the particularities arising out of the currency-board regime, i.e. prohibition on Българска народна банка (Bulgarian National Bank) extending credit to credit institutions other than in the context of emergency liquidity operations, it is recommended that the scope of the exemption addressed to publicly-owned credit institutions is brought into line with the scope of the exemption under the Treaty. Such alignment would certainly be mandatory on the introduction of the euro in Bulgaria.
234ECBConvergence ReportJune 2014
6.1.5 LEGAL INTEGRATION OF THE NCB INTO THE EUROSYSTEM
With regard to the legal integration of Българска народна банка (Bulgarian National Bank) into the Eurosystem, the Law needs to be adapted in the respects set out below.
6.1.5.1 TASKS
Monetary policyArticle 2(1) and Article 3, Article 16, items 4 and 5 and Articles 28, 30, 31, 32, 35, 38, 41 and 61 of the Law, which provide for the powers of Българска народна банка (Bulgarian National Bank) in the field of monetary policy and instruments for the implementation thereof, do not recognise the ECB’s powers in this field.
Article 33 of the Law, which empowers Българска народна банка (Bulgarian National Bank) to enter into certain financial transactions, also fails to recognise the ECB’s powers in this field.
Collection of statisticsArticle 4(1) and Article 42 of the Law, which provide for the powers of Българска народна банка (Bulgarian National Bank) relating to the collection of statistics, do not recognise the ECB’s powers in this field.
Official foreign reserve managementArticle 20(1) and Articles 28, 31 and 32 of the Law, which provide for the powers of Българска народна банка (Bulgarian National Bank) with regard to the management of official foreign reserves, do not recognise the ECB’s powers in this field.
Payment systemsArticles 2(4) and 40(1) of the Law, which provide for the powers of Българска народна банка (Bulgarian National Bank) with regard to the promotion of the smooth operation of payment systems, do not recognise the ECB’s powers in this field.
Issue of banknotesArticle 2(5), Article 16, item 9, and Articles 24 to 27 of the Law, which provide for the powers of Българска народна банка (Bulgarian National Bank) with regard to the issue of banknotes and coins, do not recognise the Council’s and the ECB’s powers in this field.
6.1.5.2 FINANCIAL PROVISIONS
Appointment of independent auditorsArticle 49(4) of the Law, which provides that the external auditor is appointed by the Governing Council for a term of three years on the basis of a procedure complying with the Law on public procurement, does not recognise the Council’s and the ECB’s powers under Article 27.1 of the Statute.
Financial reportingArticle 16, item 11 and Articles 46 and 49 of the Law do not reflect the obligation to comply with the Eurosystem’s regime for financial reporting of NCB operations, pursuant to Article 26 of the Statute.
235ECB
Convergence ReportJune 2014
6 EXAMINATION OF COMPATIB IL ITY
OF NATIONAL LEGISLAT ION
WITH THE TREATIES
6.1.5.3 EXCHANGE RATE POLICYArticles 28, 31, 32 of the Law, which provide for the powers of Българска народна банка (Bulgarian National Bank) with regard to the exchange rate policy, do not recognise the Council’s and the ECB’s powers in this field.
6.1.5.4 INTERNATIONAL COOPERATIONArticle 5, Article 16, item 12 and Article 37(4) of the Law, which provide for the powers of Българска народна банка (Bulgarian National Bank) with regard to international cooperation, do not recognise the ECB’s powers in this field.
6.1.5.5 MISCELLANEOUSArticles 61 and 62 of the Law do not recognise the ECB’s powers to impose sanctions.
6.1.6 CONCLUSIONS
The Law and the Law on the prevention of conflicts of interest do not comply with all the requirements for central bank independence, the monetary financing prohibition, and legal integration into the Eurosystem. Bulgaria is a Member State with a derogation and must therefore comply with all adaptation requirements under Article 131 of the Treaty.
6.2 CZECH REPUBLIC
6.2.1 COMPATIBILITY OF NATIONAL LEGISLATION
The following legislation forms the legal basis for Česká národní banka and its operations:
– the Czech Constitution,7
– the Law on Česká národní banka (hereinafter the “Law”).8
This year’s assessment takes into account the relevant amendments made to the Law by Law No 227/2013 Coll. amending Law No 6/1993 Coll. on Česká národní banka and other related laws.9 In relation to the points identified in the ECB’s Convergence Report of May 2012 which were not addressed by the above amendment, the comments made in that report are largely repeated.
6.2.2 INDEPENDENCE OF THE NCB
With regard to Česká národní banka’s independence, the Law needs to be adapted in the respects set out below.
6.2.2.1 FUNCTIONAL INDEPENDENCEArticle 2(1) of the Law provides that in addition to the primary objective of price stability, Česká národní banka’s objective is “to ensure financial stability and the safe and sound operation of the financial system in the Czech Republic”. In line with Article 127(1) of the Treaty, the secondary objective of Česká národní banka should be stated to be without prejudice to Česká národní banka’s primary objective of maintaining price stability.7 Constitutional law No 1/1993 Coll.8 Law No 6/1993 Coll.9 See Opinion CON/2012/44, which concerned an earlier draft of this law.
236ECBConvergence ReportJune 2014
6.2.2.2 INSTITUTIONAL INDEPENDENCEArticle 3 of the Law obliges Česká národní banka to submit a report on monetary development to the Chamber of Deputies at least twice a year for review; the Law also provides for an optional extraordinary report to be prepared pursuant to a Chamber of Deputies resolution. The Chamber of Deputies has the power to acknowledge the report or ask for a revised report; such a revised report must comply with the Chamber of Deputies’ requirements. These parliamentary powers could potentially breach the prohibition on giving instructions to NCBs pursuant to Article 130 of the Treaty and Article 7 of the Statute.
In addition, Article 47(5) of the Law requires Česká národní banka to submit a revised report if the Chamber of Deputies rejects its annual financial report. This revised report must comply with the Chamber of Deputies’ requirements. Such parliamentary powers breach the prohibition on approving, annulling or deferring decisions. Article 3 and Article 47(5) of the Law are therefore incompatible with central bank independence and should be adapted accordingly.
Further, Article 130 of the Treaty and Article 7 of the Statute are partially mirrored in the Law. Article 9(1) of the Law expressly prohibits Česká národní banka and its Board from seeking or taking instructions from the President of the Republic, from Parliament, from the Government, from administrative authorities of the Czech Republic, from the bodies, institutions or other entities of the European Union, from governments of the Member States or from any other body, but it does not expressly prohibit the Government from seeking to influence the members of Česká národní banka’s decision-making bodies in situations where this may have an impact on Česká národní banka’s fulfilment of its ESCB-related tasks. In this respect the Law needs to be adapted to be fully consistent with Article 130 of the Treaty and Article 7 of the Statute.
Pursuant to Law No 166/1993 Coll. on the Supreme Audit Office (hereinafter the “NKU Law”), the Supreme Audit Office (NKU) is empowered to audit Česká národní banka’s financial management as regards its operating expenditure and expenditure for the purchase of property. The ECB understands that: (i) the NKU’s auditing powers in relation to Česká národní banka are without prejudice to Article 9 of the Law, which concerns the general prohibition on Česká národní banka seeking or taking instructions from other entities; and (ii) the NKU has no power to interfere with either the external auditors’ opinion or with Česká národní banka’s ESCB-related tasks.
In so far as this understanding is correct, the NKU’s auditing powers vis-à-vis Česká národní banka are not incompatible with central bank independence.
6.2.2.3 PERSONAL INDEPENDENCEThe Law, in particular Article 6, no longer refers to the Governor’s right in case of dismissal to seek a remedy before the Court of Justice of the European Union in accordance with Article 14.2 of the Statute. The ECB understands that although the Law is now silent on the jurisdiction of the Court of Justice of the European Union to hear cases with regard to decisions to dismiss the Governor, Article 14.2 of the Statute applies.
The Law is also silent on the right of national courts to review a decision to dismiss any member, other than the Governor, of Česká národní banka’s Board who is involved in the performance of ESCB-related tasks. Even though this right may be available under general law, providing specifically for such a right of review could increase legal certainty.
237ECB
Convergence ReportJune 2014
6 EXAMINATION OF COMPATIB IL ITY
OF NATIONAL LEGISLAT ION
WITH THE TREATIES
6.2.2.4 FINANCIAL INDEPENDENCEČeská národní banka is faced with accumulated losses beyond the level of its capital and reserves, which have been carried over for several years. A negative capital situation may adversely affect an NCB’s ability to perform its ESCB-related tasks as well as its national tasks. In order to comply with the principle of financial independence and with a view to the future adoption of the euro, Česká národní banka should be provided with an appropriate amount of capital within a reasonable period of time so as to comply with the principle of financial independence.
6.2.3 CONFIDENTIALITY
The NKU Law does not fully respect the provisions of Article 37 of the Statute concerning professional secrecy. Under Article 4(2) of the NKU Law, matters under investigation are subject to NKU’s audit, regardless of the type or degree of secrecy involved. The auditors are generally obliged to maintain confidentiality;10 however, the NKU’s President may release such persons from the duty of confidentiality “on the grounds of important State interest”, which is not further defined. A safeguard clause should be inserted into the NKU Law so that any such requirement on the part of Česká národní banka employees and Board members to disclose confidential information to the NKU is without prejudice to Article 37 of the Statute.
6.2.4 MONETARY FINANCING AND PRIVILEGED ACCESS
Article 34a of the Law on CNB aims at addressing defects highlighted in the ECB’s Convergence Report in relation to the prohibition on monetary financing, but fails to provide for an exception to the monetary financing prohibition in favour of publicly owned credit institutions in the context of the supply of reserves. Article 34a(2) of the Law provides instead for an exception with reference to “publicly owned banks, foreign banks and credit unions”. Article 34a(2) of the Law should be amended to reflect the text of Article 123(2) of the Treaty accordingly.
6.2.5 LEGAL INTEGRATION OF THE NCB INTO THE EUROSYSTEM
With regard to Česká národní banka’s legal integration into the Eurosystem, the Law and Law No 2/1969 Coll., establishing ministries and other central administrative bodies of the Czech Republic (hereinafter the “Law on competences”) need to be adapted as set out below.
6.2.5.1 ECONOMIC POLICY OBJECTIVESArticle 2(1) of the Law, the last sentence of which provides that without prejudice to its primary objective, Česká národní banka shall support the general economic policies of the Government leading to sustainable economic growth and the general economic policies in the EU with a view to contributing to the achievement of the objectives of the EU, is not fully compatible with Article 127(1) of the Treaty and Article 2 of the Statute. The Law should make it clear that the objective of financial stability and the objective of supporting the general economic policies of the Government leading to sustainable growth are subordinate not only to the primary objective of price stability as specified in Section 6.2.2.1 but also to the secondary objective of the ESCB.
10 Article 22(2)(f) of the NKU Law.
238ECBConvergence ReportJune 2014
6.2.5.2 TASKSMonetary policy Article 2(2)(a), Article 5(1) and Part Five (namely Articles 23 to 26) of the Law, which provide for Česká národní banka’s powers in the field of monetary policy and instruments for the implementation thereof, do not recognise the ECB’s powers in this field.
Articles 28, 29, 32 and 33 of the Law, which empower Česká národní banka to enter into certain financial transactions, also fail to recognise the ECB’s powers in this field.
Official foreign reserve managementArticle 35(c) and Articles 36 and 47a of the Law, which provide for Česká národní banka’s powers relating to foreign reserve management, do not recognise the ECB’s powers in this field. Article 4(1) of the Law on competences, according to which the Ministry of Finance is the central administrative body for, inter alia, “foreign exchange affairs including the State’s claims and obligations towards foreign entities” does not recognise the ECB’s powers in this field.
Payment systemsArticle 38 and Article 38a of the Law, which provide for Česká národní banka’s powers relating to the smooth operation of payment systems, do not recognise the ECB’s powers in this field. Article 4(1) of the Law on competences, according to which the Ministry of Finance is the central administrative body for, inter alia, “payments systems”, does not recognise the ECB’s powers in this field.
Issue of banknotesArticle 2(2)(b) of the Law, which empowers Česká národní banka to issue banknotes and coins, and Part Four of the Law, namely Articles 12 to 22 of the Law, which specify Česká národní banka’s powers in this field and the related implementing instruments, do not recognise the Council’s and the ECB’s powers in this field.
6.2.5.3 FINANCIAL PROVISIONSAppointment of independent auditorsArticle 48(2) of the Law, which provides that Česká národní banka’s annual financial statements are audited by auditors selected on the basis of an agreement between Česká národní banka’s Board and the Minister for Finance, does not recognise the Council’s and the ECB’s powers under Article 27.1 of the Statute.
Financial reporting
Article 48 of the Law does not reflect Česká národní banka’s obligation to comply with the Eurosystem’s regime for financial reporting of NCB operations, pursuant to Article 26 of the Statute.
6.2.5.4 EXCHANGE RATE POLICYArticle 35 of the Law, which authorises Česká národní banka to conduct exchange rate policy, does not recognise the Council’s and the ECB’s powers in this field. Article 4 of the Law on competences also fails to recognise the Council’s and the ECB’s powers in this field.
6.2.5.5 INTERNATIONAL COOPERATIONArticle 2(3) of the Law, which empowers Česká národní banka to cooperate and negotiate agreements with the central banks of other countries and international financial institutions, does not recognise the ECB’s powers in this field.
239ECB
Convergence ReportJune 2014
6 EXAMINATION OF COMPATIB IL ITY
OF NATIONAL LEGISLAT ION
WITH THE TREATIES
6.2.5.6 MISCELLANEOUSArticle 37 of the Law, which provides for the respective legislative powers of Česká národní banka and the Ministry of Finance in areas relating, inter alia, to currency, the circulation of money, the financial market, the adoption of the euro in the Czech Republic, the payment system, foreign exchange management, and the status, competence, organisation and activities of Česká národní banka, does not recognise the Council’s and the ECB’s powers in this field.
Article 43e of the Law requires Česká národní banka to “ensure on-going protection of confidential statistical information obtained on the basis of this Law […] so that such information is used for statistical purposes only”. While Article 43f(1)(a) of the Law expressly allows Česká národní banka to provide confidential statistical information to another member of the ESCB to the extent and at the level of detail necessary to perform ESCB tasks, in compliance with Article 8(4)(a) of Council Regulation (EC) No 2533/98,11 Article 43e of the Law should be redrafted so as not to contradict Article 43f(1)a of the Law.
Article 46a of the Law, which sets out the sanctions against third parties which fail to comply with their statistical obligations, does not recognise the Council’s and the ECB’s powers to impose sanctions.
6.2.6 CONCLUSIONS
The Law, the NKU Law and the Law on competences do not comply with all the requirements for central bank independence, confidentiality, the monetary financing prohibition and legal integration into the Eurosystem. The Czech Republic is a Member State with a derogation and must therefore comply with all adaptation requirements under Article 131 of the Treaty.
6.3 CROATIA
6.3.1 COMPATIBILITY OF NATIONAL LEGISLATION
The following legislation forms the legal basis for Hrvatska narodna banka and its operations:
– the Croatian Constitution,12
– the Law on Hrvatska narodna banka (hereinafter the “Law”).13
6.3.2 INDEPENDENCE OF THE NCB
With regard to Hrvatska narodna banka’s institutional independence, the Law needs to be adapted as set out below.
6.3.2.1 INSTITUTIONAL AND PERSONAL INDEPENDENCEArticle 71 of the Law partially mirrors Article 130 of the Treaty and Article 7 of the Statute. In particular Article 71(2) of the Law does not expressly prohibit the Croatian Government from seeking to influence the members of Hrvatska narodna banka’s decision-making bodies in the
11 Council Regulation (EC) No 2533/98 of 23 November 1998 concerning the collection of statistical information by the European Central Bank (OJ L 318, 27.11.1998, p. 8).
12 Constitution of the Republic of Croatia, consolidated text, OG 85/2010. 13 Law on Hrvatska narodna banka OG 75/2008 of 01 July 2008. Amendments to the Law on Hrvatska narodna banka OG 54/2013 of 7 May 2013.
240ECBConvergence ReportJune 2014
performance of their tasks. In this respect the Law needs to be adapted to be fully consistent with Article 130 of the Treaty and Article 7 of the Statute.
6.3.3 LEGAL INTEGRATION OF THE NCB INTO THE EUROSYSTEM
With regard to the legal integration of Hrvatska narodna banka into the Eurosystem, the Law needs to be adapted in the respects set out below.
6.3.3.1 INTERNATIONAL COOPERATIONPursuant to Article 104(11) of the Law, the Hrvatska narodna banka’s Council decides on Hrvatska narodna banka’s membership of international institutions and organisations. The ECB understands that this power of the Hrvatska narodna banka’s Council is without prejudice to the ECB’s powers under Article 6(1) of the Statute.
6.3.4 CONCLUSIONS
The Law does not comply with all the requirements for central bank independence. Croatia is a Member State with a derogation and must therefore comply with all adaptation requirements under Article 131 of the Treaty.
6.4 LITHUANIA
6.4.1 COMPATIBILITY OF NATIONAL LEGISLATION
The following legislation forms the legal basis for Lietuvos bankas and its operations:
– the Lithuanian Constitution,14
– the Law on Lietuvos bankas (hereinafter the “Law”).15
On 24 January 2014 the Lithuanian Constitutional Court declared certain amendments made in 2006 to Article 125 of the Lithuanian Constitution to be unconstitutional as the legislative procedure followed for the adoption of these amendments was not in accordance with the Lithuanian Constitution.16 The amendments made in 2006 had brought the Lithuanian Constitution in line with the Treaties as regards the legal status of the Chair of the Board of Lietuvos bankas and the right to issue currency. However, in its ruling of 24 January 2014, the Constitutional Court observed that despite the fact that the amendments to Article 125 of the Constitution were unconstitutional, this did not mean that the previous version of Article 125 re-entered into force, and interpreted the Constitution in a way that it is compatible with the Treaty, as explained below under Section 6.4.2.1 Personal independence.
14 Lietuvos Respublikos Konstitucija, adopted by the referendum of 25 October 1992, Valstybės žinios, 30.11.1992, No 33-1014.15 Lietuvos Respublikos Lietuvos banko įstatymas Law No I-678 of 1 December 1994, Valstybės žinios, 23.12.1994, No 99-1957.16 Lietuvos Respublikos Konstitucinio Teismo nutarimas dėl Lietuvos Respublikos Konstitucijos 125 straipsnio pakeitimo įstatymo, Lietuvos
Respublikos Seimo statuto 170 straipsnio (…) atitikties Lietuvos Respublikos Konstitucijai, Teisės aktų registras, 24.01.2014, No 2014-00478.
241ECB
Convergence ReportJune 2014
6 EXAMINATION OF COMPATIB IL ITY
OF NATIONAL LEGISLAT ION
WITH THE TREATIES
The Law on Lietuvos bankas has been amended once since the ECB’s Convergence Report of May 2012.17 The Law of 23 January 2014 amended the Law to address Treaty and Statute requirements in respect of Lietuvos bankas’ independence. It entered into force on 31 January 2014.
In addition, the Law on the State Audit Office has been amended by the law of 23 January 2014, in light of the ECB’s Convergence Report of May 2012 and opinions adopted by the ECB.18 This amendment entered into force on 31 January 2014.19
As far as other legislation is concerned, the ECB is not aware of any other statutory provisions which require adaptation under Article 131 of the Treaty.
6.4.2 INDEPENDENCE OF THE NCB
As regards the personal independence of the Chair of the Board of Lietuvos bankas, the Constitutional Court has recently delivered a ruling concerning certain provisions of the Constitution (see below under Section 6.4.2.1 Personal independence).
In relation to Lithuanian legislation which the ECB considered to be problematic from the perspective of Lietuvos bankas’ independence in the ECB’s Convergence Report of May 2012 and in certain ECB opinions,20 the Law and the Law on the State Audit Office were adapted to address all the issues set out in the paragraphs below.
6.4.2.1 PERSONAL INDEPENDENCEBefore the ruling of the Lithuanian Constitutional Court of 24 January 2014, the second paragraph of Article 125 of the Constitution, as amended on 25 April 2006, read as follows: “The procedure for the organisation and activities of Lietuvos bankas, its powers and the legal status of the Chair of the Board of Lietuvos bankas as well as the grounds for his/her dismissal shall be established by law.”
The amendments of 25 April 2006 aimed to remove incompatibilities with the Treaty. They revoked Lietuvos bankas’s exclusive right to issue “currency” and clarified that the legal basis for the grounds for dismissal of the Chair of the Board of Lietuvos bankas is set out in the Law.
Articles 75 and 84(13) of the Constitution, according to which the Parliament could remove officials appointed or chosen by the Parliament, including the Chair of the Board of Lietuvos bankas, by a majority vote of all members of no confidence in the officials in question, had been considered by the ECB in its Convergence Report of 2004 to be incompatible with Article 14.2 of the Statute as a ground for dismissal of the Chair of the Board of Lietuvos bankas. The Constitution was accordingly adapted by the amendments of 25 April 2006.
In its Convergence Report of May 2006 the ECB noted that the Law amending Article 125 of the Constitution addressed the issue by providing that the grounds for dismissal of the Chair of the Board of Lietuvos bankas were established by the Law.
17 Lietuvos Respublikos Lietuvos banko įstatymo Nr. I-678 1 straipsnio pakeitimo įstatymas, Teisės aktų registras, 30.01.2014, No 2014-00716 and Lietuvos Respublikos Lietuvos banko įstatymo […] Nr. X-569 1 straipsnio pakeitimo įstatymas, Teisės aktų registras, 30.01.2014, No 2014-00713.
18 See Opinions CON/2009/77 and CON/2013/85.19 With the exception of a provision relating to the integration of Lithuania into the Eurosystem, which will enter into force on the date when
the Council abrogates Lithuania’s derogation.20 See Opinions CON/2010/42, CON/2011/91, CON/2011/99 and CON/2013/85.
242ECBConvergence ReportJune 2014
In its ruling of 24 January 2014, the Constitutional Court elaborated on the legal consequences arising therefrom. The Court observed that despite the fact that the amendments to Article 125 of the Constitution were unconstitutional, this did not mean that the previous version of Article 125 re-entered into force. Accordingly, the Constitution did not provide for the exclusive right of Lietuvos bankas to issue “currency”. Moreover, although the Parliament was constitutionally empowered to legislate for the regulation of Lietuvos bankas’ activities (inter alia, the procedure for its organisation and competences) and the legal status of the Chair of the Board of Lietuvos bankas (including the grounds for his/her dismissal), the Parliament was obliged to respect the constitutional status of Lietuvos bankas, according to which some of Lietuvos bankas’ competences were entrusted to the ECB, and the role of Lietuvos bankas as a part of the ESCB. Furthermore, the principle of pacta sunt servanda enshrined in the first paragraph of Article 135 of the Constitution, based on the constitutional commitment of Lithuania to become a fully-fledged EU Member State (inter alia through participation in EMU) implied application of the relevant guarantees of independence to Lietuvos bankas and the Chair of the Board of Lietuvos bankas.
The Constitutional Court also clarified that in view of the specific status of Lietuvos bankas as part of the ESCB and the guarantees of its independence which arise therefrom, the constitutional power of the President of Lithuania to propose to the Parliament a vote of no confidence in the Chair of the Board of Lietuvos bankas “can only be related to the circumstances, by the nature of which the Chair of the Board is not entitled to hold the office at all”. Therefore, according to the Constitutional Court, the legislature was obliged to adopt legislation providing that Lietuvos bankas ceased to have exclusive competence to issue currency from the date of adoption of the euro in Lithuania and to set grounds for dismissal of the Chair of the Board of Lietuvos bankas which related only to the non-fulfilment of the conditions required to perform his/her duties or to serious misconduct.
The ECB notes that both aspects are addressed in Articles 6 and 12 of the Law respectively.
Although Articles 75 and 84(13) of the Constitution might now apply to the Chair of the Board of Lietuvos bankas, according to the Constitutional Court’s ruling of 24 January 2014 Article 84(13) of the Constitution is to be interpreted in light of the constitutional commitment of Lithuania to become a fully-fledged Member State (inter alia through participation in EMU) implying application of the relevant independence guarantees to Lietuvos bankas and the Chair of the Board of Lietuvos bankas, as provided by the Treaty.
According to the second paragraph of Article 107 of the Constitution, the Constitutional Court’s rulings are final and are not subject to appeal. The Court’s case law has confirmed that “Article 107 of the Constitution prohibits establishing by means of later adopted laws and other legal acts any such legal regulation that is incompatible with the meaning of the provisions of the Constitution laid down in the legal acts of the Constitutional Court”.21 Furthermore, only the Constitutional Court has the power to provide an official interpretation of the Constitution, which interpretation is binding on all state institutions.22 Based on these rulings, the ECB understands that the Court’s case law is official constitutional doctrine with the same legal status as the Constitution itself.23
21 Lietuvos Respublikos Konstitucinio Teismo nutarimas dėl Lietuvos Respublikos Seimo rinkimų įstatymo 2 straipsnio 5 dalies (2012 m. kovo 22 d. redakcija) atitikties Lietuvos Respublikos Konstitucijai, Valstybės žinios, 08.09.2012, No 105-5330.
22 Lietuvos Respublikos Konstitucinio Teismo nutarimas dėl Lietuvos Respublikos Konstitucinio Teismo įstatymo 1 straipsnio pavadinimo „Konstitucinis Teismas – teisminė institucija“ ir šio straipsnio 3 dalies atitikties Lietuvos Respublikos Konstitucijai, Valstybės žinios, 10.06.2006, No 65-2400.
23 Legal doctrine on the legal status of rulings of the Constitutional Court is consistent with this interpretation.
243ECB
Convergence ReportJune 2014
6 EXAMINATION OF COMPATIB IL ITY
OF NATIONAL LEGISLAT ION
WITH THE TREATIES
Finally, in this regard, the ECB notes that pursuant to rulings of the Constitutional Court of 24 January 200324 and 20 February 2013,25 and a decision of the Constitutional Court of 16 January 2014,26 a vote of no confidence under Article 75 of the Constitution involves a special parliamentary procedure and a ground for the dismissal of officials. The ECB understands that the aforesaid rulings and decision are to be interpreted in light of the Constitutional Court’s ruling of 24 January 2014. Therefore, a removal from office of the Chair of the Board of Lietuvos bankas by way of this special parliamentary procedure of vote of no confidence by the Members of Parliament on the basis of Articles 75 and 84(13) of the Constitution, if applied at all to the Chair of the Board of Lietuvos bankas, could be based solely on one of the two grounds for dismissal provided by Article 14.2 of the Statute (as reflected in Article 12 of the Law). On the basis of this understanding, the Constitution is compatible with the Treaty and the Statute. Nevertheless, for clarity reasons, the ECB recommends that at an opportune time in the future Lithuanian legislation is clarified in this respect.
6.4.2.2 FINANCIAL INDEPENDENCEThe ECB’s Convergence Report of May 2012 noted in relation to Article 14(4) of the Law on the State Audit Office27 that the scope of control by the State Audit Office should, for legal certainty reasons, be clearly defined by the legislation and should be without prejudice to the activities of Lietuvos bankas’ independent external auditors. It further noted that the Law on the State Audit Office needed to be adapted in this respect.
The Law on the State Audit Office now provides that the State Audit Office may perform an audit of Lietuvos bankas’ activities, with the exception of the performance of ESCB and Eurosystem tasks, and without prejudice to the activities of the independent external auditors28 selected by Lietuvos bankas. The State Audit Office is to respect Lietuvos bankas’ independence and not give instructions to Lietuvos bankas, its Board and its members in carrying out their functions relating to the performance of the tasks of the ESCB and the Eurosystem.
The ECB’s Convergence Report of May 2012 noted in relation to the legal status of Lietuvos bankas’ real property that there was a risk that Lietuvos bankas would only be able to dispose of its property with the approval of government authorities and that this situation undermined both the institutional and financial independence of Lietuvos bankas. The ECB considered that the Law should expressly state that Lietuvos bankas is the legal owner of Lietuvos bankas’ real property. Article 1 of the Law was subsequently adapted to state that ownership of the Lithuanian State in Lietuvos bankas is expressed by the capital of Lietuvos bankas and that Lietuvos bankas’ property belongs to it by right of ownership.29 The legal status of Lietuvos bankas’ assets is specified by 24 Lietuvos Respublikos Konstitucinio Teismo nutarimas dėl Lietuvos Respublikos prokuratūros įstatymo 11 straipsnio 4 dalies 9 punkto
(2000 m. lapkričio 28 d. redakcija) ir 2000 m. lapkričio 28 d. Lietuvos Respublikos prokuratūros įstatymo 11 straipsnio pakeitimo įstatymo 2 straipsnio atitikties Lietuvos Respublikos Konstitucijai, Valstybės žinios, 29.01.2003, No 10-366.
25 Lietuvos Respublikos Konstitucinio Teismo nutarimas dėl Lietuvos Respublikos Seimo 2009 m. balandžio 28 d. nutarimo Nr. XI-234 „Dėl G. Vilkelio atleidimo iš Seimo kanclerio pareigų“ atitikties Lietuvos Respublikos Konstitucijai, Lietuvos Respublikos valstybės tarnybos įstatymui, Lietuvos Respublikos Seimo statutui, Valstybės žinios, 21.02.2013, No 20-975.
26 Lietuvos Respublikos Konstitucinio Teismo sprendimas dėl Lietuvos Respublikos Konstitucinio Teismo 2000 m. kovo 30 d., 2003 m. sausio 24 d., 2004 m. gegužės 13 d., 2006 m. sausio 16 d. nutarimų kai kurių nuostatų išaiškinimo, Teisės aktų registras, 20.01.2014, No 2014-00299.
27 A new Article 14(4) was adopted by Lietuvos Respublikos valstybės kontrolės įstatymo 14 straipsnio papildymo ir pakeitimo įstatymas, Law No XI-497 of 19 November 2009, Valstybės žinios, 5.12.2009, No 144-6349, as last amended by Lietuvos Respublikos valstybės kontrolės įstatymo 14 straipsnio pakeitimo įstatymas, Law No XI-1706 of 17 November 2011, Valstybės žinios, 01.12.2011, No 146-6850. The ECB was not consulted on this amendment in 2011and sent a non-consultation letter to the national authorities in this regard.
28 The term “independent external auditors” is used in a provision of the Law on the State Audit Office relating to the integration of Lithuania in the Eurosystem, entering into force on the date when the Council abrogates Lithuania’s derogation. Until then, the term “external auditors” applies, which is consistent with Article 50 of the Law on Lietuvos bankas currently in force.
29 The Law further provides that Lietuvos bankas shall manage, use and dispose of, its property in accordance with legal acts of the EU and the Law.
244ECBConvergence ReportJune 2014
virtue of the law and is not made conditional upon the actions of Lietuvos bankas or those of the administrative authorities.30 Accordingly, the Law is now compatible with the principle of central bank independence enshrined in Article 130 of the Treaty and mirrored in Article 7 of the Statute.31
6.4.3 SINGLE SPELLING OF THE EURO
Article 14(1) of the Law on legislative procedure32 provides that Lithuanian legal acts are to be drafted in line with common language rules and legal terminology. Article 6(2) of the Law on the State Commission for the Lithuanian language33 provides that the decisions of the State Commission for the Lithuanian Language are binding on State and municipal institutions and all companies and organisations operating in Lithuania. On 28 October 2004, the State Commission for the Lithuanian Language (the “Language Commission”) adopted a decision “On the name of the single currency of the European Union in the Lithuanian language”,34 in which it established that the name of the single currency of the European Union euro is to be used in the Lithuanian common language in its adapted form, i.e. with Lithuanian suffixes, including in the nominative singular case. On 30 January 2014, the Language Commission supplemented35 its decision of 28 October 2004 by stating that “the name of the single currency of the European Union euro shall be used in the legal acts of the Republic of Lithuania instead of the nominative form euras and shall be marked out as a foreign language word (normally in italics).” In Lithuanian legislation36 the single currency is spelled “euro”.
The ECB notes that the decision of the Language Commission establishes that the name of the single currency in the form required by EU law is required for legal acts of the Republic of Lithuania. The ECB understands that the concept of a legal act of the Republic of Lithuania covers not only legislative provisions but also regulatory instruments of all Lithuanian public authorities (for example, the local government or the central bank). The ECB further understands that the requirement to write the name of the single currency in italics has no legal consequences and that failure to write it in italics would not invalidate any legal act concerned. On the basis of these understandings, the Lithuanian legislation is compatible with the single spelling of the euro as required by EU law.
6.4.4 CONCLUSIONS
The Constitution, the Law and the Law on State Audit are compatible with the Treaties and the Statute.
30 Lietuvos bankas is not required to apply to an administrative authority, i.e. the State Enterprise Centre of Registers, with regard to change of rights in rem of its assets, as compared to the wording of the draft legislation, on which the ECB has been consulted (see CON/2013/85, in particular paragraph 2.2).
31 See Opinion CON/2013/85.32 Lietuvos Respublikos teisėkūros pagrindų įstatymas, Law No XI-2220 of 18 September 2012, Valstybės žinios, 22.09.2012, No 110-5564.33 Lietuvos Respublikos Valstybinės lietuvių kalbos komisijos įstatymas, Law No I-108 of 25.03.1993, Valstybės žinios, 20.04.1993, No 11-
265.34 Decision of the State Commission for the Lithuanian Language of 28 October 2004 No N-10(99), Valstybės žinios, 4.11.2004, No 160-
5875.35 Decision of the State Commission for the Lithuanian Language of 30 January 2014 No N-2(151), Teisės aktų registras, 3.2.2014,
No 2014-00900.36 E.g. the Law ratifying the amendment to Article 136 of the Treaty with regard to a stability mechanism for Member States whose currency
is the euro, adopted by the European Council Decision of 25 March 2011 (2011/199/EU): Įstatymas dėl Sutarties (...) 136 straipsnio, kiek tai susiję su stabilumo mechanizmu, taikytinu valstybėms narėms, kurių valiuta yra euro, pakeitimo (...), Teisės aktų registras, 30.1.2014, No 2014-00717. Also the draft law on euro introduction in Lithuania, on which the ECB has been consulted and delivered its opinion on 12 February 2014 (CON/2014/14).
245ECB
Convergence ReportJune 2014
6 EXAMINATION OF COMPATIB IL ITY
OF NATIONAL LEGISLAT ION
WITH THE TREATIES
6.5 HUNGARY
6.5.1 COMPATIBILITY OF NATIONAL LEGISLATION
The following legislation forms the legal basis for the Magyar Nemzeti Bank and its operations:
- The consolidated version of the Fundamental Law of Hungary,37
- Law CXXXIX of 2013 on the Magyar Nemzeti Bank (hereinafter the “Law”).38
On 1 October 2013 the fifth amendment of the Fundamental Law of Hungary facilitating the new integrated institutional structure of Hungarian financial supervision carried out by the Magyar Nemzeti Bank entered into force.39
Law CCVIII of 2011 on the Magyar Nemzeti Bank40 repealed Law LVIII of 2001 on the Magyar Nemzeti Bank with effect from 1 January 2012. It has been amended several times since the ECB Convergence Report of May 2012.41 Law CXXXIX of 2013 on the Magyar Nemzeti Bank42 repealed Law CCVIII of 2011 on the Magyar Nemzeti Bank with effect from 1 October 2013. Law XVI of 2014 amended the Law on the Magyar Nemzeti Bank with regard to certain supervisory tasks of the central bank and related administrative enforcement rights.43
6.5.2 INDEPENDENCE OF THE NCB
With regard to the Magyar Nemzeti Bank’s independence, the Law and Law XXVII of 2008 need to be adapted as set out below.
6.5.2.1 INSTITUTIONAL INDEPENDENCEThe legislation and institutional framework regarding the Magyar Nemzeti Bank have been changed several times.44 The latest recast of the Law, which entered into force on 1 October 2013, resulted in the integration of the Hungarian Financial Supervisory Authority (HFSA) into the Magyar Nemzeti Bank as a general legal successor to the HFSA’s scope of competence, rights and obligations45.
37 Magyarország Alaptörvénye, Magyar Közlöny 2013/163. (X.3.).38 2013. évi CXXXIX. törvény a Magyar Nemzeti Bankról, Magyar Közlöny 2013/158. (IX.26.).39 Magyarország Alaptörvényének ötödik módosítása (2013. szeptember 26.), Magyar Közlöny 2013/158. (IX.26.).40 See Opinions CON/2011/104 and CON/2011/106.41 For a detailed list see Section 6.5.2.1.42 See Opinions CON/2013/56 and CON/2013/71.43 A kollektív befektetési formákról és kezelőikről, valamint egyes pénzügyi tárgyú törvények módosításáról szóló 2014. évi XVI. törvény,
Magyar Közlöny 2014/26. (II.24.).44 Since 2008 there have been several changes in the institutional framework for the Magyar Nemzeti Bank as identified in the ECB’s
Convergence Report of May 2012, Chapter 6.5, p. 244, footnote 29. In addition to the changes referred to in the Convergence Report of May 2012, there have been further changes in the institutional framework for the Magyar Nemzeti Bank as follows. Law XXVIII of 2011 repealed Law LVIII of 2001 on the Magyar Nemzeti Bank, amending, inter alia, the procedure for appointing the members of the Monetary Council, extending the numbers of deputy governors and re-establishing the Executive Board, amending the tools of monetary policy, giving additional powers to the Magyar Nemzeti Bank in the field of macro-prudential supervision, amending (i) its reporting scheme to the Hungarian Parliament; (ii) its relationship with the general budget; (iii) its relationship to the HFSA; and (iv) the rules applicable to the payment of dividends. Law LXXXVI of 2012 amended the rules applicable to the employment relationship of the employees of the Magyar Nemzeti Bank. Law XCIX of 2012 inter alia amended the scope of competence of the Monetary Council, the rules applicable to the appointment and dismissal of the members of the Monetary Council as well as the composition of the Monetary Council. Laws CCXX and CCXI of 2012 contained (i) technical amendments to the rules applicable to the administrative procedure carried out by the Magyar Nemzeti Bank, and (ii) technical amendments reflecting the changes to the naming convention in the competent national court. Law XCVIII of 2013 amended the scope of competence of the Magyar Nemzeti Bank as the competent authority in specific administrative procedures. In 2014 Law XVI of 2014 made further amendments to the Law on Magyar Nemzeti Bank, and further legislative amendments are pending with the Hungarian Parliament.
45 See Articles 176 to 183 of the Law as well as ECB Opinions CON/2013/56 and CON/2013/71.
246ECBConvergence ReportJune 2014
The combination of the changes to the institutional framework of the Magyar Nemzeti Bank and the frequency of changes to the Law, not always backed by robust justification for the need to amend the Magyar Nemzeti Bank’s institutional framework, adversely affect the organisational and governance stability of the Magyar Nemzeti Bank and could therefore have an impact on its institutional independence. The principle of central bank independence requires that a central bank has a stable legal framework to enable it to function.
6.5.2.2 PERSONAL INDEPENDENCEThe ECB’s Convergence Reports of 2010 and 2012 noted that Law XXVII of 2008 specifies the wording of the oath that the members of the Monetary Council – including the Governor – are required to take. Pursuant to Article 9(7), in conjunction with Articles 10(3) and 11(2) of the Law which entered into force on 1 October 2013, the Governor and the Deputy Governors of the Magyar Nemzeti Bank must take an oath before Hungary’s President, while other members of the Monetary Council take an oath before the Parliament. Law XXVII of 2008 specifies the wording of the oath to be taken by public officials appointed by the Parliament.46 Therefore, it is not clear whether the Governor and Deputy Governors take the same oath as the other members of the Monetary Council.
The Magyar Nemzeti Bank’s Governor acts in a dual capacity as a member of both the Magyar Nemzeti Bank’s Monetary Council and the ECB decision-making bodies. The wording of the oath should take into account and reflect the status, obligations and duties of the Governor as a member of the ECB’s decision-making bodies. Furthermore, the other members of the Monetary Council are also involved in the performance of ESCB-related tasks. The oath taken should not hinder the Governor, Deputy Governors and other members of the Monetary Council from performing ESCB-related tasks. Law XXVII of 2008 and Articles 9(7), 10(3) and 11(2) of the Law need to be adapted in this regard.
6.5.2.3 FINANCIAL INDEPENDENCEArticle 183 read in conjunction with Article 176 of the Law provides that on 1 October 2013 all employees of the HFSA are to be employees of the Magyar Nemzeti Bank and that the Magyar Nemzeti Bank is to bear the financial obligations arising from any employment relations which HSFA staff transferred to the Magyar Nemzeti Bank may have had with the HFSA in the past. This provision alone, taken together with the mass redundancy scheme provided for under Article 183(10) of the Law and the aim of eliminating positions not essential for the discharge of duties in order to optimise staff management, is incompatible with the Magyar Nemzeti Bank’s financial independence and more specifically its autonomy in staff matters. It impedes the Magyar Nemzeti Bank’s ability to decide on employing and retaining necessary and qualified staff for the Magyar Nemzeti Bank. See, also, the following Section regarding compatibility with the prohibition on monetary financing.
6.5.3 MONETARY FINANCING AND PRIVILEGED ACCESS
Article 36 of the Law provides that if circumstances arise which jeopardise the financial system’s stability due to a credit institution’s operations, the Magyar Nemzeti Bank may extend an emergency loan to such credit institution subject to observing the prohibition on monetary financing in Article 146 of the Law. However, it would be useful to specify that such loans are granted independently and at the Magyar Nemzeti Bank’s full discretion, which may make such
46 Law XXVII of 2008 on the oath of certain public officials. The wording of the oath is: “I, … [name of the person taking the oath], hereby undertake to be faithful to Hungary and to its Fundamental Law, I will comply and ensure compliance with its laws, I will fulfil my office as a … [name of the position] for the benefit of the Hungarian people. [Depending on the belief of the person taking the oath] So help me God!”
247ECB
Convergence ReportJune 2014
6 EXAMINATION OF COMPATIB IL ITY
OF NATIONAL LEGISLAT ION
WITH THE TREATIES
extensions conditional if necessary and against adequate collateral, thus introducing an additional safeguard which should minimise the possibility of the Magyar Nemzeti Bank suffering any loss.
Article 37 of the Law provides that on request, the Magyar Nemzeti Bank at its full discretion may provide a loan to the National Deposit Insurance Fund, subject to the prohibition on monetary financing in Article 146 of the Law, in urgent and exceptional cases threatening the stability of the financial system as a whole and the smooth completion of cash transactions, the term of which loan may not be longer than three months. This provision is compatible with the monetary financing prohibition. As already clarified in ECB opinions,47 it may be useful to specify that such loans are extended against adequate collateral, thus introducing an additional safeguard which should minimise the possibility of the Magyar Nemzeti Bank suffering any loss.
The integration of the HFSA into the Magyar Nemzeti Bank took place on 1 October 2013. Based on Articles 176 to 181 of the Law, all of the HFSA’s assets were transferred to the Magyar Nemzeti Bank. The Magyar Nemzeti Bank also became a general legal successor to all obligations of the HFSA including, inter alia, its contractual relationships, pending procurement procedures, out-of-court redress procedures, tax-related administrative procedures as well as any other type of legal procedure (including pending administrative legal procedures)48. As a consequence, any payment obligation from a legal relationship or a requirement to pay compensation following any judgment handed down by a Hungarian court granting compensation to an individual or entity challenging a prior decision of the HFSA will have to be borne by the Magyar Nemzeti Bank.
Although Article 177(6) of the Law provides for compensation by the State to the Magyar Nemzeti Bank for all expenses resulting from the above-mentioned obligations which exceed the assets taken over from the HFSA, the Law does not specifically lay down the procedure and deadlines applicable to financing by the State and reimbursement of the Magyar Nemzeti Bank. This can only be considered to be an ex-post financing scheme. The provisions applying to the assignment of the obligations of the HFSA to the Magyar Nemzeti Bank are not accompanied by measures that would fully insulate the Magyar Nemzeti Bank from all financial obligations resulting from any activities and contractual relationships of the HFSA originating prior to the transfer of tasks, and the current provisions of the Law involve a time gap between the costs arising and the Hungarian State reimbursing the Magyar Nemzeti Bank, should the expenses incurred at the Magyar Nemzeti Bank exceed the value of assets taken over from the HFSA. Such a scenario would constitute a breach of the prohibition on monetary financing laid down in Article 123 of the Treaty as well as of the principle of financial independence under Article 130. Hence the Magyar Nemzeti Bank must be insulated from all financial obligations resulting from the prior activities or legal relationships of the HFSA.
Article 183 of the Law read in conjunction with Article 176 of the Law provides that the Magyar Nemzeti Bank bears the financial obligations arising from the employment relationships which HFSA staff transferred to the Magyar Nemzeti Bank may have had with the HFSA in the past. In order to comply with Article 123 of the Treaty, the Magyar Nemzeti Bank should be insulated from all obligations arising out of employment relationships between any new Magyar Nemzeti Bank staff member and the HFSA, in light of the mass redundancy scheme provided for under Article 183(10) of the Law.
47 See, for example, paragraph 9.3 of Opinion CON/2011/104; paragraph 6.3 of Opinion CON/2012/43; and paragraph 4 of Opinion CON/2012/49.
48 See also footnote 42.
248ECBConvergence ReportJune 2014
6.5.4 SINGLE SPELLING OF THE EURO
In several Hungarian legal acts49 the name of the single currency is spelled in a way which is inconsistent with EU law. Under the Treaties a single spelling of the word “euro” in the nominative singular case is required in all EU and national legislative provisions, taking into account the existence of different alphabets. The Hungarian legal acts in question should therefore be amended accordingly.
The ECB expects that the correct spelling of the word “euro” will be applied in Hungarian legal acts and the euro changeover law. Only when all national legal acts use the correct spelling of the word “euro” will Hungary comply with the Treaties.
6.5.5 LEGAL INTEGRATION OF THE NCB INTO THE EUROSYSTEM
With regard to the Magyar Nemzeti Bank’s legal integration into the Eurosystem, the Law needs to be adapted as set out below.
6.5.5.1 ECONOMIC POLICY OBJECTIVESArticle 3(2) of the Law provides that the Magyar Nemzeti Bank supports, without prejudice to the primary objective of price stability, the maintenance of the stability of the financial intermediary system, the enhancement of its resilience, its sustainable contribution to economic growth and the Government’s general economic policies. This provision is incompatible with Article 127(1) of the Treaty and Article 2 of the Statute as it does not reflect the secondary objective of supporting the general economic policies in the EU.
6.5.5.2 TASKSMonetary policy Article 41 of the Fundamental Law of Hungary and Articles 1(2), 4, 9, 16 to 22, 159 and 171 of the Law establishing the Magyar Nemzeti Bank’s powers in the field of monetary policy and instruments for the implementation thereof do not recognise the ECB’s powers in this field.
Collection of statisticsAlthough Article 4(7) of the Law refers to the Magyar Nemzeti Bank’s obligation to transfer specific statistical data to the ECB in accordance with Article 5 of the Statute, Article 1(2), as well as Articles 30 and 171(1) of the Law establishing the Magyar Nemzeti Bank’s powers relating to the collection of statistics do not recognise the ECB’s powers in this field.
Official foreign reserve managementArticle 1(2), Article 4(3), (4) and (12), Article 9 and Article 159(2) of the Law, which provide for the Magyar Nemzeti Bank’s powers in the field of foreign reserve management, do not recognise the ECB’s powers in this field.
Payment systemsArticle 1(2), Article 4(5) and (12), Articles 27 and 28, and Article 171(2) and (3) of the Law establishing the Magyar Nemzeti Bank’s powers with regard to the promotion of the smooth operation of payment systems do not recognise the ECB’s powers in this field.
49 For example, the Laws on the 2012, 2011 and 2005 general budget in Hungary.

249ECB
Convergence ReportJune 2014
6 EXAMINATION OF COMPATIB IL ITY
OF NATIONAL LEGISLAT ION
WITH THE TREATIES
Issue of banknotesArticle K of the Fundamental Law and Article 1(2), Article 4(2) and (12), Articles 9, 23 to 26 and Article 171(1) of the Law establishing the Magyar Nemzeti Bank’s exclusive right to issue banknotes and coins do not recognise the Council’s and the ECB’s powers in this field.
6.5.5.3 FINANCIAL PROVISIONSAppointment of independent auditorsArticle 144 of the Law providing that the President of the State Audit Office must be consulted before the Magyar Nemzeti Bank’s auditor is elected or his or her dismissal is proposed, Article 6(1) of the Law, which provides for the shareholder’s power to appoint and dismiss the auditor, and Article 15 of the Law do not recognise the Council’s and the ECB’s powers under Article 27.1 of the Statute.
Financial reportingArticle 12(4)(b) of the Law and Law C of 2000,50 in conjunction with Government Decree 221/2000 (XII.19),51 do not reflect the Magyar Nemzeti Bank’s obligation to comply with the Eurosystem’s regime for financial reporting of NCB operations, pursuant to Article 26 of the Statute.
6.5.5.4 EXCHANGE RATE POLICYArticle 1(2), 4(4) and (12), Articles 9, 22 and 147 of the Law lay down the Government’s and the Magyar Nemzeti Bank’s respective powers in the area of exchange rate policy. These provisions do not recognise the Council’s and the ECB’s powers in this field.
6.5.5.5 INTERNATIONAL COOPERATIONArticle 1(2), 135(5) of the Law providing that, upon authorisation by the Government, the Magyar Nemzeti Bank may undertake tasks arising at international financial organisations, unless otherwise provided for by a legislative act, fails to recognise the ECB’s powers as far as issues under Article 6 of the Statute are concerned.
6.5.5.6 MISCELLANEOUSArticles 75 and 76 of the Law do not recognise the ECB’s powers to impose sanctions.
With regard to Article 132 of the Law, which entitles the Magyar Nemzeti Bank to be consulted on draft national legislation related to its tasks, it is noted that consulting the Magyar Nemzeti Bank does not obviate the need to consult the ECB under Articles 127(4) and 282(5) of the Treaty.
As set out in Section 6.5.2.2, Article 9(7) of the Law requires the members of the Monetary Council to make an oath in accordance with the wording specified in Article 1 of Law XXVII of 2008. Article 9(7) of the Law needs to be adapted to comply with Article 14.3 of the Statute.52
6.5.6 CONCLUSIONS
The Fundamental Law of Hungary, the Law and Law XXVII of 2008 do not comply with all the requirements for central bank independence, the prohibition on monetary financing, and legal integration into the Eurosystem. Other Hungarian legal acts do not comply with the requirements
50 A számvitelről szóló törvény, Magyar Közlöny 2000/95. (IX. 21.).51 A Magyar Nemzeti Bank éves beszámoló készítési és könyvvezetési kötelezettségének sajátosságairól szóló kormányrendelet, Magyar
Közlöny 2000/125. (XII.19.).52 See paragraph 3.7 of Opinion CON/2008/83.
250ECBConvergence ReportJune 2014
for the single spelling of the euro. Hungary is a Member State with a derogation and must therefore comply with all adaptation requirements under Article 131 of the Treaty.
6.6 POLAND
6.6.1 COMPATIBILITY OF NATIONAL LEGISLATION
The following legislation forms the legal basis for Narodowy Bank Polski and its operations:
– the Polish Constitution,53
– the Law on Narodowy Bank Polski (hereinafter the “Law”),54
– the Law on the Bank Guarantee Fund,55
– the Law on banking (hereinafter the “Law on banking”),56
– the Law on settlement finality in the payment and settlement systems and on the supervision of such systems.57
No major new legislation has been enacted in relation to the points identified in the ECB’s Convergence Report of May 2012, and those comments are therefore largely repeated in this year’s assessment.
6.6.2 INDEPENDENCE OF THE NCB
With regard to Narodowy Bank Polski’s independence, the Polish Constitution, the Law and the Law on the State Tribunal58 need to be adapted in the respects set out below.
6.6.2.1 INSTITUTIONAL INDEPENDENCEThe Law does not prohibit Narodowy Bank Polski and members of its decision-making bodies from seeking or taking outside instructions; it also does not expressly prohibit the Government from seeking to influence members of Narodowy Bank Polski’s decision-making bodies in situations where this may have an impact on Narodowy Bank Polski’s fulfilment of its ESCB-related tasks. In this respect, the Law needs to be adapted to comply with Article 130 of the Treaty and Article 7 of the Statute.
Article 11(3) of the Law, which provides that Narodowy Bank Polski’s President represents Poland’s interests within international banking institutions and, unless the Council of Ministers decides otherwise, within international financial institutions, needs to be adapted to comply with Article 130 of the Treaty and Article 7 of the Statute.53 Konstytucja Rzeczypospolitej Polskiej of 2 April 1997, Dziennik Ustaw of 1997, No 78, item 483.54 Ustawa o Narodowym Banku Polskim of 29 August 1997. Consolidated version published in Dziennik Ustaw of 2013, item 908, with
further amendments.55 Ustawa o Bankowym Funduszu Gwarancyjnym of 14 December 1994. Consolidated version published in Dziennik Ustaw of 2009, No 84,
item 711, with further amendments.56 Ustawa Prawo bankowe of 29 August 1997. Consolidated version published in Dziennik Ustaw of 2012, item 1376, with further
amendments.57 Ustawa o ostateczności rozrachunku w systemach płatności i systemach rozrachunku papierów wartościowych oraz zasadach nadzoru nad
tymi systemami of 24 August 2001. Consolidated version published in Dziennik Ustaw of 2013, item 246, with further amendments.58 Ustawa o Trybunale Stanu of 26 March 1982; consolidated version published in Dziennik Ustaw of 2002, No 101, item 925, with further
amendments.
251ECB
Convergence ReportJune 2014
6 EXAMINATION OF COMPATIB IL ITY
OF NATIONAL LEGISLAT ION
WITH THE TREATIES
Article 23(1)(2) of the Law, which obliges Narodowy Bank Polski’s President to forward draft monetary policy guidelines to the Council of Ministers and the Minister for Finance, needs to be adapted to comply with Article 130 of the Treaty and Article 7 of the Statute.
The Supreme Audit Office (NIK), a constitutional body, has wide powers under Article 203(1) of the Polish Constitution to control the activities of all public administrative authorities and Narodowy Bank Polski as regards their legality, economic prudence, efficiency and diligence. The scope of the NIK’s control should be clearly defined, should be without prejudice to the activities of Narodowy Bank Polski’s independent external auditors,59 should comply with the prohibition on giving instructions to an NCB and its decision-making bodies and should not interfere with the NCB’s ESCB-related tasks. In particular, it should be ensured that when auditing Narodowy Bank Polski, the application by the NIK of the “efficacy criterion” does not extend to an evaluation of Narodowy Bank Polski’s activities related to its primary objective of price stability.60 Article 203(1) of the Constitution needs to be adapted to comply with Article 130 of the Treaty and Article 7 of the Statute.
6.6.2.2 PERSONAL INDEPENDENCEArticle 9(5) of the Law regulates the dismissal of Narodowy Bank Polski’s President by the Sejm (lower house of Parliament), if he or she has:
– been unable to fulfil his or her duties due to prolonged illness,
– been convicted of a criminal offence under a final court sentence,
– submitted an untruthful disclosure declaration, confirmed by a final court judgment,61
– been prohibited by the State Tribunal from occupying executive positions or holding posts of particular responsibility in state bodies.62
Moreover, under Article 25(3) in conjunction with Article 3 and Article 1(1)(3) of the Law on the State Tribunal, Narodowy Bank Polski’s President may also be removed from office if he or she violates the Constitution or a law.63
The grounds listed above are in addition to the two grounds for dismissal provided for in Article 14.2 of the Statute. Therefore, Article 9(5) of the Law and the relevant provisions of the Law on the State Tribunal need to be adapted to comply with Article 14.2 of the Statute.
With regard to security of tenure and grounds for dismissal of other members of Narodowy Bank Polski’s decision-making bodies involved in the performance of ESCB-related tasks (i.e. the members of the Management Board, and in particular the First Deputy President, and the members of the Monetary Policy Council), Article 13(5) and Article 17(2b), second sentence, of the Law provide the following grounds for dismissal:59 For the activities of the NCB’s independent external auditors see, as an example, Article 27.1 of the Statute.60 See paragraph 3.6 of Opinion CON/2011/9.61 The provision was added with effect from 15 March 2007 by Article 37a of the Law on disclosure of information relating to documents
of state security services from the period 1944-1990 (Ustawa o ujawnianiu informacji o dokumentach organów bezpieczeństwa państwa z lat 1944-1990 oraz treści tych dokumentów of 18 October 2006; consolidated version published in Dziennik Ustaw of 2007, No 63, item 425).
62 The resolution of the Sejm producing an indictment of the President of Narodowy Bank Polski before the State Tribunal results, by operation of law, in suspension of the President from office (Article 11(1), second sentence in connection with Article 1(1)(3) of the Law on the State Tribunal).
63 The indictment by the Sejm of the President of Narodowy Bank Polski before the State Tribunal results, by operation of law, in suspension of the President from office, see footnote 56 above.
252ECBConvergence ReportJune 2014
– an illness which permanently prevents them from performing their responsibilities,
– a conviction for a criminal offence under a final court sentence,
– submission of an untruthful disclosure declaration as confirmed by a final court judgment,64
– non-suspension of membership of a political party or trade union.
The grounds listed above are in addition to the two grounds for dismissal provided for in Article 14.2 of the Statute. Article 13(5) of the Law therefore needs to be adapted to comply with Article 14.2 of the Statute. Article 14(3) of the Law, which reaffirms the possibility of dismissal of a member of the Monetary Council of Narodowy Bank Polski for a conviction for a criminal offence, needs also to be adapted to comply with Article 14.2 of the Statute.
The President of Narodowy Bank Polski acts in dual capacity as a member of Narodowy Bank Polski’s decision-making bodies and of the relevant decision-making bodies of the ECB. Article 9(3) of the Law, which specifies the wording of the oath sworn by Narodowy Bank Polski’s President, needs to be adapted to reflect the status and the obligations and duties of the President of Narodowy Bank Polski as member of the relevant decision-making bodies of the ECB.
The Law is silent on the right of national courts to review a decision to dismiss any member, other than the President, of the NCB’s decision-making bodies who is involved in the performance of ESCB-related tasks. Even though this right may be available under general Polish law, providing specifically for such a right of review could increase legal certainty.
6.6.3 CONFIDENTIALITY
Article 23(7) of the Law specifies instances in which data collected from individual financial institutions, as well as statistical surveys, studies and assessments enabling identification of individual entities, are subject to disclosure by Narodowy Bank Polski to external parties. One such instance covers disclosure to unspecified recipients, under “separate applicable provisions”.65 Such disclosure may potentially affect data protected under the ESCB’s confidentiality regime and therefore the Law should be adapted to fully comply with Article 37 of the Statute.66
6.6.4 MONETARY FINANCING AND PRIVILEGED ACCESS
Article 42(1) in conjunction with Article 3(2)(5) of the Law provides for Narodowy Bank Polski’s powers to grant refinancing credit to banks satisfying specified conditions.67 In addition, Article 42(3) of the Law allows Narodowy Bank Polski to grant refinancing credit for the purpose of implementing bank rehabilitation proceedings, which are initiated in the event of a bank suffering a net loss, being threatened with such a loss or insolvency.68 Granting of refinancing credit is in all cases subject to the general rules of the Law on banking, with the modifications resulting from the Law.69 Safeguards currently contained in such rules aiming at ensuring timely repayment of the credit do not fully exclude an interpretation that would allow an extension of refinancing credit 64 See footnote 55 above.65 Article 23(7)(3) of the Law.66 See Opinion CON/2008/53.67 Narodowy Bank Polski’s decision whether to grant refinancing credit is based on its assessment of the bank’s ability to repay the principal
amount and the interest on time (Article 42(2) of the Law).68 Article 142(1) of the Law on banking.69 Article 42(7) of the Law.
253ECB
Convergence ReportJune 2014
6 EXAMINATION OF COMPATIB IL ITY
OF NATIONAL LEGISLAT ION
WITH THE TREATIES
to a bank undergoing rehabilitation proceedings which then becomes insolvent.70 More explicit safeguards in relation to all financial institutions receiving liquidity support from Narodowy Bank Polski are needed to avoid incompatibility with the monetary financing prohibition under Article 123 of the Treaty.71 Article 42 of the Law should be adapted accordingly.
Article 220(2) of the Polish Constitution provides that “the budget shall not provide for covering a budget deficit by way of contracting credit obligations to the State’s central bank”. While this provision prohibits the State from financing its budgetary deficit via Narodowy Bank Polski, the ECB understands that it does not constitute an implementation of Article 123 of the Treaty prohibiting monetary financing, and its aim and function are therefore not identical to those of the said Treaty prohibition. Article 123 of the Treaty, supplemented by Regulation (EC) No 3603/93, is directly applicable, so in general, it is unnecessary to transpose it into national legislation.
6.6.5 LEGAL INTEGRATION OF THE NCB INTO THE EUROSYSTEM
With regard to Narodowy Bank Polski’s legal integration into the Eurosystem, the Polish Constitution and the Law need to be adapted in the respects set out below.
6.6.5.1 ECONOMIC POLICY OBJECTIVESArticle 3(1) of the Law provides that Narodowy Bank Polski’s primary objective is to maintain price stability, while supporting the economic policies of the Government, insofar as this does not constrain the pursuit of its primary objective. This provision is incompatible with Article 127(1) of the Treaty and Article 2 of the Statute, as it does not reflect the secondary objective of supporting the general economic policies of the Union.
6.6.5.2 TASKSMonetary policyArticle 227(1) and (5) of the Constitution and Article 3(2)(5), Articles 12, 23 and 38 to 50a and 53 of the Law, which provide for Narodowy Bank Polski’s powers with regard to monetary policy, do not recognise the ECB’s powers in this field.
Collection of statisticsArticle 3(2)(7) and Article 23 of the Law, which provides for Narodowy Bank Polski’s powers relating to the collection of statistics, do not recognise the ECB’s powers in this field.
Official foreign reserve managementArticle 3(2)(2) and Article 52 of the Law, which provide for Narodowy Bank Polski’s powers in the field of foreign exchange management, do not recognise the ECB’s powers in this field.
Payment systemsArticle 3(2)(1) of the Law, which provides for Narodowy Bank Polski’s powers in organising monetary settlements, does not recognise the ECB’s powers in this field.
70 Under the Law on banking which applies to the provision of refinancing credit by Narodowy Bank Polski, a commercial bank may extend credit to an uncreditworthy borrower, provided that: (i) qualified security is established; and (ii) a recovery programme is instituted, which the crediting bank considers will ensure the borrower’s creditworthiness during a specified period (Article 70(2) of the Law on banking). Furthermore, Narodowy Bank Polski may demand early repayment of any refinancing credit if the financial situation of the credited bank has worsened to the extent of putting the timely repayment at risk (Article 42(6) of the Law).
71 See Opinion CON/2013/5.
254ECBConvergence ReportJune 2014
Issue of banknotesArticle 227(1) of the Constitution and Article 4 and Articles 31 to 37 of the Law, which provide for Narodowy Bank Polski’s exclusive powers to issue and withdraw banknotes and coins having the status of legal tender, do not recognise the Council’s and the ECB’s powers in this field.
6.6.5.3 FINANCIAL PROVISIONSAppointment of independent auditorsArticle 69(1) of the Law, which provides for the auditing of Narodowy Bank Polski, does not recognise the Council’s and the ECB’s powers under Article 27.1 of the Statute. The powers of the NIK to control the activities of Narodowy Bank Polski should be clearly defined by legislation and should be without prejudice to the activities of Narodowy Bank Polski’s independent external auditors, as laid down in Article 27.1 of the Statute.
6.6.5.4 EXCHANGE RATE POLICYArticles 3(2)(3) and 17(4)(2) and Article 24 of the Law, which provide for Narodowy Bank Polski’s power to implement the exchange rate policy set in agreement with the Council of Ministers, do not recognise the Council’s and the ECB’s powers in this field.
6.6.5.5 INTERNATIONAL COOPERATIONArticles 5(1) and 11(3) of the Law, which provide for Narodowy Bank Polski’s right to participate in international financial and banking institutions, do not recognise the ECB’s powers in this field.
6.6.5.6 MISCELLANEOUSArticle 9(3) of the Law, which specifies the wording of the oath sworn by Narodowy Bank Polski’s President, needs to be adapted to comply with Article 14.3 of the Statute.
With regard to Article 21(4) of the Law, which provides for Narodowy Bank Polski’s rights to present its opinion on draft legislation concerning the activity of banks and having significance to the banking system, it is noted that consulting Narodowy Bank Polski does not obviate the need to consult the ECB under Articles 127(4) and 282(5) of the Treaty.
6.6.6 CONCLUSIONS
The Polish Constitution, the Law and the Law on the State Tribunal do not comply with all the requirements of central bank independence, confidentiality, the monetary financing prohibition and legal integration into the Eurosystem. Poland is a Member State with a derogation and must therefore comply with all adaptation requirements under Article 131 of the Treaty.72
6.7 ROMANIA
6.7.1 COMPATIBILITY OF NATIONAL LEGISLATION
The following legislation forms the legal basis for Banca Naţională a României and its operations:
– Law No 312 on the Statute of Banca Naţională a României (hereinafter the “Law”).73
72 For a detailed review of necessary adaptations of the Constitution, the Law and other laws, see Opinion CON/2011/9.73 Monitorul Oficial al României, Part One, No 582, 30.6.2004.
255ECB
Convergence ReportJune 2014
6 EXAMINATION OF COMPATIB IL ITY
OF NATIONAL LEGISLAT ION
WITH THE TREATIES
There have been no changes in relation to the points identified in the ECB’s Convergence Report of May 2012 concerning the Law, and therefore those comments are repeated in this year’s assessment. Government Emergency Ordinance 90/2008 on the statutory audit of the annual financial statements and consolidated annual financial statements74 has been amended in order to comply with Article 123 of the Treaty75 and therefore the comment regarding the compliance of this provision with the prohibition on monetary financing has been removed.
6.7.2 INDEPENDENCE OF THE NCB
With regard to Banca Naţională a României’s independence, the Law and other legislation needs to be adapted in the respects set out below.
6.7.2.1 INSTITUTIONAL INDEPENDENCEArticle 3(1) of the Law provides that, when carrying out their tasks, Banca Naţională a României and the members of its decision-making bodies may not seek or take instructions from public authorities or from any other institution or authority. The ECB understands that the provision encompasses both national and foreign institutions in line with Article 130 of the Treaty and Article 7 of the Statute. For legal certainty reasons, the next amendment to the Law should bring this provision fully into line with Article 130 of the Treaty and Article 7 of the Statute.
Further, Article 3 of the Law does not expressly prohibit the Government from seeking to influence the members of Banca Naţională a României’s decision-making bodies in situations where this may have an impact on Banca Naţională a României’s fulfilment of its ESCB-related tasks. In this respect the Law needs to be adapted to be fully consistent with Article 130 of the Treaty and Article 7 of the Statute.
6.7.2.2 PERSONAL INDEPENDENCEArticle 33(9) of the Law provides that an appeal may be brought to the High Court of Cassation and Justice against a decision to recall from office a member of the Board of Banca Naţională a României within 15 days of its publication in Monitorul Oficial al României. The Law is silent on the jurisdiction of the Court of Justice of the European Union to hear cases with regard to the dismissal of the Governor. The ECB understands that in spite of this silence, Article 14.2 of the Statute applies.
Article 33(7) of the Law provides that no member of the Board of Banca Naţională a României may be recalled from office for reasons other than or following a procedure other than those provided for in Article 33(6) of the Law. Article 33(6) of the Law contains grounds for dismissal which are compatible with those laid down in Article 14.2 of the Statute. Law 161/2003 on certain measures for transparency in the exercise of public dignities, public functions and business relationships and for the prevention and sanctioning of corruption,76 and Law 176/2010 on the integrity in the exercise of public functions and dignities,77 define the conflicts of interest and incompatibilities applicable to the Governor and the other members of the Board of Banca Naţională a României and require them to report on their interests and wealth. The ECB understands that the sanctions provided for in these Laws for the breach of such obligations as well as the automatic resignation mechanism in cases of
74 Monitorul Oficial al României, Part One, No 481 of 30 June 2008.75 Banca Naţională a României no longer contributes funds to the functioning of the Council for the Public Supervision of the Accounting
Profession in the Public Interest.76 Published in Monitorul Oficial al României, Part One, No 279, 21.4.2003.77 Published in Monitorul Oficial al României, Part One, No 621, 2.9.2010.
256ECBConvergence ReportJune 2014
incompatibility78 do not constitute new grounds for dismissal of the Governor or other members of the Board of Banca Naţională a României in addition to those contained in Article 33 of the Law. For legal certainty reasons and in line with Article 33 of the Law, a clarification to this end in the above-mentioned Laws would be welcome.
6.7.2.3 FINANCIAL INDEPENDENCEArticle 43 of the Law provides that Banca Naţională a României must transfer to the State budget an 80% share of the net revenues left after deducting expenses relating to the financial year, including provisions for credit risk, and any losses relating to previous financial years that remain uncovered. As noted in Chapter 6.7.4, this arrangement may in certain circumstances amount to an intra-year credit, which in turn may undermine the financial independence of Banca Naţională a României.
A Member State may not put its NCB in a position where it has insufficient financial resources to carry out its ESCB or Eurosystem-related tasks, and also its own national tasks, such as financing its administration and own operations.
Article 43(3) of the Law also provides that Banca Naţională a României sets up provisions for credit risk in accordance with its rules, after having consulted the Ministry of Public Finance. The ECB notes that NCBs must be free to independently create financial provisions to safeguard the real value of their capital and assets.
Article 43 of the Law should therefore be adapted, in addition to taking into account the issues highlighted in Chapter 6.7.4, to ensure that such arrangement does not undermine the ability of Banca Naţională a României to carry out its tasks in an independent manner.
Pursuant to Articles 21 and 23 of Law 94/1992 on the organisation and functioning of the Court of Auditors,79 the Court of Auditors is empowered to control the establishment, management and use of the public sector’s financial resources, including Banca Naţională a României’s financial resources, and to audit management of the funds of Banca Naţională a României. The scope of audit by the Court of Auditors is further defined in Article 47(2) of the Law which provides that commercial operations performed by Banca Naţională a României, as shown in the revenue and expenditure budget and in the annual financial statements, shall be subject to auditing by the Court of Auditors. As the provisions of Law 94/1992 on the organisation and functioning of the Court of Auditors expressly apply to Banca Naţională a României, in the interests of legal certainty it should be clarified in Romanian legislation that the scope of audit by the Court of Auditors is provided by Article 47(2) of the Law and is therefore limited to commercial operations performed by Banca Naţională a României.80
6.7.3 CONFIDENTIALITYPursuant to Article 52(2) of the Law, the Governor may release confidential information on the four grounds listed under Article 52(2) of the Law. Under Article 37 of the Statute, professional secrecy is an ESCB-wide matter. Therefore, the ECB assumes that such release is without prejudice to the confidentiality obligations towards the ECB and the ESCB.
78 According to the relevant provisions of Article 99 of Law 161/2003, if a member of the Board of Banca Naţională a României or an employee occupying a leading position with Banca Naţională a României does not choose within a given period of time between their function and the one which they have declared to be incompatible with their function, they are considered to have resigned from their function and the Parliament takes note of the resignation.
79 Published in Monitorul Oficial al României, Part One, No 282, 29.4.2009.80 For the activities of the NCB’s independent external auditors see, as an example, Article 27.1 of the Statute.
257ECB
Convergence ReportJune 2014
6 EXAMINATION OF COMPATIB IL ITY
OF NATIONAL LEGISLAT ION
WITH THE TREATIES
6.7.4 MONETARY FINANCING AND PRIVILEGED ACCESS
Articles 6(1) and 29(1) of the Law expressly prohibit direct purchase on the primary market by Banca Naţională a României of debt instruments issued by the State, central and local public authorities, autonomous public service undertakings, national societies, national companies and other majority State-owned companies. Such prohibition has been extended by Article 6(2) to other bodies governed by public law and public undertakings in Member States. Furthermore, under Article 7(2) of the Law, Banca Naţională a României is prohibited from granting overdraft facilities or any other type of credit facility to the State, central and local public authorities, autonomous public service undertakings, national societies, national companies and other majority State-owned companies. Article 7(4) extends this prohibition to other bodies governed by public law and public undertakings in Member States. The range of public sector entities referred to in these provisions needs to be extended to be consistent with and fully mirror Article 123 of the Treaty and aligned with the definitions contained in Regulation (EC) No 3603/93.
Pursuant to Article 7(3) of the Law, majority State-owned credit institutions are exempted from the prohibition on granting overdraft facilities and any other type of credit facility in Article 7(2) and benefit from loans granted by Banca Naţională a României in the same way as any other credit institution eligible under Banca Naţională a României’s regulations. The wording of Article 7(3) of the Law should be aligned with the wording of Article 123(2) of the Treaty, which only exempts publicly owned credit institutions “in the context of the supply of reserves by central banks”.
Article 26 of the Law provides that, to carry out its task of ensuring financial stability, in exceptional cases and only on a case-by-case basis, Banca Naţională a României may grant to credit institutions loans which are unsecured or secured by assets other than assets eligible to collateralise the monetary or foreign exchange policy operations of Banca Naţională a României. Article 26 does not contain sufficient safeguards to prevent such lending from potentially breaching the monetary financing prohibition contained in Article 123 of the Treaty, especially given the risk that such lending could result in the provision of solvency support to a credit institution experiencing financial difficulties, and should be adapted accordingly.
Article 43 of the Law provides that Banca Naţională a României must transfer to the State budget an 80% share of the net revenues left after deducting expenses relating to the financial year, including provisions for credit risk, and loss related to the previous financial years that remained uncovered. The 80% of the net revenues is transferred monthly before the 25th day of the following month, based on a special statement. The adjustments relating to the financial year are performed by the deadline for submission of the annual balance sheet, based on a rectifying special statement. This provision is constructed in a way which does not rule out the possibility of an intra-year anticipated profit distribution in circumstances where Banca Naţională a României accumulates profits during the first half of the year but suffers consecutive losses during the second half of the year. Although the State is under an obligation to make adjustments after the closure of the financial year and would therefore have to return any excessive distributions to Banca Naţională a României, this would only happen after the deadline for submission of the annual balance sheet and may therefore be viewed as amounting to an intra-year credit to the State. Article 43 should be adapted to ensure that such an intra-year credit is not possible to rule out the possibility of breaching the monetary financing prohibition in Article 123 of the Treaty.
258ECBConvergence ReportJune 2014
6.7.5 LEGAL INTEGRATION OF THE NCB INTO THE EUROSYSTEM
With regard to Banca Naţională a României’s legal integration into the Eurosystem, the Law needs to be adapted in the respects set out below.
6.7.5.1 ECONOMIC POLICY OBJECTIVESArticle 2(3) of the Law provides that, without prejudice to the primary objective of price stability, Banca Naţională a României must support the State’s general economic policy. This provision is incompatible with Article 127(1) of the Treaty, as it does not reflect the secondary objective of supporting the general economic policies of the Union.
6.7.5.2 TASKSMonetary policyArticle 2(2)(a), Article 5, Articles 6(3) and 7(1), Articles 8, 19 and 20 and Article 33(1)(a) of the Law, which provide for the powers of Banca Naţională a României in the field of monetary policy and instruments for the implementation thereof, do not recognise the ECB’s powers in this field.
Collection of statisticsArticle 49 of the Law, which provides for the powers of Banca Naţională a României relating to the collection of statistics, does not recognise the ECB’s powers in this field.
Official foreign reserve managementArticles 2(2)(e) and 9(2)(c) and Articles 30 and 31 of the Law, which provide for the powers of Banca Naţională a României relating to foreign reserve management, do not recognise the ECB’s powers in this field.
Payment systemsArticle 2(2)(b), Article 22 and Article 33(1)(b) of the Law, which provide for the role of Banca Naţională a României in relation to the smooth operation of payment systems, do not recognise the ECB’s powers in this field.
Issue of banknotesArticle 2(2)(c) and Articles 12 to 18 of the Law, which provide for Banca Naţională a României’s role in issuing banknotes and coins, do not recognise the Council’s and the ECB’s powers in this field.
6.7.5.3 FINANCIAL PROVISIONSAppointment of independent auditorsArticle 36(1) of the Law, which provides that the annual financial statements of Banca Naţională a României are audited by financial auditors that are legal entities authorised by the Financial Auditors Chamber in Romania and selected by the Board of Banca Naţională a României through a tender procedure, does not recognise the ECB’s and the Council’s powers under Article 27.1 of the Statute.
Financial reportingArticle 37(3) of the Law, which provides that Banca Naţională a României establishes the templates for the annual financial statements after having consulted the Ministry of Public Finance, and Article 40 of the Law, which provides that Banca Naţională a României adopts its own regulations on organising and conducting its accounting, in compliance with the legislation in force and
259ECB
Convergence ReportJune 2014
6 EXAMINATION OF COMPATIB IL ITY
OF NATIONAL LEGISLAT ION
WITH THE TREATIES
having regard to the advisory opinion of the Ministry of Public Finance, and that Banca Naţională a României registers its economic and financial operations in compliance with its own chart of accounts, also having regard to the advisory opinion of the Ministry of Public Finance, do not reflect Banca Naţională a României’s obligation to comply with the Eurosystem’s regime for financial reporting of NCB operations, pursuant to Article 26 of the Statute.
6.7.5.4 EXCHANGE RATE POLICYArticle 2(2)(a) and (d), Article 9 and Article 33(1)(a) of the Law, which empower Banca Naţională a României to conduct exchange rate policy, do not recognise the Council’s and the ECB’s powers in this field.
Articles 10 and 11 of the Law, which allow Banca Naţională a României to draw up regulations on monitoring and controlling foreign currency transactions in Romania and to authorise foreign currency capital operations, transactions on foreign currency markets and other specific operations, do not recognise the Council’s and the ECB’s powers in this field.
6.7.6 MISCELLANEOUSWith regard to Article 3(2) of the Law, which entitles Banca Naţională a României to be consulted on draft national legislation, consulting Banca Naţională a României does not obviate the need to consult the ECB under Articles 127(4) and 282(5) of the Treaty.
Article 57 of the Law does not recognise the ECB’s powers to impose sanctions.
Article 4(5) of the Law entitles Banca Naţională a României to conclude short-term credit arrangements and to perform other financial and banking operations with other entities, including central banks, and provides that such arrangements are possible only if the credit is repaid within one year. The ECB notes that such a limitation is not foreseen in Article 23 of the Statute.
6.7.7 CONCLUSIONSThe Law does not comply with all the requirements for central bank independence, the monetary financing prohibition and legal integration into the Eurosystem. Romania is a Member State with a derogation and must therefore comply with all adaptation requirements under Article 131 of the Treaty.
6.8 SWEDEN
6.8.1 COMPATIBILITY OF NATIONAL LEGISLATION
The following legislation forms the legal basis for Sveriges Riksbank and its operations:
– the Instrument of Government,81 which forms part of the Swedish Constitution,
– the Law on Sveriges Riksbank (hereinafter the “Law”),82
– the Law on exchange rate policy.83
81 SFS 1974:152.82 SFS 1988:1385.83 SFS 1998:1404.
260ECBConvergence ReportJune 2014
There have been no major changes to the Law in relation to the points identified in the ECB’s Convergence Report of May 2012, and those comments are therefore largely repeated in this year’s assessment.
6.8.2 INDEPENDENCE OF THE NCB
With regard to Sveriges Riksbank’s independence, the Law needs to be adapted in the respects set out below.
6.8.2.1 INSTITUTIONAL INDEPENDENCEArticle 13 of Chapter 9 of the Instrument of Government states that Sveriges Riksbank is an authority under the Riksdag. Article 2 of Chapter 3 of the Law, which prohibits the members of the Executive Board from seeking or taking of instructions, and Article 13 of Chapter 9 of the Instrument of Government, which prohibits any authority from giving instructions to Sveriges Riksbank, do not cover all ESCB-related tasks, as required by Article 130 of the Treaty and Article 7 of the Statute.
Although the explanatory memorandum to the Law extends the coverage to all ESCB-related tasks, it would be beneficial if this issue and the relation with Article 13 of Chapter 9 of the Instrument of Government were addressed in the next amendments to the relevant provisions of Swedish legislation.
In addition, pursuant to Article 13(1) of Chapter 8 of the Instrument of Government, the Parliament may direct Sveriges Riksbank in an act of law within its sphere of responsibility under Chapter 9 (Financial power) to adopt provisions concerning its duty to promote secure and efficient payment systems. The ECB understands that this provision only enables the Parliament to assign the adoption of regulations to Sveriges Riksbank within the Sveriges Riksbank’s areas of responsibility for promoting secure and efficient payment systems.
Article 3 of Chapter 6 of the Law, which establishes the right of the minister appointed by the Swedish Government to be informed prior to Sveriges Riksbank making a monetary policy decision of major importance, could potentially breach the prohibition on giving instructions to the NCBs pursuant to Article 130 of the Treaty and Article 7 of the Statute. Article 3 of Chapter 6 of the Law is therefore incompatible with central bank independence and should be adapted accordingly.
6.8.2.2 FINANCIAL INDEPENDENCE
In accordance with Article 3 of Chapter 10 of the Law, the General Council of Sveriges Riksbank submits proposals to the Swedish Parliament and the Swedish National Audit Office on the allocation of Sveriges Riksbank’s profit. Pursuant to Article 4 of Chapter 10 of the Law, the Swedish Parliament then determines the allocation of Sveriges Riksbank’s profit. These provisions are supplemented by non-statutory guidelines on profit distribution, which state that Sveriges Riksbank should pay 80% of its profit to the Swedish State, after adjustment for exchange rate and gold valuation effects and based on a five-year average, with the remaining 20% used to increase its own capital. However, these guidelines are not legally binding and there is no statutory provision limiting the amount of profit that may be paid out.
The present arrangements on profit distribution are under review.84 However, as they currently stand, they are incompatible with the requirement of central bank independence in Article 130 of the Treaty and Article 7 of the Statute. To safeguard Sveriges Riksbank’s financial independence, 84 See Opinion CON/2013/53.
261ECB
Convergence ReportJune 2014
6 EXAMINATION OF COMPATIB IL ITY
OF NATIONAL LEGISLAT ION
WITH THE TREATIES
statutory provisions should be adopted containing clear provisions concerning the limitations applicable to the Swedish Parliament’s decisions on Sveriges Riksbank’s profit allocation.
6.8.3 MONETARY FINANCING PROHIBITION
Article 1(3) of Chapter 8 of the Law provides that Sveriges Riksbank may not extend credit or purchase debt instruments directly from the State, another public body or a Union institution. Although the explanatory memorandum to the Law, which according to Swedish legal tradition will be closely followed by Swedish courts when interpreting national legislation, states that the coverage is extended to Union bodies and the public sector including public undertakings of other Member States, it would be beneficial if this issue could be addressed when the Law is next amended, to bring it fully in line with Article 123 of the Treaty.
In addition, Article 1(4) of Chapter 8 of the Law provides that “subject to other provisions in this Law, the Riksbank may also grant credit to and purchase debt instruments from financial institutions owned by the State or another public body”. The wording of Article 1(4) of Chapter 8 of the Law should be aligned with the wording of Article 123(2) of the Treaty, which only exempts publicly owned credit institutions from the prohibition on monetary financing in respect of the supply of reserves by central banks; the central bank may not supply reserves to other public financial institutions. In the same vein, the range of public sector entities would need to be made consistent with Article 123(2) of the Treaty, and the ECB suggests, for reasons of legal certainty, inserting a reference to Article 123 of the Treaty in Article 1 of Chapter 8 of the Law.
As noted above, the provisions of the Law on the allocation of Sveriges Riksbank’s profit are supplemented by non-statutory guidelines on profit distribution, that are not legally binding, and state that Sveriges Riksbank should pay 80% of its profit to the Swedish State, after adjustment for exchange rate and gold valuation effects and based on a five-year average, with the remaining 20% used to increase its own capital. It is essential for the five-year average rule to be applied in a way which remains consistent with the prohibition on monetary financing under Article 123 of the Treaty, i.e. only as a calculation method and a cap for the NCB’s profit distribution to the State budget. Statutory provisions providing for necessary limitations and ensuring that a breach of the monetary financing prohibition may not occur in this respect should also be adopted. To comply with the monetary financing prohibition, the amount distributed to the State budget pursuant to the applicable profit distribution rules cannot be paid, even partially, from the NCB’s reserve capital. Therefore, profit distribution rules should leave unaffected the NCB’s reserve capital.
6.8.4 LEGAL INTEGRATION OF THE NCB INTO THE EUROSYSTEM
With regard to Sveriges Riksbank’s legal integration into the Eurosystem, the Law, the Constitution and the Law on exchange rate policy need to be adapted in the respects set out below.
6.8.4.1 ECONOMIC POLICY OBJECTIVESArticle 2 of Chapter 1 of the Law provides that Sveriges Riksbank’s objective is to maintain price stability. It also provides that Sveriges Riksbank promotes a safe and efficient payments system. The ECB notes that insofar as this is a task and not an objective of the Sveriges Riksbank, there is no need to subordinate it to the ESCB’s primary and secondary objectives. In any case, Article 2 should reflect the ESCB’s secondary objective of supporting the general economic policies of the Union in line with Article 127(1) of the Treaty and Article 2 of the Statute.
262ECBConvergence ReportJune 2014
6.8.4.2 TASKSArticle 1 of Chapter 1 of the Law, which provides that Sveriges Riksbank may only conduct, or participate in, such activities for which it has been authorised by Swedish law, is incompatible with the provisions of the Treaty and the Statute as it does not provide for Sveriges Riksbank’s legal integration into the Eurosystem.
Monetary policyArticle 13 of Chapter 9 of the Instrument of Government and Article 2 of Chapter 1 of the Law, which establish Sveriges Riksbank’s powers in the field of monetary policy, do not recognise the ECB’s powers in this field.
Articles 2, 5 and 6 of Chapter 6 of the Law, which provide for Sveriges Riksbank’s powers in the field of monetary policy, do not recognise the ECB’s powers in this field.
Article 6 of Chapter 6 and Articles 1 and 2a of Chapter 11 of the Law, concerning the imposition of minimum reserves on financial institutions and the payment of a special fee to the Swedish State in the event of a breach of this requirement, do not recognise the ECB’s powers in this field.
Collection of statisticsArticle 4(2) and Article 9 of Chapter 6 of the Law, which establish Sveriges Riksbank’s powers relating to the collection of statistics, do not recognise the ECB’s powers in this field.
Official foreign reserve managementChapter 7 of the Law, and Article 12 of Chapter 9 of the Instrument of Government, which provide for Sveriges Riksbank’s powers in the field of foreign reserve management, do not recognise the ECB’s powers in this field.
Payment systemsArticle 14(2) of Chapter 9 of the Instrument of Government and Article 2 of Chapter 1 and Article 7 of Chapter 6 of the Law, which establish Sveriges Riksbank’s powers with regard to the smooth operation of payment systems, do not recognise the ECB’s powers in this field.
Issue of banknotesArticle 14 of Chapter 9 of the Instrument of Government and Chapter 5 of the Law, which lay down Sveriges Riksbank’s exclusive right to issue banknotes and coins, do not recognise the Council’s and the ECB’s powers in this field.
6.8.4.3 FINANCIAL PROVISIONSAppointment of independent auditorsThe Law does not recognise the Council’s and the ECB’s powers under Article 27.1 of the Statute.
6.8.4.4 EXCHANGE RATE POLICYArticle 12 of Chapter 9 of the Instrument of Government and Chapter 7 of the Law, together with the Law on exchange rate policy, lay down the powers of the Swedish Government and Sveriges Riksbank in the area of exchange rate policy. These provisions do not recognise the Council’s and the ECB’s powers in this field.
263ECB
Convergence ReportJune 2014
6 EXAMINATION OF COMPATIB IL ITY
OF NATIONAL LEGISLAT ION
WITH THE TREATIES
6.8.4.5 INTERNATIONAL COOPERATIONPursuant to Article 6 of Chapter 7 in the Law, Sveriges Riksbank may serve as a liaison body in relation to international financial institutions of which Sweden is a member. This provision does not recognise the ECB’s powers in this field.
6.8.4.6 MISCELLANEOUSWith regard to Article 4 of Chapter 2 of the Law, which provides for the General Council’s right to submit consultation opinions on behalf of Sveriges Riksbank within its area of competence, it is noted that consulting Sveriges Riksbank does not obviate the need to consult the ECB under Articles 127(4) and 282(5) of the Treaty.
As specified in Chapter 2.2.4, the primacy of Union law and rules adopted thereunder also means that national laws on access by third parties to documents may not lead to infringements of the ESCB’s confidentiality regime. The ECB understands that the Public Access to Information and Secrecy Act85 and any other relevant Swedish legislation will permit Sveriges Riksbank to apply it in a manner that ensures compliance with the ESCB’s confidentiality regime.
6.8.5 CONCLUSIONS
The Law, the Constitution and the Law on exchange rate policy do not comply with all the requirements for central bank independence, the monetary financing prohibition and legal integration into the Eurosystem. Sweden is a Member State with a derogation and must therefore comply with all adaptation requirements under Article 131 of the Treaty. The ECB notes that the Treaty has obliged Sweden to adopt national legislation for integration into the Eurosystem since 1 June 1998. Over the years no legislative action has been taken by the Swedish authorities to remedy the incompatibilities described in this and previous reports.
85 SFS 2009:400.

265ECB
Convergence ReportJune 2014
GLOSSARYGLOSSARYAcquis communautaire: the body of EU legislation, including its interpretation by the Court of Justice of the European Union, by which all EU Member States are bound.
Alert Mechanism Report: the first step of the EU’s new surveillance procedure for preventing and correcting macroeconomic imbalances. In the report, the European Commission identifies EU Member States that will be subject to further in-depth analysis under the macroeconomic imbalance procedure.
Banking union: one of the building blocks for completing Economic and Monetary Union, which consists of an integrated financial framework with a single rulebook, a Single Supervisory Mechanism, common deposit protection and a single bank resolution mechanism.
Central government: the government as defined in the European System of Accounts 1995, but excluding regional and local governments (see also general government). The term includes all administrative departments of the (central) state and other central agencies whose competence extends over the entire economic territory, except for the administration of social security funds.
Central rate: the exchange rate of each ERM II member’s currency vis-à-vis the euro, around which the ERM II fluctuation margins are defined.
Combined direct and portfolio investment balance: the sum of the direct investment balance and the portfolio investment balance in the financial account of the balance of payments. Direct investment is cross-border investment for the purpose of acquiring a lasting interest in an enterprise resident in another economy (assumed, in practice, for ownership of at least 10% of ordinary shares or voting power). This includes equity capital, reinvested earnings and “other capital” associated with inter-company operations. Portfolio investment includes equity securities (when not a direct investment) and debt securities (bonds and notes, and money market instruments).
Contingent liabilities: government obligations that arise only upon the realisation of particular events (e.g. state guarantees).
Convergence criteria: the criteria set out in Article 140(1) of the Treaty (and developed further in the Protocol (No 13) on the convergence criteria referred to in Article 140) that must be fulfilled by each EU Member State before it can adopt the euro. They relate to performance in respect of price stability, government financial positions, exchange rates and long-term interest rates. The reports produced under Article 140(1) by the European Commission and the European Central Bank examine whether a high degree of sustainable convergence has been achieved by each EU Member State on the basis of its fulfilment of these criteria, in addition to examining the compatibility of their national legislation, including the statute of their respective national central bank, with the Treaties.
Convergence programme: a programme outlining the path towards the achievement of reference values indicated in the Treaty, containing medium-term government plans and assumptions regarding the development of key economic variables. Measures to consolidate fiscal balances are also highlighted, together with underlying economic scenarios. Convergence programmes normally cover the following three to four years and are updated annually. They are examined by the European Commission and the Economic and Financial Committee, whose reports serve as the basis for an assessment by the ECOFIN Council. Following the start of Stage Three of Economic and Monetary Union, EU Member States with a derogation continue to submit
266ECBConvergence ReportJune 2014
convergence programmes, whereas countries which are members of the euro area present annual stability programmes, in accordance with the Stability and Growth Pact.
Council of the European Union (EU Council): an institution of the EU made up of representatives of the governments of the EU Member States, normally the ministers responsible for the matters under consideration.
Current transfers: transfers of the general government (e.g. relating to international cooperation), payments of current taxes on income and wealth and other transfers, such as workers’ remittances, which are not related to capital expenditure; they also include production and import subsidies, social benefits and transfers to EU institutions.
Cyclical component of the budget balance: the effect on the budget balance of the output gap, as estimated by the European Commission.
Debt ratio (general government): general government debt is defined as total gross debt at nominal value outstanding at the end of the year and consolidated between and within the sectors of general government. The government debt-to-GDP ratio is defined as the ratio of general government debt to GDP at current market prices. It is the subject of one of the fiscal criteria used to define the existence of an excessive deficit, as laid down in Article 126(2) of the Treaty.
Deficit-debt adjustment: the difference between the general government budget balance (government deficit or surplus) and the change in general government debt. Such adjustments may stem from, among other things, changes in the amount of financial assets held by the government, revaluations or statistical adjustments.
Deficit ratio (general government): the general government deficit is defined as net borrowing and corresponds to the difference between general government revenue and general government expenditure. The deficit ratio is defined as the ratio of the general government deficit to GDP at current market prices. It is the subject of one of the fiscal criteria used to define the existence of an excessive deficit, as laid down in Article 126(2) of the Treaty.
ECOFIN Council: the EU Council meeting in the composition of the ministers of economics and finance (see also Council of the European Union).
Economic and Financial Committee: a consultative EU body which carries out preparatory work for the ECOFIN Council and the European Commission on topics related to the economic and financial situation of the EU Member States. Its composition and tasks are set out in Article 134 of the Treaty.
Economic and Monetary Union (EMU): the outcome of the process for the harmonisation of the economic policies of the EU Member States that led to the single currency, the euro, and the single monetary policy of the euro area. The process for achieving EMU, as laid down in the Treaty, involved three stages. Stage Three, the final stage, began on 1 January 1999 with the irrevocable fixing of exchange rates, the transfer of monetary competence to the European Central Bank and the introduction of the euro. The cash changeover on 1 January 2002 completed the process of setting up EMU.
267ECB
Convergence ReportJune 2014
GLOSSARY
Effective exchange rate (EER) (nominal/real): a weighted average of the bilateral exchange rates of a country’s currency against the currencies of major trading partners. The weights used reflect the share of each partner country in the trade of the country under consideration and account for competition in third markets. The real EER is the nominal EER deflated by a weighted average of foreign prices relative to domestic prices.
Elderly dependency ratio: the proportion of the population of a country aged 65 and over in relation to the population aged 15-64.
ERM II (exchange rate mechanism II): the exchange rate mechanism which provides the framework for exchange rate policy cooperation between the euro area countries and the non-euro area EU Member States. ERM II is a multilateral arrangement with fixed, but adjustable, central rates and a standard fluctuation band of ±15%. Decisions concerning central rates and, possibly, narrower fluctuation bands are taken by mutual agreement between the EU Member State concerned, the euro area countries, the European Central Bank (ECB) and the other EU Member States participating in the mechanism. All participants in ERM II, including the ECB, have the right to initiate a confidential procedure aimed at changing the central rates (see also realignment).
ERM II fluctuation margins: the mutually agreed floor and ceiling within which ERM II member currencies are allowed to fluctuate against the euro.
Excessive imbalance procedure: refers to the corrective arm of the macroeconomic imbalance procedure, which is initiated when excessive macroeconomic imbalances are identified in an EU Member State, including imbalances that jeopardise the proper functioning of Economic and Monetary Union. The procedure includes issuing policy recommendations, the preparation of a corrective action plan by the Member State concerned, enhanced surveillance and monitoring requirements and, in respect of EU Member States whose currency is the euro, the possibility of financial sanctions in the event of a failure to take corrective action.
Euro area: the area formed by the EU Member States whose currency is the euro and in which a single monetary policy is conducted under the responsibility of the Governing Council of the European Central Bank. The euro area currently comprises Belgium, Germany, Estonia, Ireland, Greece, Spain, France, Italy, Cyprus, Latvia, Luxembourg, Malta, the Netherlands, Austria, Portugal, Slovenia, Slovakia and Finland.
Eurogroup: an informal gathering of the ministers of economics and finance of the EU Member States whose currency is the euro. Its status is recognised under Article 137 of the Treaty and in Protocol No 14. The Eurogroup meets on a regular basis (usually prior to meetings of the ECOFIN Council) to discuss issues connected with the euro area countries’ shared responsibilities for the single currency. The European Commission and the European Central Bank are regularly invited to take part in these meetings.
European Central Bank (ECB): the EU institution which, together with the national central banks (NCBs) of the EU Member States whose currency is the euro, defines and implements the monetary policy for the euro area. The ECB lies at the centre of the Eurosystem and the European System of Central Banks (ESCB), which are governed by the decision-making bodies of the ECB, the Governing Council and the Executive Board, and, as a third decision-making body, the General Council. The ECB has its own legal personality under Article 282(3) of the Treaty.
268ECBConvergence ReportJune 2014
It ensures that the tasks conferred upon the Eurosystem and the ESCB are implemented either through its own activities or through those of the NCBs, pursuant to the Statute of the ESCB.
European Commission: the EU institution which ensures the application of the provisions of the Treaty. The Commission develops EU policies, drafts proposals for new EU laws and makes sure that EU decisions are properly implemented. In the area of economic policy, the Commission proposes Integrated Guidelines for Growth and Jobs, containing the Broad Economic Policy Guidelines and the Employment Guidelines, and reports to the Council of the European Union (EU Council) on economic developments and policies. It also monitors public finances and economic policies within the framework of multilateral surveillance and submits reports on this to the EU Council.
European Council: the EU institution which brings together the Heads of State or Government of the EU Member States, the President of the European Commission and the European Council’s own President (see also Council of the European Union) to provide the EU with the necessary impetus for its development and to define the general political directions and priorities thereof. It does not have a legislative function.
European Monetary Institute (EMI): a temporary institution established on 1 January 1994 at the start of Stage Two of Economic and Monetary Union. It went into liquidation following the establishment of the European Central Bank on 1 June 1998.
European Parliament: an institution of the EU comprising 751 directly elected representatives of the citizens of the EU Member States. Parliament plays a role in the EU’s legislative process, although with differing prerogatives depending on the various procedures used for enacting different EU laws. In matters related to monetary policy and the European System of Central Banks, Parliament has mainly consultative powers. However, the Treaty establishes certain procedures with respect to the democratic accountability of the European Central Bank (ECB) to Parliament (e.g. presentation of the ECB’s Annual Report, including a general debate on monetary policy, and regular testimonies before Parliament’s Committee on Economic and Monetary Affairs).
European System of Accounts 1995 (ESA 95): a comprehensive and integrated system of macroeconomic accounts based on a set of internationally agreed statistical concepts, definitions, classifications and accounting rules aimed at achieving a harmonised quantitative description of the economies of the EU Member States. The ESA 95 is the EU’s version of the world System of National Accounts 1993 (SNA 93).
European System of Central Banks (ESCB): composed of the European Central Bank (ECB) and the national central banks (NCBs) of all 28 EU Member States, i.e. it includes, in addition to the members of the Eurosystem, the NCBs of those EU Member States whose currency is not the euro. The ESCB is governed by the Governing Council and the Executive Board of the ECB, and, as a third decision-making body of the ECB, by the General Council.
European Systemic Risk Board (ESRB): an independent EU body responsible for the macro-prudential oversight of the financial system within the EU. It contributes to the prevention or mitigation of systemic risks to financial stability that arise from developments within the financial system, taking into account macroeconomic developments, so as to avoid periods of widespread financial distress.
269ECB
Convergence ReportJune 2014
GLOSSARY
Eurostat: the Statistical Office of the EU. It is part of the European Commission and responsible for the production of EU statistics.
Eurosystem: the central banking system of the euro area. It comprises the European Central Bank and the national central banks of the EU Member States whose currency is the euro.
Excessive deficit procedure: the provisions set out in Article 126 of the Treaty and specified in the Protocol (No 12) on the excessive deficit procedure require EU Member States to maintain budgetary discipline, define the criteria for a budgetary position to be considered an excessive deficit and regulate steps to be taken following the observation that the requirements for the budgetary balance or government debt have not been fulfilled. Council Regulation (EC) No 1467/97 of 7 July 1997 on speeding up and clarifying the implementation of the excessive deficit procedure is also an element of the Stability and Growth Pact.
Executive Board of the ECB: one of the decision-making bodies of the European Central Bank (ECB). It comprises the President and the Vice-President of the ECB and four other members appointed by the European Council, acting by a qualified majority among the Heads of State or Government of the euro area member countries, on a recommendation from the Council of the European Union, after it has consulted the European Parliament and the ECB.
Exchange rate volatility: a measure of the variability of exchange rates, usually calculated on the basis of the annualised standard deviation of daily percentage changes.
Fiscal compact: a part (Title III) of the Treaty on Stability, Coordination and Governance in the Economic and Monetary Union stipulates that the budgetary position of the general government of signatory Member States shall be balanced or in surplus.
Funded and unfunded pension schemes: funded pension schemes are schemes that finance pension payments by drawing down on segregated and earmarked assets. These schemes can be exactly funded, under-funded or over-funded, depending on the size of the accumulated assets in relation to the pension entitlements. Unfunded pension schemes are schemes that finance current pension payments with the ongoing contributions paid by future pensioners and/or other ongoing revenue, such as taxes or transfers; unfunded schemes may hold sizeable assets (e.g. for liquidity reasons or as buffer funds).
General Council of the ECB: one of the decision-making bodies of the European Central Bank (ECB). It comprises the President and the Vice-President of the ECB and the governors of all the national central banks of the European System of Central Banks.
General government: a sector defined in the European System of Accounts 1995 as comprising resident entities that are engaged primarily in the production of non-market goods and services intended for individual and collective consumption and/or in the redistribution of national income and wealth. Included are central, regional and local government authorities, as well as social security funds. Excluded are government-owned entities that conduct commercial operations, such as public enterprises.
Governing Council of the ECB: the supreme decision-making body of the European Central Bank (ECB). It comprises all the members of the Executive Board of the ECB and the governors of the national central banks of the EU Member States whose currency is the euro.
270ECBConvergence ReportJune 2014
Gross external debt: the outstanding amount of an economy’s financial liabilities that require payments of principal and/or interest at some point in the future to the rest of the world.
Harmonised Index of Consumer Prices (HICP): a measure of the development of consumer prices that is compiled by Eurostat and harmonised for all EU Member States.
Harmonised long-term interest rates: Article 4 of the Protocol (No 13) on the convergence criteria referred to in Article 140 of the Treaty requires interest rate convergence to be measured by means of interest rates on long-term government bonds or comparable securities, taking into account differences in national definitions. In order to fulfil the Treaty requirement, the European Central Bank has carried out conceptual work on the harmonisation of long-term interest rate statistics and regularly collects data from the national central banks, in cooperation with and on behalf of Eurostat. Harmonised data are used for the convergence examination in this report.
Interest-growth differential: the difference between the annual change in nominal GDP and the nominal average interest rate paid on outstanding government debt (the “effective” interest rate). The interest-growth differential is one of the determinants of changes in the government debt ratio.
International investment position (i.i.p.): the value and composition of an economy’s outstanding financial claims on and financial liabilities to the rest of the world. The net i.i.p. is also referred to as the net external or foreign asset position.
Intervention at the limits: compulsory intervention by central banks if their currencies reach the floor or the ceiling of their ERM II fluctuation margins.
Intra-marginal intervention: intervention by a central bank to influence the exchange rate of its currency within its ERM II fluctuation margins.
Investment: gross fixed capital formation as defined in the European System of Accounts 1995.
Legal convergence: the process of adaptation by EU Member States of their legislation, in order to make it compatible with the Treaties and the Statute for the purposes of: i) integrating their NCBs into the European System of Central Banks, and ii) adopting the euro and making their NCBs an integral part of the Eurosystem.
Macroeconomic imbalance procedure (MIP): a procedure aimed at broadening the surveillance of economic policies of the EU Member States to include a detailed and formal framework to prevent and correct excessive imbalances and to help the EU Member States affected to establish corrective action plans before divergences become entrenched. The MIP is based on Article 121(6) of the Treaty. The first step of this surveillance procedure of the EU is the Alert Mechanism Report. The MIP has a preventive and a corrective arm. The latter is made operational by the excessive imbalance procedure.
Measures with a temporary effect: all non-cyclical effects on fiscal variables which: i) reduce (or increase) the general government deficit or gross debt (see also debt ratio and deficit ratio) in a specified period only (“one-off” effects), or ii) improve (or worsen) the budgetary situation in a specified period at the expense (or to the benefit) of future budgetary situations (“self-reversing” effects).
271ECB
Convergence ReportJune 2014
GLOSSARY
National central bank (NCB): a central bank of an EU Member State.
Net capital expenditure: comprises a government’s final capital expenditure (i.e. gross fixed capital formation, plus net purchases of land and intangible assets, plus changes in stocks) and net capital transfers paid (i.e. investment grants, plus unrequited transfers paid by the general government sector to finance specific items of gross fixed capital formation by other sectors, minus capital taxes and other capital transfers received by the general government sector).
Non-cyclical factors: influences on a government budget balance that are not due to cyclical fluctuations (see the cyclical component of the budget balance). They can therefore result from either structural, i.e. permanent, changes in budgetary policies or from measures with a temporary effect.
Output gap: the difference between the actual and potential levels of output of an economy as a percentage of potential output. Potential output is calculated on the basis of the trend rate of growth of the economy. A positive output gap means that actual output is above the trend or potential level of output and suggests the possible emergence of inflationary pressures. A negative output gap signifies that actual output is below the trend or potential level of output and indicates the possible absence of inflationary pressures.
Primary balance: the general government sector’s net borrowing or net lending excluding interest payments on consolidated government liabilities.
Private sector debt: outstanding amounts at the end of the year of securities issued and loans taken out by non-financial corporations and households (including non-profit institutions serving households). The private sector debt-to-GDP ratio is defined as the ratio of private sector debt to GDP at current market prices.
Private sector credit flow: annual transactions on debt securities issued and loans taken out by non-financial corporations and households (including non-profit institutions serving households). The private sector credit flow-to-GDP ratio is defined as the ratio of private sector credit flow to GDP at current market prices.
Realignment: a change in the central rate of a currency participating in ERM II.
Reference period: the time interval specified in Article 140 of the Treaty and in the Protocol (No 13) on the convergence criteria for examining progress towards convergence.
Reference value: the Protocol (No 12) on the excessive deficit procedure sets explicit reference values for the deficit ratio (3% of GDP) and the debt ratio (60% of GDP), while the Protocol (No 13) on the convergence criteria referred to in Article 140 of the Treaty specifies the methodology for calculating the reference values for the examination of price and long-term interest rate convergence.
Single Supervisory Mechanism (SSM): a mechanism composed of the ECB and national competent authorities of participating EU countries for the exercise of the prudential supervisory tasks conferred upon the ECB (in line with Article 127(6) of the Treaty on the Functioning of the European Union) by the SSM Regulation, which entered into force on 3 November 2013. The main aims of the SSM will be to ensure the safety and soundness of credit institutions and the stability

272ECBConvergence ReportJune 2014
of the financial system within the EU and within each Member State. The ECB will be responsible for the effective and consistent functioning of the SSM, which forms part of the banking union, and will assume its full supervisory tasks on 4 November 2014, i.e. 12 months after the Regulation entered into force. All euro area countries participate automatically in the SSM, and other EU countries may participate by entering into close cooperation under the SSM Regulation.
Six pack: five regulations and one directive that entered into force on 13 December 2011 that strengthened the Stability and Growth Pact. The four fiscally-related legislative acts aim at the strengthening of budgetary surveillance and coordination of economic policies, speeding up and clarifying the implementation of the excessive deficit, the effective enforcement of budgetary surveillance in the euro area and the requirements for the fiscal framework of the Member States. The two macro-related legislative acts aim at the prevention and correction of macroeconomic imbalances and on the enforcement action to correct excessive macroeconomic imbalances in the euro area.
Stability and Growth Pact: intended to serve as a means of safeguarding sound government finances in the EU Member States in order to strengthen the conditions for price stability and for strong, sustainable growth conducive to employment creation. The Stability and Growth Pact has two arms – a preventive arm and a corrective arm. The preventive arm prescribes that Member States specify medium-term budgetary objectives, while the corrective arm contains concrete specifications on the excessive deficit procedure.
Statute: refers to the Protocol (No 4) on the Statute of the European System of Central Banks and of the European Central Bank, annexed to the Treaties.
Treaties: unless otherwise stated, all references in this report to the “Treaties” refer to both the Treaty on European Union and the Treaty on the Functioning of the European Union.
Treaty: unless otherwise stated, all references in this report to the “Treaty” refer to the Treaty on the Functioning of the European Union, and the references to article numbers reflect the numbering in effect since 1 December 2009.
Treaty of Lisbon (Lisbon Treaty): amended the EU’s two core treaties, the Treaty on European Union and the Treaty establishing the European Community, and renamed the latter as Treaty on the Functioning of the European Union. The Treaty of Lisbon was signed in Lisbon on 13 December 2007 and entered into force on 1 December 2009.
Treaty on Stability, Coordination and Governance in the Economic and Monetary Union: an intergovernmental treaty, which was signed in Brussels on 2 March 2012 and entered into force on 1 January 2013. It contains a “fiscal compact”, which complements and, in some areas, enhances key provisions of the Stability and Growth Pact. Among other things, it requires the Member States that have ratified this Treaty to enshrine in national law a balanced budget and increases the role of independent fiscal monitoring bodies.
Two-pack: two regulations on common provisions for monitoring and assessing draft budgetary plans and ensuring the correction of excessive deficit of the Member States in the euro area (Regulation (EU) No 473/2013), and on the strengthening of economic and budgetary surveillance of Member States in the euro area experiencing or threatened with serious difficulties with respect to their financial stability (Regulation (EU) 472/2013).