Embed Size (px)
Citation preview
1
Convergence or divergence from Comparative Advantage
A Comparison of China and the European Union
Bushra Riaz1
Abstract:
We examine the comparative advantage convergence and divergence pattern between China
and the European Union (EU) over the last two decades for a variety of sectors. Using seven
measures of revealed comparative advantage for China and the EU we assess their validity in
order to understand how China's rapid growth has changed its pattern of trade as well as that
of the EU. Applying OLS Galtonian, Quantile and Robust regressions we check the
convergence or divergence pattern. We find that China is gaining a lot by its comparative
advantage in high technology sectors as well and there was a rapid change in its traditional
comparative advantage. Furthermore, China is diverging towards high tech sectors. In
contrast, there is no convergence or divergence in the trade specialization pattern of the EU
and remains more or less stable.
Key words: Comparative advantage, Convergence
JEL Classification: F1, F10
1 Introduction
China's rapid growth and rise as the world's largest supplier of goods is one of the most
notable changes to the global economy in the last three decades. There is a 500 percent
increase in China´s real exports over the last 2 decades. As a consequence, in 2013, China
became the world’s leading exporter of goods. In 2014, China export goods valued at total of
2,342,3 billion USD in the year. This essay decomposes the current pattern of its comparative
advantage in comparison with the EU. China established its trade relations with European
Union (EU) in 1975 and is currently the EU's top supplier of goods and its third largest export
market (Deutsche bank research, 2014). Although China is a single fast growing developing
country while the EU is a highly developed region that includes 28 individual countries, China
has the largest gain in world market share. It is a country that is relatively scarce in capital,
skill and land but still gaining significantly from its exports and comparative advantage. The
main aim of this study is to compare the EU and China in terms of their revealed comparative
advantage in order to get a clear picture of trade specialization and their tendencies towards
1 Bushra Riaz, PhD student , I am thankful to my supervisors Dr Elisenda Paluzie and Dr Kristian Estevez
for their useful guidance Universitat de Barcelona, Avinguda Diagonal 690, Barcelona, Spain 08034;
[email protected] I would also like to thank Jonathan Colmer from LSE for his valuable comments
2
their current comparative advantage. The motivation behind this study is to understand and
to evaluate how China's world market share is rapidly increasing and how it is affecting the
EU's export market and its current comparative advantage in different sectors. Most recently
China has also shown a comparative advantage in capital intensive sector such as office
machines and tele-communications versus its main trading partners. This technological
upgrading has led to highly internationalized and competitive industries (including the
electrical machinery domain) being capable to sell their exports to the developed economies.
In this paper, we shall investigate the evolution of trade flows between China's international
trade partners, which has grown steadily since the utilization of the opening-up policy, both
exports and imports rising greatly. China relies heavily on export-led increase; in particular,
there has been a shift from resource-and labour-intensive to capital- and technology-intensive
exports. We shall try to answer the following questions: Are China and the EU converging
towards a more homogeneous international trade pattern? Is the EU losing its existing
comparative advantage? To analyse the changes in comparative advantage, we will compare
and analyse various indices of revealed comparative advantage for both regions. Moreover,
we will apply beta convergence method to look at EU and China's convergence and
divergence pattern.
As China becomes the world's largest export country, one would expect that EU will
lose grounds in their traditional sectors and that it will converge to the revealed comparative
advantage neutral point i.e. no revealed comparative advantage/disadvantage. It has been
claimed that developed countries like the EU should be more despecialized relative to
developing countries like China. This is an argument made by De Benedicits et al. (2009) who
made an empirical analysis for 39 different countries over a period of 17 years and showed
that on average, countries diversify and do not specialize. In our case, more diversification
means that the EU loses its comparative advantage in a few sectors after a long experience of
comparative advantage in traditional sectors, but it improves its trade position in other sectors
like Pharmaceuticals, chemicals and automotive sectors. Some authors use the term
despecialization instead of diversification (e.g. Worz (2005) and Ferto and Soos (2008)). In
order to check for convergence or divergence, we use Galtonian regressions to compare the
changes in the past and current comparative advantage. Hinloopen and Marrewijk (2004) and
Sanidas and Shin (2011) also use Galtonian regression for comparative advantage analysis.
Since China is still the developing country in relation to the EU, we can ask whether
China is trying to imitate the EU in terms of the goods it exports? The idea developed in this
paper clarifies that what matters for China's long term sustainability is not only the volume
of exports and its relation to its GDP, but its long term hold in its real comparative advantage,
as the productivity level is much higher as compared to other similar countries. It is for this
reason that China's trade is regarded as challenging advanced countries (Rodrik, 2006). Schott
(2008) also views China as special in its level of sophistication in exports.
In this essay we use various indices and choose the best among them, i.e. normalised
revealed comparative advantage index, which is used in the most recent research papers like
Yu et.al. (2009) and Sandias and Shin (2011). The previous literature has revealed that this
rigorous comparison has not been considered so far. Still, there are some similar studies about
3
EU-China trade2 and China's exports enhancement and comparative advantage in labour and
capital intensive goods3. Therefore, this study makes an effort to fill this gap in the literature
by focusing on convergence and divergence pattern of comparative advantage. We will check
and compare China and the EU's comparative advantage patterns more recently and how and
where (in which sectors) they are similar or dissimilar with each other.
Debate on China's export market share in the EU and other developed and developing
countries has been rising in the recent decade. Some economists believe that the end of
manufacturing has come in developed countries like those of the EU while others think this
will only hold for low and middle-income countries (Schott, 2008). Therefore, this study is
timely to check the structure of comparative advantage of China in comparison with the EU,
and the magnitude with which these two economies compete with each other in the world
export market for labour-intensive and capital-intensive goods. We use WTO trade data
covering 11 different sectors in order to create various indices of RCA and analyse some
quantitative methods, using Galtonian regressions, to make a comparative evaluation of
China and the EU in terms of their trade patterns and export performance from 1990-2013
and 2000-2013 for China and EU, respectively.
The theory of comparative advantage is old but still relevant to compare a country's
factor endowment structures and their trade patterns. However, the analytical approaches that
measure the comparative advantage of countries over other countries engaged in the
production and sale of commodities have changed, expanded and improved over time. The
Ricardian theory finds that trade takes place where countries face differences in labour
productivity while the Heckscher-Ohlin (H-O) theory is about the differences in factor
endowments and intensities. In the new trade theory, the intra industry trade takes into
account two main assumptions of imperfect competition and increasing returns to scale. As
Krugman (1979) developed “a simple general equilibrium model of non-comparative
advantage trade”, nevertheless he used that term in its traditional sense, which can be taken
as a broader notion of comparative advantage (Sanidas, 2011). This notion can be found in
the existing literature as 'internal returns to scale as a source of comparative
advantage'(Tybout, 1993) and also as a 'Product differentiation as a source of comparative
advantage' (Hummels and Levinsohn, 1993). Palley (2008) has also considered these
conceptual differences.
The passage from comprehensive trade theories to measuring comparative advantage
has always been difficult. The major breakthrough was made by Balassa's (1965) Revealed
Comparative Advantage Index (BRCAI), which is still the most widely used index to analyse
trade performance, although it has been criticised for its ordinal ranking and non-
comparability across countries or sectors. Therefore, like Sanidas and Shin (2011), I calculated
alternative indices to overcome the shortcomings of the Balassa Index. Similar to Ballance et
al. (1987), Seyoum (2007) and Yeats (1985), Sanidas and Shin (2011) have systematically
compared alternative indices and formulated a strategy to accurately use various indices which
2 Liang and Xu (2004), Schott (2008), Y Li (2008), Zhuang and Koo (2008), Harrigan and Deng (2008), Berger and Martin (2013), Xudong (2013), Fu and
Mu (2014), G.W. Ren (2014). 3 Li et.al. (2006), Freytag (2008), Li (2009), He and Mu (2012),
4
will be applied in this paper as to make an analysis of comparative advantage between China
and the EU.
The remainder of this paper is structured as follows: Section 2 provides a theoretical
background of revealed comparative advantage and explains the various indices of revealed
comparative advantage. Section 3 gives a brief review of the studies that have made
comparisons of China and the EU. Section 4 provides information about nature and sources
of data. Section 5 explains the methodology of our analysis. Major findings of the regression
techniques are provided in Section 6. Section 7 concludes and discusses about future
extensions.
2 Revealed Comparative advantage
The concept of comparative advantage is one of the few concepts in economics that is more
than common sense. The beauty of this theory is that it illustrates how even a country having
no absolute cost advantage in any sector can benefit from trade by specializing in industries
at which it is 'least bad' (Lin and Chang, 2009).
Even having a strong theoretical concept of comparative advantage, problems arise
when this concept is analysed empirically. Empirical researchers have been looking for
measuring comparative advantage by using existing post-trade volume data, exports and
imports, and is known as revealed comparative advantage. Balassa (1965) proposed an index
which has been widely used to determine the revealed comparative advantage of a country's
exports to the rest of the world or a reference country. The Balassa index suffers, though,
from a weak theoretical foundation and empirical distribution. Due to its inconsistency and
poor ordinal ranking property, numerous attempts have been made to overcome the
deficiencies of the Balassa index; The Lafay index (1992), the symmetric revealed comparative
advantage index (1998), the weighted revealed comparative advantage index (1998), the
additive revealed comparative advantage index (2006) and the normalized revealed
comparative advantage index (2009).
Changes in comparative advantage should reflect changes in factor endowment.
Changes in comparative advantage can also be brought about in cases where the state played
a key role in determining the social and economic conditions. Admitting that the RCA is not
a perfect measure, as it fails to distinguish between a region's factor endowment and changes
in trade policy, economists still believe that the RCA measure are still acceptable as the impact
of changes in trade policies can be seen from movement of the RCA index. (Bender and Li,
2002)
In theory, comparative advantage depends on pre-trade relative prices of commodities
which are unobservable in the real world. Analysts only have access to post-trade data.
Although Liesner (1958) was the first to utilize an index of revealed comparative advantage,
the most frequently used measure in this respect is the Balassa Index, after the refinement
and popularization by Balassa (1965, 1989). It is broadly applied to establish a country's
5
efficient sectors and to explore the competency of the strong sectors of the economy.
Therefore, the Revealed Comparative Advantage is measured by the relative value of a
product in total exports of a country divided by the product's relative value in total exports
of the world.
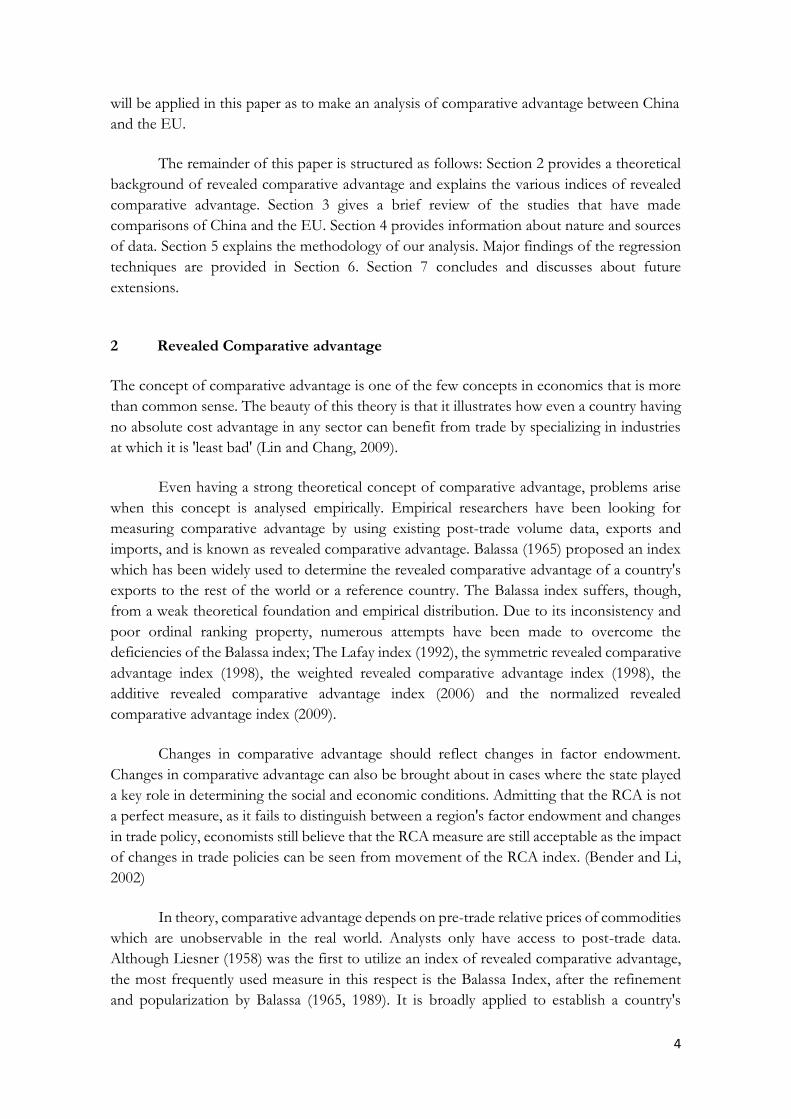
In order to estimate revealed comparative advantage using indicators derived from
real post-trade observations (see for example Kojima 1970; Yamazawa 19704; and a number
of studies have employed the theory of comparative advantage. Given a group of reference
countries the Balassa Index measures normalized export shares, where the normalization is
with respect to the export share in the same industry in the group of reference countries,
which can be written as:
𝐵𝑅𝐶𝐴𝐼𝑐,𝑗 =
𝑋𝑐𝑗
𝑋𝑐𝑡𝑋𝑤𝑗
𝑋𝑤𝑡
(1)
here BRCAIcj is the Balassa revealed comparative advantage index for country c (China or
EU) in sector j, Xcj is the exports of country c in sector j, and Xct is the total exports of country
c (China or EU), Xwj is the total world exports in sector j and Xwt is the total world exports.
If the BRCAI takes a value greater than 1, it indicates that the country has a
comparative advantage in that sector. In contrast, if the index is less than one then it indicates
that the country has a comparative disadvantage in that sector. Michael Porter (1990) defined
Balassa Index above 1, in some cases strengthened to a Balassa Index exceeding 2, to identify
a country's strong sectors. Some other empirical examples which make use of the Balassa
index are Ariovich (1979), Reza (1983), Yeats (1985), Peterson (1988), Crafts (1989), and
Amiti (1999) and Fertö, Imre& Hubbard, L. J. (2003)5.
2.1 Proposed Alternative indices for Revealed Comparative Advantage
Due to some shortcomings like the variable mean of the Balassa index, some alternative
methods were proposed to control the original index around a stable mean which have some
symmetric distributions. Some authors took the logarithm value, whiles other computed the
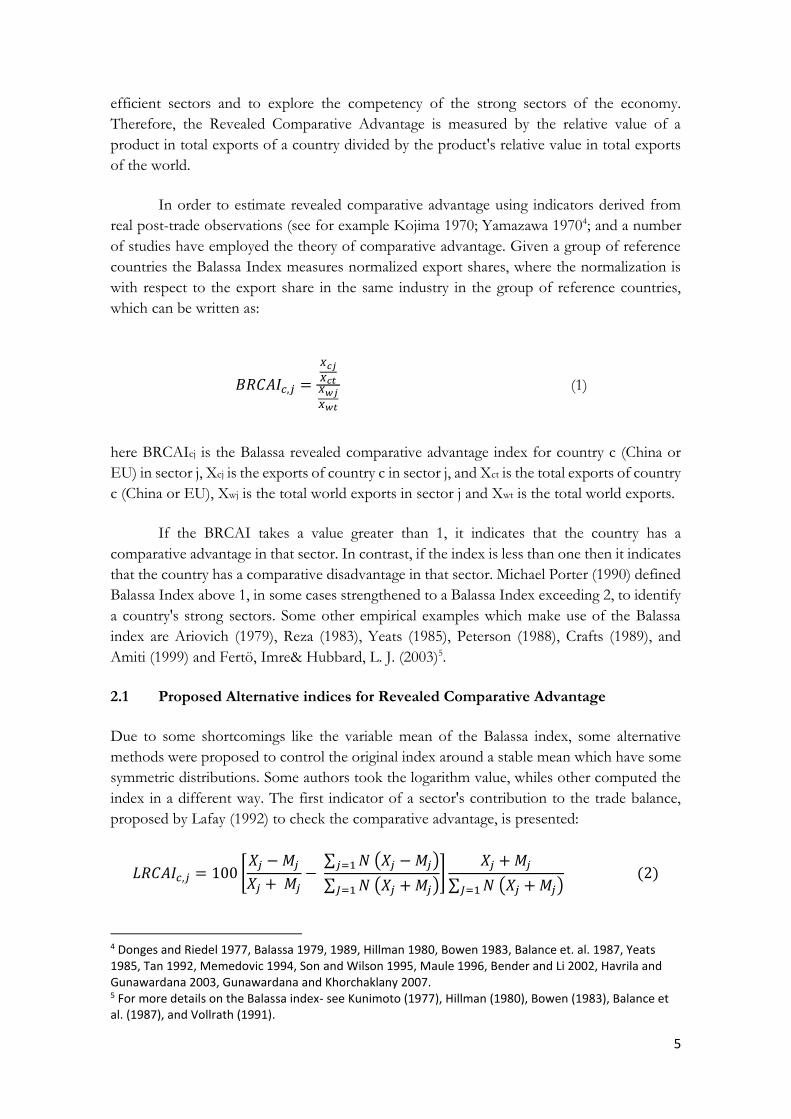
index in a different way. The first indicator of a sector's contribution to the trade balance,
proposed by Lafay (1992) to check the comparative advantage, is presented:
𝐿𝑅𝐶𝐴𝐼𝑐,𝑗 = 100 [𝑋𝑗 − 𝑀𝑗
𝑋𝑗 + 𝑀𝑗−
∑ 𝑁 (𝑋𝑗 − 𝑀𝑗)𝑗=1
∑ 𝑁 (𝑋𝑗 + 𝑀𝑗)𝐽=1
]𝑋𝑗 + 𝑀𝑗
∑ 𝑁 (𝑋𝑗 + 𝑀𝑗)𝐽=1
(2)
4 Donges and Riedel 1977, Balassa 1979, 1989, Hillman 1980, Bowen 1983, Balance et. al. 1987, Yeats 1985, Tan 1992, Memedovic 1994, Son and Wilson 1995, Maule 1996, Bender and Li 2002, Havrila and Gunawardana 2003, Gunawardana and Khorchaklany 2007. 5 For more details on the Balassa index- see Kunimoto (1977), Hillman (1980), Bowen (1983), Balance et al. (1987), and Vollrath (1991).
6
where again c represents the country and j the sector. X and M are exports and imports
towards and from the rest of the world, respectively N is the total number of sectors.
According to the Lafay index, positive values indicate the existence of comparative advantage
in a specific sector; higher values point to a higher degree of specialisation. On the contrary,
negative values indicate comparative disadvantage.
Fagerberg (1995) proposed the symmetry revealed comparative advantage index
(SRCAI) by using a small number to modify the BRCAI.
𝑆𝑅𝐶𝐴𝐼𝑐,𝑗 =𝑅𝐶𝐴𝑐𝑗 − 1
𝑅𝐶𝐴𝑐𝑗 + 1 (3)
This is an estimation of a log transformation of the Balassa revealed comparative advantage
index (Benedictis and Tamberi 2001) which ranges from -1 to +1 where 0 appears when a
country is at comparative advantage neutral point.
Proudman and Redding (1998) calculated the sectoral average share of a country with
world exports taking as denominator, which is known as weighted revealed comparative
advantage index (WRCAI).
WRCAIc,j =BRCAIcj
1N ∑ BIcj
NJ=1
(4)
where N is the number of sectors or commodities. This does not correct the uneven
distribution of the BRCAI index and is still not suitable for dynamic analysis. Furthermore,
this transformation makes the comparative advantage neutral point sensitive to the
classification of sectors (Benedictis and Tamberi 2001).
Hoen and Oosterhaven (2006) proposed an additive form of Balassa revealed
comparative advantage index, indicating the problem in the multiplicative form of BRCAI
and suggested a formula to overcome the previous problem, which is Additive revealed
comparative advantage or Additive index (AI).
𝐴𝑅𝐶𝐴𝐼𝐶,𝐽 = 𝑋𝑐𝑗
𝑋𝑐−
𝑋𝑤𝑗
𝑋𝑤 (5)
In this index, the values fall between -1 and +1 and zero stands as the comparative advantage
neutral point. This index has many advantages in cross-sector analysis but not in the case of
cross country comparison. Moreover, there is no stable cardinal value for a country where it
has no specialization in a sector or not fully specialised in that sector, which should technically
be at the lower and upper bounds of the index, respectively.
7
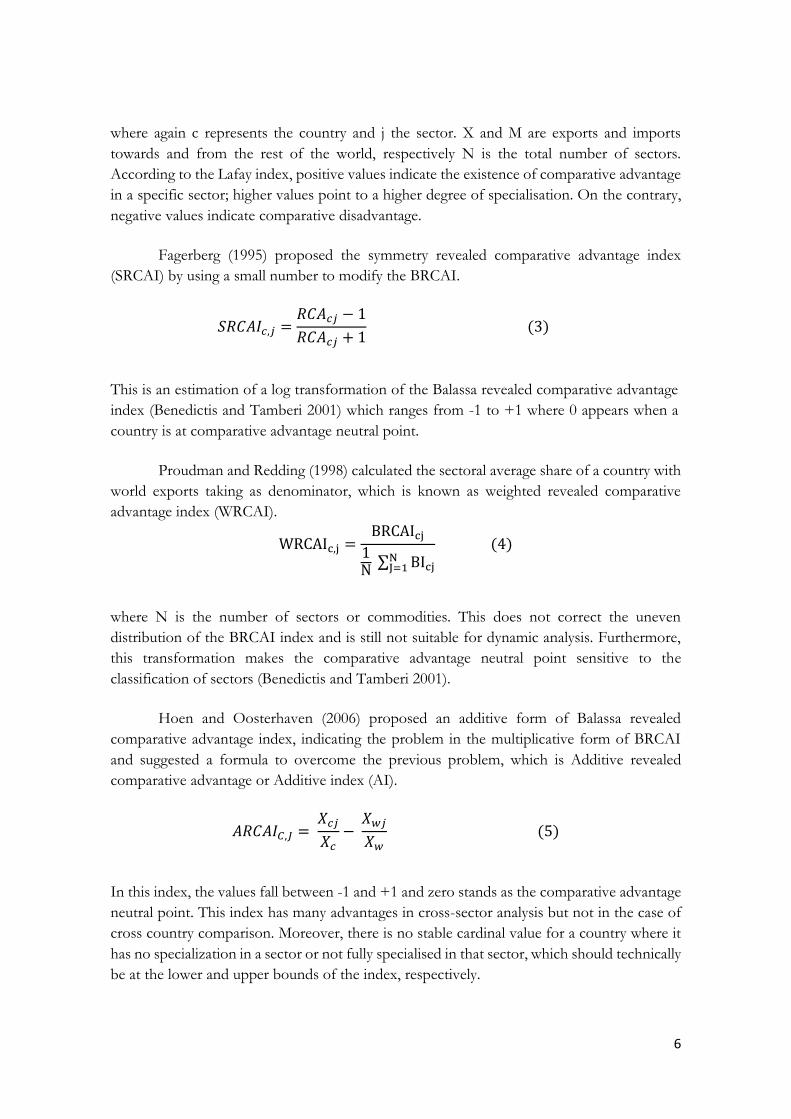
With regard to the instability of additive index (AI), Yu et al. (2009) developed a similar index
and normalised the term with total world exports. That is;
𝑁𝑅𝐶𝐴𝐼𝑐,𝑗 = ∆𝑋𝑐,𝑗
𝑋𝑤=
𝑋𝑐,𝑗
𝑋𝑤 −
𝑋𝑐𝑋𝑤,𝑗
𝑋𝑤𝑋𝑤 (6)
The above index ranges from -0.25 to 0.25, zero being the comparative advantage neutral
point. The NRCAI is symmetrical and also follows a normal distribution. Though the above
indices overcome the shortcomings of Balassa revealed comparative advantage index however
only the NRCAI gives the correct results, hence we will use the NRCAI in our further analysis.
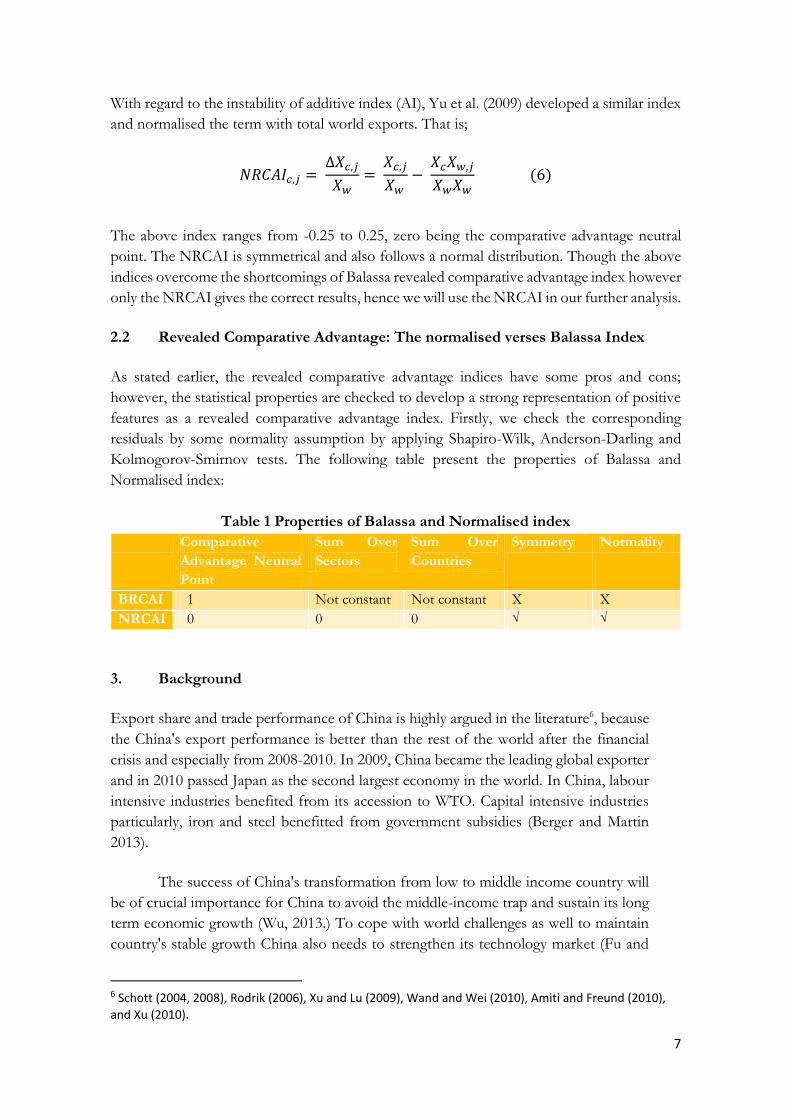
2.2 Revealed Comparative Advantage: The normalised verses Balassa Index
As stated earlier, the revealed comparative advantage indices have some pros and cons;
however, the statistical properties are checked to develop a strong representation of positive
features as a revealed comparative advantage index. Firstly, we check the corresponding
residuals by some normality assumption by applying Shapiro-Wilk, Anderson-Darling and
Kolmogorov-Smirnov tests. The following table present the properties of Balassa and
Normalised index:
Table 1 Properties of Balassa and Normalised index
Comparative
Advantage Neutral
Point
Sum Over
Sectors
Sum Over
Countries
Symmetry Normality
BRCAI 1 Not constant Not constant X X
NRCAI 0 0 0 √ √
3. Background
Export share and trade performance of China is highly argued in the literature6, because
the China's export performance is better than the rest of the world after the financial
crisis and especially from 2008-2010. In 2009, China became the leading global exporter
and in 2010 passed Japan as the second largest economy in the world. In China, labour
intensive industries benefited from its accession to WTO. Capital intensive industries
particularly, iron and steel benefitted from government subsidies (Berger and Martin
2013).
The success of China's transformation from low to middle income country will
be of crucial importance for China to avoid the middle-income trap and sustain its long
term economic growth (Wu, 2013.) To cope with world challenges as well to maintain
country's stable growth China also needs to strengthen its technology market (Fu and
6 Schott (2004, 2008), Rodrik (2006), Xu and Lu (2009), Wand and Wei (2010), Amiti and Freund (2010),
and Xu (2010).
8
MU, 2014). The country is being forced towards a more skill intensive and technology
intensive growth path, with the amount of surplus unskilled labour in China falling. They
further argued that China should continue to increase its investment in R&D and in
education.
The main concern in this essay is to check where China compete with highly
developed zone i.e. EU and where do EU stands, as the developed economies like EU
compete with China by raising the quality of their exports (Schott, 2008). Emerging countries
have been endearing huge market shares over the last twenty years and China stands out with
the most astonishing performance: it has almost tripled its market share since 1995 (Zignago,
2014). After 1999, the imports of China have substituted imports from other emerging
countries (Freytag, 2008), and recently China became the world's biggest merchandise trader
in 2013, with total exports and imports of US$ 4,159 billion and a trade surplus of US$ 259
billion, 2.8 per cent of its GDP. However, most EU countries faced declines in their
merchandise exports in 2012 due to structural glitches in the euro zone. (WTO, trade statistics
2013)
China is popular as a labour abundant country but gaining a lot of competition from
its medium and high technology goods as well. High technology products play a vital role
while comparing international competition among different economies. This theory was
pioneered by Leamer (1987) who defined that what countries export does matter. This idea
was further developed by Hausmann et al. (2007) who explained income level of a country's
exports as another determinant of economic growth. (Zignago, 2014). The economic relations
between China and the EU grew close and both gained benefits from the stable relations
(Huaqun, 2004). However, the EU has lost -0.27 p.p. of market share in high technology
goods, whiles, China has gained massively in high technology market (18.9 p.p.), due to a huge
transfer of the assembly of these goods to China.
Hinloopen and Marrewijk (2004) analyzed the dynamics of revealed comparative
advantage for Hong Kong, Taiwan and China. They also used Galtonian regression in their
analysis and concluded that Hong Kong and Taiwan are more specialized in their exports as
compared to China. Lall and Albaladejo (2004), argue that Chinese exports has upgraded in
the technological content from 1990 to 2000, and due to its increasing share in high-tech
good’s exports it is moving rapidly towards high technology goods. Batra and Khan (2005)
made an attempt to check the pattern of revealed comparative advantage of China and India.
They further checked the trade similarities and differences of these two economies by
calculating at the sector and commodity level of the Harmonised System of classification. The
results showed that India and China both enjoy comparative advantage in labour and resource
intensive goods in the world market.
Harrigan and Deng (2008) made an argument about China's local comparative
advantage which is influenced by labour intensive commodities and by geography as well.
They concluded that China has Comparative advantage in heavy goods but only in nearby
markets and for distant markets it has comparative advantage in lighter goods. Amiti and
Freund (2008) analyse that between 1992 and 2005 the export growth of China showed a
9
transition from low tech goods (agricultural products) into medium tech good (machinery and
transport equipment). This shift is mainly associated with increasing skill which is driven by
processing exports making up a large share in exports of manufacturing sector. According to
Dettmer et.al. (2009), China is specialising in technology intensive goods and focuses on
mobile type technology goods while EU's comparative advantage sustains in immobile
technology intensive goods. Tuan et.al (2016) argue that after China’s trade openness (1978-
1988) most of its exports growth occurred in the extensive margin (new variety products),
whereas, after 1989 it switched towards the intensive margin (existing variety products). They
find significant evidence and confirmed that from 1978 to 2008 the intensive margin is the
vital factor in the growth of China’s exports.
Additionally, in order to compare the comparative advantage convergence and
divergence pattern between China and the EU, our analysis will be deepened by applying the
Galtonian regression and the error correction techniques in eight different sectors.
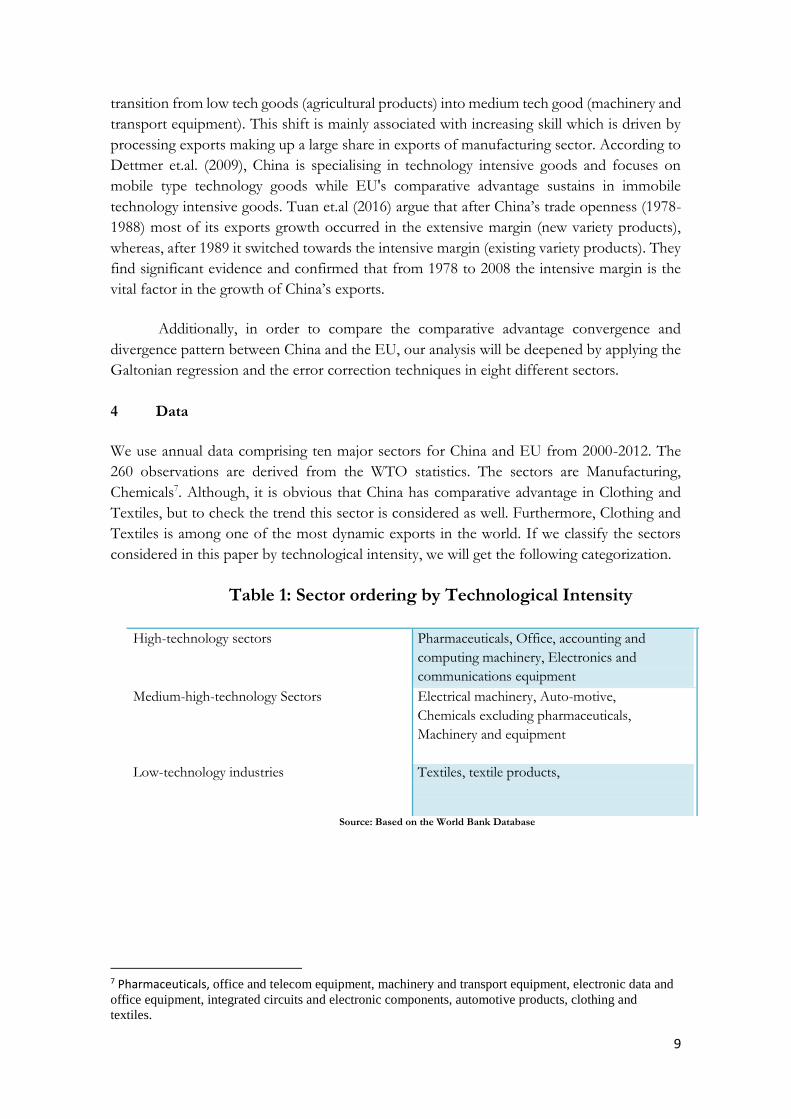
4 Data
We use annual data comprising ten major sectors for China and EU from 2000-2012. The
260 observations are derived from the WTO statistics. The sectors are Manufacturing,
Chemicals7. Although, it is obvious that China has comparative advantage in Clothing and
Textiles, but to check the trend this sector is considered as well. Furthermore, Clothing and
Textiles is among one of the most dynamic exports in the world. If we classify the sectors
considered in this paper by technological intensity, we will get the following categorization.
Table 1: Sector ordering by Technological Intensity
High-technology sectors Pharmaceuticals, Office, accounting and
computing machinery, Electronics and
communications equipment
Medium-high-technology Sectors Electrical machinery, Auto-motive,
Chemicals excluding pharmaceuticals,
Machinery and equipment
Low-technology industries Textiles, textile products,
Source: Based on the World Bank Database
7 Pharmaceuticals, office and telecom equipment, machinery and transport equipment, electronic data and
office equipment, integrated circuits and electronic components, automotive products, clothing and
textiles.
10
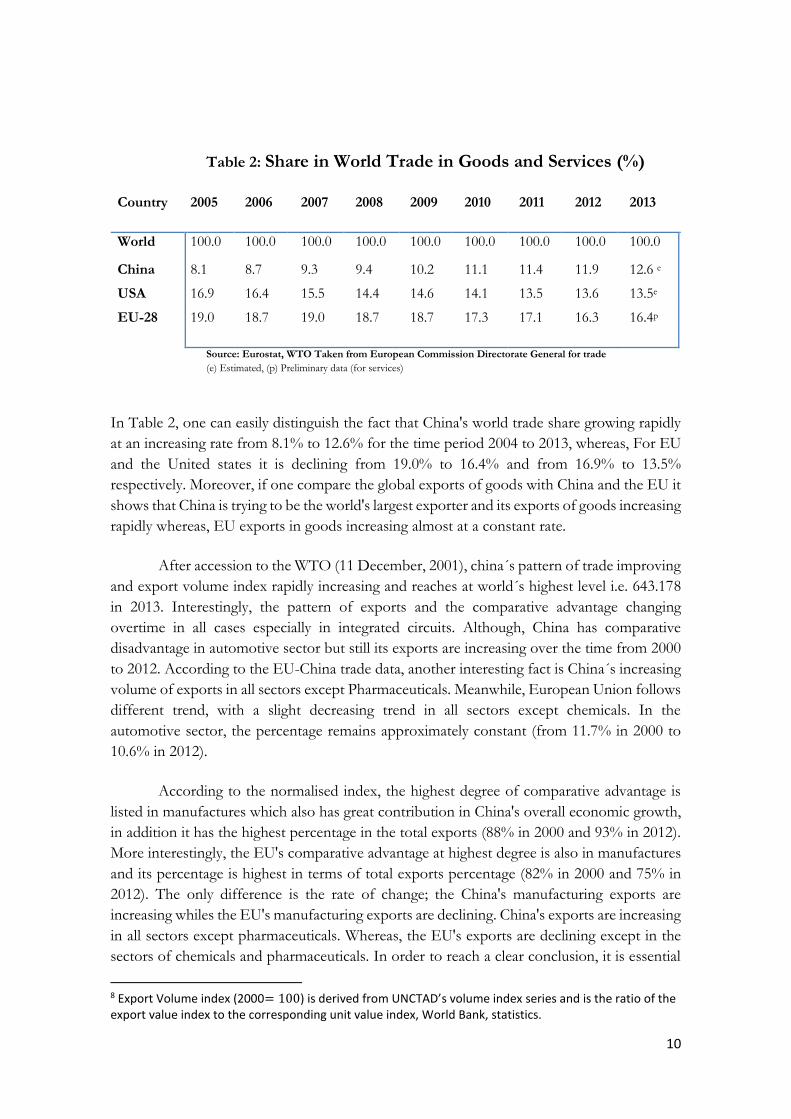
Table 2: Share in World Trade in Goods and Services (%)
Country 2005 2006 2007 2008 2009 2010 2011 2012 2013
World 100.0 100.0 100.0 100.0 100.0 100.0 100.0 100.0 100.0
China 8.1 8.7 9.3 9.4 10.2 11.1 11.4 11.9 12.6 e
USA 16.9 16.4 15.5 14.4 14.6 14.1 13.5 13.6 13.5e
EU-28 19.0 18.7 19.0 18.7 18.7 17.3 17.1 16.3 16.4p
Source: Eurostat, WTO Taken from European Commission Directorate General for trade (e) Estimated, (p) Preliminary data (for services)
In Table 2, one can easily distinguish the fact that China's world trade share growing rapidly
at an increasing rate from 8.1% to 12.6% for the time period 2004 to 2013, whereas, For EU
and the United states it is declining from 19.0% to 16.4% and from 16.9% to 13.5%
respectively. Moreover, if one compare the global exports of goods with China and the EU it
shows that China is trying to be the world's largest exporter and its exports of goods increasing
rapidly whereas, EU exports in goods increasing almost at a constant rate.
After accession to the WTO (11 December, 2001), china´s pattern of trade improving
and export volume index rapidly increasing and reaches at world´s highest level i.e. 643.178
in 2013. Interestingly, the pattern of exports and the comparative advantage changing
overtime in all cases especially in integrated circuits. Although, China has comparative
disadvantage in automotive sector but still its exports are increasing over the time from 2000
to 2012. According to the EU-China trade data, another interesting fact is China´s increasing
volume of exports in all sectors except Pharmaceuticals. Meanwhile, European Union follows
different trend, with a slight decreasing trend in all sectors except chemicals. In the
automotive sector, the percentage remains approximately constant (from 11.7% in 2000 to
10.6% in 2012).
According to the normalised index, the highest degree of comparative advantage is
listed in manufactures which also has great contribution in China's overall economic growth,
in addition it has the highest percentage in the total exports (88% in 2000 and 93% in 2012).
More interestingly, the EU's comparative advantage at highest degree is also in manufactures
and its percentage is highest in terms of total exports percentage (82% in 2000 and 75% in
2012). The only difference is the rate of change; the China's manufacturing exports are
increasing whiles the EU's manufacturing exports are declining. China's exports are increasing
in all sectors except pharmaceuticals. Whereas, the EU's exports are declining except in the
sectors of chemicals and pharmaceuticals. In order to reach a clear conclusion, it is essential
8 Export Volume index (2000= 100) is derived from UNCTAD’s volume index series and is the ratio of the export value index to the corresponding unit value index, World Bank, statistics.
11
to make a clear comparison of comparative advantage between China and EU on each type
of sectors. In order to show the comparison, we will discuss the results of normalized revealed
comparative advantage index only9.
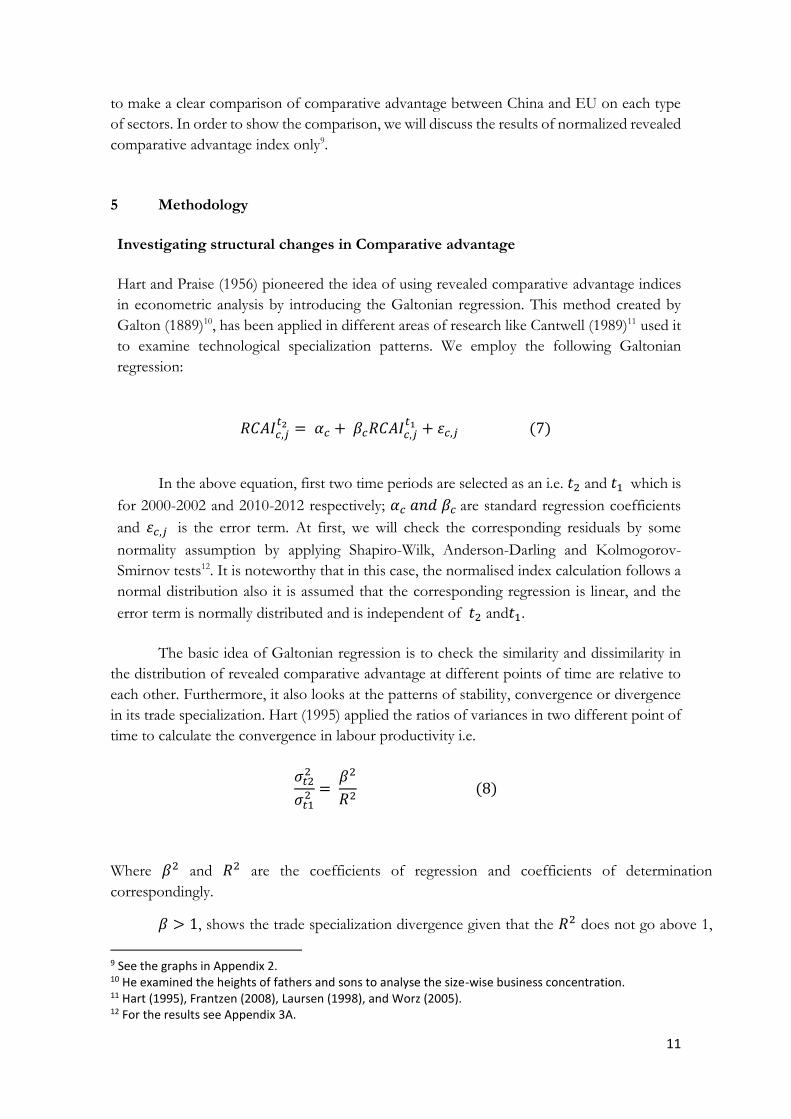
5 Methodology
Investigating structural changes in Comparative advantage
Hart and Praise (1956) pioneered the idea of using revealed comparative advantage indices
in econometric analysis by introducing the Galtonian regression. This method created by
Galton (1889)10, has been applied in different areas of research like Cantwell (1989)11 used it
to examine technological specialization patterns. We employ the following Galtonian
regression:
𝑅𝐶𝐴𝐼𝑐,𝑗𝑡2 = 𝛼𝑐 + 𝛽𝑐𝑅𝐶𝐴𝐼𝑐,𝑗
𝑡1 + 𝜀𝑐,𝑗 (7)
In the above equation, first two time periods are selected as an i.e. 𝑡2 and 𝑡1 which is
for 2000-2002 and 2010-2012 respectively; 𝛼𝑐 𝑎𝑛𝑑 𝛽𝑐 are standard regression coefficients
and 𝜀𝑐,𝑗 is the error term. At first, we will check the corresponding residuals by some
normality assumption by applying Shapiro-Wilk, Anderson-Darling and Kolmogorov-
Smirnov tests12. It is noteworthy that in this case, the normalised index calculation follows a
normal distribution also it is assumed that the corresponding regression is linear, and the
error term is normally distributed and is independent of 𝑡2 and𝑡1.
The basic idea of Galtonian regression is to check the similarity and dissimilarity in
the distribution of revealed comparative advantage at different points of time are relative to
each other. Furthermore, it also looks at the patterns of stability, convergence or divergence
in its trade specialization. Hart (1995) applied the ratios of variances in two different point of
time to calculate the convergence in labour productivity i.e.
𝜎𝑡22
𝜎𝑡12 =
𝛽2
𝑅2 (8)
Where 𝛽2 and 𝑅2 are the coefficients of regression and coefficients of determination
correspondingly.
𝛽 > 1, shows the trade specialization divergence given that the 𝑅2 does not go above 1,
9 See the graphs in Appendix 2. 10 He examined the heights of fathers and sons to analyse the size-wise business concentration. 11 Hart (1995), Frantzen (2008), Laursen (1998), and Worz (2005). 12 For the results see Appendix 3A.
12
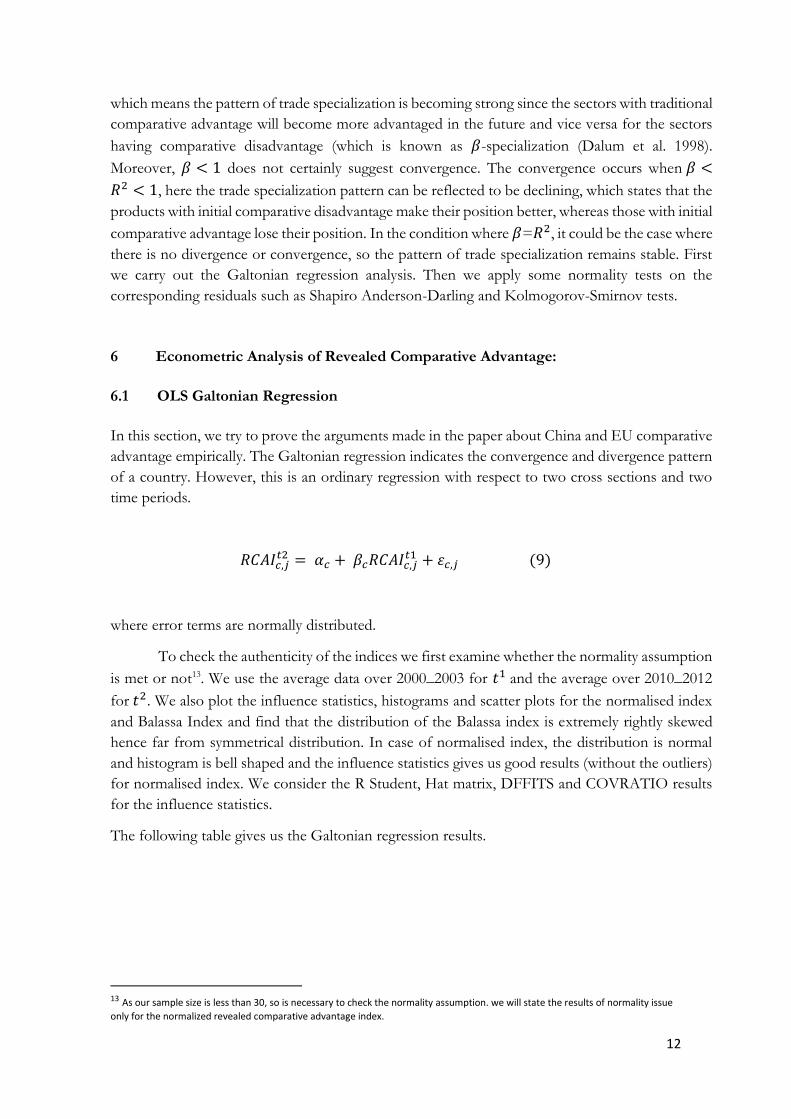
which means the pattern of trade specialization is becoming strong since the sectors with traditional
comparative advantage will become more advantaged in the future and vice versa for the sectors
having comparative disadvantage (which is known as 𝛽-specialization (Dalum et al. 1998).
Moreover, 𝛽 < 1 does not certainly suggest convergence. The convergence occurs when 𝛽 <
𝑅2 < 1, here the trade specialization pattern can be reflected to be declining, which states that the
products with initial comparative disadvantage make their position better, whereas those with initial
comparative advantage lose their position. In the condition where 𝛽=𝑅2, it could be the case where
there is no divergence or convergence, so the pattern of trade specialization remains stable. First
we carry out the Galtonian regression analysis. Then we apply some normality tests on the
corresponding residuals such as Shapiro Anderson-Darling and Kolmogorov-Smirnov tests.
6 Econometric Analysis of Revealed Comparative Advantage:
6.1 OLS Galtonian Regression
In this section, we try to prove the arguments made in the paper about China and EU comparative
advantage empirically. The Galtonian regression indicates the convergence and divergence pattern
of a country. However, this is an ordinary regression with respect to two cross sections and two
time periods.
𝑅𝐶𝐴𝐼𝑐,𝑗𝑡2 = 𝛼𝑐 + 𝛽𝑐𝑅𝐶𝐴𝐼𝑐,𝑗
𝑡1 + 𝜀𝑐,𝑗 (9)
where error terms are normally distributed.
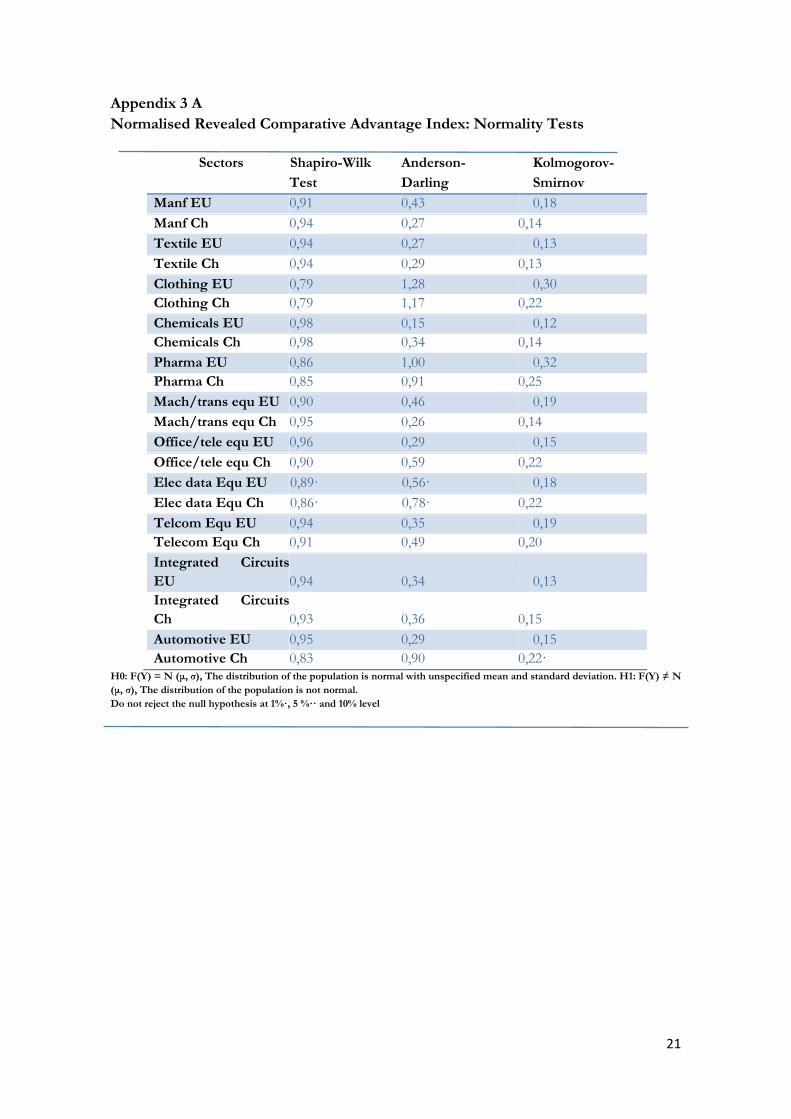
To check the authenticity of the indices we first examine whether the normality assumption
is met or not13. We use the average data over 2000_2003 for 𝑡1 and the average over 2010_2012
for 𝑡2. We also plot the influence statistics, histograms and scatter plots for the normalised index
and Balassa Index and find that the distribution of the Balassa index is extremely rightly skewed
hence far from symmetrical distribution. In case of normalised index, the distribution is normal
and histogram is bell shaped and the influence statistics gives us good results (without the outliers)
for normalised index. We consider the R Student, Hat matrix, DFFITS and COVRATIO results
for the influence statistics.
The following table gives us the Galtonian regression results.
13 As our sample size is less than 30, so is necessary to check the normality assumption. we will state the results of normality issue
only for the normalized revealed comparative advantage index.
13
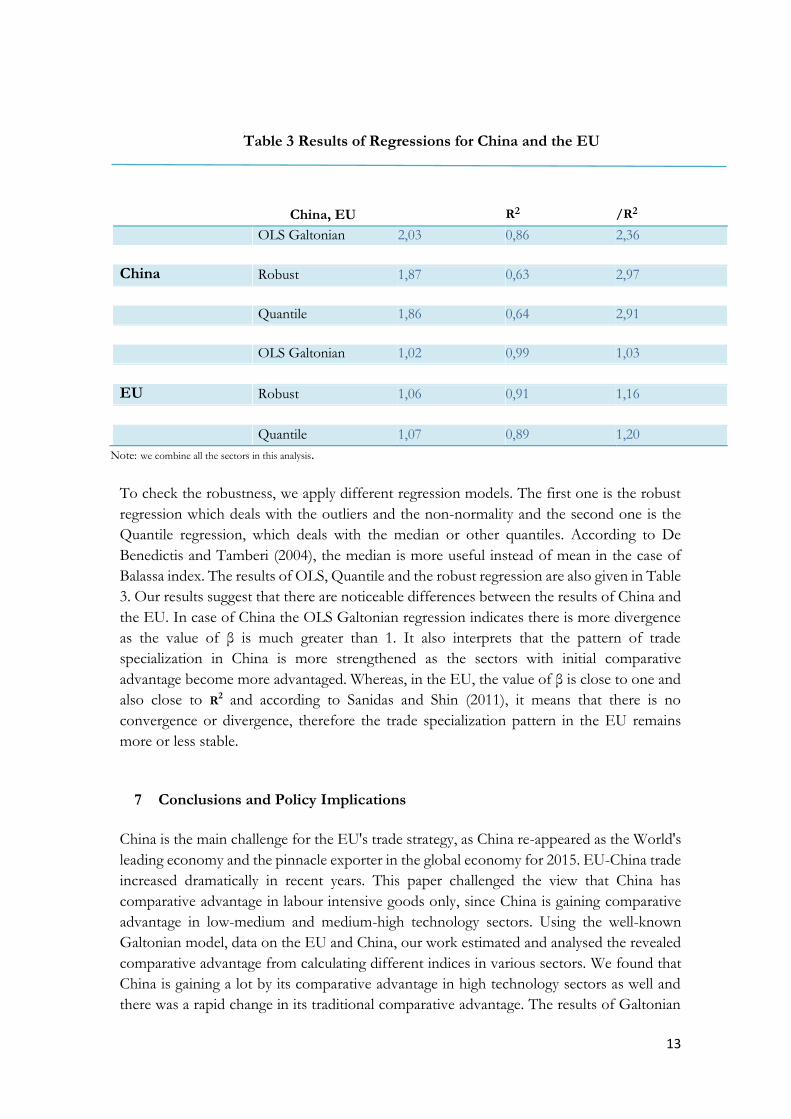
Table 3 Results of Regressions for China and the EU
China, EU R2 /R2
OLS Galtonian 2,03 0,86 2,36
China Robust 1,87 0,63 2,97
Quantile 1,86 0,64 2,91
OLS Galtonian 1,02 0,99 1,03
EU Robust 1,06 0,91 1,16
Quantile 1,07 0,89 1,20
Note: we combine all the sectors in this analysis.
To check the robustness, we apply different regression models. The first one is the robust
regression which deals with the outliers and the non-normality and the second one is the
Quantile regression, which deals with the median or other quantiles. According to De
Benedictis and Tamberi (2004), the median is more useful instead of mean in the case of
Balassa index. The results of OLS, Quantile and the robust regression are also given in Table
3. Our results suggest that there are noticeable differences between the results of China and
the EU. In case of China the OLS Galtonian regression indicates there is more divergence
as the value of β is much greater than 1. It also interprets that the pattern of trade
specialization in China is more strengthened as the sectors with initial comparative
advantage become more advantaged. Whereas, in the EU, the value of β is close to one and
also close to R2 and according to Sanidas and Shin (2011), it means that there is no
convergence or divergence, therefore the trade specialization pattern in the EU remains
more or less stable.
7 Conclusions and Policy Implications
China is the main challenge for the EU's trade strategy, as China re-appeared as the World's
leading economy and the pinnacle exporter in the global economy for 2015. EU-China trade
increased dramatically in recent years. This paper challenged the view that China has
comparative advantage in labour intensive goods only, since China is gaining comparative
advantage in low-medium and medium-high technology sectors. Using the well-known
Galtonian model, data on the EU and China, our work estimated and analysed the revealed
comparative advantage from calculating different indices in various sectors. We found that
China is gaining a lot by its comparative advantage in high technology sectors as well and
there was a rapid change in its traditional comparative advantage. The results of Galtonian
14
regression reveal that China is diverging towards high tech sectors or diverging from its
traditional comparative advantage whereas, there is no convergence or divergence in the
trade specialization pattern of the EU and remains more or less stable.
The current essay documented the extent to which EU is exposed to China in terms
of their Comparative advantage and trade competitiveness. According to our findings EU and
China overlap in some sectors like manufacturing, machinery and transports equipment. We
found that China is not only gaining comparative advantage in labour intensive sectors but
also in capital intensive sectors. Moreover, China is gaining more from its comparative
advantage in terms of its strong sectors which is revealed from higher values of Balassa Index
and positive values for other indices like in case of textiles, clothing, Office and telecom
equipment (O&T), machinery and transport equipment (M&T), electronic data processing
and office equipment (EDP & OE), Telecommunications equipment (T). Furthermore, the
EU has comparative advantage in high-tech goods like pharmaceuticals, chemicals and
automotive products (AP) but not in telecommunications and integrated circuits products,
which are also from high-tech goods.
The comparative advantage indices presented in this paper were based on actual
export data. Hence the results show that the EU seems to be losing its comparative advantage.
There are some measures that can be taken by the EU to overcome the problem highlighted
in the paper above. The following are some recommendations for EU: Though China has
comparative advantage in labour intensive and medium to high-tech sectors and EU cannot
compete China in cost efficiency, because at first, China has more cheap labour as well as
cheap factors of production, secondly there is huge labour force which is available in China
not in the EU, thirdly wages are not very high in China as compared to the wages in the EU.
So the only solution to compete with China in terms of these sectors is that;
As, it is a famous saying, "never put your all eggs in one basket", the EU should invest
equally in different developing countries like India, Pakistan Brazil etc., not only in china, so
in the future they will not be solely dependent on China's products.
1. Policy to protect EU's clothing and textile industry;
Though China has comparative advantage in clothing and textile industry because of cheap
factors of production and cost deficiency but still EU has comparative advantage in the field
of fashion and designs. Fashion launched in EU because sense of fashion and design is still
with EU. China make copy of that new more fashioned product which was initiated by EU
and send it on cheaper amount, so EU should work on patent laws and copyrights rules to
restrict China from making copies of their products, this will bound china to make copies and
it will give more protection to EU's own industry and EU can still survive with comparative
advantage in clothing and textile industry.
This paper has focused on the exports and goods of China and the EU, using different
tools to check their respective comparative advantages. Further research related to digital
trade comparison between China and EU would be very useful in this research scenario.
15
References
Amiti, M., 1999. Specialization patterns in Europe. Weltwirtschaftliches Archiv, 135(4), pp.573-593.
Amiti, M. and Freund, C., 2010. The anatomy of China's export growth. In China's growing role in world
trade (pp. 35-56). University of Chicago Press.
Ariovich, G., 1979. The comparative advantage of South Africa as revealed by export shares. South African
Journal of Economics, 47(2), pp.123-129.
Balassa, B. 1965. Trade Liberalisation and “Revealed” Comparative Advantage. The Manchester School, 33: pp.
99–123.
Balassa, B. 1979. The Changing Pattern of Comparative Advantage in Manufactured Goods. Review of
Economics and Statistics, 61, pp. 259-226.
Balassa, B. 1989. Comparative Advantage, Trade Policy and Economic Development. New York: Harvester
Wheatsheaf
Ballance, R.H., Forstner, H., & Murray, T. 1987. Consistency tests of alternative measures of comparative
advantage. The Review of Economics and Statistics, pp. 157-161.
Baldwin, R. and Harrigan, J., 2011. Zeros, quality, and space: Trade theory and trade evidence. American
Economic Journal: Microeconomics, 3(2), pp.60-88.
Batra, A. and Khan, Z., 2005. Revealed comparative advantage: An analysis for India and China. Indian Council
for Research on International Economic Relations, 168, pp.1-85.
Bender, S. and Li, K.W., 2002. The changing trade and revealed comparative advantages of Asian and Latin
American manufacture exports. Yale Economic Growth Center Discussion Paper, (843).
Berger, B. and Martin, R.F., 2013. The Chinese export boom: an examination of the detailed trade data. China
& World Economy, 21(1), pp.64-90.
Bowen, H.P. 1983. On the theoretical interpretation of indices of trade intensity and revealed comparative
advantage. Review of World Economics, 119(3), pp. 464-472.
Cantwell, J., 1989. Technological innovation and multinational corporations. Cambridge, MA: B. Blackwell.
Crafts, N.F., 1989. Revealed comparative advantage in manufacturing, 1899-1950. Journal of European
Economic History, 18(1), p.127.
Dalum, B., Laursen, K. and Villumsen, G. 1998. Structural change in OECD export specialisation patterns: de-
specialisation and 'stickiness'. International Review of Applied Economics, 12, pp. 423-443.
De Benedictis, L., Gallegati, M. and Tamberi, M., 2009. Overall trade specialization and economic development:
countries diversify. Review of World Economics, 145(1), pp.37-55.
De Benedictis, L. and Tamberi, M., 2001. A note on the Balassa index of revealed comparative
advantage. Available at SSRN 289602.
Dettmer, B., Erixon, F., Freytag, A. and Legault-Tremblay, P.O., 2009. The Dynamics of Structural Change–
The European Unions Trade with China. Jena economic research papers, 2009, p.053.
16
Donges, J.B. and Riedel, J., 1977. The expansion of manufactured exports in developing countries: An empirical
assessment of s upply and demand issues. Weltwirtschaftliches Archiv, 113(1), pp.58-87.
Fagerberg, J., 1988. International competitiveness. The economic journal,98(391), pp.355-374.
Fertö, I. and Hubbard, L. J. 2003. Revealed Comparative Advantage and Competitiveness in Hungarian Agri–
Food Sectors. World Economy, 26: pp. 247–259.
Fertő, I. and Soós, K.A., 2008. Trade specialization in the European Union and in post-communist European
countries. Eastern European Economics,46(3), pp.5-28.
Frantzen, D., 2008. "Technology, competitiveness and specialisation in OECD manufacturing", Journal of
Economic Studies, Vol. 35 (1) pp.44 – 68.
Freytag, A., 2008. That Chinese Juggernaut: Should Europe Really Worry about Its Trade Deficit with
China. ECIPE Policy Briefs, 2, p.2008.
Galton, F. 1889. Natural inheritance, London Macmillan.
Gunawardana, P.J. and Khorchurklang, S., 2007. An Analysis of Comparative Advantage and Competitiveness
in Dairy Products: Australia and Other Selected Countries. Journal of International Business Strategy, 7(1).
Harrigan, J. and Deng, H., 2010. China's local comparative advantage. In China's growing role in world trade (pp.
109-133). University of Chicago Press.
Hart, P.E., 1995. The convergence of labour productivity in British and German industries. International Journal
of the Economics of Business, 2(3), pp.453-463.
Hart, P. E. and Prais, S.J. 1956. The analysis of business concentration: a statistical approach. Journal of the
Royal Statistical Society. Series A (General), 119, pp. 150-191.
Havrila, I. and Gunawardana, P., 2003. Analysing comparative advantage and competitiveness: an application to
Australia's textile and clothing industries. Australian Economic Papers, 42(1), pp.103-117.
He, X. and Mu, Q., 2012. How Chinese firms learn technology from transnational corporations: A comparison
of the telecommunication and automobile industries. Journal of Asian Economics, 23(3), pp.270-287.
Hillman, A. L. 1980. Observations on the Relation between Revealed Comparative Advantage' and Comparative
Advantage as Indicated by Pre-Trade Relative Prices. Weltwirtschaftliches Archiv, 116, pp. 315-321.
Hinloopen, J. and Van Marrewijk, C., 2004. Dynamics of Chinese comparative advantage.
Hoen, A.R. and Oosterhaven, J., 2006. On the measurement of comparative advantage. The Annals of Regional
Science, 40(3), pp.677-691.
Hummels, D. and Levinsohn, J., 1993. Product differentiation as a source of comparative advantage?. The
American Economic Review, 83(2), pp.445-449.
Kojima, K., 1970. Structure of comparative advantage in industrial countries: a verification of the factor-
proportions theorem. Hitotsubashi Journal of Economics, 11(1), pp.1-29.
Krugman, P.R., 1979. Increasing returns, monopolistic competition, and international trade. Journal of
international Economics, 9(4), pp.469-479.
Kunimoto, K., 1977. Typology of trade intensity indices. Hitotsubashi Journal of Economics, 17(2), pp.15-32.
17
Lafay, G. 1992. The Measurement of Revealed Comparative Advantage. In M. G. Dagenais and P. A. Muet
(eds), International Trade Modelling, London, Chapman & Hall.
Laursen, K., 1998. Revealed comparative advantage and the alternatives as measures of international
specialisation (No. 98-30). DRUID, Copenhagen Business School, Department of Industrial Economics and
Strategy/Aalborg University, Department of Business Studies.
Li, Y., 2008. Trade interdependence, comparative advantage and FDI between China and EU. International
Journal of Trade and Global Markets,1(3), pp.223-238.
Li, Y., Zhao, Y. and Liu, Y., 2006. The relationship between HRM, technology innovation and performance in
China. International journal of manpower,27(7), pp.679-697.
Liang, Z. and Xu, L., 2004. Regional specialization and dynamic pattern of comparative advantage: evidence
from china's industries 1988–2001. Review of Urban & Regional Development Studies, 16(3), pp.231-244.
Liesner, H.H., 1958. The European common market and British industry. The Economic Journal, 68(270),
pp.302-316.
Lin, J. and Chang, H.J., 2009. Should Industrial Policy in developing countries conform to comparative
advantage or defy it? A debate between Justin Lin and Ha‐Joon Chang. Development policy review, 27(5),
pp.483-502.
Maule, A., 1996. Some implications of AFTA for Thailand: a revealed comparative advantage approach. ASEAN
Economic Bulletin, pp.14-38.
Memedovic, O. 1994. On the Theory and Measurement of Comparative Advantage: An Empirical Analysis of
Yugoslav Trade in Manufactures with the OECD Countries. North Holland, Amsterdam
Palley, T.I., 2008. Institutionalism and new trade theory: rethinking comparative advantage and trade
policy. Journal of Economic Issues, 42(1), pp.195-208.
Peterson, J., 1988. Export shares and revealed comparative advantage. A study of international travel. Applied
Economics, 20(3), pp.351-365.
Porter, M.E., 1990. The competitive advantage of notions. Harvard business review, 68(2), pp.73-93.
Proudman, J. and Redding, S. eds., 1998. Openness and growth. Bank of England.
Proudman, J. and Redding, S., 2000. Evolving patterns of international trade. Review of international
economics, 8(3), pp.373-396.
Reza, S., 1983. Revealed comparative advantage in the South Asian manufacturing sector: some estimates. Indian
Economic Journal, 31(2), pp.96-106.
Rodrik, D., 2006. What's so special about China's exports? China & World Economy, 14(5), pp.1-19.
Sanidas, E. and Shin, Y., 2011. Convergence towards the revealed comparative advantage neutral point for East
Asia: similarities and differences between the three countries.
Schott, P.K., 2004. Across-product versus within-product specialization in international trade. The Quarterly
Journal of Economics, pp.647-678.
Schott, P.K., 2008. The relative sophistication of Chinese exports. Economic policy, 23(53), pp.6-49.
Seyoum, B., 2007. Revealed comparative advantage and competitiveness in services: A study with special
emphasis on developing countries. Journal of Economic Studies, 34(5), pp.376-388.
18
Son, I., & Wilson, K. G. 1995. Australia-Korea Trade: Recent Structure and Future Prospects. Economic Papers,
14(2), pp. 83-96.
Tan, Lin Yeok. 1992. A Heckscher-Ohlin Approach to Changing Comparative Advantage in Singapore's
Manufacturing Sector. Weltwirtschaftliches Archiv, 128, pp. 288- 309.
Tuan, F., Somwaru, A., Wang, S.L. and Tsakiridou, E., 2016. The Dynamics of China's Export Growth: An
Intertemporal Analysis. South-Eastern Europe Journal of Economics, 14(1), pp.37-57.
Tybout, J.R., 1993. Internal returns to scale as a source of comparative advantage: the evidence. The American
Economic Review, 83(2), pp.440-444.
Vollrath, T.L., 1991. A theoretical evaluation of alternative trade intensity measures of revealed comparative
advantage. Weltwirtschaftliches Archiv, 127(2), pp.265-280.
Wang, Z. and Wei, S.J., 2010. What accounts for the rising sophistication of China's exports? In China's Growing
Role in World Trade (pp. 63-104). University of Chicago Press.
Wörz, J., 2005. Dynamics of trade specialization in developed and less developed countries. Emerging Markets
Finance and Trade, 41(3), pp.92-111.
Xu, B., 2010. The sophistication of exports: Is China special?. China Economic Review, 21(3), pp.482-493.
Xu, B. and Lu, J., 2007. The Impact of Foreign Firms on the Sophistication of Chinese Exports. working paper,
China Europe International Business School and Tsinghua University.
Yamazawa, I., 1970. Intensity analysis of world trade flow. Hitotsubashi Journal of Economics, 10(2), pp.61-90.
Yeats, A. J. 1985. On the Appropriate Interpretation of the Revealed Comparative Advantage Index:
Implications of a Methodology Based on Industry Sector Analysis. Weltwirtschaftliches Archiv, 111, pp. 61-73
Yu, R., Cai, J. and Leung, P., 2009. The normalized revealed comparative advantage index. The Annals of
Regional Science, 43(1), pp.267-282.
Zhuang, R. and Koo, W.W., 2008. Implications of US Free Trade Agreement with South Korea. Journal of
Economic Development, 33(1), pp.27-44.
Appendix 1
China:
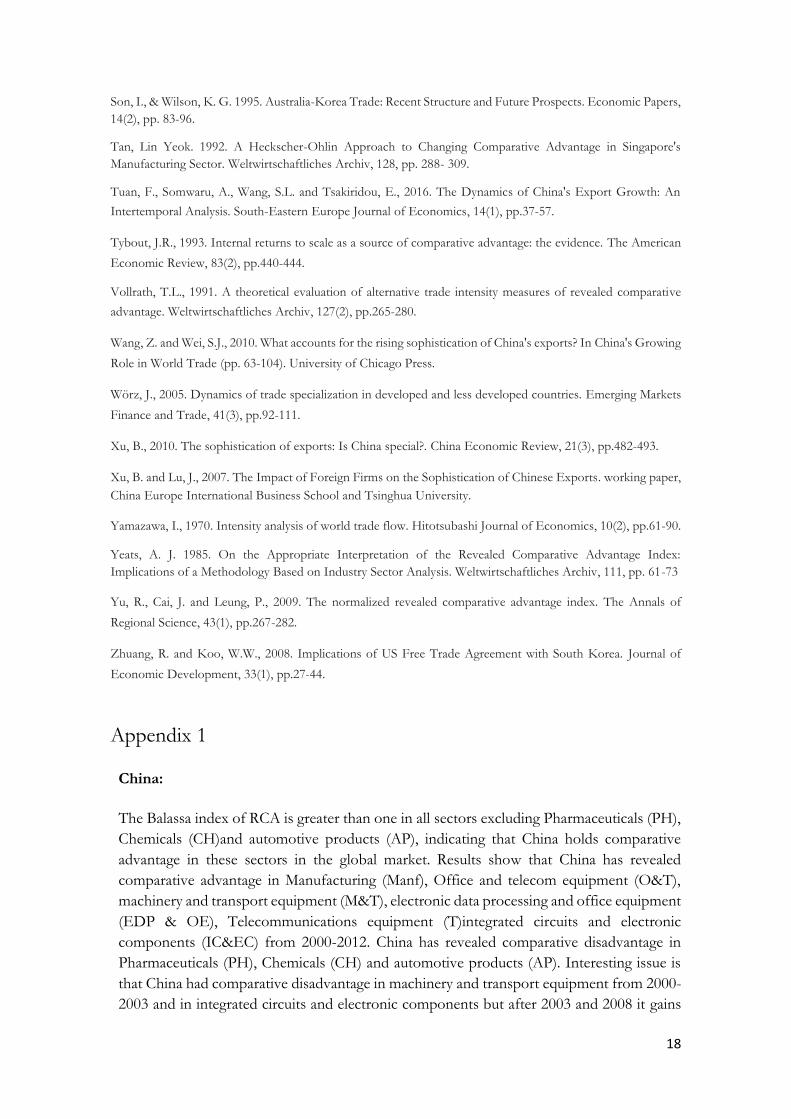
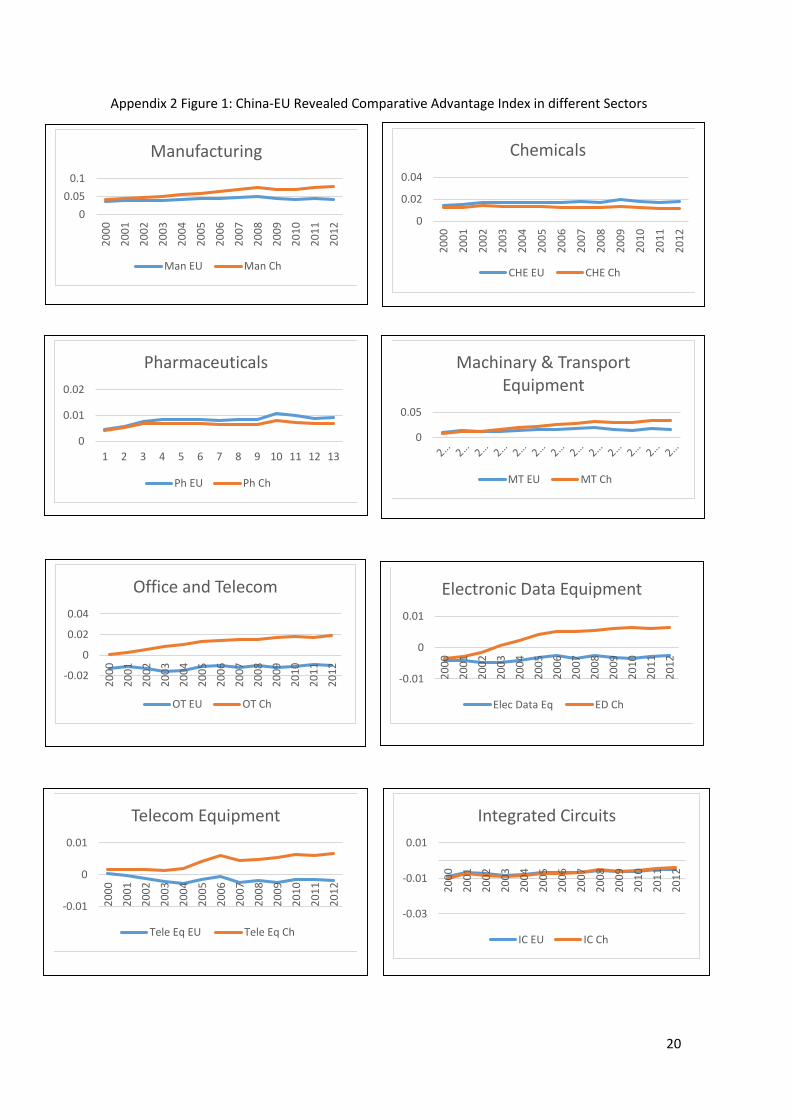
The Balassa index of RCA is greater than one in all sectors excluding Pharmaceuticals (PH),
Chemicals (CH)and automotive products (AP), indicating that China holds comparative
advantage in these sectors in the global market. Results show that China has revealed
comparative advantage in Manufacturing (Manf), Office and telecom equipment (O&T),
machinery and transport equipment (M&T), electronic data processing and office equipment
(EDP & OE), Telecommunications equipment (T)integrated circuits and electronic
components (IC&EC) from 2000-2012. China has revealed comparative disadvantage in
Pharmaceuticals (PH), Chemicals (CH) and automotive products (AP). Interesting issue is
that China had comparative disadvantage in machinery and transport equipment from 2000-
2003 and in integrated circuits and electronic components but after 2003 and 2008 it gains
19
comparative advantage in these sectors respectively. To analyse the changing trend of
comparative advantage, if we check China´s comparative advantage from 1980, it is
surprising that China does not have any comparative advantage in the respective sectors.
China gained comparative advantage in manufacturing sector from 1989, in office and
telecom equipment from 1998, in machinery and transport equipment from 2003 and in
integrated circuits and electronic components from 2008. Our analysis suggests that China
intend to gain comparative advantage in most dynamic sectors of the world trade, more
interestingly the high technology sectors.
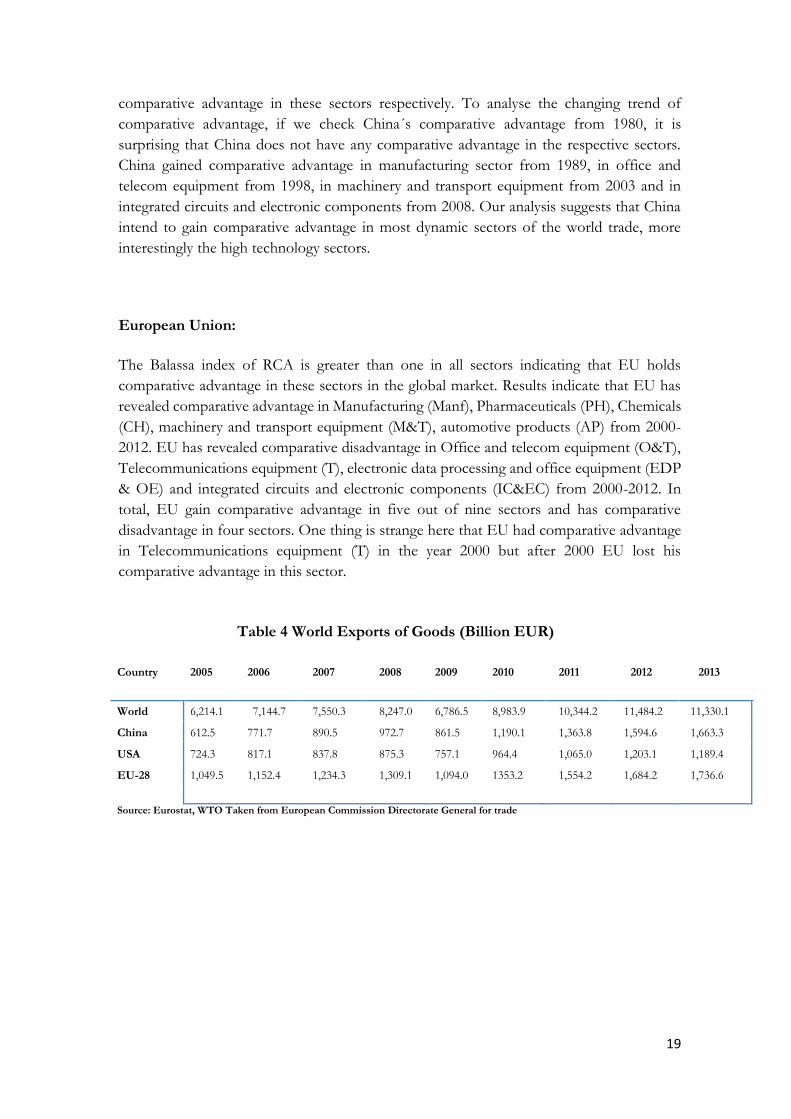
European Union:
The Balassa index of RCA is greater than one in all sectors indicating that EU holds
comparative advantage in these sectors in the global market. Results indicate that EU has
revealed comparative advantage in Manufacturing (Manf), Pharmaceuticals (PH), Chemicals
(CH), machinery and transport equipment (M&T), automotive products (AP) from 2000-
2012. EU has revealed comparative disadvantage in Office and telecom equipment (O&T),
Telecommunications equipment (T), electronic data processing and office equipment (EDP
& OE) and integrated circuits and electronic components (IC&EC) from 2000-2012. In
total, EU gain comparative advantage in five out of nine sectors and has comparative
disadvantage in four sectors. One thing is strange here that EU had comparative advantage
in Telecommunications equipment (T) in the year 2000 but after 2000 EU lost his
comparative advantage in this sector.
Table 4 World Exports of Goods (Billion EUR)
Country 2005 2006 2007 2008 2009 2010 2011 2012 2013
World 6,214.1 7,144.7 7,550.3 8,247.0 6,786.5 8,983.9 10,344.2 11,484.2 11,330.1
China 612.5 771.7 890.5 972.7 861.5 1,190.1 1,363.8 1,594.6 1,663.3
USA 724.3 817.1 837.8 875.3 757.1 964.4 1,065.0 1,203.1 1,189.4
EU-28 1,049.5 1,152.4 1,234.3 1,309.1 1,094.0 1353.2 1,554.2 1,684.2 1,736.6
Source: Eurostat, WTO Taken from European Commission Directorate General for trade
20
Appendix 2 Figure 1: China-EU Revealed Comparative Advantage Index in different Sectors
0
0.05
0.1
20
00
20
01
20
02
20
03
20
04
20
05
20
06
20
07
20
08
20
09
20
10
20
11
20
12
Manufacturing
Man EU Man Ch
0
0.02
0.04
20
00
20
01
20
02
20
03
20
04
20
05
20
06
20
07
20
08
20
09
20
10
20
11
20
12
Chemicals
CHE EU CHE Ch
0
0.01
0.02
1 2 3 4 5 6 7 8 9 10 11 12 13
Pharmaceuticals
Ph EU Ph Ch
0
0.05
Machinary & Transport Equipment
MT EU MT Ch
-0.02
0
0.02
0.04
20
00
20
01
20
02
20
03
20
04
20
05
20
06
20
07
20
08
20
09
20
10
20
11
20
12
Office and Telecom
OT EU OT Ch
-0.01
0
0.01
20
00
20
01
20
02
20
03
20
04
20
05
20
06
20
07
20
08
20
09
20
10
20
11
20
12
Electronic Data Equipment
Elec Data Eq ED Ch
-0.01
0
0.01
20
00
20
01
20
02
20
03
20
04
20
05
20
06
20
07
20
08
20
09
20
10
20
11
20
12
Telecom Equipment
Tele Eq EU Tele Eq Ch
-0.03
-0.01
0.01
20
00
20
01
20
02
20
03
20
04
20
05
20
06
20
07
20
08
20
09
20
10
20
11
20
12
Integrated Circuits
IC EU IC Ch
21
Appendix 3 A
Normalised Revealed Comparative Advantage Index: Normality Tests
Sectors Shapiro-Wilk Anderson- Kolmogorov-
Test Darling Smirnov
Manf EU 0,91 0,43 0,18
Manf Ch 0,94 0,27 0,14
Textile EU 0,94 0,27 0,13
Textile Ch 0,94 0,29 0,13
Clothing EU 0,79 1,28 0,30
Clothing Ch 0,79 1,17 0,22
Chemicals EU 0,98 0,15 0,12
Chemicals Ch 0,98 0,34 0,14
Pharma EU 0,86 1,00 0,32
Pharma Ch 0,85 0,91 0,25
Mach/trans equ EU 0,90 0,46 0,19
Mach/trans equ Ch 0,95 0,26 0,14
Office/tele equ EU 0,96 0,29 0,15
Office/tele equ Ch 0,90 0,59 0,22
Elec data Equ EU 0,89· 0,56· 0,18
Elec data Equ Ch 0,86· 0,78· 0,22
Telcom Equ EU 0,94 0,35 0,19
Telecom Equ Ch 0,91 0,49 0,20
Integrated Circuits
EU 0,94 0,34 0,13
Integrated Circuits
Ch 0,93 0,36 0,15
Automotive EU 0,95 0,29 0,15
Automotive Ch 0,83 0,90 0,22· H0: F(Y) = N (μ, σ), The distribution of the population is normal with unspecified mean and standard deviation. H1: F(Y) ≠ N
(μ, σ), The distribution of the population is not normal.
Do not reject the null hypothesis at 1%·, 5 %·· and 10% level
22
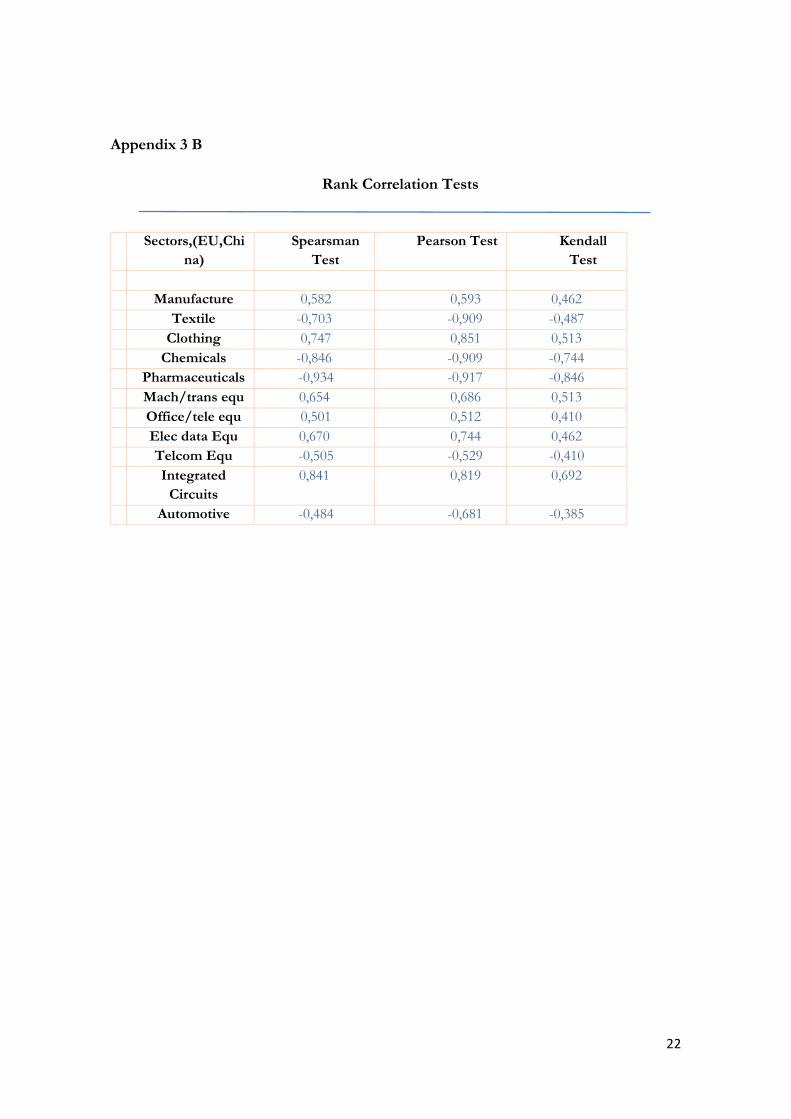
Appendix 3 B
Rank Correlation Tests
Sectors,(EU,Chi
na)
Spearsman
Test
Pearson Test Kendall
Test
Manufacture 0,582 0,593 0,462
Textile -0,703 -0,909 -0,487
Clothing 0,747 0,851 0,513
Chemicals -0,846 -0,909 -0,744
Pharmaceuticals -0,934 -0,917 -0,846
Mach/trans equ 0,654 0,686 0,513
Office/tele equ 0,501 0,512 0,410
Elec data Equ 0,670 0,744 0,462
Telcom Equ -0,505 -0,529 -0,410
Integrated
Circuits
0,841 0,819 0,692
Automotive -0,484 -0,681 -0,385