Embed Size (px)
Citation preview
Conventional digital cameras as a tool for assessingleaf area index and biomass for cereal breedingJaume Casadesús* and Dolors Villegas
Institute of Food and Agricultural Research and Technology, Lleida 25198, Spain. *Correspondence: [email protected]
Abstract Affordable and easy‐to‐use methods for assessingbiomass and leaf area index (LAI) would be of interest inmost breeding programs. Here, we describe the evaluationof a protocol for photographic sampling and image analysisaimed at providing low‐labor yet robust indicators of biomassand LAI. In this trial, two genotypes of triticale, two of breadwheat, and four of tritordeum were studied. At six datesduring the growing cycle, biomass and LAI were measureddestructively, and digital photography was taken on thesame dates. Several vegetation indices were calculated fromeach image. The results showed that repeatable andconsistent values of the indices were obtained in consecutivephotographic samplings on the same plots. The photographicindices were highly correlated with the destructive measure-ments, though the magnitude of the correlation was lowerafter anthesis. This work shows that photographic assess-
ment of biomass and LAI can be fast, affordable, have goodrepeatability, and can be used under bright and overcastskies. A practical vegetation index derived from pictures isthe fraction of green pixels over the total pixels of the image,and as it shows good correlations with all biomass variables,is the most robust to lighting conditions and has easyinterpretation.
Keywords: Digital camera; image analysis; leaf area index; plantbreeding; vegetation indexCitation: Casadesús J, Villegas D (2014) Conventional digital cameras asa tool for assessing leaf area index and biomass for cereal breeding. JIntegr Plant Biol 56: 7–14. doi: 10.1111/jipb.12117Edited by: Frans Tax, University of Arizona, USAReceived Jun. 11, 2013; Accepted Oct. 8, 2013Available online on Oct. 19, 2013 at www.wileyonlinelibrary.com/journal/jipb© 2013 Institute of Botany, Chinese Academy of Sciences
INTRODUCTION
Cereal yield may be expressed as the product of biomass atmaturity and harvest index (Van denBoogaard et al. 1996). Duringthe last century, yield increaseswere associated to improvementsin harvest index (Álvaro et al. 2008), achieving values close tothe theoretical maximumwhich has been estimated to be 0.60(Austin 1980). Thus, future significant yield improvements willhave to rely on biomass increaseswhilemaintaining the currentharvest indices. For this reason, assessment of biomass has agreat importance in cereal breeding programs, and reliableestimations of this target trait are needed.
One particular application of biomass estimation is themeasurement of early vigor, which is critical in some environ-ments because it reduces direct evaporation from soil,increases radiation interception by the crop, and brings acompetitive advantage against weeds (Loss and Siddique 1994;Jacobsen et al. 2012), and ultimately may be related to grainproductivity (Preuss et al. 2012). Early vigor has also beenpointed out as a critical trait for adaptation strategies toclimate change (Ludwig and Asseng 2010) and is dependent onboth biomass and leaf area index (LAI), which are interrelated(Baret and Guyot 1991; Lawlor 1995).
Direct methods for measuring biomass and LAI consist ofharvesting the samples in the field, transporting them to thelaboratory, determining the area of the leaves to obtain LAIand/or oven‐drying and finally weighing the sample to measurebiomass (Villegas et al. 2001; Royo et al. 2004). The laborinvolved implies that it can be too costly or unfeasible for alarge number of breeding plots. In addition, it is destructive andconsumes part of the crop, which can be a problem given thesmall size of some breeding plots.
In this context, non‐destructive optical methods have beenproposed. Several studies have analyzed the applicability ofvegetation indices based on spectral reflectance (Aparicioet al. 2002; Royo et al. 2003; Haboudane et al. 2004; Liuet al. 2007; Prasad et al. 2007). One of those indices is thenormalized difference vegetation index (NDVI). These indiceshave been proved useful with certain limitations (Royo andVillegas 2011), such as the environmental influence, the noiseassociated to the sensors, and the cost of the equipment,although some recent models are of lower price than previousversions. The assessment of biomass or LAI by spectralreflectance methods provides better results in early stages ofdevelopment, as the presence of spikes and overlapping ofleaves can disturb measurements (Aparicio et al. 2002).Regarding the source of light, the equipment used in thosemethods can be classified as either passive or active. Passiveinstruments depend on sunlight and often consist of a general‐purpose spectroradiometer measuring a number of wave-lengths in visible and near‐infrared, whereas active instrumentstarget well‐defined markets and are equipped with light‐sources emitting in specific waveband regions (Erdle et al. 2011).
The requirement for such specialized equipment may be abottleneck for a widespread use of spectral reflectance indicesin breeding programs. Conventional digital cameras couldprovide a more convenient method since they are moreaffordable, portable, and easy to use. Digital photography hasbeen used for quantifying plant traits such as leaf area(Baker et al. 1996; Lukina et al. 1999; Campillo et al. 2008, Latiet al. 2011) as well as senescence of leaves (Adamsenet al. 1999; Ide and Oguma 2010) or grassland coverage(Li et al. 2005). Besides, the images are multiuse. Once theyhave been used for assessing biomass they can also be useful
FreeAccess
New
TechnologyJIPB Journal of Integrative
Plant Biology
www.jipb.net January 2014 | Volume 56 | Issue 1 | 7–14
for checking other traits, such as presence of disease, plantdensity, and distribution.
In this context, conventional cameras have been proposedas a selection tool for cereal breeding (Casadesús et al. 2007;Mullan and Reynolds 2010). In breeding programs, photo-graphic sampling can be cost‐efficient because a large numberof samples can be obtained with minimum effort. Calculationsfrom those images can also be cost‐effective because they arebased on rather simple methods that can be automated forapplication to a large number of images. An additional aspectthat may determine the practical interest of the method is itssensitivity to the weather conditions because restricting its useto days with clear skies would limit its utility.
In this work, we evaluate a protocol for photographicsampling and image analysis aimed at providing low‐labor yetrobust indices of biomass. The goal is to characterize howphenology and weather conditions affect the performance ofseveral vegetation indices derived from digital photography.The experimental trial included different genotypes of barley,durum wheat, and tritordeum, which at different phenologystages were sampled destructively for biomass and at thesame dates by digital photography.
RESULTSThe protocol described here allowed sampling of a largenumber of plots with a conventional digital camera and havingthe corresponding vegetation indices calculated the same daywithoutmuch effort. The typical sampling session conducted in
this work consisted of at least 125 pictures in a single day, whichinvolved approximately 22min in the field for taking thepictures and another 28min in the office for downloading themfrom the camera, associating each picture to a breeding plotand calculating the indices.
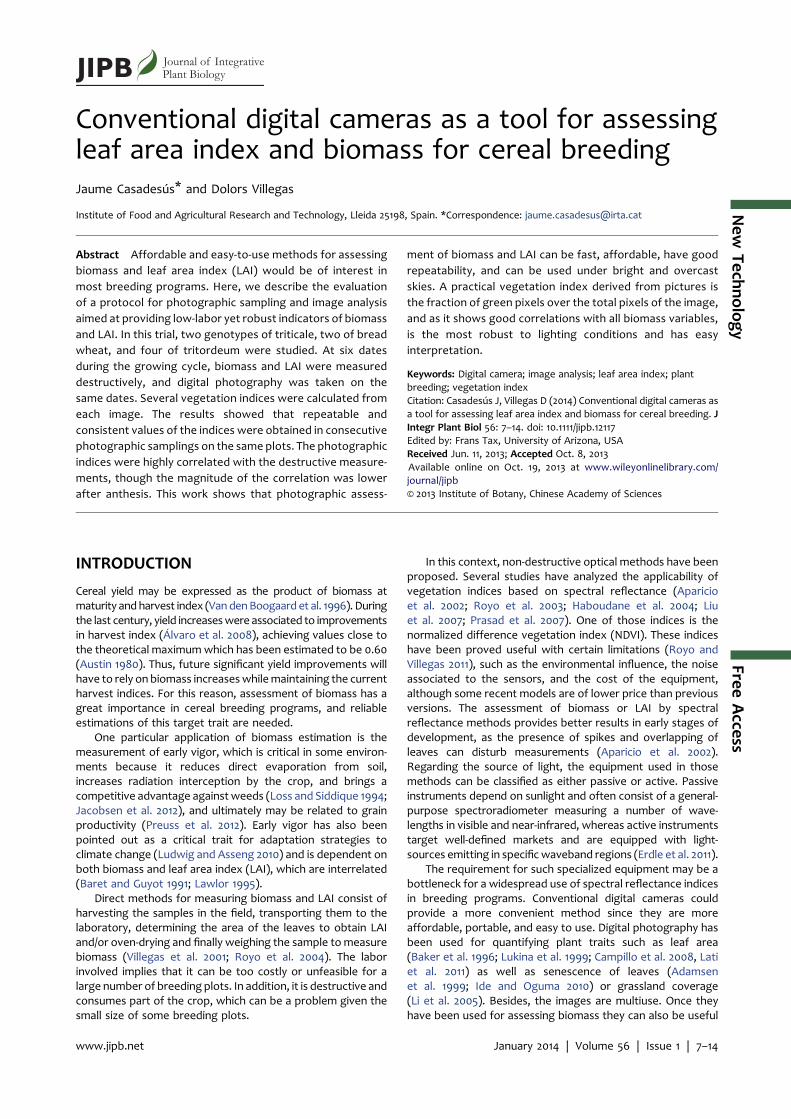
Examination of the output images, where the softwaremarked what it considered vegetation (Figure 1), showed thaterrors in classifying pixels were minimal (<1%). Thesecorresponded to portions of leaves appearing with toomuch contrast in the photographs, either almost white oralmost black, with a saturation component of color so low thatthey were not always classified as green.
Consecutive measurements on the same plots showedgood repeatability and consistency of the diverse indices. Thisallowed us to easily distinguish the particular growing patternof the different plant materials (Figure 2A). Even differencesbetween elementary plots of the same material could bedistinguished (Figure 2B).
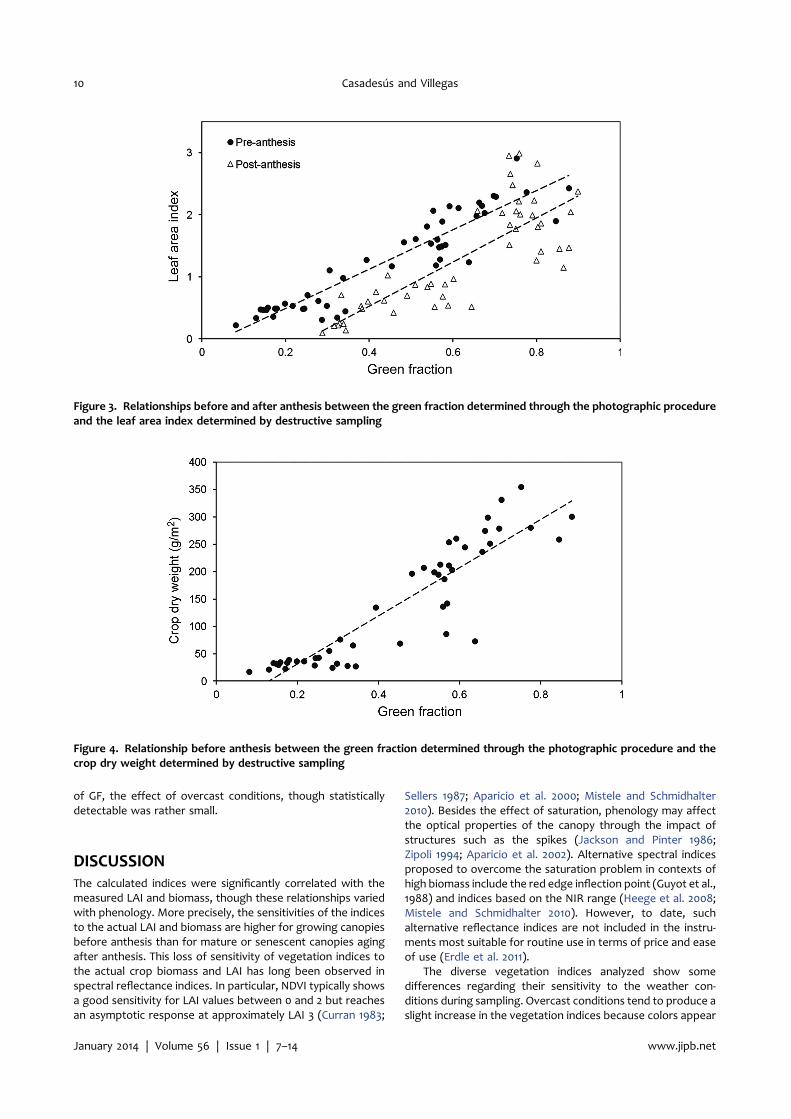
The time of ear emergence is shown in Table 1. Thecalculated indices showed significant correlations with thevariables determined by destructive sampling (Table 2).Considering the whole growing season, LAI showed acoefficient of determination (R2) with each of the proposedindices equal to or greater than 0.64. However, the relationshipwas not the same for growing canopies before anthesis thanfor senescing canopies after anthesis (Figure 3). If analyzedseparately, R2 before anthesis was in the range of 0.8–0.9,while after anthesis it remained approximately 0.65. Presum-ably, the difference may in part be attributed to the impact ofspikes in the zenithal view of the canopy. The relationship with
Figure 1. Example of an input image (left), as obtained by the camera, and the corresponding output image (right) after thecustom‐made software BreedPix version 1.0 calculated the diverse indices and marked in green the pixels counted as greenfraction and in gray those considered background
8 Casadesús and Villegas
January 2014 | Volume 56 | Issue 1 | 7–14 www.jipb.net
green area index (GAI)—which includes the surface of stemsand spikes—shows a hysteresis even greater than that of LAI.Considering the pre‐anthesis samples, the coefficients ofdetermination were better for GAI than for LAI, especially forthe stage of stem elongation. This may be because a significantpart of the “greenness” of the canopy corresponded to stems.On the other hand, after anthesis, the relationships of theindices with GAI were much poorer than with LAI, which maybe because much of the green structures included in the GAIhave a vertical orientation and were barely visible in a zenithalview of the canopy. Regarding biomass, before anthesis the
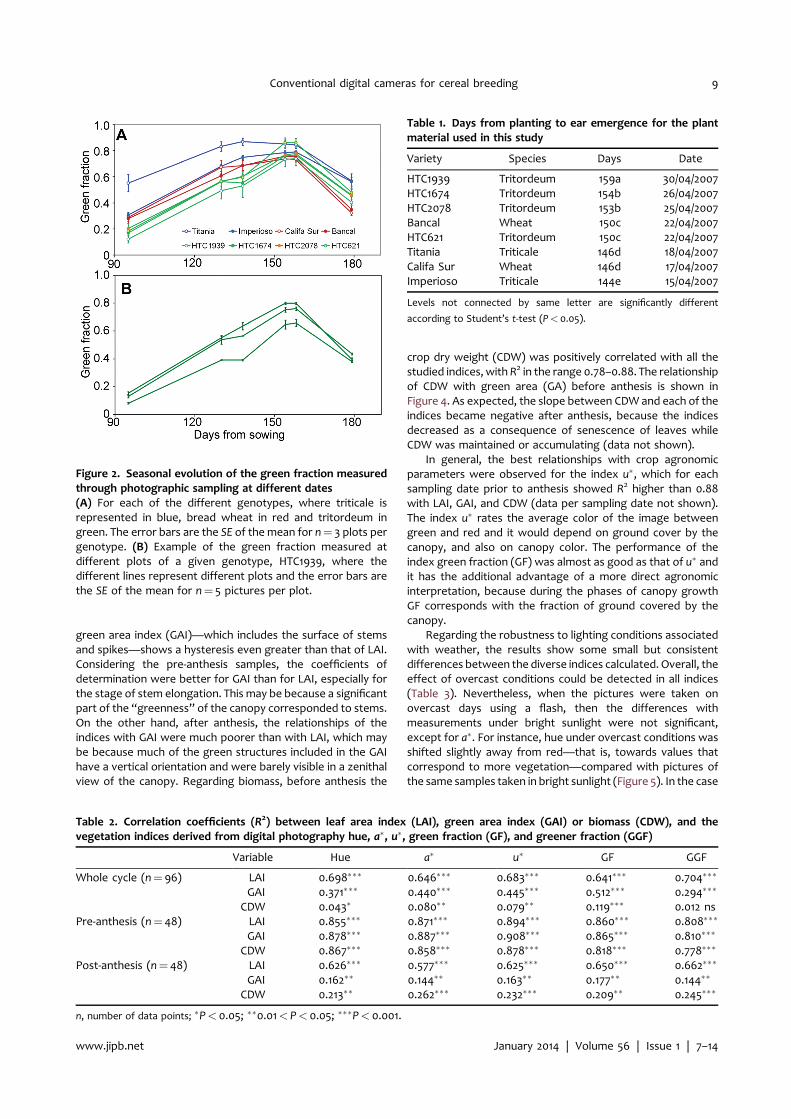
crop dry weight (CDW) was positively correlated with all thestudied indices, with R2 in the range 0.78–0.88. The relationshipof CDW with green area (GA) before anthesis is shown inFigure 4. As expected, the slope between CDW and each of theindices became negative after anthesis, because the indicesdecreased as a consequence of senescence of leaves whileCDW was maintained or accumulating (data not shown).
In general, the best relationships with crop agronomicparameters were observed for the index u�, which for eachsampling date prior to anthesis showed R2 higher than 0.88with LAI, GAI, and CDW (data per sampling date not shown).The index u� rates the average color of the image betweengreen and red and it would depend on ground cover by thecanopy, and also on canopy color. The performance of theindex green fraction (GF) was almost as good as that of u� andit has the additional advantage of a more direct agronomicinterpretation, because during the phases of canopy growthGF corresponds with the fraction of ground covered by thecanopy.
Regarding the robustness to lighting conditions associatedwith weather, the results show some small but consistentdifferences between the diverse indices calculated. Overall, theeffect of overcast conditions could be detected in all indices(Table 3). Nevertheless, when the pictures were taken onovercast days using a flash, then the differences withmeasurements under bright sunlight were not significant,except for a�. For instance, hue under overcast conditions wasshifted slightly away from red—that is, towards values thatcorrespond to more vegetation—compared with pictures ofthe same samples taken in bright sunlight (Figure 5). In the case
Table 1. Days from planting to ear emergence for the plantmaterial used in this study
Variety Species Days Date
HTC1939 Tritordeum 159a 30/04/2007HTC1674 Tritordeum 154b 26/04/2007HTC2078 Tritordeum 153b 25/04/2007Bancal Wheat 150c 22/04/2007HTC621 Tritordeum 150c 22/04/2007Titania Triticale 146d 18/04/2007Califa Sur Wheat 146d 17/04/2007Imperioso Triticale 144e 15/04/2007
Levels not connected by same letter are significantly different
according to Student’s t‐test (P< 0.05).
Table 2. Correlation coefficients (R2) between leaf area index (LAI), green area index (GAI) or biomass (CDW), and thevegetation indices derived from digital photography hue, a�, u�, green fraction (GF), and greener fraction (GGF)
Variable Hue a� u� GF GGF
Whole cycle (n¼ 96) LAI 0.698��� 0.646��� 0.683��� 0.641��� 0.704���
GAI 0.371��� 0.440��� 0.445��� 0.512��� 0.294���
CDW 0.043� 0.080�� 0.079�� 0.119��� 0.012 nsPre‐anthesis (n¼ 48) LAI 0.855��� 0.871��� 0.894��� 0.860��� 0.808���
GAI 0.878��� 0.887��� 0.908��� 0.865��� 0.810���
CDW 0.867��� 0.858��� 0.878��� 0.818��� 0.778���
Post‐anthesis (n¼ 48) LAI 0.626��� 0.577��� 0.625��� 0.650��� 0.662���
GAI 0.162�� 0.144�� 0.163�� 0.177�� 0.144��
CDW 0.213�� 0.262��� 0.232��� 0.209�� 0.245���
n, number of data points; �P< 0.05; ��0.01< P< 0.05; ���P< 0.001.
Figure 2. Seasonal evolution of the green fraction measuredthrough photographic sampling at different dates(A) For each of the different genotypes, where triticale isrepresented in blue, bread wheat in red and tritordeum ingreen. The error bars are the SE of the mean for n¼ 3 plots pergenotype. (B) Example of the green fraction measured atdifferent plots of a given genotype, HTC1939, where thedifferent lines represent different plots and the error bars arethe SE of the mean for n¼ 5 pictures per plot.
Conventional digital cameras for cereal breeding 9
www.jipb.net January 2014 | Volume 56 | Issue 1 | 7–14
of GF, the effect of overcast conditions, though statisticallydetectable was rather small.
DISCUSSIONThe calculated indices were significantly correlated with themeasured LAI and biomass, though these relationships variedwith phenology. More precisely, the sensitivities of the indicesto the actual LAI and biomass are higher for growing canopiesbefore anthesis than for mature or senescent canopies agingafter anthesis. This loss of sensitivity of vegetation indices tothe actual crop biomass and LAI has long been observed inspectral reflectance indices. In particular, NDVI typically showsa good sensitivity for LAI values between 0 and 2 but reachesan asymptotic response at approximately LAI 3 (Curran 1983;
Sellers 1987; Aparicio et al. 2000; Mistele and Schmidhalter2010). Besides the effect of saturation, phenology may affectthe optical properties of the canopy through the impact ofstructures such as the spikes (Jackson and Pinter 1986;Zipoli 1994; Aparicio et al. 2002). Alternative spectral indicesproposed to overcome the saturation problem in contexts ofhigh biomass include the red edge inflection point (Guyot et al.,1988) and indices based on the NIR range (Heege et al. 2008;Mistele and Schmidhalter 2010). However, to date, suchalternative reflectance indices are not included in the instru-ments most suitable for routine use in terms of price and easeof use (Erdle et al. 2011).
The diverse vegetation indices analyzed show somedifferences regarding their sensitivity to the weather con-ditions during sampling. Overcast conditions tend to produce aslight increase in the vegetation indices because colors appear
Figure 3. Relationships before and after anthesis between the green fraction determined through the photographic procedureand the leaf area index determined by destructive sampling
Figure 4. Relationship before anthesis between the green fraction determined through the photographic procedure and thecrop dry weight determined by destructive sampling
10 Casadesús and Villegas
January 2014 | Volume 56 | Issue 1 | 7–14 www.jipb.net
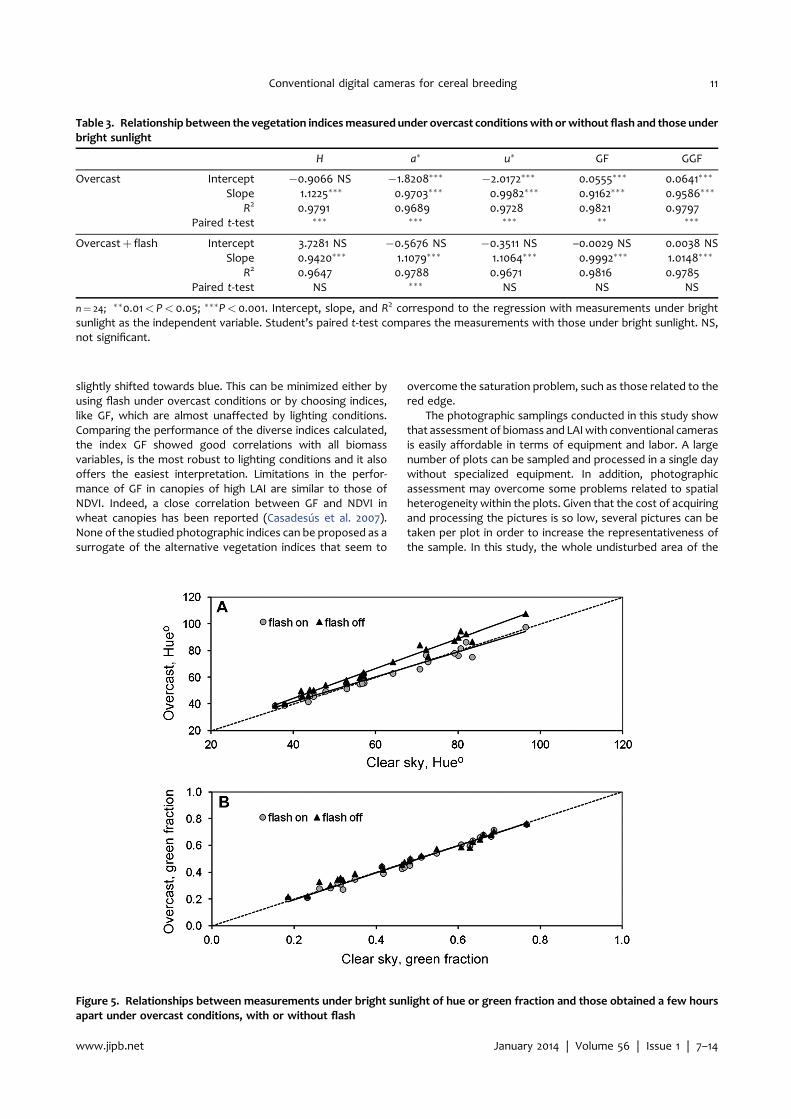
slightly shifted towards blue. This can be minimized either byusing flash under overcast conditions or by choosing indices,like GF, which are almost unaffected by lighting conditions.Comparing the performance of the diverse indices calculated,the index GF showed good correlations with all biomassvariables, is the most robust to lighting conditions and it alsooffers the easiest interpretation. Limitations in the perfor-mance of GF in canopies of high LAI are similar to those ofNDVI. Indeed, a close correlation between GF and NDVI inwheat canopies has been reported (Casadesús et al. 2007).None of the studied photographic indices can be proposed as asurrogate of the alternative vegetation indices that seem to
overcome the saturation problem, such as those related to thered edge.
The photographic samplings conducted in this study showthat assessment of biomass and LAIwith conventional camerasis easily affordable in terms of equipment and labor. A largenumber of plots can be sampled and processed in a single daywithout specialized equipment. In addition, photographicassessment may overcome some problems related to spatialheterogeneity within the plots. Given that the cost of acquiringand processing the pictures is so low, several pictures can betaken per plot in order to increase the representativeness ofthe sample. In this study, the whole undisturbed area of the
Table 3. Relationship between the vegetation indicesmeasured under overcast conditionswith orwithout flash and those underbright sunlight
H a� u� GF GGF
Overcast Intercept �0.9066 NS �1.8208��� �2.0172��� 0.0555��� 0.0641���
Slope 1.1225��� 0.9703��� 0.9982��� 0.9162��� 0.9586���
R2 0.9791 0.9689 0.9728 0.9821 0.9797Paired t‐test ��� ��� ��� �� ���
Overcastþ flash Intercept 3.7281 NS �0.5676 NS �0.3511 NS –0.0029 NS 0.0038 NSSlope 0.9420��� 1.1079��� 1.1064��� 0.9992��� 1.0148���
R2 0.9647 0.9788 0.9671 0.9816 0.9785Paired t‐test NS ��� NS NS NS
n¼ 24; ��0.01< P< 0.05; ���P<0.001. Intercept, slope, and R2 correspond to the regression with measurements under brightsunlight as the independent variable. Student’s paired t‐test compares the measurements with those under bright sunlight. NS,not significant.
Figure 5. Relationships between measurements under bright sunlight of hue or green fraction and those obtained a few hoursapart under overcast conditions, with or without flash
Conventional digital cameras for cereal breeding 11
www.jipb.net January 2014 | Volume 56 | Issue 1 | 7–14
plot was sampled and processed at approximately the samespeed required for walking beside all the plots. This examplealso illustrates how a collection of genotypes can be easilysampled at different times in the growing cycle, providing datathat can allow characterizing different patterns of develop-ment. This study shows that photographic assessment of LAIand biomass is affordable, presents good repeatability, andalso can be used under overcast conditions.
MATERIALS AND METHODSPlant materialPlant material consisted of two widely grown bread wheatvarieties (Bancal and Califa Sur), two triticale varieties(Imperioso and Titania), and four genotypes of hexaploidtritordeum (HT621, HT374, TH376, and THC2078), the tritor-deum being obtained from the CSIC of Córdoba, Spain, byAntonio Martín.
Field experimentsField experiments were conducted in Gimenells (41°400N,0°200E, Lleida province, North‐East Spain) during 2006/2007and 2007/2008 seasons. The soil classification was MesicCalcixerolic Xerochrept and texture was fine‐loamy. Experi-ments consisted of a randomized complete block design withthree replications and plots of 12 m2, with eight rows, 0.15mapart. Seed rate was adjusted to 400 viable seeds m�2, andsowing took place on 23 November 2006 and 20 Novem-ber 2007, the usual planting date in the zone. Experimentswere rain‐fed and the total water received from sowing tomaturity was 208mm in 2006/2007 and 266mm in 2007/2008.The accumulated reference evapotranspiration from sowing toharvest was 571mm in 2006/2007 and 1,091mm in 2007/2008.Suitable agronomic practices were performed in order tomaintain the crop free from weeds, diseases, and pests. Thegrain yield obtained in the 2006/2007 experiment, which wasused for most of the calculations presented in this paper,ranged between 3,580 and 4,159 kg/ha in bread wheat,between 3,654 and 4,603 kg/ha in triticale, and between1,053 and 2,414 kg/ha in tritordeum. Yield values of theexperiment of 2008 have already been published (Villegaset al. 2010).
Data collectionPhotographic sampling consisted of walking across the fieldfollowing the elementary plots according to their spatialarrangement along a pre‐established path. Pictures wereobtained while walking, without stopping, with the cameraheld by hand above the canopy at shoulder height, with thephotographer’s arm extended towards the center of the plot.The camera position was then at approximately 150 cm height,approximately 70 cm from the border of the plot and orienteddownwards. The field of view was approximately 180 cm per120 cm of ground. Five pictures were obtained per plot,covering the part of the plot not disturbed by destructivemethods. Sampling was conducted in 2007 on the days of year(DOY) 57, 92, 100, 116, 120, and 141, which corresponded to thephenology phases of tillering, jointing, anthesis, and milk grain.Sampling all plots was typically done in less than 30min.
An additional photographic sampling was conducted in2008, on DOY 99,with the plants at booting stage. Theweather
conditions were announced to change andwithin the same dayone sampling of the 24 plots was performed under brightsunlight and, a few hours later, repeated twice under overcastconditions, once without flash and once with flash.
The camera used was a NIKON D70 with an objectiveNIKKOR of 18–70mm set at theminimum focal length, focusingat infinity and configured to a fixed aperture of F3.5 andautomated exposure time, which ranged between 1/400 and1/250. The images were 1 504� 1 000 pixels. Unless indicated,pictures were taken without flash.
Image processingAfter each sampling day, the pictureswere downloaded to a PCand processed with custom‐made software, BreedPix version1.0, which can be obtained free of charge from the authors andis based on that described in Casadesús et al. (2007). In thesoftware, the user had to select the folder where the imageshad been downloaded from the camera and assign eachthumbnail to a breeding plot from a list previously defined bythe user. Next, the software processed thewhole list of imageswithout further need of interaction with the user. The mainoutput from the programwas a table with one row per pictureand the corresponding columns for the diverse indices andother data such as the identification of the plot. In addition, foreach picture the program saved an output image representinghow the pixels had been classified between canopy andbackground.
The procedures for calculating the vegetation indices arethe same as those described in Casadesús et al. (2007) with thedifference that the former indices green area (GA) and greenerarea (GGA) have been renamed green fraction (GF) andgreener fraction (GGF). Basically, the indices are based oneither the average color of the entire image, in diverse unitsrelated to its “greenness”, or on the fraction of pixels classifiedas green canopy relative to the total number of pixels of theimage. The first group includes hue, in degrees, which is the Hcomponent in the HIS color space (for hue, intensity, andsaturation), and the parameters a� and u� defined by theCommission Internationale de l’Éclairage (CIE) in the colorspaces CIELAB and CIELUV, respectively (Trussell et al. 2005),where both a� and u� rate a color in an axis from green to red interms of sensitivity by the human visual system, and thedifference between them lies in the formulas used in thecalculation. The second group includes the GF, whichcorresponds to the proportion of green pixels in an image,where a pixel is considered green if its hue is within the range60–180°. The GGF was aimed at quantifying the fraction of fullyfunctional green cover, excluding yellowish pixels that maycorrespond to senescent leaves, and was calculated as theproportion of pixels whose hue is within the range 80–180°.
Biomass determinationsPlots were split in two halves, one of them being used fordestructive biomass sampling, leaving the other half intact fordigital imaging. Biomass sampling dates were within 1 d of thecorresponding digital imaging sampling date. On eachsampling, plants contained within a randomly selected portionof 0.5m length in a central rowwere pulled out. Rootswere cutat the ground level and yellow or dead leaves were discarded.The area of the green leaves (one side laminae), stemsincluding the leaf‐sheaths, and spikes if present weremeasured separately using a leaf‐area meter (DIAS II; Delta‐T
12 Casadesús and Villegas
January 2014 | Volume 56 | Issue 1 | 7–14 www.jipb.net
Devices, Cambridge, UK). All portions were oven‐dried at 70 °Cfor 48 h and weighted. LAI was computed from leaf area of thewhole sample, and GAI included the area of leaves, stems, andspikes. CDW was calculated from the weight of the wholesample.
Statistical analysisFor each index, the average from the five pictures per plot anddatewas comparedwith the destructivemeasurements at thatplot and date. Pearson correlation coefficients were calculatedwith raw data with the JMP statistical package (JMP version 8;SAS Institute, Cary, NC, USA; 1989–2007).
ACKNOWLEDGEMENTSThis work was funded by the Spanish Ministry of Science andInnovation, project AGL2005‐07257‐C04‐03 and by the SpanishMinistry of Agriculture, projects RTA2010‐00007‐00‐00 andRTA2012‐00011‐00‐00.
REFERENCESAdamsen FJ, Pinter PJ, Barnes EM, LaMorte RL, Wall GW, Leavitt SW,
Kimball BA (1999) Measuring wheat senescence with a digitalcamera. Crop Sci 39: 719–724
Álvaro F, Isidro J, Villegas D, García del Moral LF, Royo C (2008)Breeding effects on grain filling, biomass partitioning, andremobilization in Mediterranean durum wheat. Agron J 100:361–370
Aparicio N, Villegas D, Casadesús J, Araus JL, Royo C (2000) Spectralvegetation indices as non‐destructive tools for determining durumwheat yield. Agron J 92: 83–91
Aparicio N, Villegas D, Araus JL, Casadesús J, Royo C (2002)Relationship between growth traits and spectral vegetationindices in durum wheat. Crop Sci 42: 1547–1555
Austin RB (1980) Physiological limitations to cereals yields and ways ofreducing them by breeding. In: Hurd R. G, Biscoe P. V, Dennis C,eds. Opportunities for Increasing Crop Yields, Pitman, Boston.pp. 3–19
Baker B, Olszyk DM, Tingey D (1996) Digital image analysis to estimateleaf area. J Plant Physiol 148: 530–535
Baret F, Guyot G (1991) Potentials and limits of vegetation indices forLAI and APAR estimation. Remote Sens Environ 35: 161–173
Campillo C, Prieto MH, Daza C, Monino MJ, Garcia MI (2008) Usingdigital images to characterize canopy coverage and lightinterception in a processing tomato crop. Hortscience 43: 1780–1786
Casadesús J, Kaya Y, Bort J, NachitMM, Araus JL, Amor S, FerrazzanoG,Maalouf F, Maccaferri M, Martos V, Ouabbou H, Villegas D (2007)Using vegetation indices derived from conventional digitalcameras as selection criteria for wheat breeding in water‐limitedenvironments. Ann Appl Biol 150: 227–236
Curran PJ (1983) Multispectral remote sensing for the estimation ofgreen leaf area index. Phil Trans R Soc Lond 309: 257–270
Erdle K, Mistele B, Schmidhalter U (2011) Comparison of active andpassive spectral sensors in discriminating biomass parameters andnitrogen status in wheat cultivars. Field Crops Res 124: 74–84
Guyot G, Baret F, Major DJ (1988) High spectral resolution:determination of spectral shifts between the red and the nearinfrared. Int Archiv Photogramm Remote Sens 11: 750–760
Haboudane D, Miller JR, Pattey E, Zarco‐Tejada PJ, Strachan IB (2004)Hyperspectral vegetation indices and novel algorithms forpredicting green LAI of crop canopies: Modeling and validationin the context of precision agriculture. Remote Sens Environ 90:337–352
Heege HJ, Reusch S, Thiessen E (2008) Prospects and results for opticalsystems for site‐specific on‐the‐go control of nitrogen‐top‐dressingin Germany. Precision Agric 9: 115–131
Ide R, Oguma H (2010) Use of digital cameras for phenologicalobservations. Ecol Info 5: 339–347
Jackson RD, Pinter PJ (1986) Spectral response of architecturallydifferent wheat canopies. Remote Sens Environ 20: 43–56
Jacobsen SE, Jensen CR, Liu F (2012) Improving crop production in thearid Mediterranean climate. Field Crops Res 128: 34–47
Lati RN, Filin S, Eizenberg H (2011) Robustmethods formeasurement ofleaf‐cover area and biomass from image data. Weed Sci 59: 276–284
Lawlor DW (1995) Photosynthesis, productivity and environment. J ExpBot 46: 1449–1461
Li XB, Chen YH, Yang H, Zhang YX (2005) Improvement, comparison,and application of field measurement methods for grasslandvegetation fractional coverage. J Int Plant Biol 47: 1074–1083
Liu ZY, Huang JF, Wu XH, Dong YP (2007) Comparison of vegetationindices and red‐edge parameters for estimating grasslandcover from canopy reflectance data. J Int Plant Biol 49: 299–306
Loss SP, Siddique KHM (1994) Morphological and physiological traitsassociated with wheat increases in Mediterranean environments.Adv Agron 52: 229–276
Ludwig F, Asseng S (2010) Potential benefics of early vigor and changesin phenology inwheat to adapt towarmer and drier climates.AgricSyst 103: 127–136
Lukina EV, Stone ML, Rann WR (1999) Estimating vegetation coveragein wheat using digital images. J Plant Nutr 22: 341–350
Mistele B, Schmidhalter U (2010) Tractor‐based quadrilateral spectralreflectance measurement to detect biomass and total nitrogen inwinter wheat. Agron J 102: 499–506
Mullan DJ, Reynolds MP (2010) Quantifying genetic effects of groundcover on soil water evaporation using digital imaging. Funct PlantBiol 37: 703–712
Prasad B, Carver BF, Stone ML, Babar MA, Raun WR, Klatt AR (2007)Potential use of spectral reflectance indices as a selection tool forgrain yield in winter wheat under great plains conditions. Crop Sci47: 1426–1440
Preuss PP, Huang CY, Louhaichi M, Ogbonnaya FC (2012) Geneticvariation in the early vigour of spring bread wheat underphosphate stress as characterised through digital charting. FieldCrops Res 127: 71–78
Royo C, Villegas D (2011) Field measurements of canopy spectra forbiomass assessment of small‐grain cereals. In: Matovic D, ed.Biomass—Detection, Production and Usage, Darko Matovic, InTech:Rijeka, Croatia. Available from: http://www.intechopen.com/ar-ticles/show/title/field‐measurements‐of‐canopy‐spectra‐for‐bio-mass‐assessment‐of‐small‐grain‐cereals
Royo C, Aparicio N, Villegas D, Casadesús J, Monneveux P, Araus JL(2003) Usefulness of spectral reflectance indices as durum wheatyield predictors under contrasting Mediterranean conditions. Int JRemote Sens 24: 4403–4419
Royo C, Aparicio N, Blanco R, Villegas D (2004) Leaf and green areadevelopment of durum wheat genotypes grown under Mediterra-nean conditions. Eur J Agron 20: 419–430
Conventional digital cameras for cereal breeding 13
www.jipb.net January 2014 | Volume 56 | Issue 1 | 7–14
Sellers PJ (1987) Canopy reflectance, photosynthesis, and transpira-tion. II. The role of biophysics in the linearity of their interdepen-dence. Remote Sens Environ 21: 143–183
Trussell HJ, Vrhel MJ, Saber E (2005) Color image processing. IEEESignal Process Mag 22: 14–22
Van den Boogaard R, Veneklaas EJ, Lambers H (1996) The associationof biomass allocation with growth and water use efficiencyof two Triticum aestivum cultivars. Aust J Plant Physiol 23:751–761
Villegas D, Aparicio N, Blanco R, Royo C (2001) Biomass accumulationand main stem elongation of durum wheat grown underMediterranean conditions. Ann Bot 88: 617–627
Villegas D, Casadesús J, Atienza SG, Martos V, Maalouf F, Karam F,Aranjuelo I, Nogues S (2010) Tritordeum, wheat and triticale yieldcomponents under multi‐local mediterranean drought conditions.Field Crops Res 116: 68–74
Zipoli G (1994) Panicle contribution to bidirectional reflectance factorsof a wheat canopy. Int J Remote Sens 15: 3309–3314
14 Casadesús and Villegas
January 2014 | Volume 56 | Issue 1 | 7–14 www.jipb.net


![Cereal Food, Cereals and Cereal Products Processing IndustryNIIR]_Books-Cereal... · Profitable Agro Based Projects with Project Profiles (Cereal Food Technology) ... use. Cereals](https://img.pdfslide.us/doc/110x75/5ab66a817f8b9ab47e8dc8d4/cereal-food-cereals-and-cereal-products-processing-industry-niirbooks-cerealprofitable.jpg)