Embed Size (px)
Citation preview
Convectively Coupled Kelvin Waves Multi-Scale Study Over Africa in 2011
Matthew Janiga
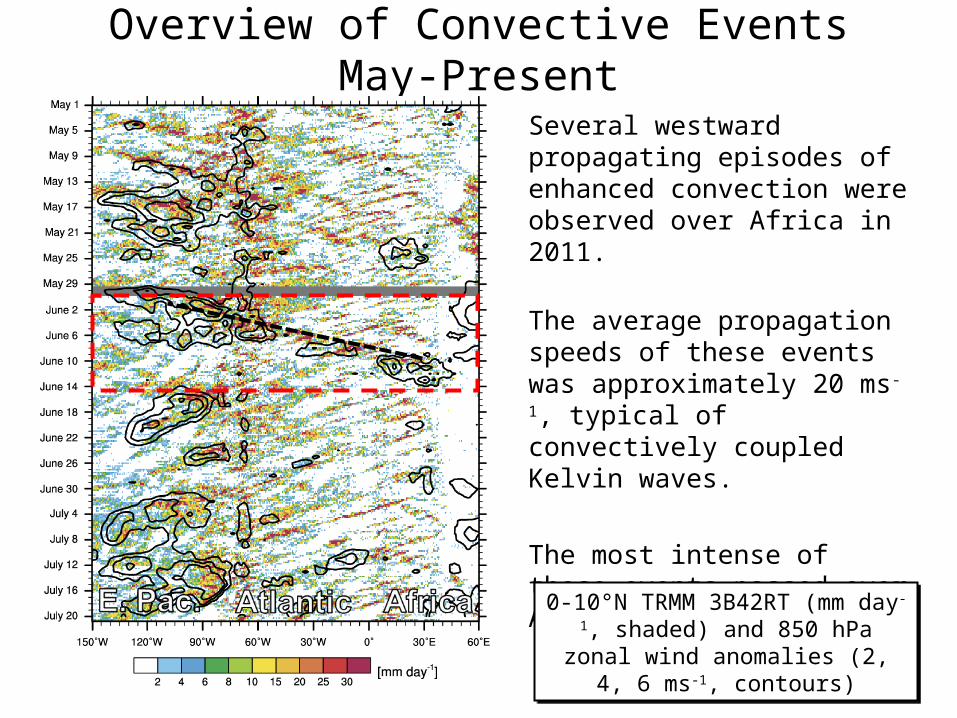
Overview of Convective Events May-Present
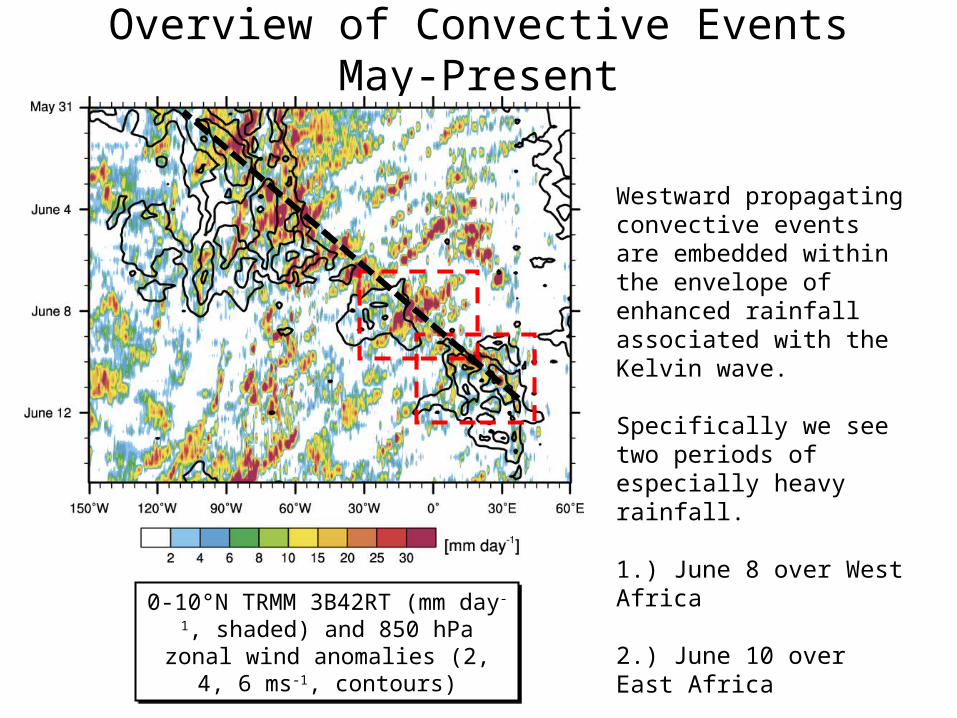
Several westward propagating episodes of enhanced convection were observed over Africa in 2011.
The average propagation speeds of these events was approximately 20 ms-1, typical of convectively coupled Kelvin waves.
The most intense of these events passed over Africa around June 8.
0-10°N TRMM 3B42RT (mm day-1, shaded) and 850 hPa zonal wind anomalies (2, 4, 6 ms-1, contours)
0-10°N TRMM 3B42RT (mm day-1, shaded) and 850 hPa zonal wind anomalies (2, 4, 6 ms-1, contours)
Overview of Convective Events May-Present
0-10°N TRMM 3B42RT (mm day-1, shaded) and 850 hPa zonal wind anomalies (2, 4, 6 ms-1, contours)
0-10°N TRMM 3B42RT (mm day-1, shaded) and 850 hPa zonal wind anomalies (2, 4, 6 ms-1, contours)
Westward propagating convective events are embedded within the envelope of enhanced rainfall associated with the Kelvin wave.
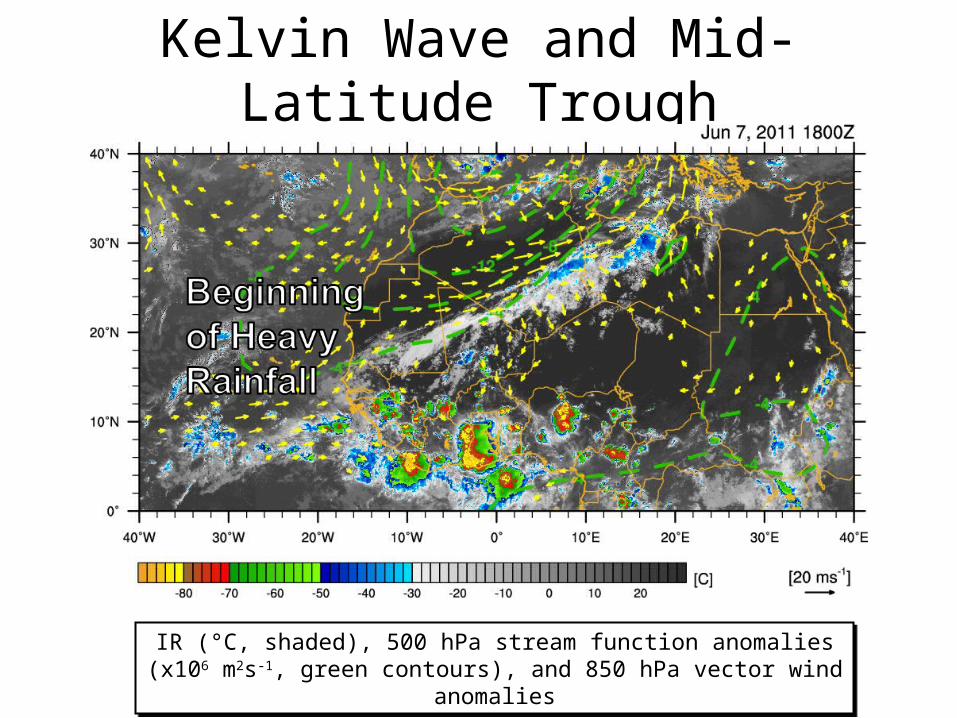
Specifically we see two periods of especially heavy rainfall.
1.) June 8 over West Africa
2.) June 10 over East Africa
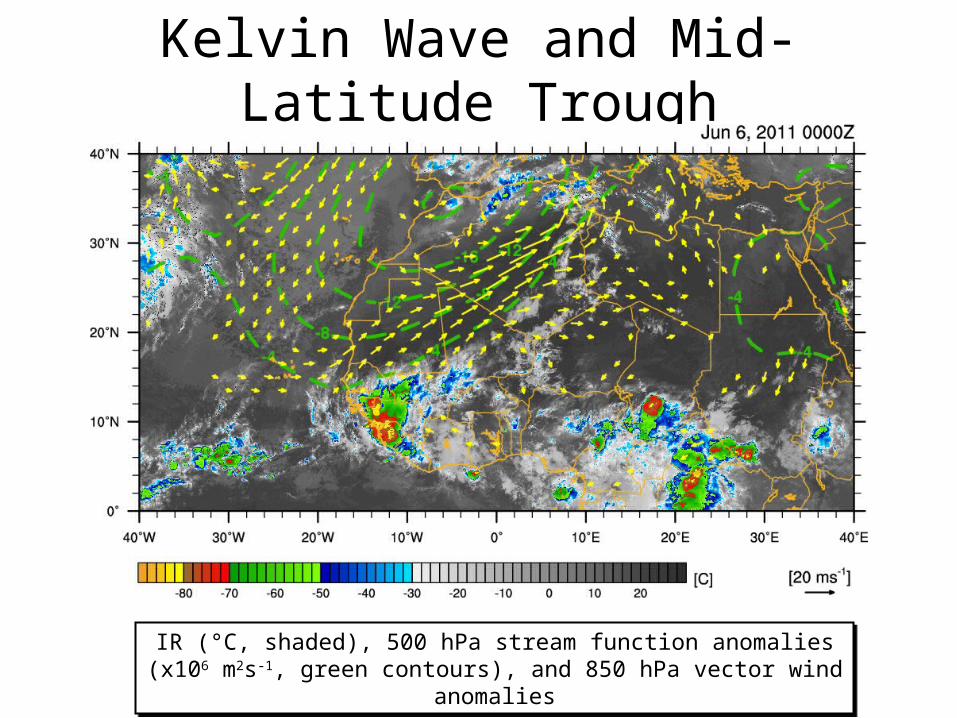
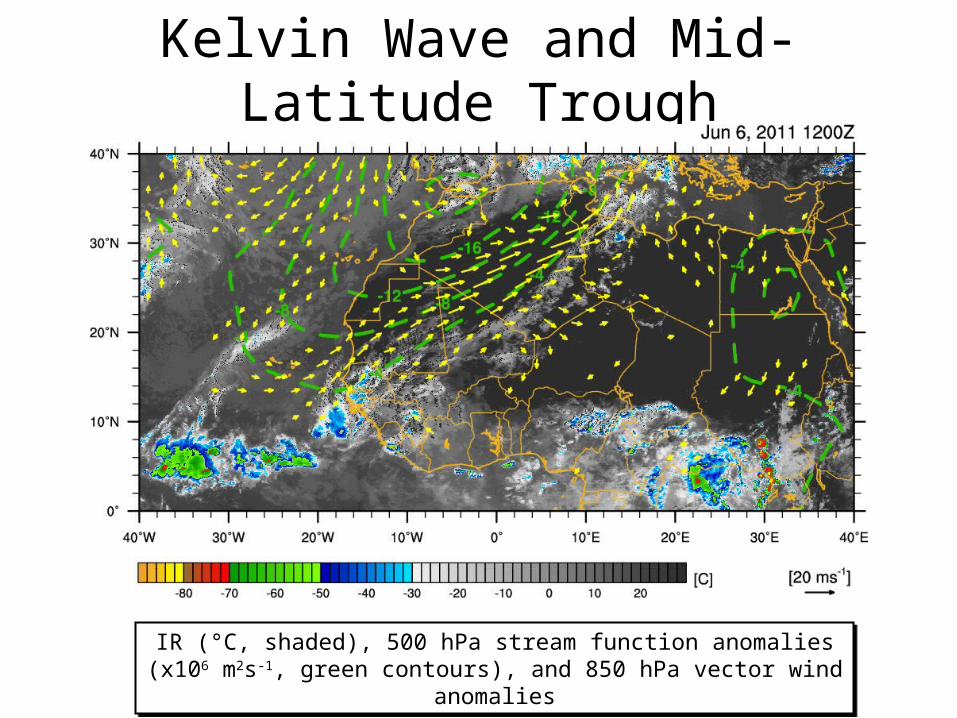
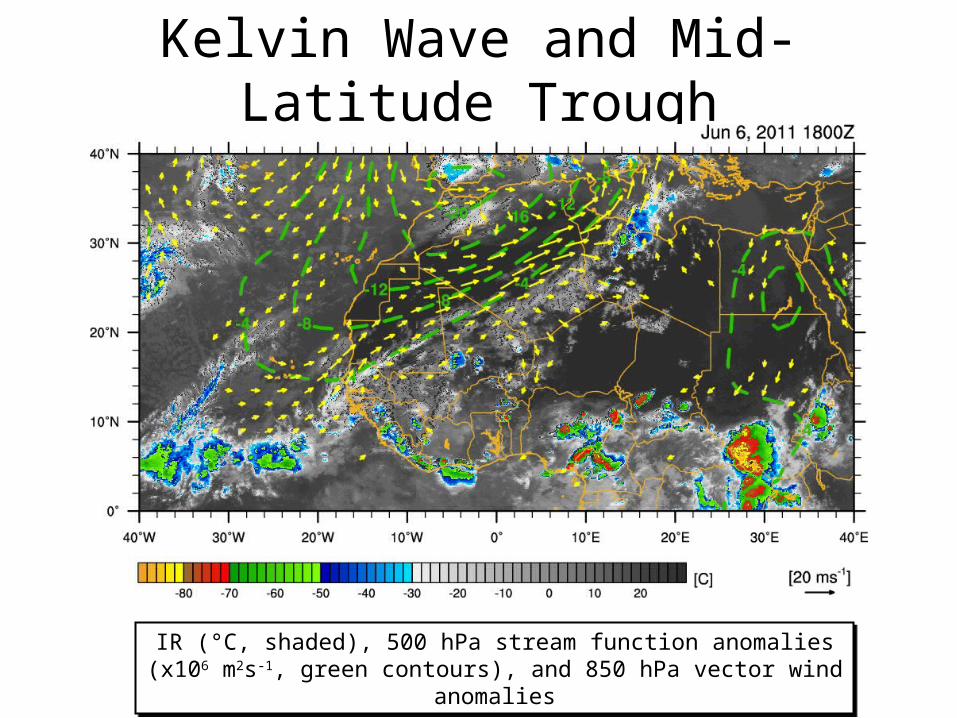
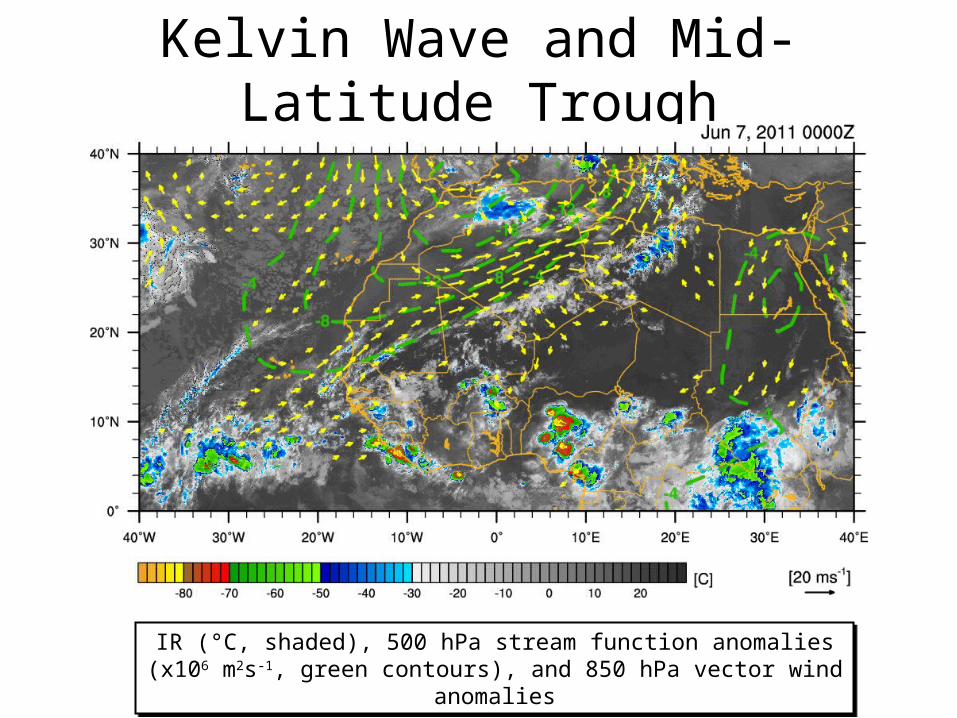
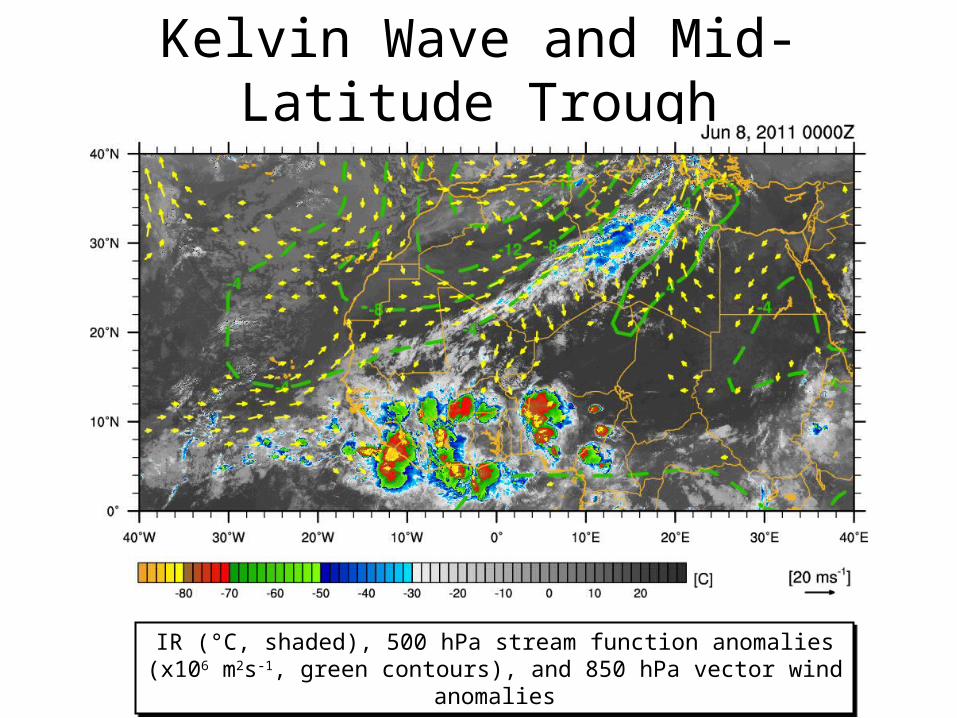
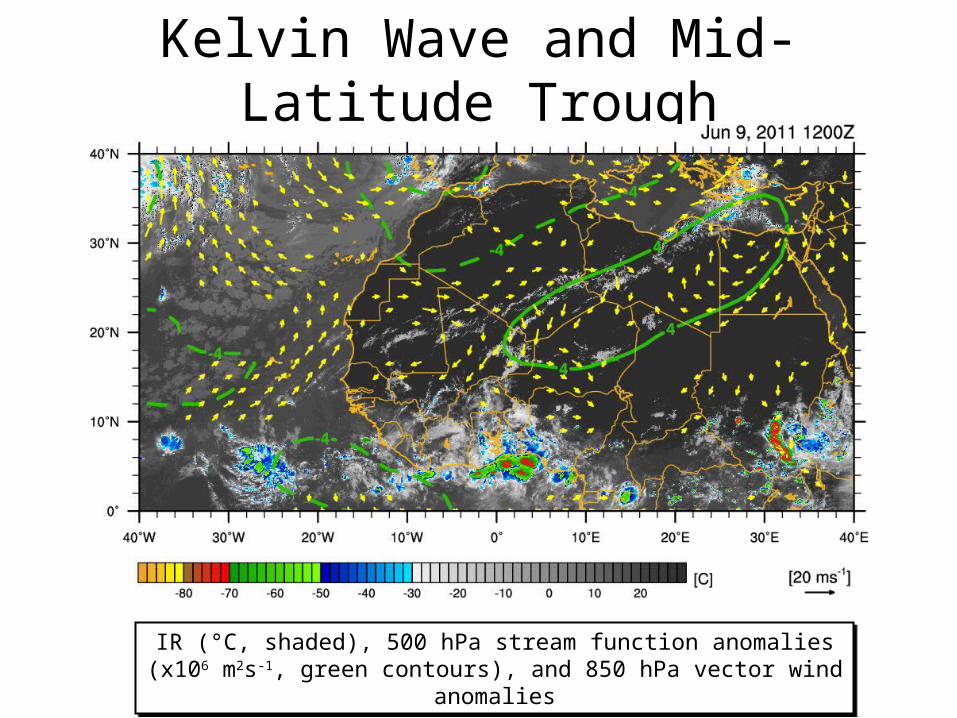
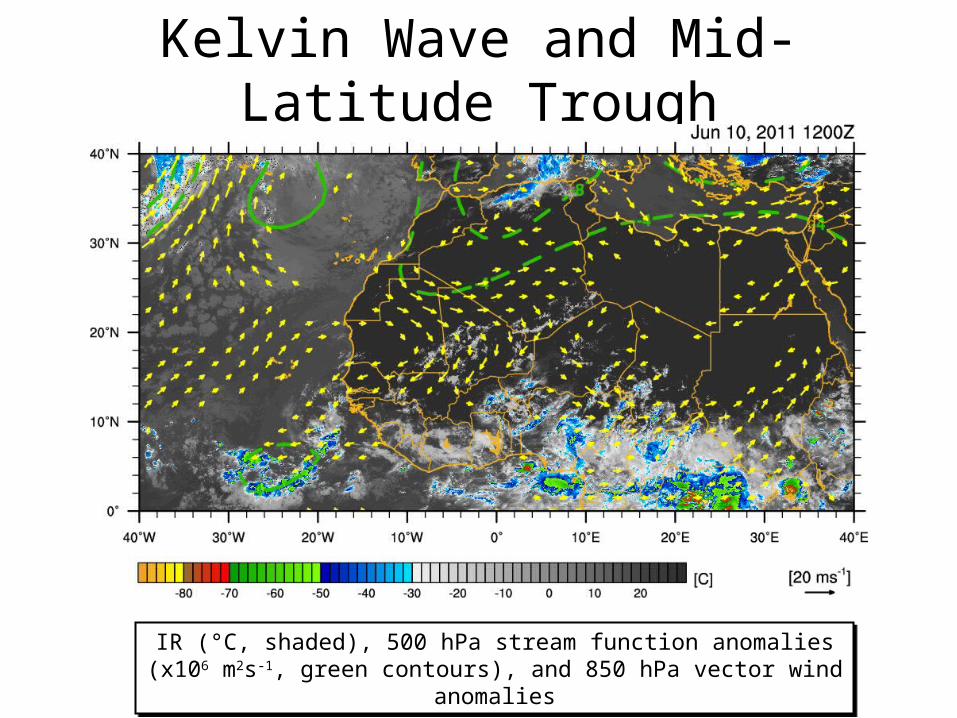
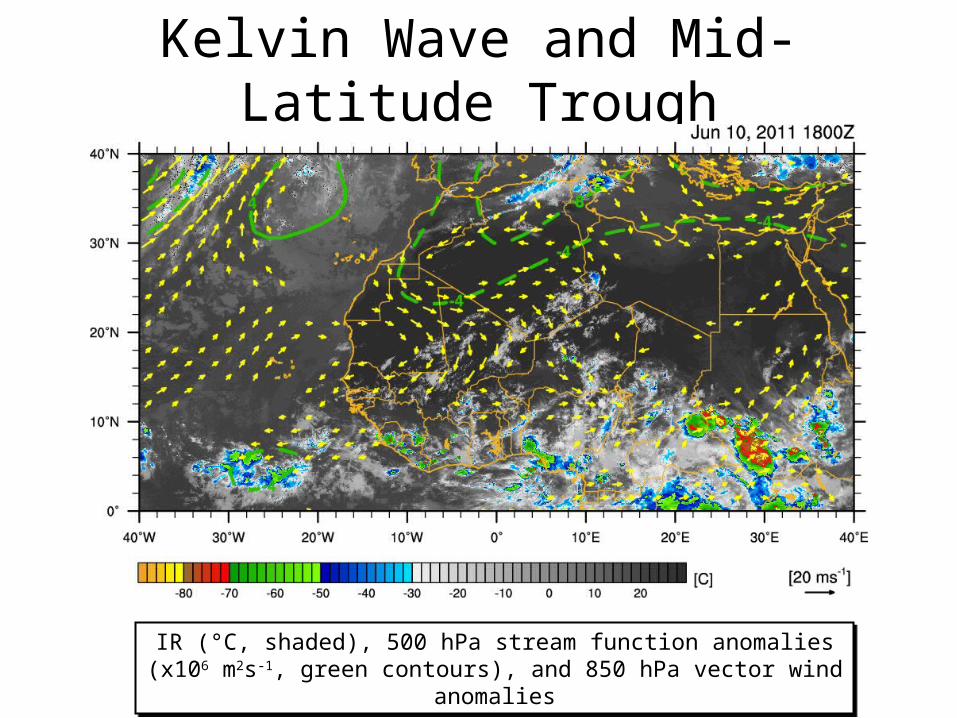
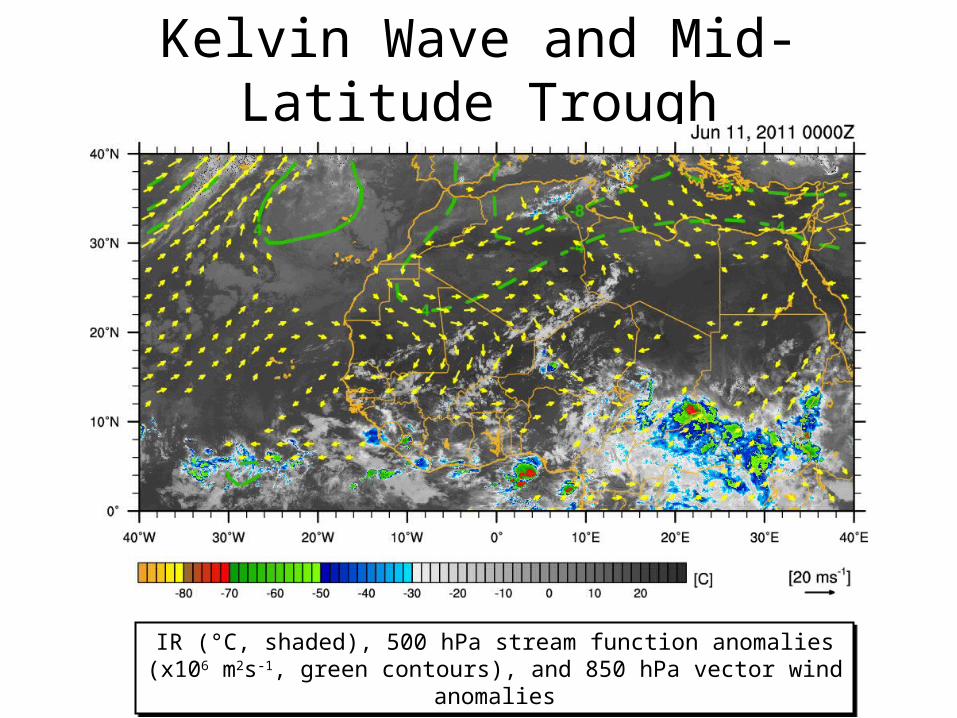
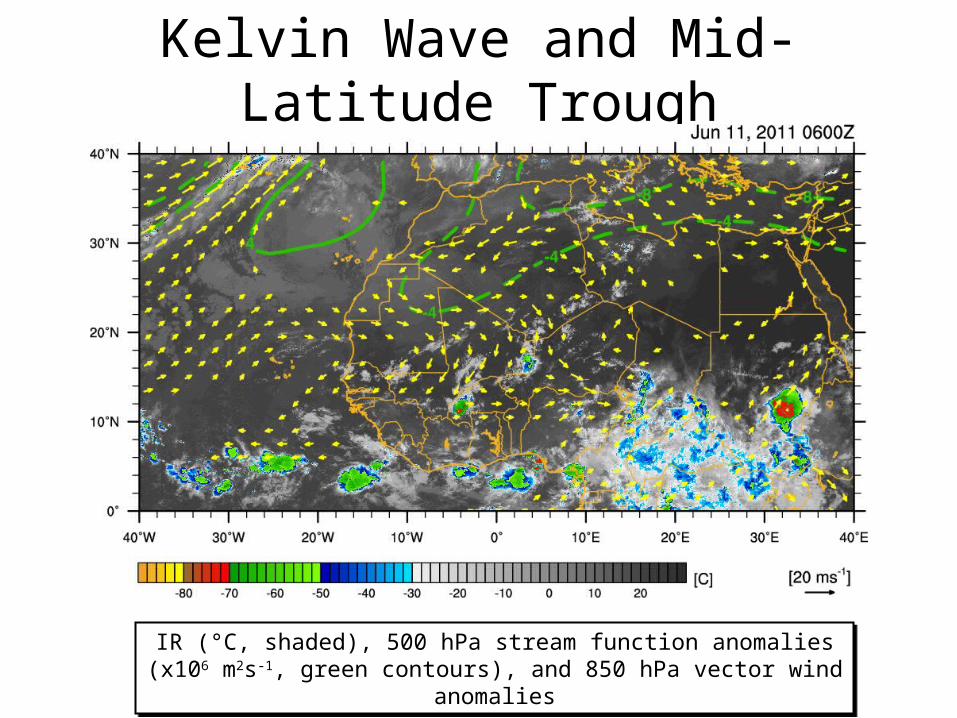
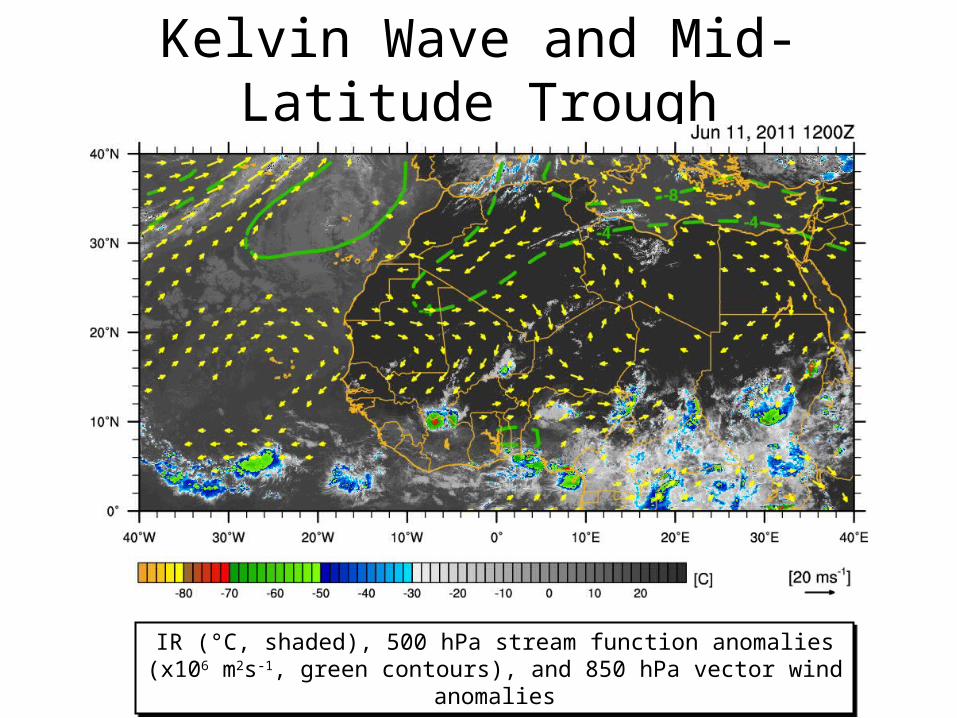
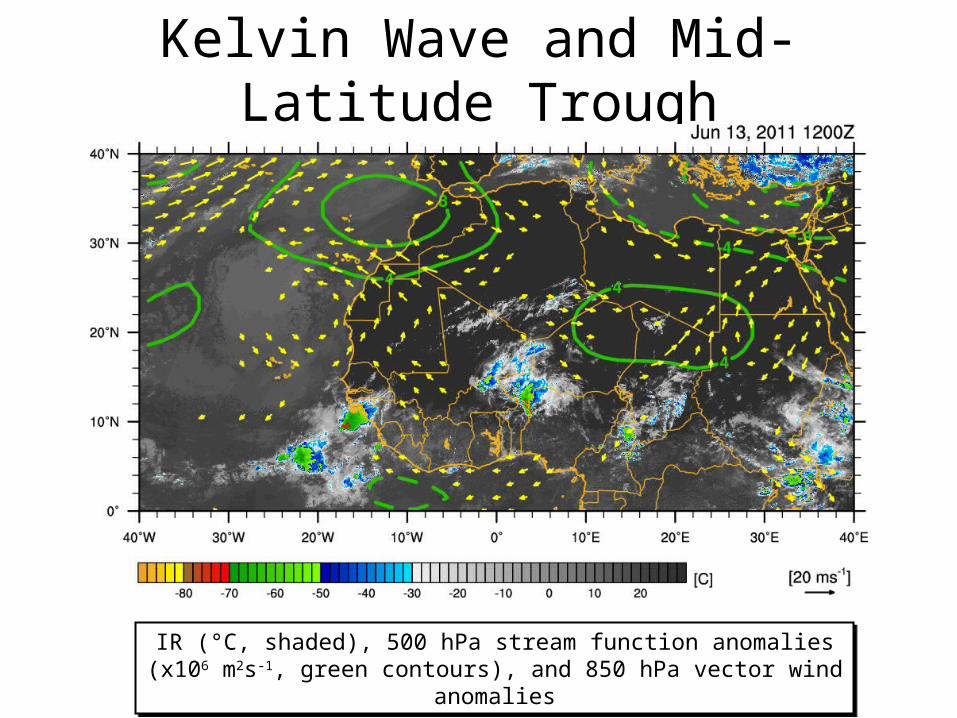
Kelvin Wave and Mid-Latitude Trough
IR (°C, shaded), 500 hPa stream function anomalies (x106 m2s-1, green contours), and 850 hPa vector wind anomalies
IR (°C, shaded), 500 hPa stream function anomalies (x106 m2s-1, green contours), and 850 hPa vector wind anomalies

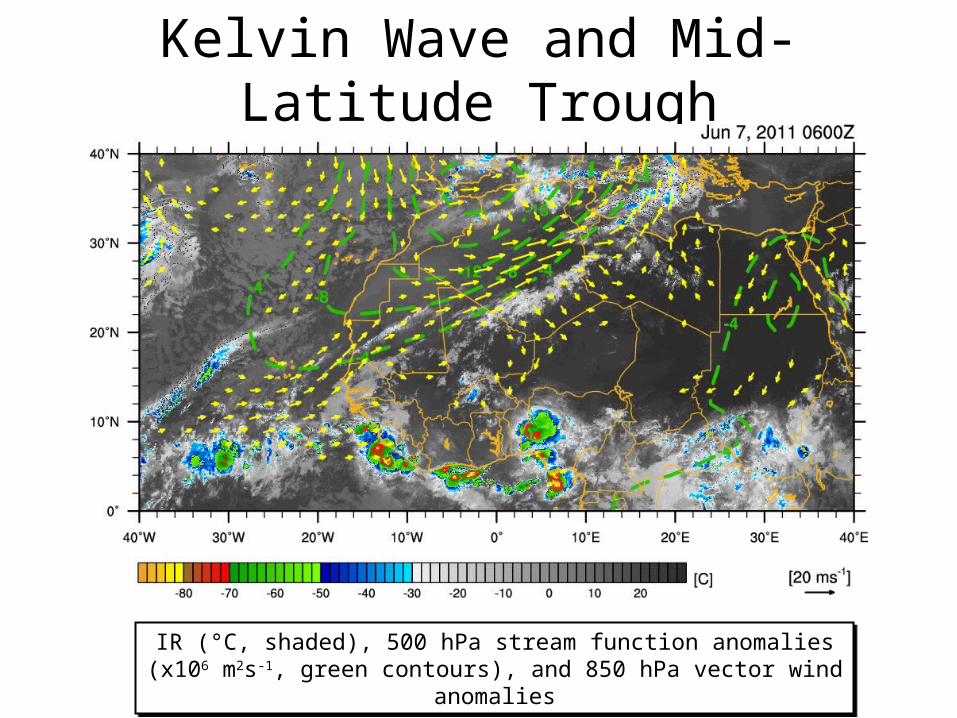
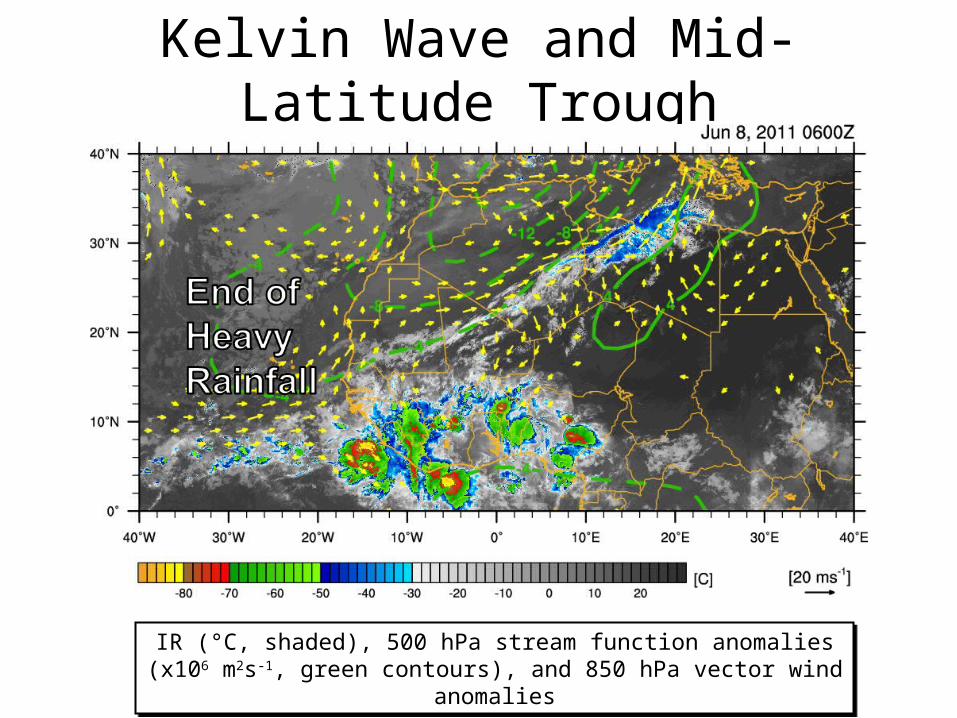
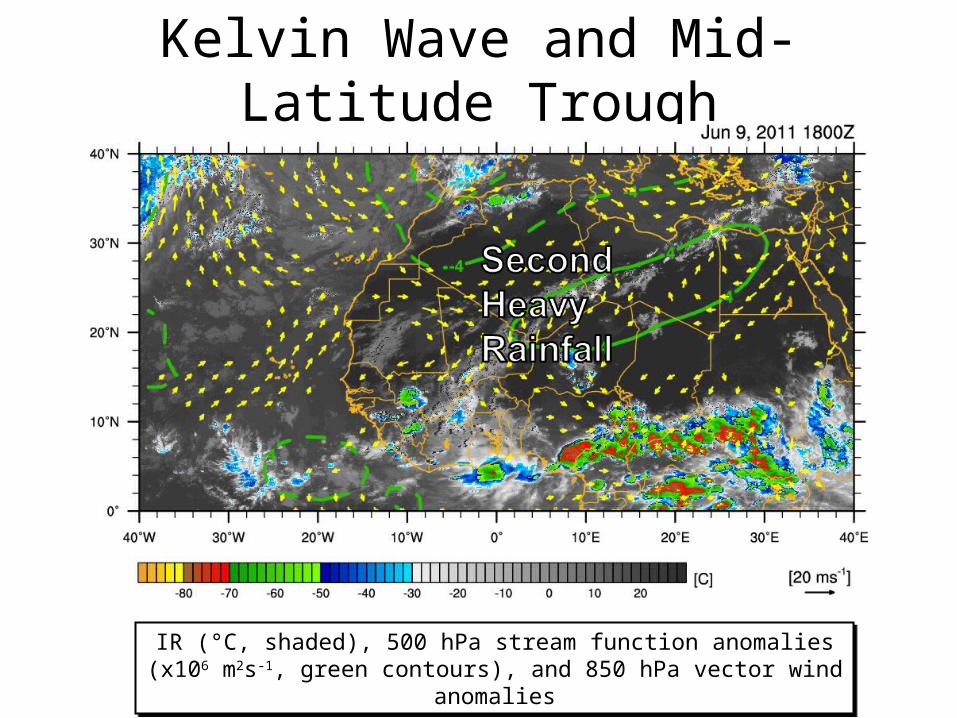
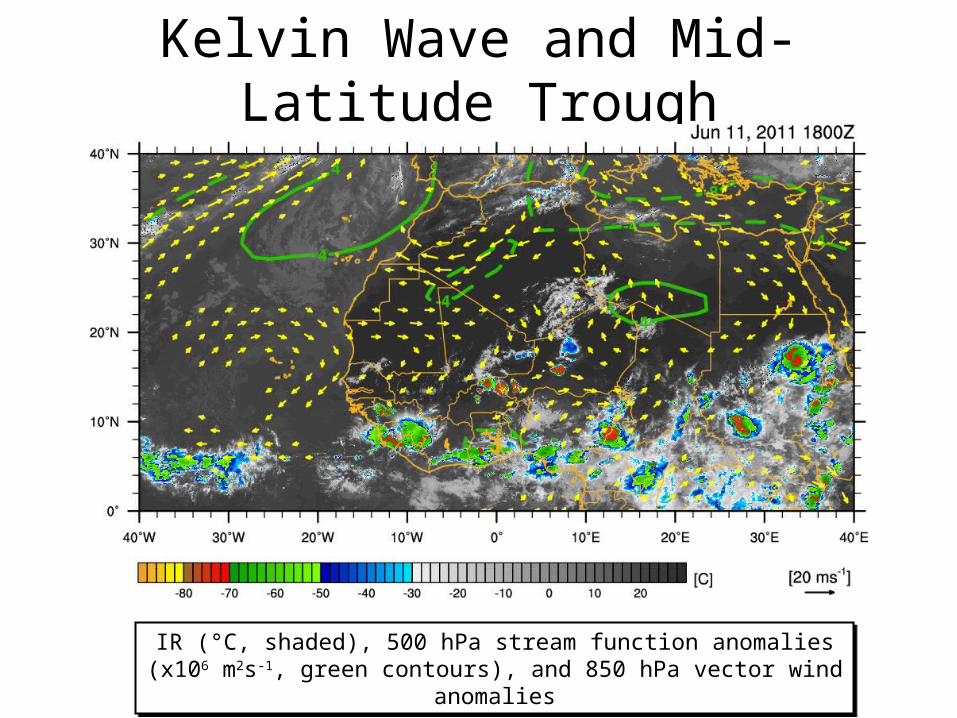
Kelvin Wave and Mid-Latitude Trough
IR (°C, shaded), 500 hPa stream function anomalies (x106 m2s-1, green contours), and 850 hPa vector wind anomalies
IR (°C, shaded), 500 hPa stream function anomalies (x106 m2s-1, green contours), and 850 hPa vector wind anomalies
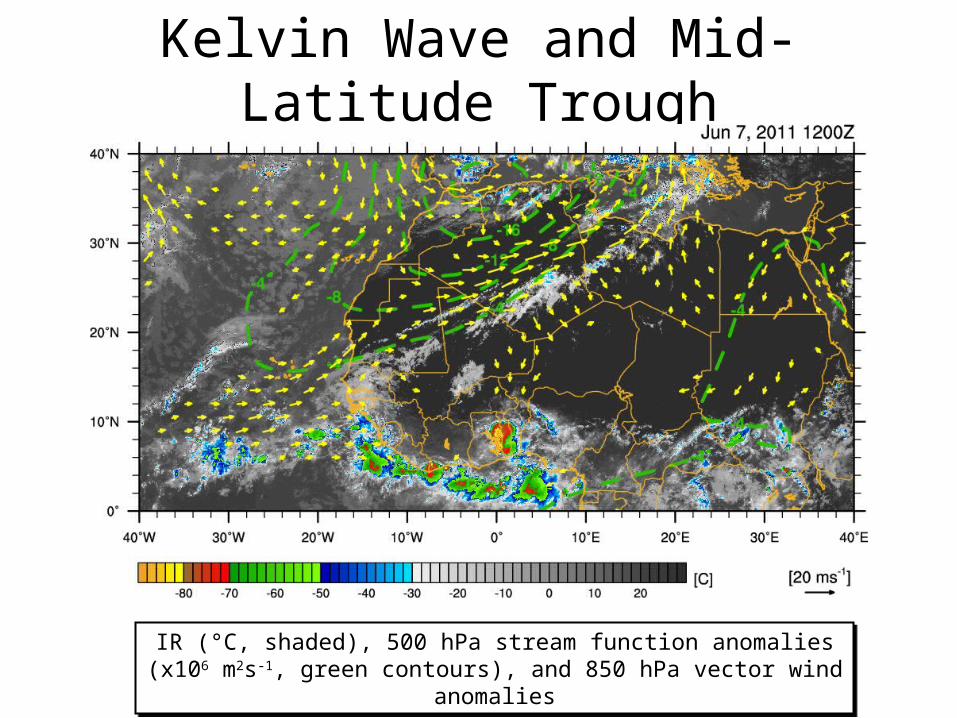
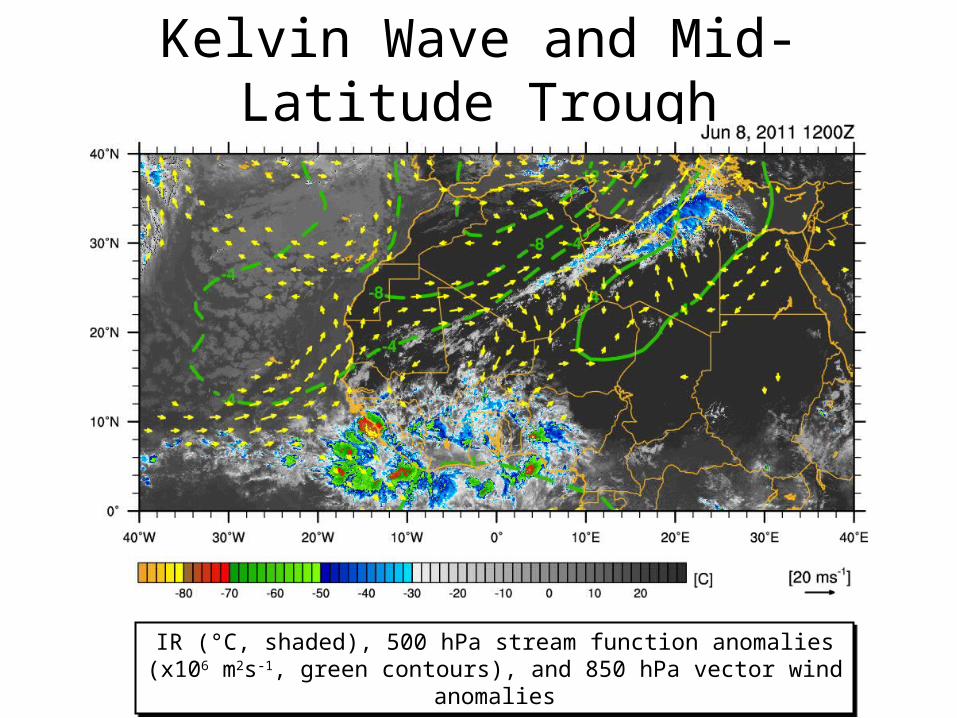
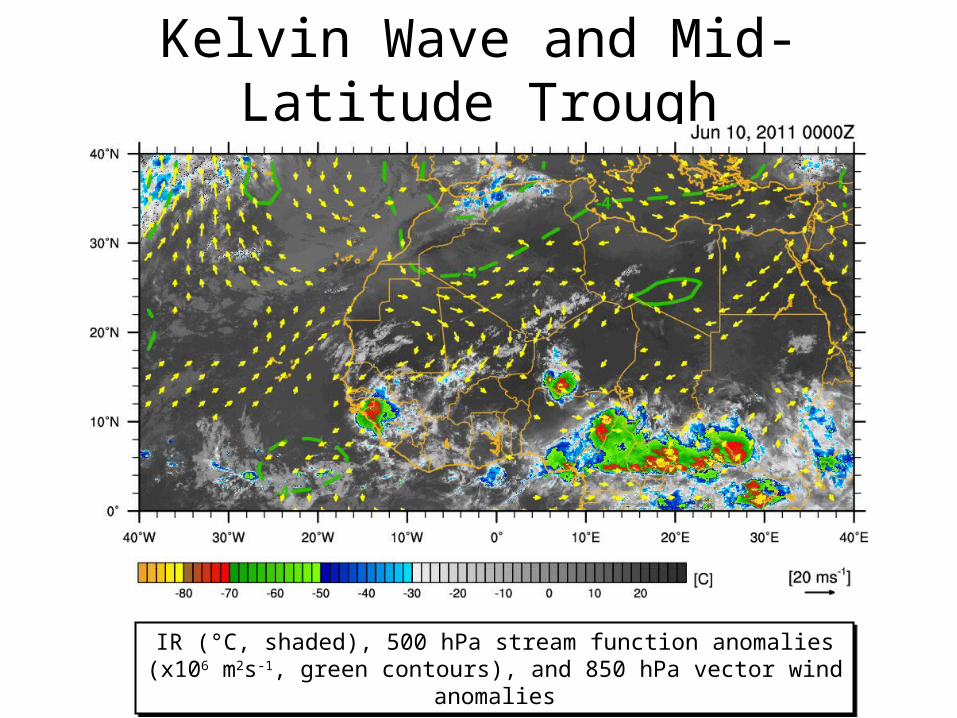
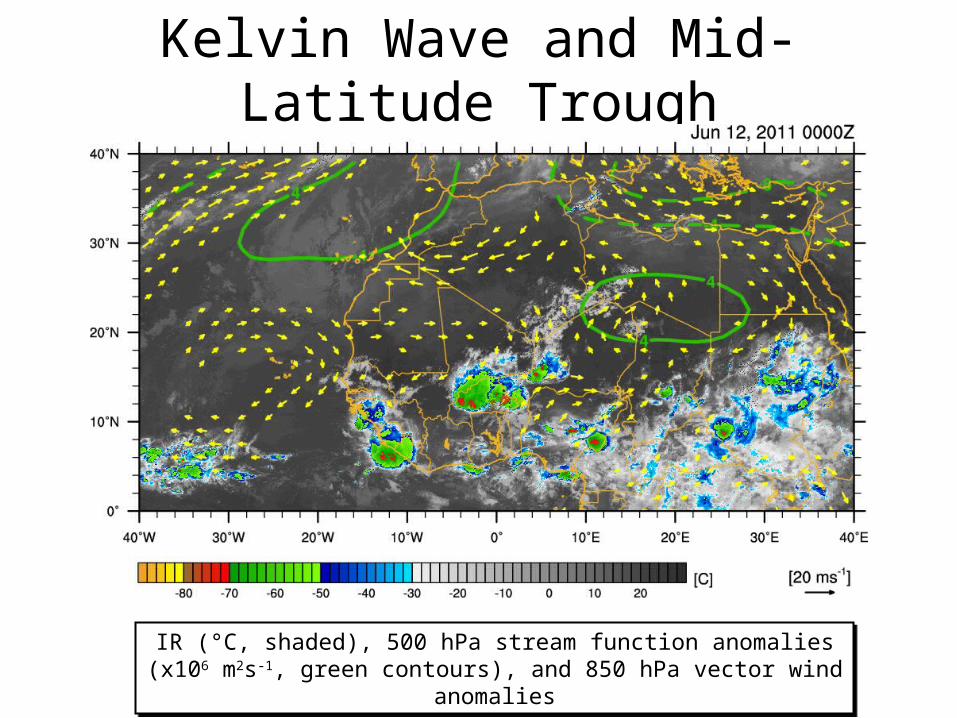
Kelvin Wave and Mid-Latitude Trough
IR (°C, shaded), 500 hPa stream function anomalies (x106 m2s-1, green contours), and 850 hPa vector wind anomalies
IR (°C, shaded), 500 hPa stream function anomalies (x106 m2s-1, green contours), and 850 hPa vector wind anomalies
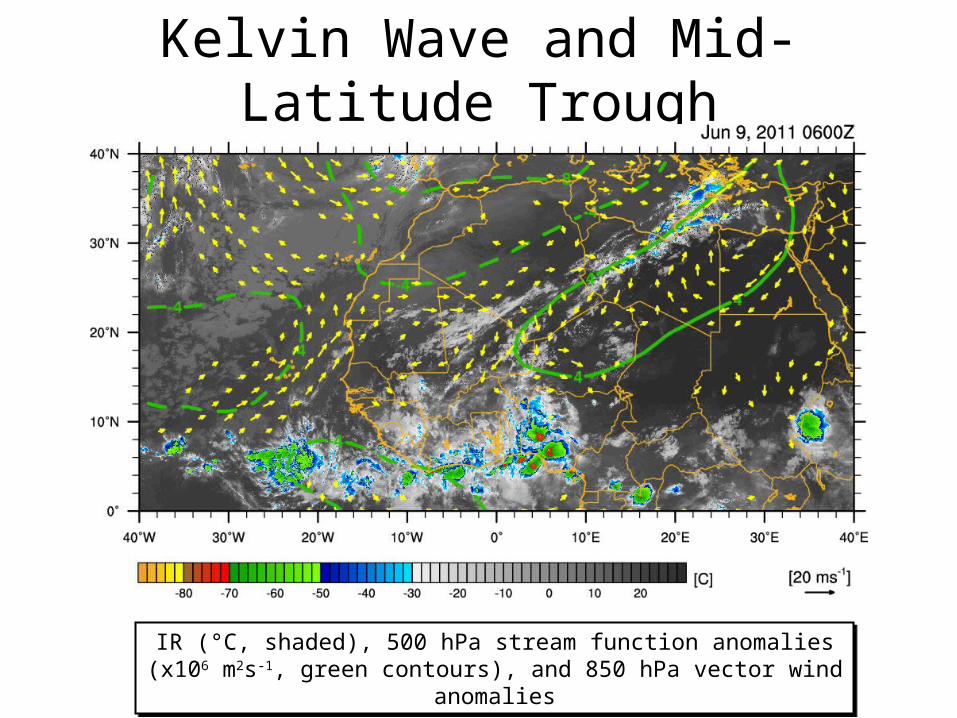
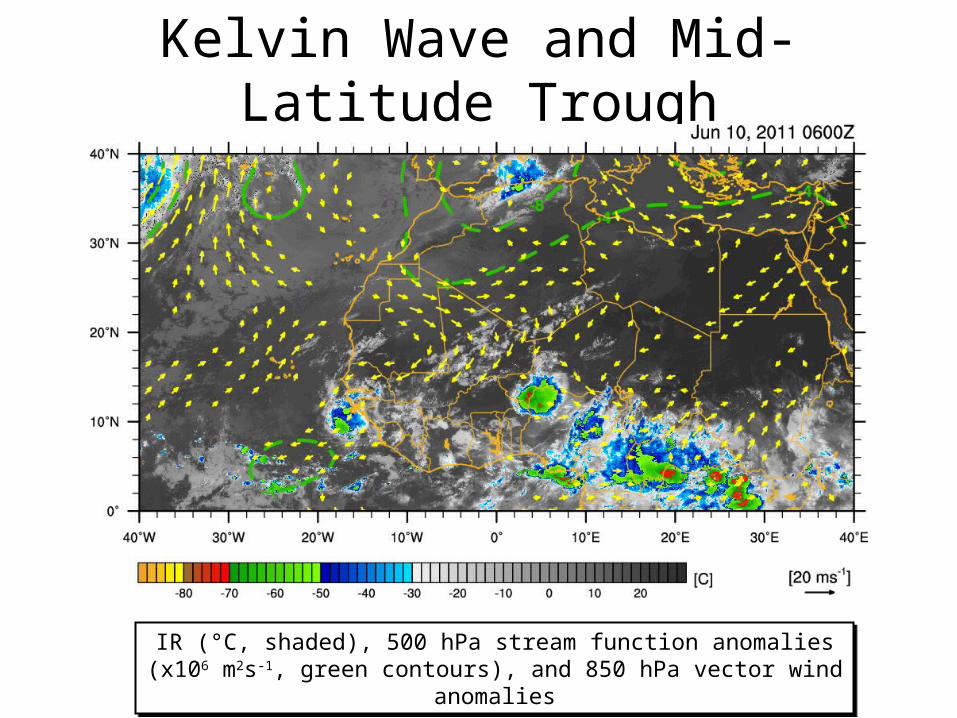
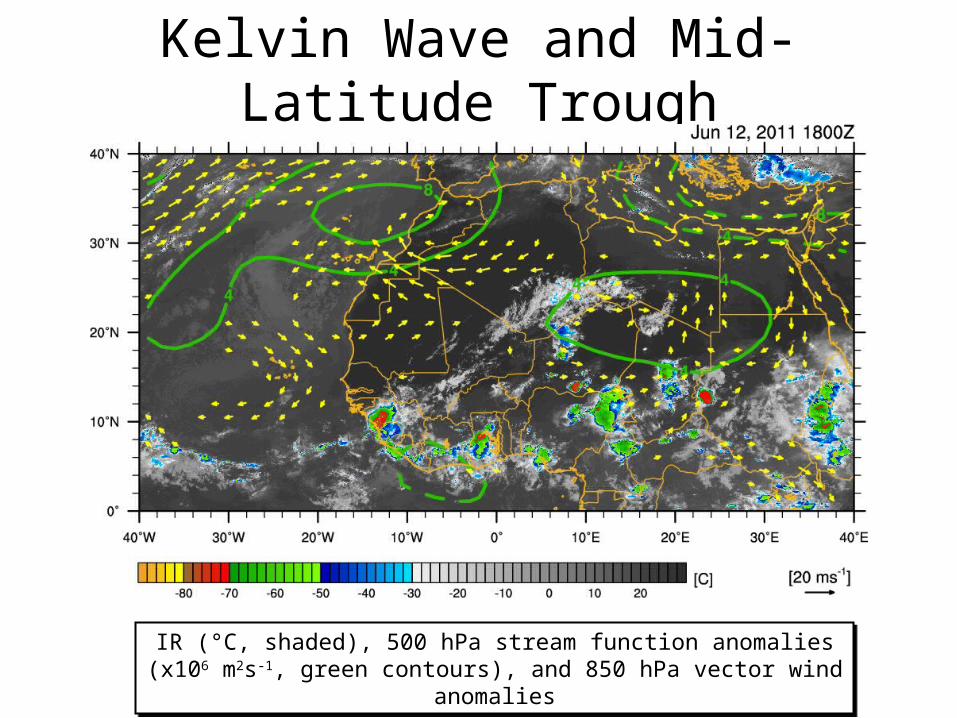
Kelvin Wave and Mid-Latitude Trough
IR (°C, shaded), 500 hPa stream function anomalies (x106 m2s-1, green contours), and 850 hPa vector wind anomalies
IR (°C, shaded), 500 hPa stream function anomalies (x106 m2s-1, green contours), and 850 hPa vector wind anomalies
Kelvin Wave and Mid-Latitude Trough
IR (°C, shaded), 500 hPa stream function anomalies (x106 m2s-1, green contours), and 850 hPa vector wind anomalies
IR (°C, shaded), 500 hPa stream function anomalies (x106 m2s-1, green contours), and 850 hPa vector wind anomalies
Kelvin Wave and Mid-Latitude Trough
IR (°C, shaded), 500 hPa stream function anomalies (x106 m2s-1, green contours), and 850 hPa vector wind anomalies
IR (°C, shaded), 500 hPa stream function anomalies (x106 m2s-1, green contours), and 850 hPa vector wind anomalies
Kelvin Wave and Mid-Latitude Trough
IR (°C, shaded), 500 hPa stream function anomalies (x106 m2s-1, green contours), and 850 hPa vector wind anomalies
IR (°C, shaded), 500 hPa stream function anomalies (x106 m2s-1, green contours), and 850 hPa vector wind anomalies
Kelvin Wave and Mid-Latitude Trough
IR (°C, shaded), 500 hPa stream function anomalies (x106 m2s-1, green contours), and 850 hPa vector wind anomalies
IR (°C, shaded), 500 hPa stream function anomalies (x106 m2s-1, green contours), and 850 hPa vector wind anomalies
Kelvin Wave and Mid-Latitude Trough
IR (°C, shaded), 500 hPa stream function anomalies (x106 m2s-1, green contours), and 850 hPa vector wind anomalies
IR (°C, shaded), 500 hPa stream function anomalies (x106 m2s-1, green contours), and 850 hPa vector wind anomalies
Kelvin Wave and Mid-Latitude Trough
IR (°C, shaded), 500 hPa stream function anomalies (x106 m2s-1, green contours), and 850 hPa vector wind anomalies
IR (°C, shaded), 500 hPa stream function anomalies (x106 m2s-1, green contours), and 850 hPa vector wind anomalies
Kelvin Wave and Mid-Latitude Trough
IR (°C, shaded), 500 hPa stream function anomalies (x106 m2s-1, green contours), and 850 hPa vector wind anomalies
IR (°C, shaded), 500 hPa stream function anomalies (x106 m2s-1, green contours), and 850 hPa vector wind anomalies

Kelvin Wave and Mid-Latitude Trough
IR (°C, shaded), 500 hPa stream function anomalies (x106 m2s-1, green contours), and 850 hPa vector wind anomalies
IR (°C, shaded), 500 hPa stream function anomalies (x106 m2s-1, green contours), and 850 hPa vector wind anomalies

Kelvin Wave and Mid-Latitude Trough
IR (°C, shaded), 500 hPa stream function anomalies (x106 m2s-1, green contours), and 850 hPa vector wind anomalies
IR (°C, shaded), 500 hPa stream function anomalies (x106 m2s-1, green contours), and 850 hPa vector wind anomalies
Kelvin Wave and Mid-Latitude Trough
IR (°C, shaded), 500 hPa stream function anomalies (x106 m2s-1, green contours), and 850 hPa vector wind anomalies
IR (°C, shaded), 500 hPa stream function anomalies (x106 m2s-1, green contours), and 850 hPa vector wind anomalies
Kelvin Wave and Mid-Latitude Trough
IR (°C, shaded), 500 hPa stream function anomalies (x106 m2s-1, green contours), and 850 hPa vector wind anomalies
IR (°C, shaded), 500 hPa stream function anomalies (x106 m2s-1, green contours), and 850 hPa vector wind anomalies
Kelvin Wave and Mid-Latitude Trough
IR (°C, shaded), 500 hPa stream function anomalies (x106 m2s-1, green contours), and 850 hPa vector wind anomalies
IR (°C, shaded), 500 hPa stream function anomalies (x106 m2s-1, green contours), and 850 hPa vector wind anomalies
Kelvin Wave and Mid-Latitude Trough
IR (°C, shaded), 500 hPa stream function anomalies (x106 m2s-1, green contours), and 850 hPa vector wind anomalies
IR (°C, shaded), 500 hPa stream function anomalies (x106 m2s-1, green contours), and 850 hPa vector wind anomalies
Kelvin Wave and Mid-Latitude Trough
IR (°C, shaded), 500 hPa stream function anomalies (x106 m2s-1, green contours), and 850 hPa vector wind anomalies
IR (°C, shaded), 500 hPa stream function anomalies (x106 m2s-1, green contours), and 850 hPa vector wind anomalies
Kelvin Wave and Mid-Latitude Trough
IR (°C, shaded), 500 hPa stream function anomalies (x106 m2s-1, green contours), and 850 hPa vector wind anomalies
IR (°C, shaded), 500 hPa stream function anomalies (x106 m2s-1, green contours), and 850 hPa vector wind anomalies
Kelvin Wave and Mid-Latitude Trough
IR (°C, shaded), 500 hPa stream function anomalies (x106 m2s-1, green contours), and 850 hPa vector wind anomalies
IR (°C, shaded), 500 hPa stream function anomalies (x106 m2s-1, green contours), and 850 hPa vector wind anomalies
Kelvin Wave and Mid-Latitude Trough
IR (°C, shaded), 500 hPa stream function anomalies (x106 m2s-1, green contours), and 850 hPa vector wind anomalies
IR (°C, shaded), 500 hPa stream function anomalies (x106 m2s-1, green contours), and 850 hPa vector wind anomalies
Kelvin Wave and Mid-Latitude Trough
IR (°C, shaded), 500 hPa stream function anomalies (x106 m2s-1, green contours), and 850 hPa vector wind anomalies
IR (°C, shaded), 500 hPa stream function anomalies (x106 m2s-1, green contours), and 850 hPa vector wind anomalies
Kelvin Wave and Mid-Latitude Trough
IR (°C, shaded), 500 hPa stream function anomalies (x106 m2s-1, green contours), and 850 hPa vector wind anomalies
IR (°C, shaded), 500 hPa stream function anomalies (x106 m2s-1, green contours), and 850 hPa vector wind anomalies
Kelvin Wave and Mid-Latitude Trough
IR (°C, shaded), 500 hPa stream function anomalies (x106 m2s-1, green contours), and 850 hPa vector wind anomalies
IR (°C, shaded), 500 hPa stream function anomalies (x106 m2s-1, green contours), and 850 hPa vector wind anomalies
Kelvin Wave and Mid-Latitude Trough
IR (°C, shaded), 500 hPa stream function anomalies (x106 m2s-1, green contours), and 850 hPa vector wind anomalies
IR (°C, shaded), 500 hPa stream function anomalies (x106 m2s-1, green contours), and 850 hPa vector wind anomalies

Kelvin Wave and Mid-Latitude Trough
IR (°C, shaded), 500 hPa stream function anomalies (x106 m2s-1, green contours), and 850 hPa vector wind anomalies
IR (°C, shaded), 500 hPa stream function anomalies (x106 m2s-1, green contours), and 850 hPa vector wind anomalies

Kelvin Wave and Mid-Latitude Trough
IR (°C, shaded), 500 hPa stream function anomalies (x106 m2s-1, green contours), and 850 hPa vector wind anomalies
IR (°C, shaded), 500 hPa stream function anomalies (x106 m2s-1, green contours), and 850 hPa vector wind anomalies
Kelvin Wave and Mid-Latitude Trough
IR (°C, shaded), 500 hPa stream function anomalies (x106 m2s-1, green contours), and 850 hPa vector wind anomalies
IR (°C, shaded), 500 hPa stream function anomalies (x106 m2s-1, green contours), and 850 hPa vector wind anomalies

Kelvin Wave and Mid-Latitude Trough
IR (°C, shaded), 500 hPa stream function anomalies (x106 m2s-1, green contours), and 850 hPa vector wind anomalies
IR (°C, shaded), 500 hPa stream function anomalies (x106 m2s-1, green contours), and 850 hPa vector wind anomalies

Kelvin Wave and Mid-Latitude Trough
IR (°C, shaded), 500 hPa stream function anomalies (x106 m2s-1, green contours), and 850 hPa vector wind anomalies
IR (°C, shaded), 500 hPa stream function anomalies (x106 m2s-1, green contours), and 850 hPa vector wind anomalies
Kelvin Wave and Mid-Latitude Trough
IR (°C, shaded), 500 hPa stream function anomalies (x106 m2s-1, green contours), and 850 hPa vector wind anomalies
IR (°C, shaded), 500 hPa stream function anomalies (x106 m2s-1, green contours), and 850 hPa vector wind anomalies
Case Summary
• A clear connection was found to an upper-level mid-latitude trough as indicated by stream function anomalies and cloud pattern.
• Both heavy rainfall periods began in the afternoon and persisted until early morning consistent with the typical diurnal cycle over West Africa.