Embed Size (px)
Citation preview
CONVECTIVE INSTABILITIES IN LIQUID FOAMS
Igor Veretennikov, Department of Chemistry and Biochemistry, University of Notre Dame, Notre Dame, IN 46556,
email: [email protected], phone: (574)-631-7601, fax: (574)-631-6652
James A. Glazier, Department of Physics, Indiana University, Bloomington, IN 47405
ABSTRACT The main goal of this work is to better understand foam behavior both on the Earth and in
microgravity conditions and to determine the relation between a foam’s structure and wetness and its rheological properties. Our experiments focused on the effects of the bubble size distribution (BSD) on the foam behavior under gradual or stepwise in the liquid flow rate and on the onset of the convective instability. We were able to show experimentally, that the BSD affects foam rheology very strongly so any theory must take foam texture into account.
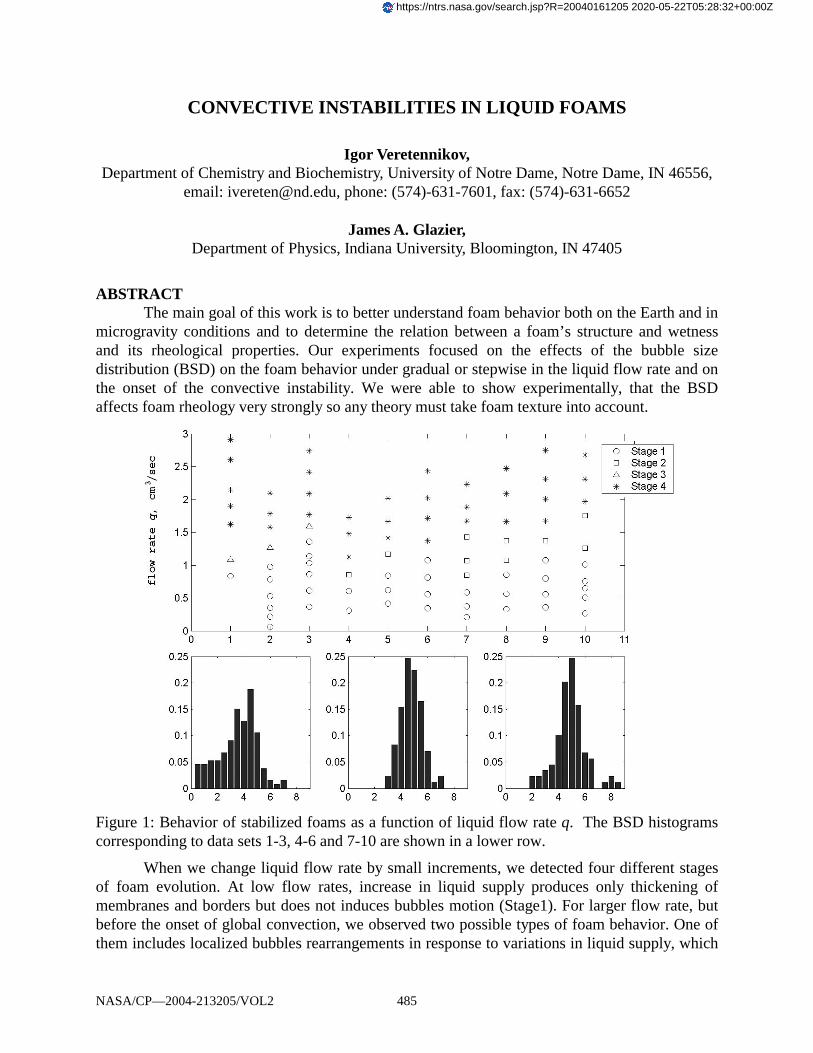
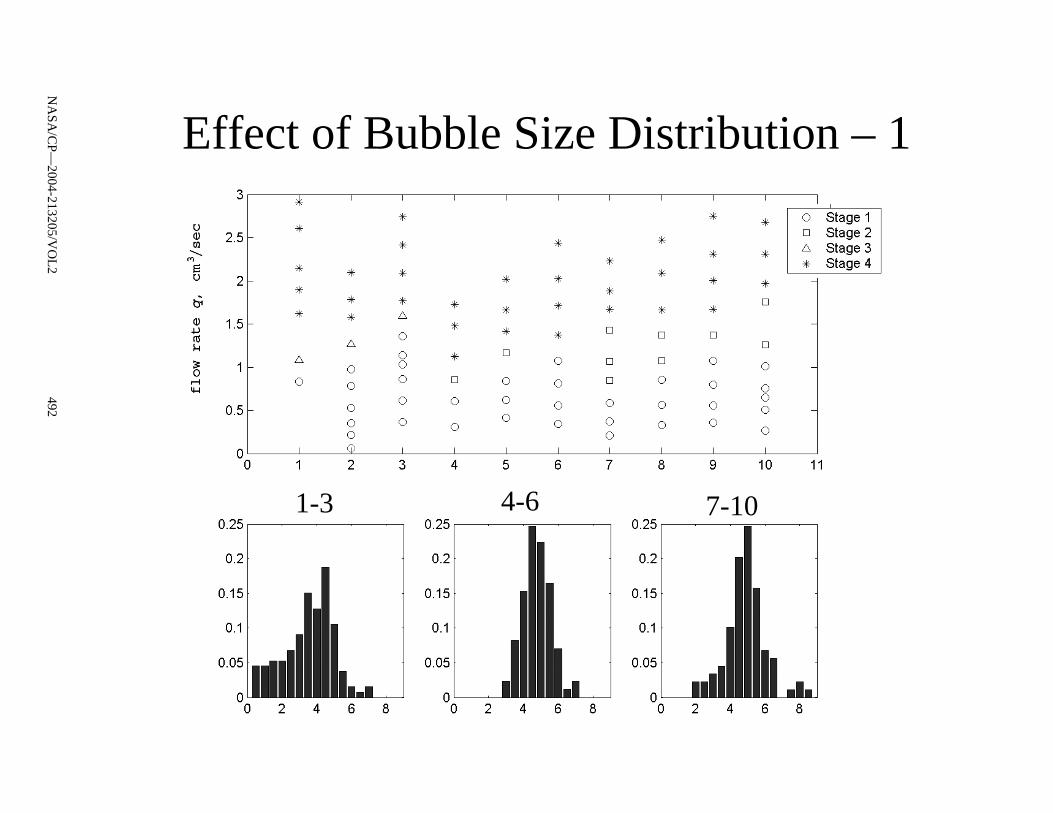
Figure 1: Behavior of stabilized foams as a function of liquid flow rate q. The BSD histograms corresponding to data sets 1-3, 4-6 and 7-10 are shown in a lower row.
When we change liquid flow rate by small increments, we detected four different stages of foam evolution. At low flow rates, increase in liquid supply produces only thickening of membranes and borders but does not induces bubbles motion (Stage1). For larger flow rate, but before the onset of global convection, we observed two possible types of foam behavior. One of them includes localized bubbles rearrangements in response to variations in liquid supply, which
NASA/CP—2004-213205/VOL2 485
https://ntrs.nasa.gov/search.jsp?R=20040161205 2020-05-22T05:28:32+00:00Z
stop after few minutes (Stage 2). For almost monodispersed foams (data sets 4-6) this stage presents for the narrow range of liquid flow rates or may be even absent. If the BSD is wide, with appreciable fraction of large bubbles (data sets 7-10), these rearrangements are typical for larger liquid flow rates range. Such “placing right bubbles to the right place” reduces stress in foam lattice and delays the onset of global convection for polydispersed foams. This stage was not observed for foams containing relatively large fraction of small bubbles. Instead, we have seen “scattered motion” (Stage 3): bubble cluster start to move, stops after few seconds or minutes, then similar motion begins at other place at the foam column, and so on. Such flow pattern persists as long as liquid flow rate does not change. Both Stages 2 and 3 for the same foam were never observed. “Scattered” motion always starts from the displacement of the smallest bubbles while the larger ones become involved later. Small bubbles, which may travel along the borders between large ones, may acts as increase effective viscosity of basic fluid, such that the passage of small bubbles between larger ones locally destabilizes the foam. The large-bubble motion stops after structure adjustment, but may start again if another cluster of small bubbles will be provided by incoming liquid flow.
We also examine the development of convective pattern under rapid increase in liquid flow rate from subcritical (Stage 1) to supercritical value (Stage 4). Typically, the melting wave propagates down along one side of the cell while the much slower upward foam flow develops on the other side. During few seconds after the flow rate change, there is no bubble motion while liquid flow through the foam slightly increases. After that, the entire foam downstream of the convective front moves down. Bubbles slightly compresses, but still do not moves relative to each other. When the melting wave passes few centimeters, the upward counterflow begins to develop. If the difference in flow rate is large, bubbles at the front of the wave may be significantly compressed. Behind the front, the borders thicknesses increase and bubbles may rotate while moving down. When the melting front reaches the bottom of the column, steady convective pattern develops. We captured the foam motion by digital video camera and measured the averaged image density. Borders are darker than lamellae, such that the average density provides information about liquid distribution in the foam. During the initial prewetting, the wetness of motionless foam increases uniformly over entire column. For the compression stage, we see the growth of wetness fluctuations and beginning of development of wetness maximum in front of approaching melting wave. The position of moving melting front is clearly seen on the vertical density profile. The wetness difference behind the front and downstream and the front slope are related to the wave speed and, in turn, to jump in liquid flow rates. When the convective roll is fully developed, vertical profiles of relative density again become uniform, while on horizontal profiles typically appear two maxima corresponding to downward and upward foam flows. The amplitude of these intensity maxima is roughly proportional to the foam velocity. The surprising is the overall decrease of the relative density during the compression stage. The physical mechanism behind it is not clear and requires additional study.
NASA/CP—2004-213205/VOL2 486
Convective Instability in Liquid Foam.
Igor Veretennikov† and James A. Glazier‡
† University of Notre Dame, Notre Dame, IN 46556
‡ Indiana University, Bloomington, IN 47405
NA
SA/C
P—2004-213205/V
OL
2487
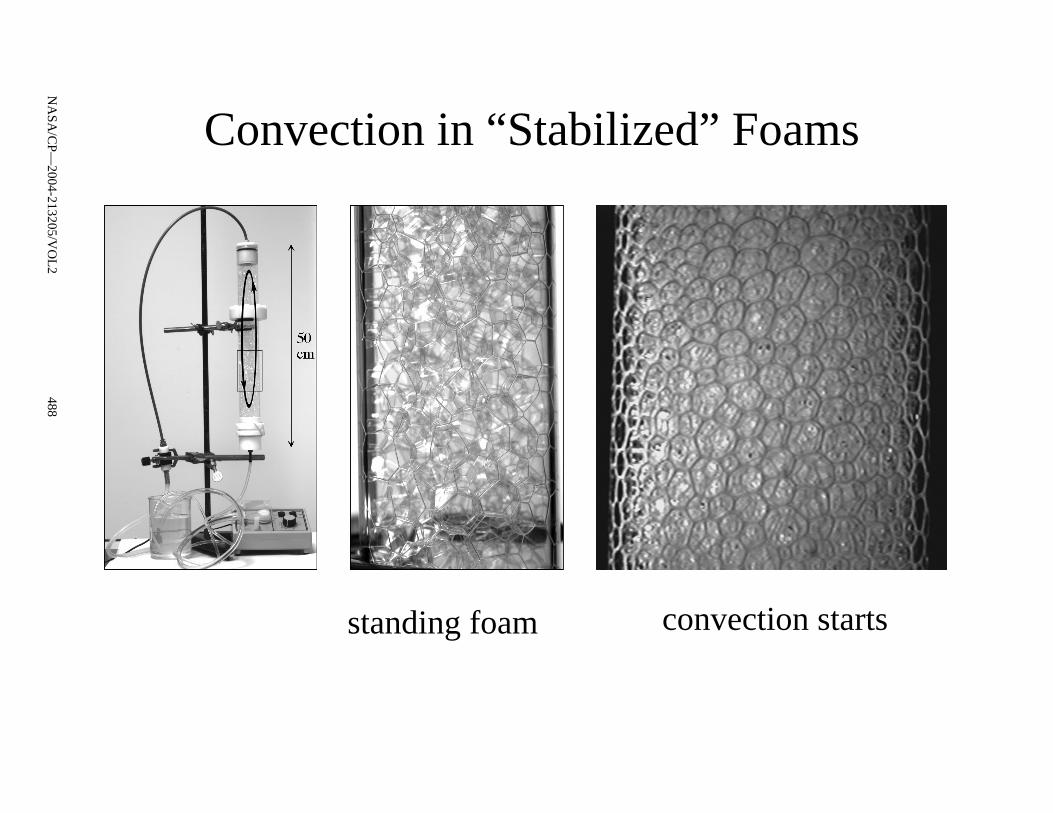
Convection in “Stabilized” Foams
standing foam convection starts
488N
ASA
/CP—
2004-213205/VO
L2
Stepwise Increase in Liquid Supply
• Compression wave propagates downward, preceding melting wave.
• Fast increase in thickness of Plateau membranes and Plateau borders.
• Second increase in thickness and adjustment of curvatures of the membranes and Plateau borders.
• The degree of compression is roughly proportional to the increase in liquid flow rate.
• Convective roll develops.
489N
ASA
/CP—
2004-213205/VO
L2
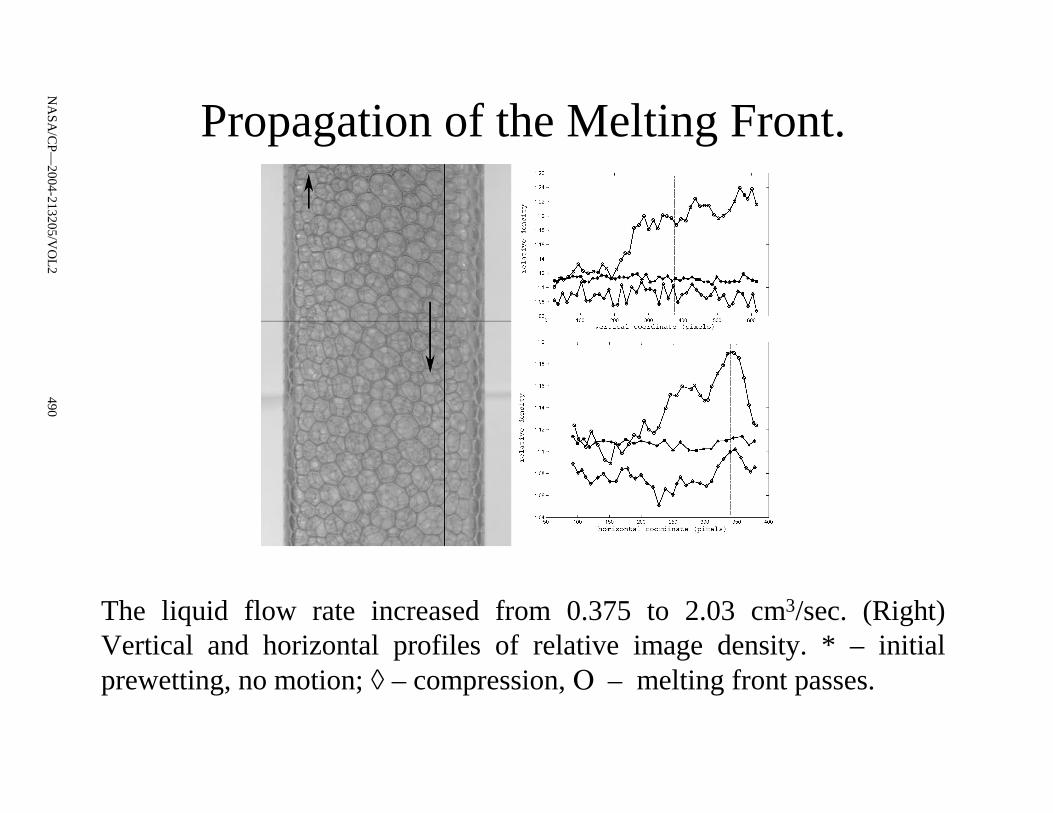
Propagation of the Melting Front.
The liquid flow rate increased from 0.375 to 2.03 cm3/sec. (Right) Vertical and horizontal profiles of relative image density. * – initialprewetting, no motion; ◊ – compression, Ο – melting front passes.
490N
ASA
/CP—
2004-213205/VO
L2
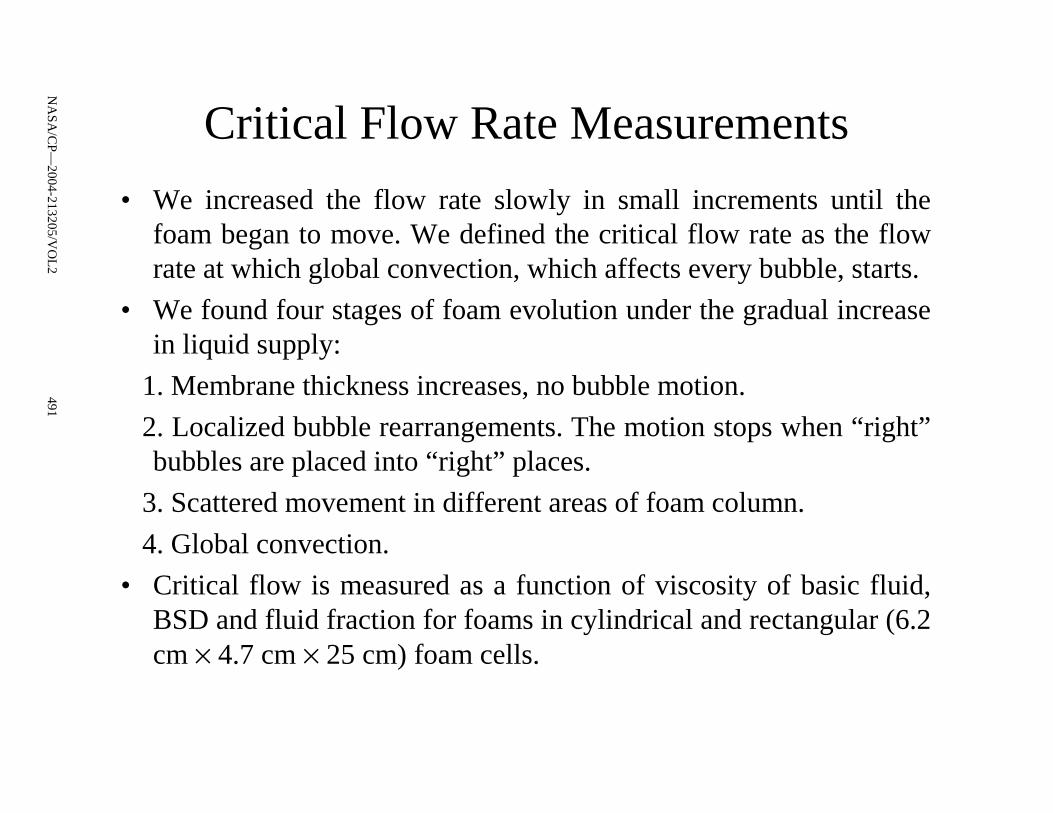
Critical Flow Rate Measurements
• We increased the flow rate slowly in small increments until the foam began to move. We defined the critical flow rate as the flow rate at which global convection, which affects every bubble, starts.
• We found four stages of foam evolution under the gradual increase in liquid supply:
1. Membrane thickness increases, no bubble motion.
2. Localized bubble rearrangements. The motion stops when “right” bubbles are placed into “right” places.
3. Scattered movement in different areas of foam column.
4. Global convection.
• Critical flow is measured as a function of viscosity of basic fluid, BSD and fluid fraction for foams in cylindrical and rectangular (6.2 cm × 4.7 cm × 25 cm) foam cells.
491N
ASA
/CP—
2004-213205/VO
L2
Effect of Bubble Size Distribution – 1
1-3 7-104-6
492N
ASA
/CP—
2004-213205/VO
L2
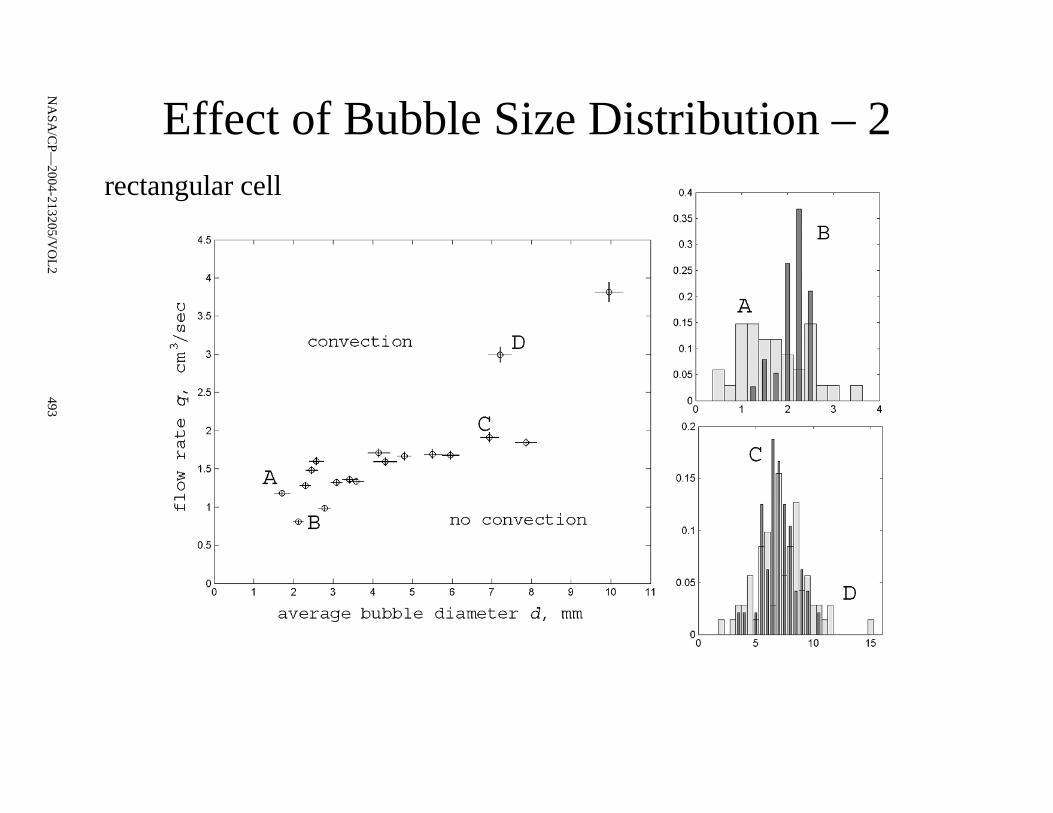
Effect of Bubble Size Distribution – 2rectangular cell
493N
ASA
/CP—
2004-213205/VO
L2
Effect of Bubble Size Distribution – 3
• Foams with smaller average bubble diameter are more UNSTABLE than those with larger average bubble diameter.
• Homogeneous foams are more UNSTABLE to global convection than polydisperse foams with the same average bubble diameter. Additional stress may appear within the foam lattice because uniform bubbles are not able to fill the cell perfectly.
• Foams are very STABLE when average bubble diameter is comparable with cell dimensions.
• The results for small bubbles are hardly reproducible.
494N
ASA
/CP—
2004-213205/VO
L2
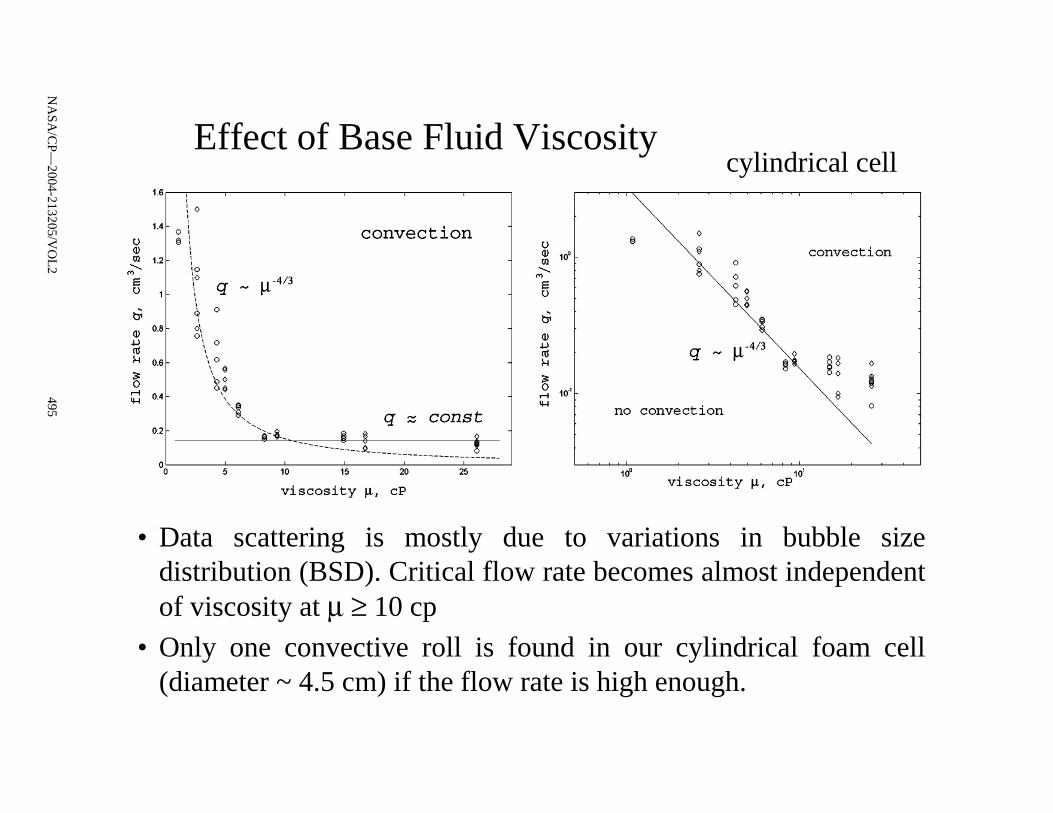
Effect of Base Fluid Viscositycylindrical cell
• Data scattering is mostly due to variations in bubble size distribution (BSD). Critical flow rate becomes almost independent of viscosity at µ ≥ 10 cp
• Only one convective roll is found in our cylindrical foam cell (diameter ~ 4.5 cm) if the flow rate is high enough.
495N
ASA
/CP—
2004-213205/VO
L2
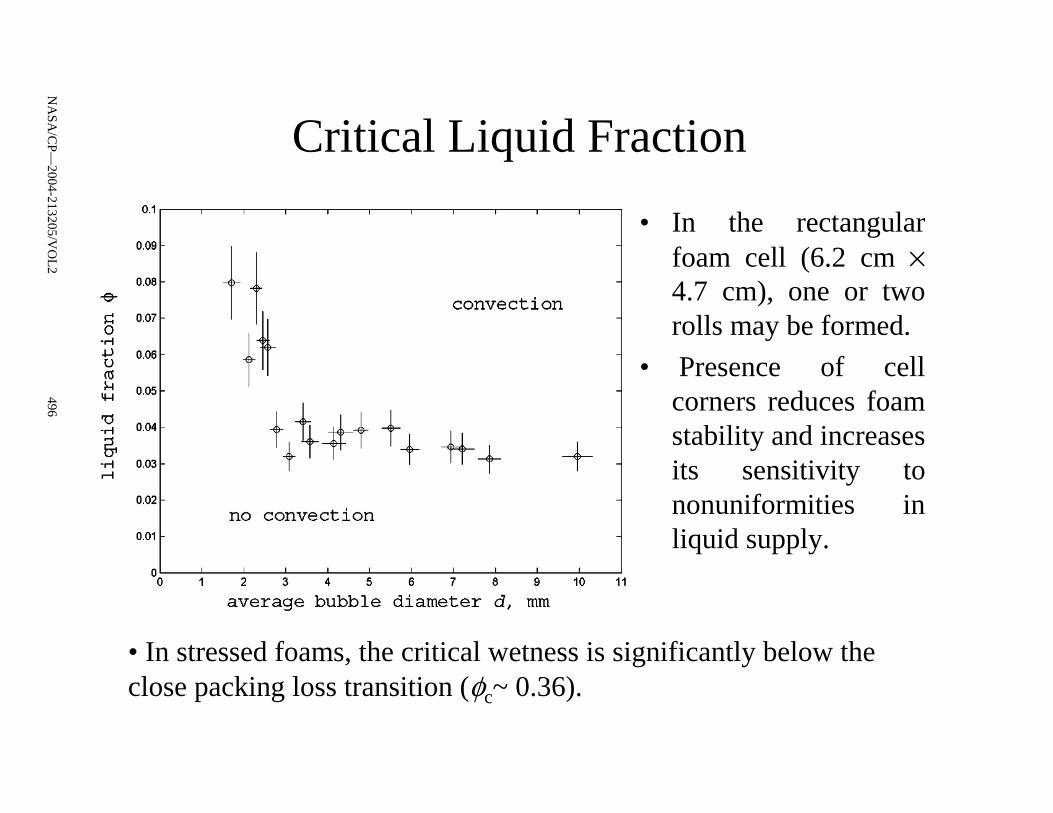
Critical Liquid Fraction
• In the rectangular foam cell (6.2 cm ×4.7 cm), one or two rolls may be formed.
• Presence of cell corners reduces foam stability and increases its sensitivity tononuniformities in liquid supply.
• In stressed foams, the critical wetness is significantly below the close packing loss transition (φc~ 0.36).
496N
ASA
/CP—
2004-213205/VO
L2
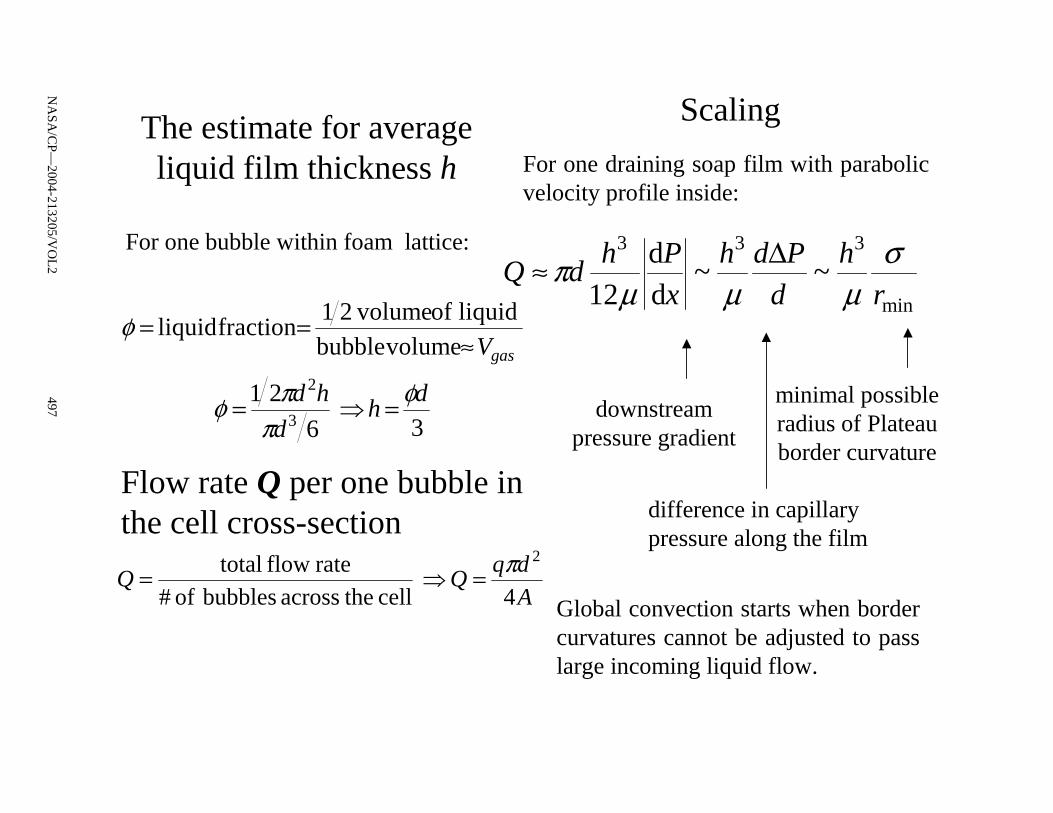
The estimate for average liquid film thickness h
For one bubble within foam lattice:
3
6
21
volumebubbleliquid of volume21
fraction liquid
3
2 dh
d
hd
Vgas
φπ
πφ
φ
=⇒=
≈==
Flow rate Q per one bubble in the cell cross-section
A
dqQQ
4
cell theacross bubbles of #rate flow total 2π=⇒=
For one draining soap film with parabolic velocity profile inside:
min
333
~~dd
12 r
h
d
Pdh
x
PhdQ
σµµµ
π ∆≈
downstream pressure gradient
minimal possible radius of Plateau border curvature
difference in capillary pressure along the film
Global convection starts when border curvatures cannot be adjusted to pass large incoming liquid flow.
Scaling
497N
ASA
/CP—
2004-213205/VO
L2
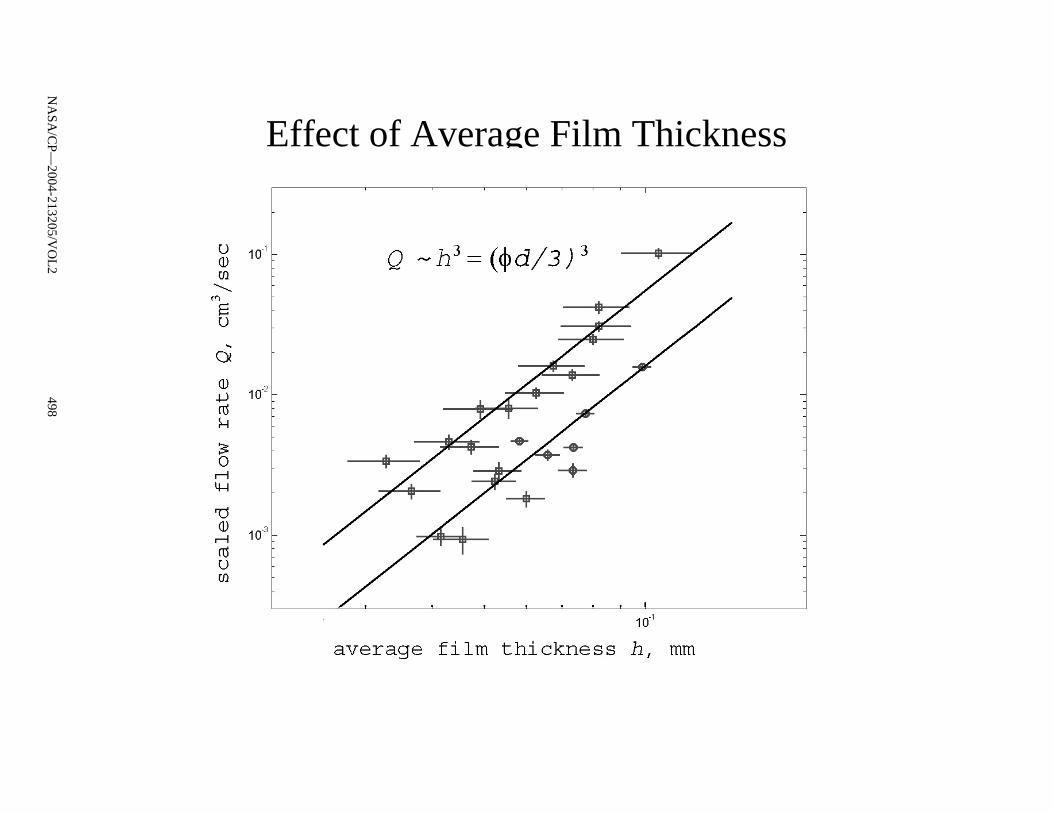
Effect of Average Film Thickness
498N
ASA
/CP—
2004-213205/VO
L2
Conclusions
• Stressed foams can undergo melting transition when foam wetness is significantly below the one which corresponds to the close packing loss transition.
• This melting transition may start when the balance between border curvatures (local pressure gradient) and local flow in membranes and boarders breaks down.
• The critical parameters for this transition depend heavily not only on the bubble size distribution but also on the spatial distributions of bubbles.
Acknowledgments
Financial support from NASA is greatly appreciated.Marius Asipauskas, Karl Fedje, Ivan Silva.
499N
ASA
/CP—
2004-213205/VO
L2


![Trace Formula for Noisy Flows - Personal Homepageshomepages.ulb.ac.be/~gaspard/G.JSP.02.pdf · chemical reactions, fluids beyond convective instabilities, or lasers [1]. The oscillations](https://img.pdfslide.us/doc/110x75/5f7dce640d1e2e34794a8e4d/trace-formula-for-noisy-flows-personal-gaspardgjsp02pdf-chemical-reactions.jpg)