Embed Size (px)
Citation preview

91
Convective Dynamics Issues at ~10km Grid-Resolution
Mitchell W. Moncrieff, Changhai Liu and Hsiao-ming Hsu
National Center for Atmospheric Research Boulder, Colorado, USA
Abstract
We employ hierarchical numerical simulations and convective dynamics to examine the representation of convective weather in high-resolution (next-generation) prediction models. Emphasis is on convective organization, a process that has been studied extensively in its own right but has enjoyed comparatively little attention in parameterization. This dearth of attention likely stems from difficulties in representing convective dynamics that, we argue, are particularly important at a grid-resolution ~10 km. At this resolution numerical models do not have cloud-resolving capability and traditional convective parameterization is ill-conditioned. Key aspects include the propagation and coherent airflow associated with large-scale convective organization, in which environmental shear is key. Relationships among shear and CAPE-generation in baroclinic environments are particularly important in regard to episodes of severe convective weather, but shear-effects are not represented in traditional convective parameterizations. Datasets from the precipitation radar network (NEXRAD) deployed over the continental United States. are used to evaluate a hierarchy of numerical simulations: i) convective parameterization at ~10 km grid-resolution where the simulated precipitation stems partly from convective parameterization and partly from under-resolved explicit circulations; ii) explicit convection at ~10-km grid resolution with convective parameterization disabled; iii) cloud-system-resolving simulation at a grid-resolution ~ 1-km. The simulation results are interpreted using a dynamical model and statistical-dynamical analysis. Our results are pertinent to the interaction among orographic forcing, environmental shear and traveling organized in several regions of the world besides the United States. A prototype representation of stratiform heating and mesoscale downdrafts improves the parameterization of traveling convection. Obtaining reference thermodynamic profiles that accurately represent summertime convection over the continental United States is likely to improve the Betts-Miller convective parameterization. The reported work is detailed in Moncrieff et al. (2005).
1. Introduction The ubiquity of convective organization at ~100 km scale in tropical easterly waves was an unanticipated result, more than three decades ago in GATE, the GARP Atlantic Tropical Experiment in the tropical eastern Atlantic (Houze and Betts 1981). Using measurements of black-body temperature from geostationary satellites as a proxy of deep convection, Laing and Fritsch (1997) imply a relationship among mesoscale convective complexes, orography and the mid-latitude/subtropical jet-streams. Precipitation radar and passive microwave instruments on the low-earth orbit satellite TRMM, the Tropical Rainfall Measuring Mission, show the ubiquity of traveling convective systems in the tropics and sub-tropics (Nesbitt et al. 2000).
The surface-based radar network (NEXRAD) deployed over the continental United States gives a direct measure of convective precipitation. In particular, the Carbone et al. (2002) analysis of NEXRAD data show the spatial-temporal distribution of episodes of precipitation associated with traveling organized convection, the precipitation streaks we use to evaluate the numerically simulated systems.
1.1. Thermodynamic forcing, dynamical control and organized convection
It has long been known that environmental shear has a powerful organizing effect on cumulonimbus convection (Ludlam 1980) with a propensity to evolve into coherent systems up to 1000 times the scale of the constituent cumulonimbus. Convective organization and accompanying severe weather tends to be associated with baroclinic environments, in association with relationships among the large-scale advection of temperature and moisture that determines the amplitude of CAPE, the convective available potential energy, and wind shear that externally controls convective dynamics. In particular, large-scale/synoptic-scale ascent

MONCRIEFF, M.W. ET AL.: CONVECTIVE DYNAMICS ISSUES AT ~10KM GRID-RESOLUTION
92
maintain high values of CAPE necessary for strong convective updrafts since, to first order, CAPE is proportional to the updraft kinetic energy and baroclinicity to maintain the vertical shear.
During summertime over the continental United States, traveling convective systems originate in the neighborhood of the Continental Divide, travel eastward and evolve into large nocturnal systems over the Great Plains (Fig. 1). These systems strongly affect the diurnal cycle of energy and water on a continental scale (Knievel et al. 2004).
- 1c 1 5 m s
+
NoonNoon Early next morningEarly next morning
CumuloCumulo--nimbusnimbus
~1000 km~1000 km
To first order, elevated solar heating To first order, elevated solar heating determines start position & start determines start position & start time of traveling convectiontime of traveling convection
MesoscaleMesoscaledowndraftdowndraft
++−
MCS = MCS = cumulonimbuscumulonimbus
familyfamily
Figure 1: Conceptual diagram of the evolution of traveling convection in the neighborhood of the Continental Divide. Cumulonimbus grow in response to elevated heating (baroclinic generation of horizontal vorticity) in shear flow. They evolve upscale into multi-scale systems over the Plains as scale-interaction among latent heating, shear flow, large-scale forcing in a strongly sheared environment. The timing of onset over mountains depends on synoptic conditions.
++ = =
LL
Parameterized Parameterized convective convective
heating heating
MesoscaleMesoscaleheating heating
MesoscaleMesoscale downdraft downdraft evaporative coolingevaporative cooling
MesoscaleMesoscalelatent heatinglatent heating
Dynamic Dynamic triggeringtriggering
Can we parameterize Can we parameterize this upscale process?this upscale process?
Stage 1: onsetStage 1: onset Stage 2: upscale developmentStage 2: upscale development
Stage 3: development ofStage 3: development ofmesoscalemesoscale circulationcirculation
nnnn
n + 1n + 1
nn n + 1n + 1
n + 2n + 2
Figure 2: Three stages in the evolution of multiscale convection and the rear-inflow -- a response to the latent-heat-generated pressure gradient. The leading convective region is represented by convective parameterization. The mesoscale downdraft and stratiform ascent is a dynamical response to parameterized heating.
The remarkable upscale evolution of convection is key to the convective organization process. It involves interaction among environmental shear, dynamic forcing by downdraft outflow (density currents) and
MONCRIEFF, M.W. ET AL.: CONVECTIVE DYNAMICS ISSUES AT ~10KM GRID-RESOLUTION
93
convectively-generated gravity waves. As illustrated in Fig. 2, upscale development of mesoscale convective systems over the continental United States is a multi-scale process. It is a problem of interaction among orographic forcing, convection and environmental shear. An important element is the development of mesoscale rear inflow. Lafore and Moncrieff (1988) deduced that the rear inflow into traveling systems is driven by the horizontal pressure gradient generated by latent heat release in deep cumulonimbus at the front of the system. As shown in Fig. 2 (stage 3) the convectively-generated pressure gradient sucks air into the leading part of the system. Evaporation of precipitation from the trailing stratiform region maintains the mesoscale downdraft. The rearward-tilted ascending motion in the convective and stratiform regions is a crucial structural element.
Upscale evolution is not represented by contemporary convective parameterizations and it does not occur, at least for the right reasons, in global models. Surrogate organization may occur in numerical weather prediction models. A basic question addressed herein is: How can next-generation prediction models represent convective organization, upscale evolution and scale-interaction at large?
1.2. Scale-selection in numerical models
In numerical models, wavelengths shorter than 2∆ are sub-grid scale and prone to distortion and aliasing. This is a particularly vexing problem for moist convection because in convection, kinetic energy density is concentrated on small scales and growth rates are rapid. Because the physical resolution is at least ten times the grid-resolution in a numerical model, explicit representation of convection is strictly limited. A 25-km grid-resolution model barely represents the upper-end of the meso-β range of scales (20 km- 200 km) and the entire meso-γ range (2 km- 20 km) is sub-grid-scale. Although under-resolved circulations may represent organized convection better than contemporary convective parameterizations, the implications of under-resolution should not be under-estimated. It can lead to systematic errors that are difficult to control (see later).
Convective parameterization hinges on the dynamical scale of cumulus elements being small compared to the grid-resolution of the numerical model in which parameterization is applied (Fig. 3a). In Fig 3b the grid-resolution scale is fine enough for convection to be represented explicitly, especially the convective systems on mesoscales. In Fig. 3c the dynamical scale of convection is comparable to the grid-resolution --- the key issue of under-resolved explicit circulations. Long-wave modes in convective systems are resolved selectively, distorting scale-selection and scale-interaction. This problem can occur at remarkably coarse resolution. Families of mesoscale convective systems (super-clusters) embedded in the tropical intraseasonal oscillation are represented by under-resolved explicit circulations at 80 km grid-resolution (Moncrieff and Klinker 1997).
2. Numerical simulation of organized systems over the continental United States
We use the Pennsylvania State University/National Center for Atmospheric Research Mesoscale Model Version 5 (MM5) which has the required physical packages and data-ingest capability (Dudhia 1989, 1993; Grell et al. 1994). There are 40 levels and the model top is at 50hPa. The computational domain is (2400km x 1800km) shown in Fig. 4. A 3-hourly 40-km operational ETA model analysis provides the initial conditions, lateral boundary conditions and evolving large-scale forcing.

MONCRIEFF, M.W. ET AL.: CONVECTIVE DYNAMICS ISSUES AT ~10KM GRID-RESOLUTION
94
Figure 3: Three conceptualizations. a) traditional convective parameterization based on scale separation; b) resolved convection; c) the situation in next-generation prediction models, where there is no clear scale separation between the grid-scale and the dynamical scale of convection.
Cloud-microphysics is represented by the Reisner et al. (1998) six-category mixed-phase microphysics parameterization (Dudhia et al. 2003). The radiative transfer parameterization activated every 15 minutes interacts with explicit cloud, clear atmosphere and the land surface. Planetary boundary layer physics is represented by the scheme used in the National Centers for Environmental prediction (NCEP) Medium-Range Forecast (MRF) model (Hong and Pan 1996). It is coupled with a five-layer soil model and predicts the land-surface temperature. Surface fluxes are specified from the MRF model, but small-scale effects of vegetation and precipitation on soil moisture are not taken into account.
Figure 4: The computational domain used in the numerical experiment. Detailed orography is represented.
We perform 7-day simulations from 0000 UTC 3 July to 0000 UTC 10 July 2003, a period of moderate-to-strong large-scale thermodynamic forcing by synoptic-scale baroclinicity. We conduct a hierarchical set of investigations: i) represent convection explicitly at 3-km grid-resolution, our control simulation; ii) under-resolve convection at coarser resolution with convective parameterization disabled; iii) apply convective parameterization (Betts-Miller) at the same coarse resolution; and iv) interpret the results using theoretical-dynamical models. The computational domain shown in Fig. 4 is of continental scale.
Dynamical scale of convection
c) Under-resolved explicit dynamics + parameterized convection – problems but practical advantages too
Computat ional grid
a)
b)

MONCRIEFF, M.W. ET AL.: CONVECTIVE DYNAMICS ISSUES AT ~10KM GRID-RESOLUTION
95
2.1. Precipitation distribution
In Fig. 5 the observed traveling organized convection is manifested by the space-time distribution of the meridional averaged precipitation (Carbone et al. 2002; Davis et al 2003). The precipitation streaks contain the envelopes of eastward-traveling convective systems.
3-km explicitObserved 10-km Betts-Miller10-km explicit
Figure 5: Hovmoller diagram of the meridionally-averaged precipitation rate. Observed result on the left is from NEXRAD analysis following Carbone et al.(2002); the 3-km explicit plate is from the CSRM simulation; the 10-km explicit result does not operate any convective parameterization; and the remaining result operates the Betts-Miller convective parameterization at 10-km grid-resolution Fields are in mm/hr.
The quasi-steadiness of organized convective systems in baroclinic environments depends on CAPE generation and the control shear exerts on convective dynamics. A formal equation that represents the relationship among shear, CAPE and traveling convection was formalized by Moncrieff and Green (1972) in terms of a convective Richardson number, the quotient of CAPE and the kinetic energy available from environmental shear. The simplest possible (i.e., archetypal) model of the three-branch structure was derived by Moncrieff (1992). Even though it was brutally simplified, the archetypal model successfully approximated real-world systems LeMone and Moncrieff (1994). The basic mechanisms are known, but the main problem is how to get convective organization right in prediction models for the right reasons.
Figure 6: Decomposition of the total precipitation rate (10-km Betts-Miller shown in Fig.5) into parameterized and under-resolved explicit component. Fields are in mm/hr.

MONCRIEFF, M.W. ET AL.: CONVECTIVE DYNAMICS ISSUES AT ~10KM GRID-RESOLUTION
96
The rainfall rate in Fig. 5 shows the diurnal cycle of precipitation over the Continental Divide and the prominent eastward-traveling streaks of precipitation over the Plains. There are broad similarities among the radar observations, the explicit simulation and the under-resolved explicit simulation, and the simulation operating the Betts-Miller parameterization. All generate convective systems traveling at about the observed speed. The agreement for July 8-9 is particularly good.
The nub of the parameterization problem for organized convection is revealed by Fig. 6 where the precipitation rate is broken into parameterized and explicit under-resolved (or grid-scale) circulations.
2.2. Mesoscale organization of convection
Primarily, traveling convection is associated with two coupled mesoscale circulations: mesoscale ascent in the trailing stratiform region and the underlying mesoscale underneath, which is prominent in our simulations (Fig. 7). Cold-pools are generated by the evaporation in small-scale downdrafts associated with cumulonimbus convection and by mesoscale downdrafts underneath the ascending trailing stratiform region. Neither the convective parameterization nor the explicit circulation represents the stratiform region and the mesoscale downdraft satisfactorily.
MesoscsaleMesoscsaledowndraft downdraft
Figure 7: Flow relative to the traveling convective system. Top, the flow in the vertical plane averaged along the length of the three-dimensional system. Blue and red hues represent easterly and westerly flow, respectively. Arrows conceptualize the relative flow to be compared to Fig. 7. Bottom, condensate and airflow. The mesoscale downdraft is emphasized since it is not represented by the convective parameterization nor the explicit simulation at ~10 km grid-resolution.
The highly-organized case on 8-9 July was analyzed and compared with simulations at different resolution. This system forms in Montana in the late afternoon of 8 July, and travels southeastward at a speed of about 17 m/s. It is well reproduced in all our simulations as shown by the Hovmoller rain-rate diagrams. An arc-shape rainfall distribution spans about 5 degrees of longitude with the heaviest precipitation concentrated is multicellular towards the southern end of the system (not shown). The simulated convection has squall-line features, such as cold pools, surface mesohighs, strong convergence and lifting around the leading frontal boundary.
The vertical structure of the system-relative flow (Fig. 7) shows prominent rearward-tilting organized mesoscale updrafts rooted in the planetary boundary layer and exiting in the trailing stratiform region. The mesoscale downdraft is maintained by three dynamical mechanisms: i) the horizontal pressure gradient generated by latent heat release in the convective region sucks environmental air from the rear into the

MONCRIEFF, M.W. ET AL.: CONVECTIVE DYNAMICS ISSUES AT ~10KM GRID-RESOLUTION
97
forward part of the convective system; ii) the accompanying deep horizontal convergence sustains strong cumulonimbus activity at the leading edge; and iii) a mesoscale downdraft is driven by the evaporation and water-loading of precipitation falling from the stratiform region. Strong upper-tropospheric westerly flow advects condensate eastward and maintains the forward-directed anvil.
3. Dynamical interpretation
3.1. Travel speed and flow morphology
The simulated system in Fig. 7 and the dynamical model in Fig. 8 have distinct three-branch circulations: an overturning updraft, a mesoscale downdraft and a backward-tilting propagating updraft that separates these two overturning branches. The observed structure (Houze et al. 1989) is represented by the archetypal model of Moncrieff (1992) and its generalization (the elegant integro-differential equation shown in Fig. 8). The dimensionless quantities (Ri and E) representing organized convection and the travel speed are intimately related. Steady convection occurs only within certain regions of Ri -E parameter space.
*c = U (z )
*z = z
( , , ) :F z cψ
ψ ψψ
⎛ ⎞∂∇ = + ⎜ ⎟∂⎝ ⎠
∫0
2 ( )z
z
FG d z
( )ψ0z
vorticity generated by latent heating
vorticity along trajectories
inflow vorticity
•
buoyancy along trajectories
•Steering level
ψlatent heating
evaporative cooling
Formally described by equation:
U (z) - c
Figure 8: Top, conceptual diagram of the airflow relative to a traveling convective system, represented by a three-branch circulation. The nonlinear integro-differential eigen-value problem formally represents the relative flow and the travel speed of the system, c. This is a generalization of the equation originally derived by Moncrieff and Green (1972). Known solutions describe a range of regimes of organized precipitating convection.
3.2. Convective momentum transport
The traditional way to represent convective momentum transport is the eddy-flux method in which the
vertical flux of horizontal momentum per unit volume in the vertical direction is defined by ( , )u w v wρ ρ′ ′ ′ ′
where ( , ) ( , )u v u u v v′ ′= + + and the spatial average (represented by over-bars) of primed quantities are identically zero. This represents the effects of a population of convective elements, which is consistent with the concept of ordinary convection.
Organized convection conforms to a different paradigm where momentum transport is carried by a few coherent mesoscale systems represented in terms of the total momentum transport
0
1 Luw uwdx
Lρ ρ< > = ∫

MONCRIEFF, M.W. ET AL.: CONVECTIVE DYNAMICS ISSUES AT ~10KM GRID-RESOLUTION
98
in a domain 0 x L≤ ≤ of unit length in the y-direction. There is a similar definition for v-momentum transport. The total momentum flux averaged along the length of the mesoscale convective system is shown in Fig. 11.
Figure 9: Total momentum transport at grid resolutions of a) 3-km; b) 10-km and c) 30 -km. The latter bears little resemblance due to the distortion arising from under-resolved dynamics.
Betts-Miller does not parameterize convective momentum transport directly. However, flow driven by the parameterized convective heat source is subject to planetary rotation, so momentum transport occurs on the inertial timescale – quasi-balanced convective momentum transport distinct from direct transport.
The transport computed from the 10-km grid-resolution experiment (Fig. 9b) compares well with the 3-km grid-resolution simulation (Fig. 9a), except it is less concentrated. Both simulations display the negative momentum transport characteristic of an eastward-traveling system. This characteristic structure is due to the westward tilt with height of the system-relative airflow (Moncrieff 1992). This good agreement is not present at 30-km grid-resolution (Fig. 9c), because the convective organization is markedly different. Unlike the simulated convection at 3-km or 10-km grid-resolution, the rearward middle-level inflow ascends and there are two overturning updrafts (not shown). At 30 km grid-resolution, Betts-Miller does not produce reasonable precipitation patterns and convection travels too slowly. Such distortions are culpable since they affect structure, transport and scale-interaction.
4. Statistical-dynamical model evaluation The NEXRAD data have a horizontal resolution of about 2 km. At each hour these data were interpolated onto the MM5 computational grid which has a resolution of 3 km. The Z-R relationship, Z =300 R1.5, converts the reflectivity (Z, dbz) into rainrate (R, mm/hr). Half-hourly outputs of precipitation accumulation of MM5 simulation are then converted to hourly rain rates. Both the MM5 and NEXRAD rain-rate distributions are decomposed using a two-dimensional fast Fourier transform (2DFFT). In horizontal wave-number space the MM5 simulations are represented by a matrix of (801 × 601) points. One-dimensional variance spectra are calculated as follows. The MM5 and the interpolated NEXRAD data are placed in the center of a grid-net of (1025 × 1025) points for the 2DFFT decomposition, giving the variance distribution in wave-number space in terms of (512 × 512) components and the two-dimensional wave-number distributions of rain-rate variances are averaged angularly (i.e., in constant-radius circles) at each horizontal wave-number k = (kx
2 + ky2)1/2, where kx and ky are x- and y-wave-number, respectively.
MONCRIEFF, M.W. ET AL.: CONVECTIVE DYNAMICS ISSUES AT ~10KM GRID-RESOLUTION
99
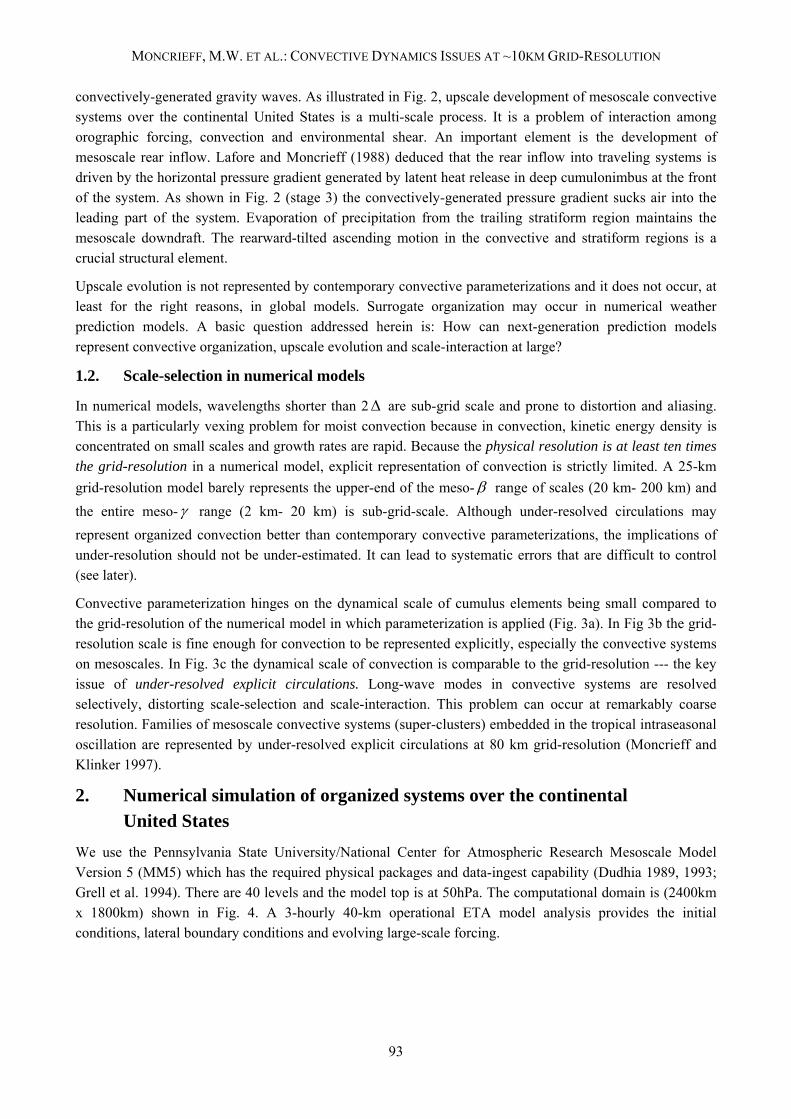
Figure 10: Spectral analysis of the precipitation rate showing means and deviation over the 7-day period, illustrating the difference between NEXRAD and MM5. For the scales shorter than 75 km, the means depart progressively at small scales. The larger standard deviation in the simulations is also a measure of decreased variability
Figure 10 shows the spectral distributions of rain-rate variance for both the 3-km grid-resolution numerical experiment and the NEXRAD data, with standard deviations shown by the vertical bars. The averaged spectra clearly show the difference between NEXRAD and MM5 and the -4/3 slope in wave-number space. Over the low wave-number range, the means and standard deviations are in reasonable agreement but for scales shorter than about 100 km, the means and the standard deviations from the mean depart significantly. This statistical-dynamical analysis quantifies the high-resolution (about 30 grid-points or 15 wave-modes) needed to fully simulate precipitating convection in prediction models.
The rapid drop-off of variability in the MM5 simulation compared to observations is similar, conceptually, to that encountered at much lower-wave numbers in global models (i.e., the subject of this Workshop). There are two candidate explanations of a very different physical nature. Firstly, the large-scale forcing in the MRF analysis is not strong enough, hence decrease the rate of generation of CAPE and convective kinetic energy and rainfall rate is too smalll. Secondly, the missing variability is a result of turbulent transport in the simulated convection being too low. This is likely since MM5, indeed any 3-km grid-resolution numerical model, cannot possibly resolve in-cloud turbulence and cloud-environment mixing associated with deep convection. Also, the turbulence parameterization likely represents moist turbulence inadequately.
5. Parameterization
5.1. Heat budget
The heat budget is calculated over a rectangular region (1000 km x 800 km ) spanning most of the heavy precipitation during the 7-day period. Following Yanai et al. (1973), the thermodynamic effect of precipitating convection on the environment is measured by the convective heat source 1( - )RQ Q , the
vertical gradient of which generates potential vorticity that affects the large-scale circulation. Figure 11a shows the convective heating profiles at 3-km, 10-km and 30-km grid resolution for the explicit simulations. Figure 11b shows the corresponding profiles for the simulations operating Betts-Miller. The elevated heating

MONCRIEFF, M.W. ET AL.: CONVECTIVE DYNAMICS ISSUES AT ~10KM GRID-RESOLUTION
100
maximum in Fig. 11 is similar to that for convection over tropical oceans in baroclinic conditions; for example, easterly waves during GATE and westerly wind bursts during TOGA COARE.
The warming bias at lower-resolution results from weak mid-to-low troposphere cooling associated with weak mesoscale downdrafts. Systematic warming of about 2K occurs over a deep layer, unacceptable in long integrations. Because under-resolved explicit circulations are dominant, convective parameterization has remarkably little effect.
5.2. Stratiform heating and mesoscale downdraft
We now test a prototype representation of stratiform heating and the mesoscale downdraft. Stratiform precipitation is known to be a large fraction of the total precipitation from mesoscale convective systems. Johnson (1984) showed that the heating/moistening and cooling/drying dipoles associated with the stratiform region of mesoscale convective systems and the mesoscale downdraft, respectively, are related to latent heating by cumulonimbus convection within the leading region of the convective system. This is consistent with the convectively-generated pressure gradient that drives inflow to the mesoscale downdraft (Lafore and Moncrieff 1988).
Betts (1997) suggested a way to represent mesoscale heating in the Betts-Miller convective parameterization. We adopt this approach in the following relationship
• •s
m 1 * scs t
• •s
m 1 * scs t
p - p Q (p,t) = Q (t) sin 2π p p p p - pp - p Q (p,t) = Q (t) sin 2π p p p p - p
α
α
≤ ≤
≤ ≤ (1)
where cQ is the vertically integrated convective rate of heating and *p , sp , and tp is the pressure where the
heating is zero, the surface pressure and the pressure at the top of the stratiform outflow, respectively. Setting
1 2α α= recovers the Betts equation.
Considering the pressure-gradient argument, the height of the rear inflow is a function of the vertical distribution of latent heat release in the convective region. This differs from conventional wisdom that says it is associated with cooling at the melting level. In the absence of a clear consensus, the level of zero heating is at the center of mass of the convective layer, that is
*
1s t2p (p - p )= .
We tested the mesoscale heating in a simulation of the highly-organized squall system of July 9 in a 1-day simulation starting at 0000 UTC 9 July 2003 and at 60-km grid-resolution. The above stratiform heating/cooling function is applied in addition to the Betts-Miller parameterization. Figure 12 shows that the mesocale parameterization affects the travel speed of the convective system. The precipitation is in three parts: parameterized, mesoscale parameterization and the under-resolved explicit circulation. The parameterization of mesoscale downdrafts has a discernable effect on the heating profile and the travel speed (Fig. 11, right-hand diagram).

MONCRIEFF, M.W. ET AL.: CONVECTIVE DYNAMICS ISSUES AT ~10KM GRID-RESOLUTION
101
Figure 11: a) Convective heating in the simulations. 3-km grid-resolution (full); 10-km grid-resolution (dotted) and 30-km grid-resolution (dotted). b) Same except the Betts-Miller convective parameterization is in operation. The plate on the right, for a smaller domain simulation, operates Betts-Miller together with the mesoscale parameterization represented by Eq. 1. The full curve is for 3-km resolution, the dotted curve has 1 0α = (mesoscale downdraft only) and the broken curve 1 2α α= (mesoscale downdraft and stratiform ascent).
5.3. Generalization of the Betts-Miller parameterization
The Betts (1986) parameterization for deep convection was largely based on field-observations obtained during VIMHEX, the Venezuelan Meteorological and Hydrological Experiment. Traveling squall lines occurred during VIMHEX (Betts et al. 1976) but tropical squall-systems were generally weaker than their counterparts over the continental United States in terms of the depth, horizontal extent and strength of the mesoscale downdrafts. A reference profile appropriate for sequences of traveling precipitation over the continental United States during summertime would likely improve the Betts-Miller parameterization. Questions spring to mind in association with potential generalizations of Betts-Miller:
1. Can Betts-Miller generate fast-traveling convection spontaneously (it was far too slow in the above test) or must a propagation mechanism be specified externally? Betts-Miller generates a heating-cooling couplet provided an appropriate reference profile is specified. Propagation should occur provided the upper-tropospheric synoptic-scale baroclinic wave is interlocked with the convective system. Should an external propagation be required, Fig. 12 shows employing under-resolved mesoscale circulations is a practical proposition. A basic answer is to employ dynamical models of convection in shear. C

MONCRIEFF, M.W. ET AL.: CONVECTIVE DYNAMICS ISSUES AT ~10KM GRID-RESOLUTION
102
2. Can convective momentum transport be included in Betts-Miller? Using the mass-flux interpretation of Betts-Miller, it may be possible to apply this mass-flux to the Moncrieff (1992) formulation or the Wu and Yanai (1994) formulation of convective momentum transport.
3. Is the neglect of horizontal advection a fundamental impediment? The answer may be affirmative in view of the strong tilt of the convective systems in the vertical, and the distinctive morphology of the system-relative airflow (see Fig. 7). This point is pertinent to all convective parameterizations in high-resolution prediction models, not just Betts-Miller.
a)a) b)b)
c)c)
Figure 12: Hovmoller diagrams of rainfall rate averaged in the meridional direction for the 60-km grid-resolution simulations.(a) Parameterized rainfall for Betts-Miller; b) parameterized rainfall including the mesoscale parameterization; c) total rainfall including Betts-Miller, mesoscale parameterization and the under-resolved explicit circulation.
We also applied the Kain-Fritsch convective parameterization (Kain and Fritsch, 1993) and the Grell parameterization (Grell et al. 1994). Broadly speaking, these parameterizations gave similar results on the resolution dependence of the propagation of the convective systems (Moncrieff and Liu, 2003).
6. Discussion and summary We examined organized traveling precipitating convection with focus on ~ 10-km grid-resolution, the juncture where convective dynamics gets under-resolved and convective parameterization is ill-conditioned. This resolution is highly pertinent to next-generation numerical weather prediction models. The travel speeds of the simulated convective systems compare favorably with the space-time distribution of the precipitation streaks observed by NEXRAD as analyzed by Carbone et al. (2002). At 3-km grid-resolution explicit simulations represent the evolution of organized systems that travel eastward for distances ~ 1000 km, realizing precipitation streaks measured by NEXRAD. In the period examined (3-10 July 2003) convection evolved under conditions of moderate-to-strong synoptic forcing. The generation of CAPE (thermodynamic forcing) and shear (dynamical control) by synoptic-scale baroclinic disturbances affects the severity and longevity of traveling convection. This has positive implications for the prediction of severe convective weather.
The morphology of the simulated convective systems was found similar to squall systems over West Africa, such as the three-branch structure and the mesoscale downdraft driven by the convectively-generated horizontal pressure gradient. The morphology stems from interaction between environmental shear and convective heating consisting of latent heat release in the middle-to-upper troposphere and evaporative

MONCRIEFF, M.W. ET AL.: CONVECTIVE DYNAMICS ISSUES AT ~10KM GRID-RESOLUTION
103
cooling by downdrafts underneath, explained by a dynamical model composed of three airflow branches. Figure 13 shows that traveling convective systems over the continental United States also occur in other regional of the world, again in association with mountainous orography and shear-flow associated with the mid-latitude and sub-tropical jet streams. In a broader context, traveling convective systems with the same basic structure illustrated in Figs. 7 and 8 are fundamental to the upscale development, dynamical structure and propagation of the tropical intraseasonal oscillation (Moncrieff 2004). Therefore, there is prospect our results for traveling organized precipitating systems have quite general applications not only in terms of basic dynamics but also in the practical parameterization sense.
Figure 13: Global distribution of mesoscale convective complexes and association with orography and the mid-latitude and sub-tropical jet streams (From Laing and Fritsch 1997).
Traveling systems over West Africa are influenced by lower-tropospheric easterly waves. Over the continental U.S, it is likely that upper-tropospheric synoptic waves affect the generation of CAPE and shear, which warrants investigation. Should synoptic-scale baroclinic disturbances prove important, there are positive implications for the prediction of severe convective weather in next-generation NWP models, provided the synoptic systems are represented in the analysis. Climate models are anticipated to experience greater difficulty because synoptic disturbances are themselves, under-resolved.
The convective momentum transports at 3-km and 10-km grid resolution have similar structure. At 10-km resolution systematic errors in convective heating that occur are attributed to the mesoscale downdrafts being too weak. At 30-km grid-resolution the convective systems move too slowly, their morphology is unrealistic, the systematic warming of the lower troposphere and convective momentum transport are unrealistic.
Using standard Fourier-based techniques, we evaluated the statistical-dynamical properties of the precipitation in the 3-km grid-resolution MM5 simulations against NEXRAD data. We found that wavelengths longer than 100 -150 km are well represented, but the precipitation rate associated with the shorter waves are systematically too weak. This is a sobering statistical measure of the high horizontal resolution needed to correctly represent convective precipitation.
Organized convection conforms to a different paradigm from ordinary convection. Horizontal transport is neglected in the single-column models used in convective parameterization. In our simulations the vertical tilting is prominent. We tested a representation of the mesoscale downdraft cooling and stratiform heating which improved the simulation significantly but not completely. We made suggestions of how Betts-Miller may be improved by obtaining reference profiles associated with summertime convection over the continental United States.

MONCRIEFF, M.W. ET AL.: CONVECTIVE DYNAMICS ISSUES AT ~10KM GRID-RESOLUTION
104
In more weakly baroclinic conditions, convection is less organized as discussed in Liu et al. (2005). Land-surface exchange and cloud-microphysics then assume a greater importance and this is likely to limit forecast skill.
In addition to the suggestions made for improving Betts-Miller, further research is needed to address: convective triggering by density currents and mesoscale downdrafts; the mechanism by which under-resolved explicit circulations suppress convective parameterization and how this problem can be alleviated; and, investigating thermodynamic forcing by synoptic-scale baroclinic waves and its potential for improved prediction. The above should include simulations in an idealized framework where cause and effect can be more readily quantified than in full numerical weather prediction models.
Acknowledgements
The National Center for Atmospheric Research (NCAR) is sponsored by the National Science Foundation (NSF). We acknowledge NSF grant 9732665 SPO 040.
References
Betts, A.K., 1986: A new convective adjustment scheme. Part I: Observational and theoretical basis. Quart. J. Roy. Meteor. Soc., 112, 677-691.
Betts A. K., and M. J. Miller, 1993: The Betts-Miller scheme. The Representation of Cumulus Convection in Numerical Models, Meteor. Monogr, 46, Amer. Meteor. Soc., 107-121.
Betts, A.K., R.W. Grover, and M.W. Moncrieff, 1976: Structure and motion of tropical squall lines over Venezuela. Quart. J. Roy. Meteor. Soc., 102, 385-404.
Carbone, R.E., J.D. Tuttle, D. Ahijevych, S. B. Trier, 2002: Inferences of Predictability Associated with Warm Season Precipitation Episodes, J. Atmos. Sci., 59, 2033-2056.
Davis, C. A., K. W. Manning, R. E. Carbone, S. B. Trier, and J. D. Tuttle, 2003: Coherence of warm-season continental rainfall in numerical weather prediction models. Mon. Wea. Rev., 131, 2667-2679.
Dudhia, J., 1993: A nonhydrostatic version of the Penn State/NCAR mesoscale model: Validation tests and the simulation of an Atlantic cyclone and cold front. Mon. Wea. Rev., 121, 1493-1513.
Dudhia, J., 1996: A multi-layer soil temperature model for MM5. Preprints, 6th PSU/NCAR Mesoscale Model Users Workshop, 22-24 July 1996. Boulder, Colorado, 49-50. http://www.mmm.ucar.edu/mm5/mm5v2/whatisnewinv2.html.
Dudhia, J. D. Gill, K. Manning, W. Wang, C. Bruyere, 2003: PSU/NCAR Mesoscale Modeling System Tutorial Class Notes and Users Guide: MM5 Modeling System Version 3. http://www.mmm.ucar.edu/mm5/documents/tutorial-v3-notes.html.
Grell, G. A., J. Dudhia, and D. R. Stauffer, 1994: A description of the fifth generation Penn State/NCAR Mesoscale Model (MM5). NCAR Technical Note, NCAR/TN 398+STR, 138pp.
Hong, S.-Y. and H.-L. Pan, 1996: Nonlocal boundary layer vertical diffusion in a medium-range forecast model. Mon. Wea. Rev., 124, 2322-2339.
Houze, R.A. Jr., and A.K. Betts, 1981: Convection in GATE. Rev. Geophys. and Space Phys. 19, 541-576.
Johnson, R.H., 1984: Partitioning tropical heat and moisture budgets into cumulus and mesoscale components: Implications for cumulus parameterization. Mon. Wea. Rev., 112, 1590-1601.

MONCRIEFF, M.W. ET AL.: CONVECTIVE DYNAMICS ISSUES AT ~10KM GRID-RESOLUTION
105
Kain, J. S., and J. M. Fritsch, 1993: Convective parameterization for mesoscale models. The Representation of Cumulus Convection in Numerical Models, Meteor. Monogr, 46, Amer. Meteor. Soc., 165-170.
Knievel, J. C., D. A. Ahijevych, and K. W. Manning, 2004: Using temporal modes of rainfall to evaluate the performance of a numerical weather prediction model. Mon. Wea. Rev, 132, 2995-3009.
Lafore, J.-L., and M.W. Moncrieff, 1989: A numerical investigation of the organization and interaction of the convective and stratiform regions of a tropical squall line. J. Atmos. Sci., 46, 521-544.
Laing, A.G., and J.M. Fritsch, 1997: The global population of mesoscale convective complexes. Quart. J. Roy. Meteor. Soc., 123, 2756-2776.
LeMone, M.A., and M.W. Moncrieff, 1994: Momentum and mass transport by convective bands: Comparisons of highly idealized dynamical models to observations. J. Atmos. Sci., 51, 281-305.
Ludlam, F.H., 1980: Clouds and Storms: The Behavior and Effect of Water in the Atmosphere. The Pennsylvania State University Press, University Park and London, 405 pp.
Liu, C., M.W. Moncrieff, J.D. Tuttle, and R.E. Carbone, 2005: Explicit and parameterized episodes of warm-season precipitation over the Continental United States. Adv. Atmos. Sci., submitted.
Moncrieff, M.W., 1981: A theory of organized steady convection and its transport properties. Quart. J. Roy. Meteor. Soc., 107, 29-50.
Moncrieff, M.W., 1992: Organized convective systems: archetypal dynamical models, mass and momentum flux theory, and parameterization. Quart. J. Roy. Meteor. Soc., 118, 819-950.
Moncrieff, M.W., 1997: Momentum transport by organized convection. The Physics and Parameterization of Moist Atmospheric Convection. NATO ASI Series C: Mathematical and Physical Sciences, 505, 231-253.
Moncrieff, M.W., 2004: Analytic representation of the large-scale organization of tropical convection. J. Atmos. Sci., 61, 1521-1538.
Moncrieff, M.W., and J.S.A. Green, 1972: The propagation and transfer properties of steady convective overturning in shear. Quart. J. Roy. Meteor. Soc., 98, 336-352.
Moncrieff, M.W., and E. Klinker, 1997: Mesoscale cloud systems in the Tropical Western Pacific as a process in general circulation models. Quart. J. Roy. Meteor. Soc., 123, 805-827.
Moncrieff, M. W., and C.-H. Liu, 2003: Sequences of precipitation and organized convection: Dynamics and parameterization. Preprints, Symp. on Observing and Understanding the Variability of Water Vapor in Weather and Climate, Long Beach, CA, Amer. Meteor. Soc., CD-ROM, 3.7.
Moncrieff, M.W., C. Liu, and H.-M. Hsu, 2005: On convective organization in prediction models. J. Atmos Sci., submitted.
Reisner, J., R.J. Rasmussen, and R.T. Bruintjes, 1998: Explicit forecasting of supercooled liquid water in winter storms using the MM5 mesoscale model. Quart. J. Roy. Meteor. Soc., 124, 1071-1107.
Wu, X., and M. Yanai. 1994: Effects of vertical wind shear on the cumulus transport of momentum: Observations and parameterization. J. Atmos. Sci., 51, 1640-1660.
Yanai, M., S. Esbensen and J. Chu, 1973: Determination of the bulk properties of tropical cloud clusters from large-heat and moisture budgets. J. Atmos. Sci., 30, 611-627.

106