Embed Size (px)
Citation preview

CONVECTIVE CLOUD MICROPHYSICS IN AHIGH-RESOLUTION NWP MODEL
J. Trentmann1, A. Seifert2, H. Wernli1
1Institute for Atmospheric Physics, Johannes GutenbergUniversity Mainz, Germany
2German Weather Service, Offenbach, Germany
1. INTRODUCTION
Forecasting convective precipitation re-mains a challenge for numerical weather pre-diction. In April 2007 a convection-permittingversion of the COSMO (Consortium for SmallScale Modeling) model has become opera-tional at the German Weather Service, DWD– COSMO-DE. This model operates witha horizontal grid point distance of 0.025◦
(≈2.8 km) and resolves the dominant spa-tial scales involved in deep convection. Noparameterization of deep convection is em-ployed. Such a model setup allows to evalu-ate and to investigate the description of cloudmicrophysical processes within deep convec-tive clouds under realistic conditions, e.g.,without the application of an artificial triggermechanism for convection.
Here, we present model simulations fora case of localized deep convection thatoccurred on 12 July 2006 in South-WestGermany.
2. OBSERVATIONS
Summertime precipitation in the low-mountainous region in South-West Germanyis dominated by convective precipitation. On12 July 2006, under weak synoptic-scaleforcing, several convective cells formed inthe early afternoon in mountainous regionsacross Europe including the Black Forestin South-West Germany (Fig. 1). While the
1Corresponding author’s address: Jorg Trentmann,Institute for Atmospheric Physics, Johannes GutenbergUniversity Mainz, Becherweg 21, 55099 Mainz, Ger-many, [email protected]
Figure 1: Visible image derived from MODIS at 1030UTC, 12 July 2006, the yellow rectangle marks the con-vective cell of interest.
Rhine-Valley remained free of convectiveactivity, different stages of convective cloudscan be identified over the German (BlackForest and Swabian Alb) and the French(Vosgue) low mountain ranges. The convec-tive cell in the Northern Black Forest (markedby the yellow square) is in its active, growingphase. Its top has already reached the levelof neutral buoyancy (i.e, the tropopause) andice has formed in the anvil. In the southernBlack Forest, a mature convective cloud ispresent with a huge ice anvil, while along theSwabian Alb (towards the NE) mainly shallowconvection prevails. The mixture of differentstages of cloud developments highlights thehigh spatial and temporal variability of con-vective clouds under weak synoptic forcing.Here we focus on the convective cell thatformed around local noon in the NorthernBlack Forest.
The precipitation field derived from gauge-
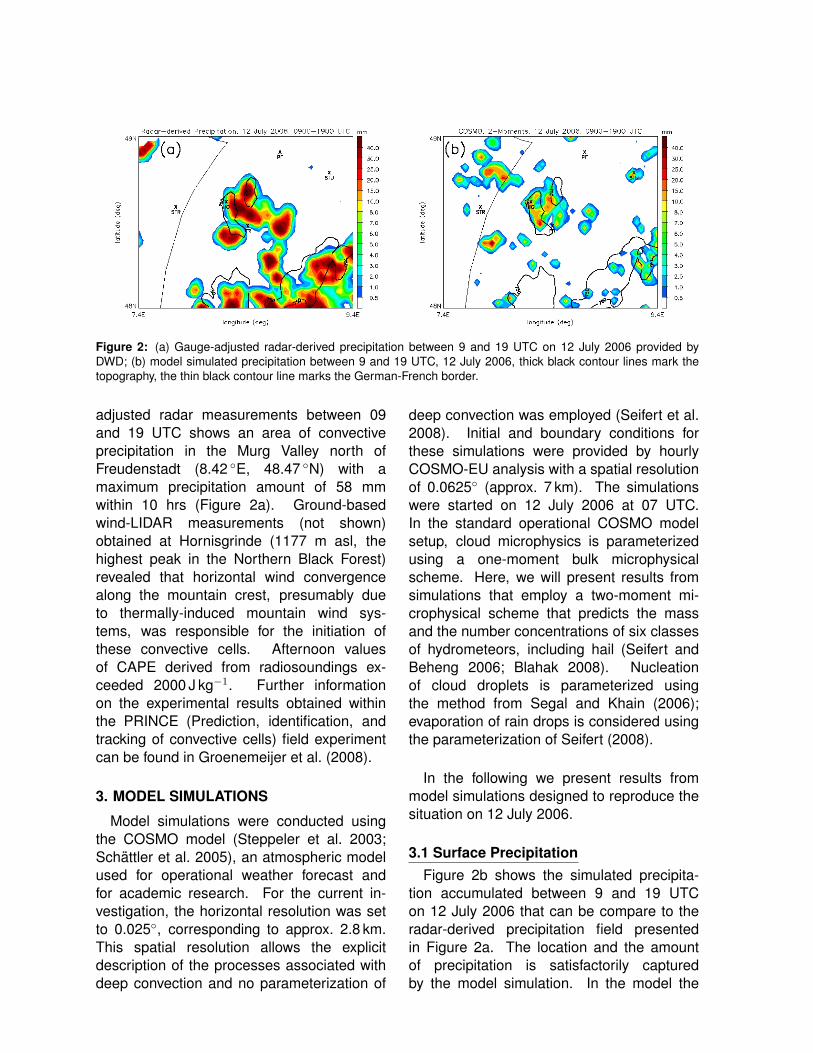
Figure 2: (a) Gauge-adjusted radar-derived precipitation between 9 and 19 UTC on 12 July 2006 provided byDWD; (b) model simulated precipitation between 9 and 19 UTC, 12 July 2006, thick black contour lines mark thetopography, the thin black contour line marks the German-French border.
adjusted radar measurements between 09and 19 UTC shows an area of convectiveprecipitation in the Murg Valley north ofFreudenstadt (8.42 ◦E, 48.47 ◦N) with amaximum precipitation amount of 58 mmwithin 10 hrs (Figure 2a). Ground-basedwind-LIDAR measurements (not shown)obtained at Hornisgrinde (1177 m asl, thehighest peak in the Northern Black Forest)revealed that horizontal wind convergencealong the mountain crest, presumably dueto thermally-induced mountain wind sys-tems, was responsible for the initiation ofthese convective cells. Afternoon valuesof CAPE derived from radiosoundings ex-ceeded 2000 J kg−1. Further informationon the experimental results obtained withinthe PRINCE (Prediction, identification, andtracking of convective cells) field experimentcan be found in Groenemeijer et al. (2008).
3. MODEL SIMULATIONS
Model simulations were conducted usingthe COSMO model (Steppeler et al. 2003;Schattler et al. 2005), an atmospheric modelused for operational weather forecast andfor academic research. For the current in-vestigation, the horizontal resolution was setto 0.025◦, corresponding to approx. 2.8 km.This spatial resolution allows the explicitdescription of the processes associated withdeep convection and no parameterization of
deep convection was employed (Seifert et al.2008). Initial and boundary conditions forthese simulations were provided by hourlyCOSMO-EU analysis with a spatial resolutionof 0.0625◦ (approx. 7 km). The simulationswere started on 12 July 2006 at 07 UTC.In the standard operational COSMO modelsetup, cloud microphysics is parameterizedusing a one-moment bulk microphysicalscheme. Here, we will present results fromsimulations that employ a two-moment mi-crophysical scheme that predicts the massand the number concentrations of six classesof hydrometeors, including hail (Seifert andBeheng 2006; Blahak 2008). Nucleationof cloud droplets is parameterized usingthe method from Segal and Khain (2006);evaporation of rain drops is considered usingthe parameterization of Seifert (2008).
In the following we present results frommodel simulations designed to reproduce thesituation on 12 July 2006.
3.1 Surface PrecipitationFigure 2b shows the simulated precipita-
tion accumulated between 9 and 19 UTCon 12 July 2006 that can be compare to theradar-derived precipitation field presentedin Figure 2a. The location and the amountof precipitation is satisfactorily capturedby the model simulation. In the model the

Figure 3: Visualisation of the model results for 1330 UTC on 12 July 2006. (a) The color coding represents thetopography. White contour lines correspond to the 30- and 40-dbz isoline of the vertical maximum radar refelctivityderived from the model simulation. Black arrows represent the 10-m wind. The black line indicates the location ofthe cross section shown in Figure 3b. (b) Mass concentration of hydrometeors along the cross section depictedby the black line in Figure 3a. Blue contour lines represent positive vertical velocity (updraft), red contour linescorrespond to negative vertical velocity (downdraft). Black contour lines correspond to the 0- and 40-◦C isoline.
precipitation is also tied to the Murg valleyin the Northern Black Forest suggestingthat the process leading to the initiation ofthe convective cell is realistically describedin the model simulation. The amount ofprecipitation is underestimated compared tothe radar-derived precipitation (The simulatedmaximum precipitation is 30 mm.), however,the quantification of surface precipitationfrom radar observations is also associatedwith some uncertainty. An analysis of thediurnal precipitation cycle (not shown) revealsthat the simulated precipitation is delayedcompared to the radar observations by about2 hrs. Overall, the good comparison betweenthe observed and the simulated accumulatedprecipitation fields allows an investigationof the microphysical processes that areresponsible for the formation of precipitationin the model simulations.
3.2 Cloud MicrophysicsIn the following we will present a more de-
tailed view into the model results from thesimulation presented in Section 3.1 focussingon the hydrometeors in the convective cloud.
Figure 3a presents the vertical maximumof the simulated radar reflectivity and the
10-wind field at 1330 UTC. The main con-vective activity is along the mountain crest ofthe Black Forest. The high spatial resolutionallows to explicitly resolve the dynamicalprocesses associated with the convectivecell. The impact of the convective scaledynamics, e.g., downdrafts, cold air outflow,on the 10-m wind field is clearly visible. InFigure 3b a vertical cross section throughthe convective cloud along the black linedepicted in Figure 3a is shown. The convec-tion reaches the local tropopause at about200 hPa. The updraft speed in this convectivecell exceeds 9 m s−1, the water/ice massmixing ratio reaches up to 5.5 g kg−1, andthe downdraft exceeds −5 m s−1. The mainlow level inflow region into this convectivecell is slightly further towards the SE and notdepicted in this cross section (see Figure 3a).
Figure 4 shows the simulated numberconcentration of hydrometeors by the two-moment scheme along the cross sectionindicated by the black line in Figure 3a. Alsoindicated are the regions with mainly liquid,with mainly frozen, and with a mixture offrozen and liquid hydrometeor mass. Signif-icant parts of the cloud, mainly associated

Figure 4: Simulated total number concentration of hy-drometeors along the cross section depicted by theblack line in Figure 3a. Note the huge range of the colorcolding, from 0.001 cm−3 (= 1 l−1) to 1000 cm−3. Thesolid black contour shows the 0.2-g kg−1 isoline of liq-uid hydrometeors, the dotted black contour representsthe 0.2-g kg−1 isoline of frozen hydrometeors. Blue con-tour lines represent positive vertical velocity (updraft),red contour lines correspond to negative vertical veloc-ity (downdraft). Black contour lines correspond to the 0-and 40-◦C isoline.
with the updraft, involve a mixed phasebetween liquid and frozen hydrometeors.The hydrometeor number concentration inthe cloud is extremely variable, ranging from0.001 cm−3 to more than 1000 cm−3. Theprecipitating downdraft region exhibits thelowest number concentration associatedwith large rain droplets (compare with themass concentration in Figure 3b). Overallthe number and the mass concentration ofhydrometeors in the convective cloud arevery realistic suggesting that the COSMOmodel with the two-moment microphysicalscheme allows an in-depth investigationof microphysical processes in convectiveclouds.
4. SUMMARY AND CONCLUSIONS
We presented results from a model sim-ulation using the COSMO model with a so-phisticated two-moment cloud microphysicalscheme. The model is used with a spatialresolution of about 2.8 km without a param-eterization of deep convection and is drivenby analysis data. No artificial initiation of con-vection is employed.
Model results were presented for thesituation on 12 July 2006 when local con-vection occurred along mountainous regionsin Central Europe. Focus was given to theconvective cloud that formed in the NorthernBlack Forest in South-West Germany. Themodel reproduces the initiation and the life-cylce of the convection, but underestimatesthe surface precipitation compared to radardata. The dynamical processes (updraft,downdraft, outflow) in the cloud seem tobe realistically described by the model. Asignificant fraction of the convective cloudsis composed of a mixture between liquidand frozen hydrometeors with maximum totalnumber concentration exceeding 1000 cm−3.Surface precipitation is composed of largerain droplets with a number concentrationin the order of 0.01 cm−3 (correspondingto 10 l−1). Overall, the COSMO model withthe two-moment cloud microphysics schemeallow detailed investigations of convectiveclouds and their microphysical processes.
5. ACKNOWLEDGMENTSJ.T. thanks the DWD for providing and
supporting the use of the COSMO model.
References
Blahak, U.: 2008, Towards a better representationof high density ice particles in a state-of-the-arttwo-moment bulk microphysical scheme. Proc.15th Int. Conf. Clouds and Precip., Cancun,Mexico.
Groenemeijer, P., C. Barthlott, A. Behrendt,U. Corsmeier, J. Handwerker, , M. Kohler,C. Kottmeier, H. Mahlke, S. Pal, M. Radlach,J. Trentmann, A. Wieser, and V. Wulfmeyer:2008, Multisensor measurements of a convec-tive storm cluster over a low mountain range:Adaptive observations during PRINCE, submit-ted to Mon. Wea. Rev.
Schattler, U., G. Doms, and C. Schraff, 2005:A description of the nonhydrostatic regionalmodel LM, Part VII: User’s Guide. Technical re-port, Consortium for Small-Scale Modelling.

Segal, Y. and A. Khain, 2006: Dependenceof droplet concentration on aerosol condi-tions in different cloud types: Applicationto droplet concentration parameterization ofaerosol conditions. J. Geophys. Res., 111,doi:10.1029/2005JD006561.
Seifert, A.: 2008, On the parameterization ofevaporation of raindrops below cloud base.Proc. 15th Int. Conf. Clouds and Precip., Can-cun, Mexico.
Seifert, A., M. Baldauf, K. Stephan, U. Bla-hak, and K. Beheng: 2008, The challenge ofconvective-scale quantitative precipitation fore-casting. Proc. 15th Int. Conf. Clouds and Pre-cip., Cancun, Mexico.
Seifert, A. and K. D. Beheng, 2006: A two-moment cloud microphysics parameterizationfor mixed-phase clouds. Part 1: Model de-scription. Meteorol. Atmos. Phys., 92, 45–66,doi:10.1007/s00703-005-0112-4.
Steppeler, J., G. Doms, U. Schattler, H. W. Bitzera,A. Gassmann, U. Damrath, and G. Gregoric,2003: Meso-gamma scale forecasts using thenonhydrostatic model LM. Meteorol. Atmos.Phys., 82, 75–96.