Embed Size (px)
Citation preview

Contura Energy: Non-Deal Roadshow
January 2019
1
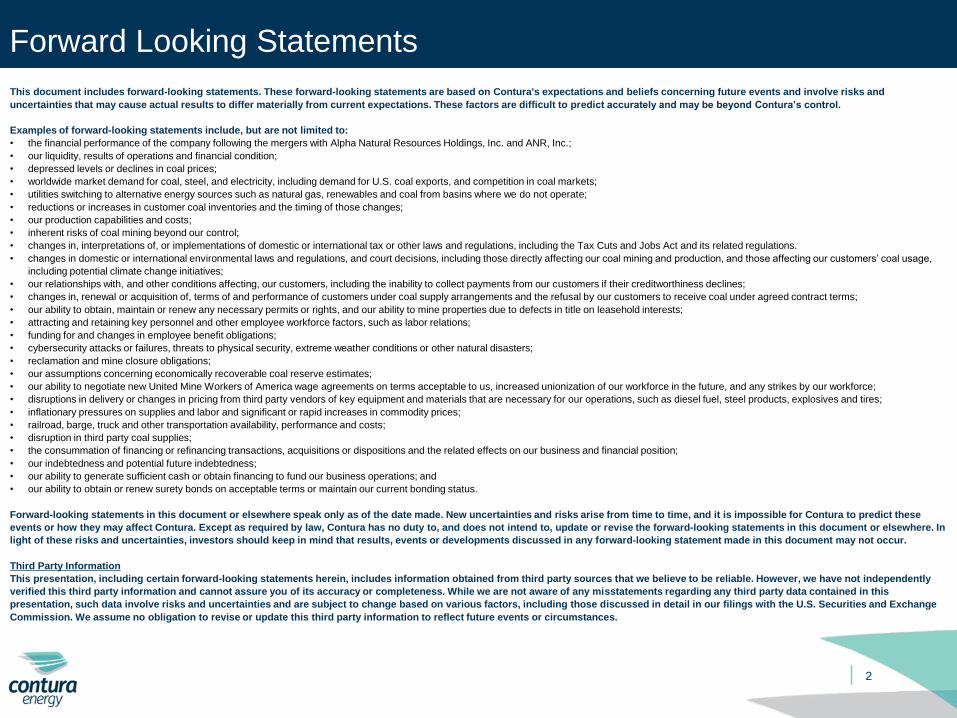
Forward Looking Statements
2
This document includes forward-looking statements. These forward-looking statements are based on Contura's expectations and beliefs concerning future events and involve risks and
uncertainties that may cause actual results to differ materially from current expectations. These factors are difficult to predict accurately and may be beyond Contura’s control.
Examples of forward-looking statements include, but are not limited to:
• the financial performance of the company following the mergers with Alpha Natural Resources Holdings, Inc. and ANR, Inc.;
• our liquidity, results of operations and financial condition;
• depressed levels or declines in coal prices;
• worldwide market demand for coal, steel, and electricity, including demand for U.S. coal exports, and competition in coal markets;
• utilities switching to alternative energy sources such as natural gas, renewables and coal from basins where we do not operate;
• reductions or increases in customer coal inventories and the timing of those changes;
• our production capabilities and costs;
• inherent risks of coal mining beyond our control;
• changes in, interpretations of, or implementations of domestic or international tax or other laws and regulations, including the Tax Cuts and Jobs Act and its related regulations.
• changes in domestic or international environmental laws and regulations, and court decisions, including those directly affecting our coal mining and production, and those affecting our customers’ coal usage,
including potential climate change initiatives;
• our relationships with, and other conditions affecting, our customers, including the inability to collect payments from our customers if their creditworthiness declines;
• changes in, renewal or acquisition of, terms of and performance of customers under coal supply arrangements and the refusal by our customers to receive coal under agreed contract terms;
• our ability to obtain, maintain or renew any necessary permits or rights, and our ability to mine properties due to defects in title on leasehold interests;
• attracting and retaining key personnel and other employee workforce factors, such as labor relations;
• funding for and changes in employee benefit obligations;
• cybersecurity attacks or failures, threats to physical security, extreme weather conditions or other natural disasters;
• reclamation and mine closure obligations;
• our assumptions concerning economically recoverable coal reserve estimates;
• our ability to negotiate new United Mine Workers of America wage agreements on terms acceptable to us, increased unionization of our workforce in the future, and any strikes by our workforce;
• disruptions in delivery or changes in pricing from third party vendors of key equipment and materials that are necessary for our operations, such as diesel fuel, steel products, explosives and tires;
• inflationary pressures on supplies and labor and significant or rapid increases in commodity prices;
• railroad, barge, truck and other transportation availability, performance and costs;
• disruption in third party coal supplies;
• the consummation of financing or refinancing transactions, acquisitions or dispositions and the related effects on our business and financial position;
• our indebtedness and potential future indebtedness;
• our ability to generate sufficient cash or obtain financing to fund our business operations; and
• our ability to obtain or renew surety bonds on acceptable terms or maintain our current bonding status.
Forward-looking statements in this document or elsewhere speak only as of the date made. New uncertainties and risks arise from time to time, and it is impossible for Contura to predict these
events or how they may affect Contura. Except as required by law, Contura has no duty to, and does not intend to, update or revise the forward-looking statements in this document or elsewhere. In
light of these risks and uncertainties, investors should keep in mind that results, events or developments discussed in any forward-looking statement made in this document may not occur.
Third Party Information
This presentation, including certain forward-looking statements herein, includes information obtained from third party sources that we believe to be reliable. However, we have not independently
verified this third party information and cannot assure you of its accuracy or completeness. While we are not aware of any misstatements regarding any third party data contained in this
presentation, such data involve risks and uncertainties and are subject to change based on various factors, including those discussed in detail in our filings with the U.S. Securities and Exchange
Commission. We assume no obligation to revise or update this third party information to reflect future events or circumstances.
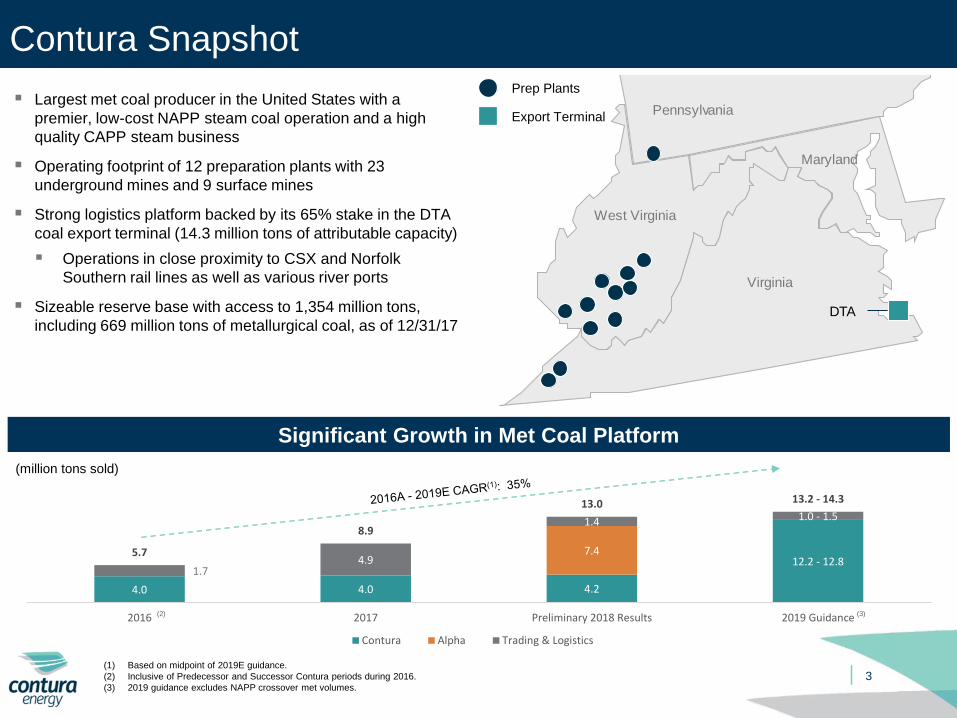
4.0 4.0 4.2
12.2 - 12.87.4
1.74.9
1.4 1.0 - 1.5
5.7
8.9
13.0 13.2 - 14.3
2016 2017 Preliminary 2018 Results 2019 Guidance
Contura Alpha Trading & Logistics
3
Contura Snapshot
(1) Based on midpoint of 2019E guidance.
(2) Inclusive of Predecessor and Successor Contura periods during 2016.
(3) 2019 guidance excludes NAPP crossover met volumes.
▪ Largest met coal producer in the United States with a
premier, low-cost NAPP steam coal operation and a high
quality CAPP steam business
▪ Operating footprint of 12 preparation plants with 23
underground mines and 9 surface mines
▪ Strong logistics platform backed by its 65% stake in the DTA
coal export terminal (14.3 million tons of attributable capacity)
▪ Operations in close proximity to CSX and Norfolk
Southern rail lines as well as various river ports
▪ Sizeable reserve base with access to 1,354 million tons,
including 669 million tons of metallurgical coal, as of 12/31/17
Prep Plants
Export Terminal
Significant Growth in Met Coal Platform
(million tons sold)
(3)
DTA
Pennsylvania
Virginia
West Virginia
Maryland
(2)
4
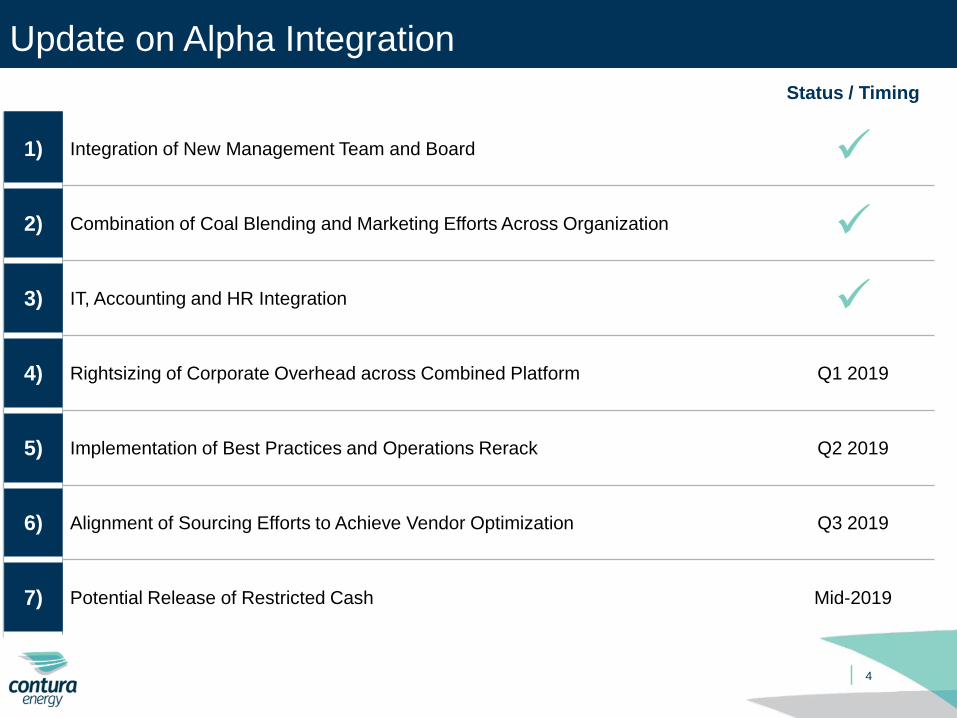
Update on Alpha Integration
Status / Timing
1) Integration of New Management Team and Board ✓
2) Combination of Coal Blending and Marketing Efforts Across Organization ✓
3) IT, Accounting and HR Integration ✓
4) Rightsizing of Corporate Overhead across Combined Platform Q1 2019
5) Implementation of Best Practices and Operations Rerack Q2 2019
6) Alignment of Sourcing Efforts to Achieve Vendor Optimization Q3 2019
7) Potential Release of Restricted Cash Mid-2019
5
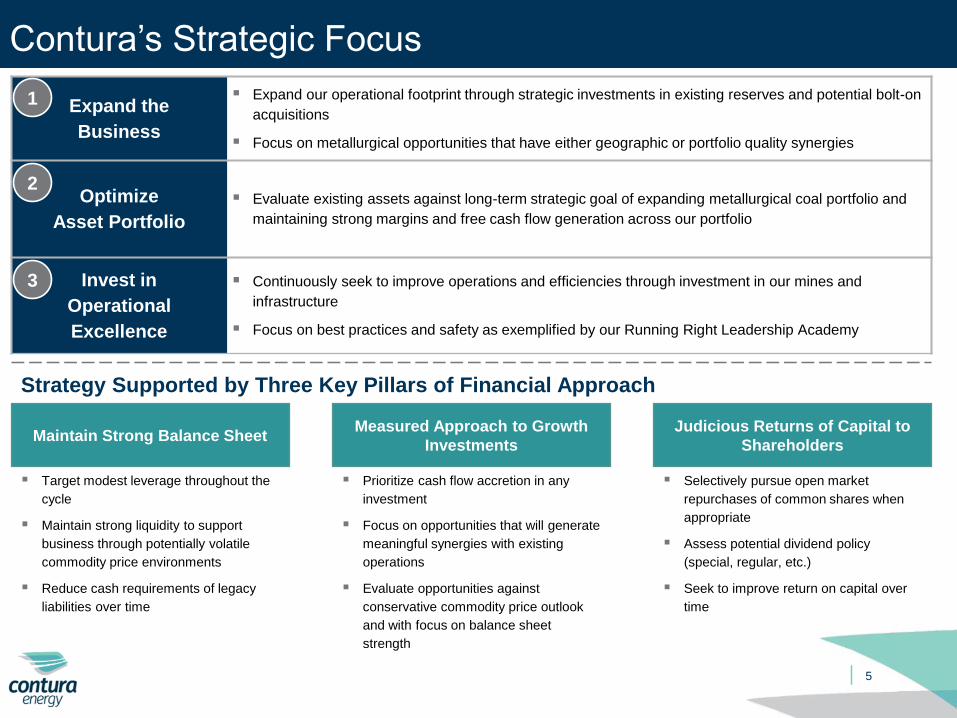
Contura’s Strategic Focus
Expand the
Business
▪ Expand our operational footprint through strategic investments in existing reserves and potential bolt-on
acquisitions
▪ Focus on metallurgical opportunities that have either geographic or portfolio quality synergies
Optimize
Asset Portfolio
▪ Evaluate existing assets against long-term strategic goal of expanding metallurgical coal portfolio and
maintaining strong margins and free cash flow generation across our portfolio
Invest in
Operational
Excellence
▪ Continuously seek to improve operations and efficiencies through investment in our mines and
infrastructure
▪ Focus on best practices and safety as exemplified by our Running Right Leadership Academy
Strategy Supported by Three Key Pillars of Financial Approach
Maintain Strong Balance SheetMeasured Approach to Growth
Investments
Judicious Returns of Capital to
Shareholders
▪ Target modest leverage throughout the
cycle
▪ Maintain strong liquidity to support
business through potentially volatile
commodity price environments
▪ Reduce cash requirements of legacy
liabilities over time
▪ Selectively pursue open market
repurchases of common shares when
appropriate
▪ Assess potential dividend policy
(special, regular, etc.)
▪ Seek to improve return on capital over
time
▪ Prioritize cash flow accretion in any
investment
▪ Focus on opportunities that will generate
meaningful synergies with existing
operations
▪ Evaluate opportunities against
conservative commodity price outlook
and with focus on balance sheet
strength
1
2
3
6
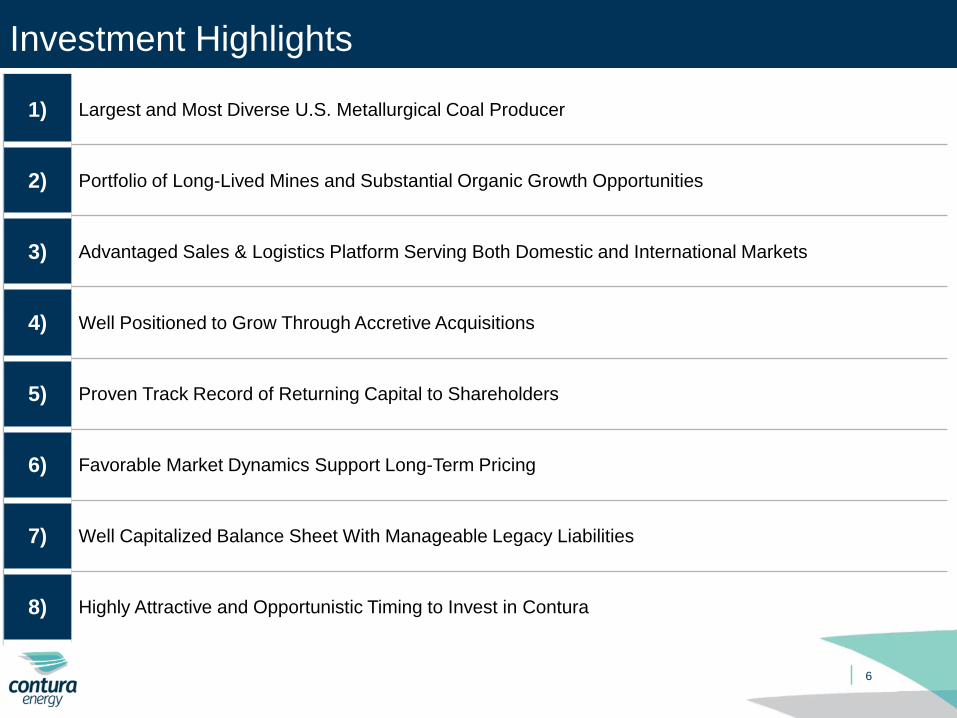
Investment Highlights
1) Largest and Most Diverse U.S. Metallurgical Coal Producer
2) Portfolio of Long-Lived Mines and Substantial Organic Growth Opportunities
3) Advantaged Sales & Logistics Platform Serving Both Domestic and International Markets
4) Well Positioned to Grow Through Accretive Acquisitions
5) Proven Track Record of Returning Capital to Shareholders
6) Favorable Market Dynamics Support Long-Term Pricing
7) Well Capitalized Balance Sheet With Manageable Legacy Liabilities
8) Highly Attractive and Opportunistic Timing to Invest in Contura
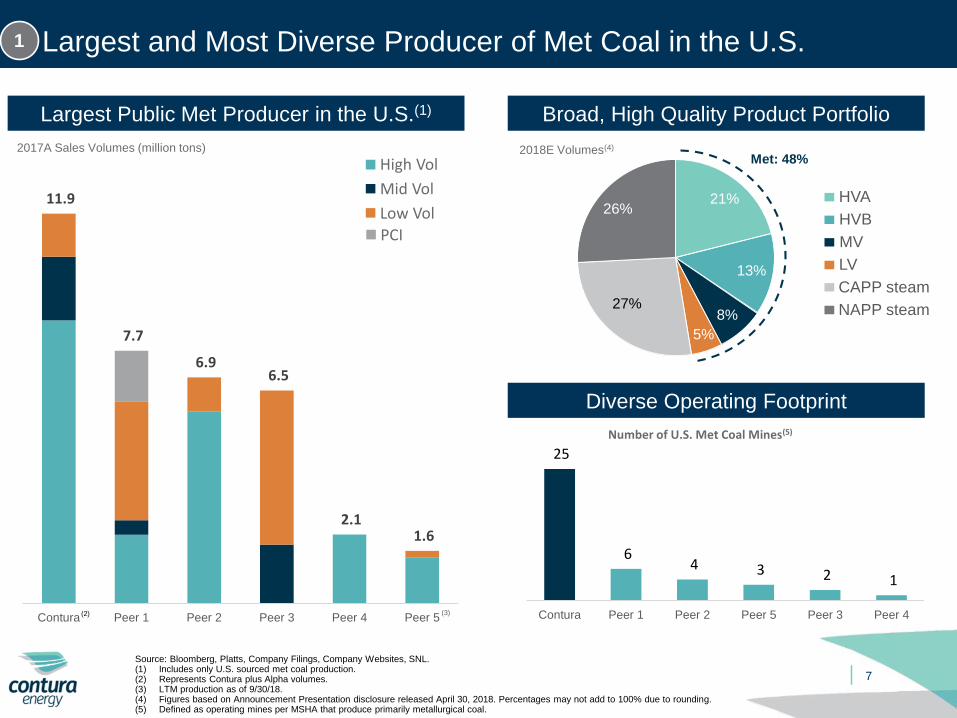
Diverse Operating Footprint
21%
13%
8%
5%
27%
26%
7
Largest and Most Diverse Producer of Met Coal in the U.S.
HVA
HVB
MV
LV
CAPP steam
Met: 48%
Source: Bloomberg, Platts, Company Filings, Company Websites, SNL.(1) Includes only U.S. sourced met coal production.(2) Represents Contura plus Alpha volumes.(3) LTM production as of 9/30/18.(4) Figures based on Announcement Presentation disclosure released April 30, 2018. Percentages may not add to 100% due to rounding.(5) Defined as operating mines per MSHA that produce primarily metallurgical coal.
NAPP steam
11.9
7.7
6.9 6.5
2.1 1.6
Contura Peer 1 Peer 2 Peer 3 Peer 4 Peer 5
2018E Volumes(4)
Broad, High Quality Product Portfolio
1
25
6 4 3 2 1
Contura Peer 1 Peer 2 Peer 5 Peer 3 Peer 4
Largest Public Met Producer in the U.S.(1)
2017A Sales Volumes (million tons)
Mid Vol
High Vol
Low Vol
(3)
PCI
Number of U.S. Met Coal Mines(5)
(2)
Deep Mine #42
FreeportPennsylvania
Virginia
West Virginia
Road Fork 52
Black Eagle / Panther Eagle
8
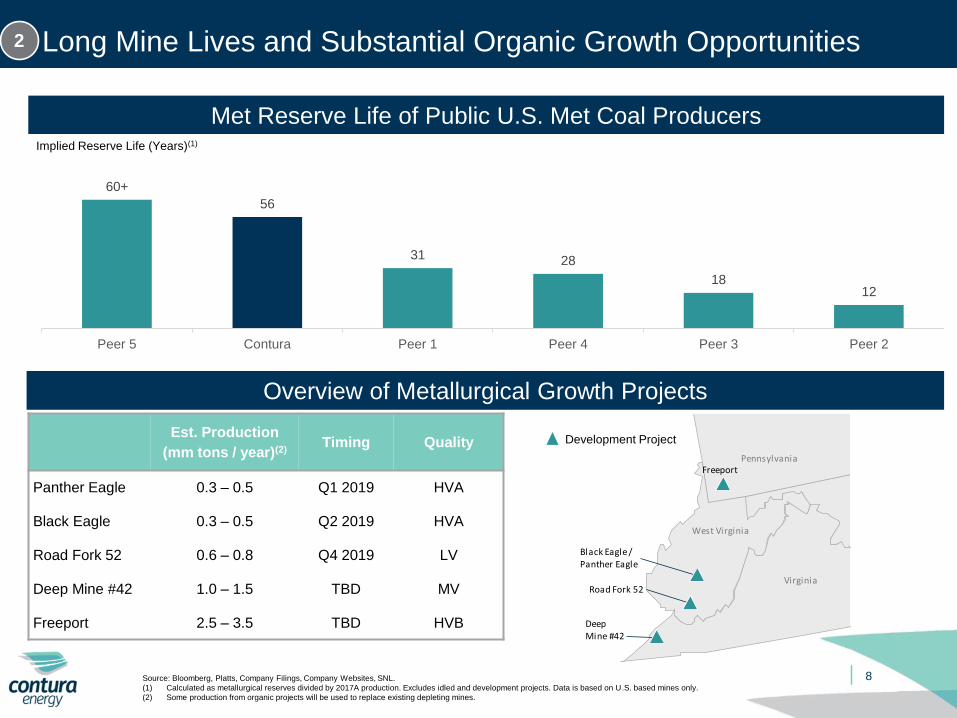
Long Mine Lives and Substantial Organic Growth Opportunities
Source: Bloomberg, Platts, Company Filings, Company Websites, SNL.
(1) Calculated as metallurgical reserves divided by 2017A production. Excludes idled and development projects. Data is based on U.S. based mines only.
(2) Some production from organic projects will be used to replace existing depleting mines.
Met Reserve Life of Public U.S. Met Coal Producers
60+
56
31 28
1812
Peer 5 Contura Peer 1 Peer 4 Peer 3 Peer 2
Est. Production
(mm tons / year)(2)Timing Quality
Panther Eagle 0.3 – 0.5 Q1 2019 HVA
Black Eagle 0.3 – 0.5 Q2 2019 HVA
Road Fork 52 0.6 – 0.8 Q4 2019 LV
Deep Mine #42 1.0 – 1.5 TBD MV
Freeport 2.5 – 3.5 TBD HVB
Overview of Metallurgical Growth Projects
Development Project
2
Implied Reserve Life (Years)(1)
9
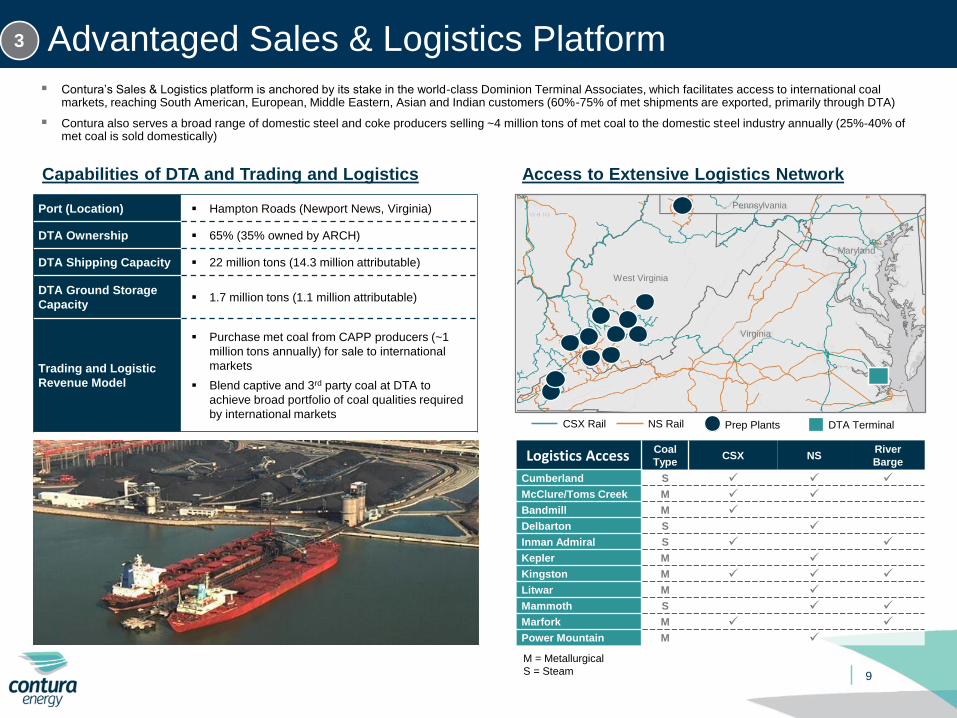
Advantaged Sales & Logistics Platform3
▪ Contura’s Sales & Logistics platform is anchored by its stake in the world-class Dominion Terminal Associates, which facilitates access to international coal markets, reaching South American, European, Middle Eastern, Asian and Indian customers (60%-75% of met shipments are exported, primarily through DTA)
▪ Contura also serves a broad range of domestic steel and coke producers selling ~4 million tons of met coal to the domestic steel industry annually (25%-40% of met coal is sold domestically)
Access to Extensive Logistics Network
Logistics Access Coal
TypeCSX NS
River
Barge
Cumberland S ✓ ✓ ✓
McClure/Toms Creek M ✓ ✓
Bandmill M ✓
Delbarton S ✓
Inman Admiral S ✓ ✓
Kepler M ✓
Kingston M ✓ ✓ ✓
Litwar M ✓
Mammoth S ✓ ✓
Marfork M ✓ ✓
Power Mountain M ✓
CSX Rail NS Rail Prep Plants DTA Terminal
West Virginia
Virginia
Maryland
PennsylvaniaPort (Location) ▪ Hampton Roads (Newport News, Virginia)
DTA Ownership ▪ 65% (35% owned by ARCH)
DTA Shipping Capacity ▪ 22 million tons (14.3 million attributable)
DTA Ground Storage
Capacity▪ 1.7 million tons (1.1 million attributable)
Trading and Logistic
Revenue Model
▪ Purchase met coal from CAPP producers (~1
million tons annually) for sale to international
markets
▪ Blend captive and 3rd party coal at DTA to
achieve broad portfolio of coal qualities required
by international markets
Capabilities of DTA and Trading and Logistics
M = Metallurgical
S = Steam
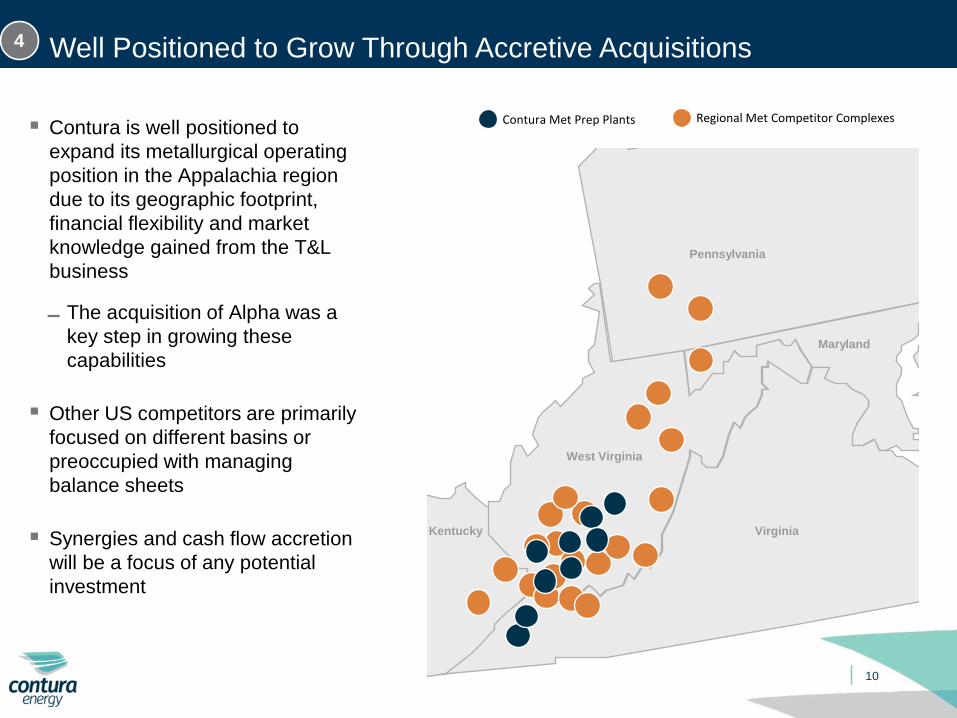
Well Positioned to Grow Through Accretive Acquisitions
▪ Contura is well positioned to
expand its metallurgical operating
position in the Appalachia region
due to its geographic footprint,
financial flexibility and market
knowledge gained from the T&L
business
▬ The acquisition of Alpha was a
key step in growing these
capabilities
▪ Other US competitors are primarily
focused on different basins or
preoccupied with managing
balance sheets
▪ Synergies and cash flow accretion
will be a focus of any potential
investment
4
Contura Met Prep Plants Regional Met Competitor Complexes
10
Virginia
West Virginia
Kentucky
Maryland
Pennsylvania
11
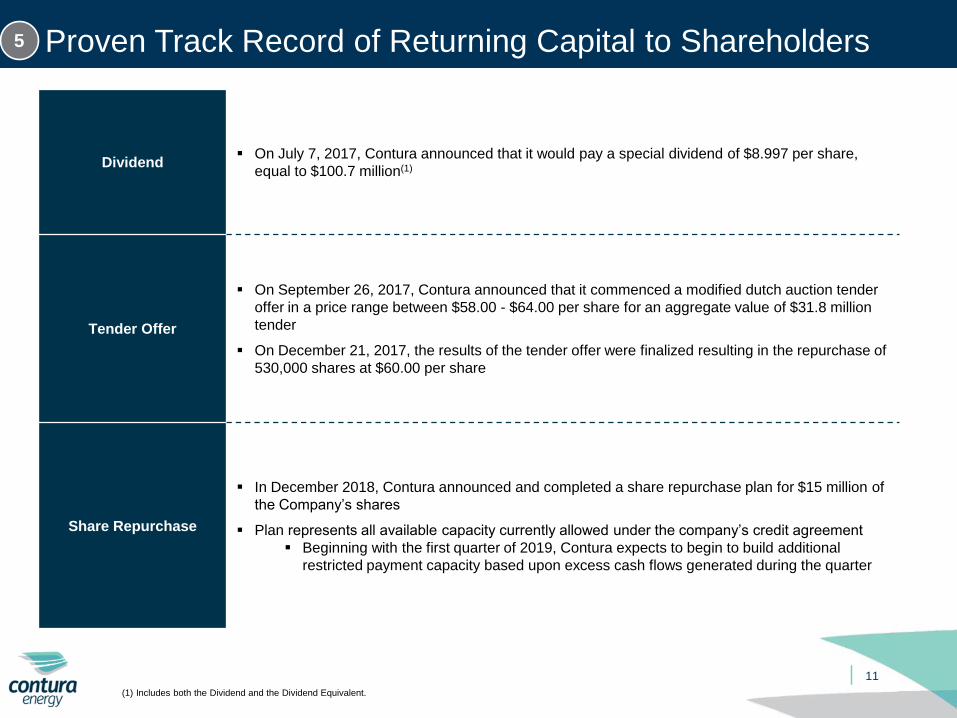
Proven Track Record of Returning Capital to Shareholders5
Dividend▪ On July 7, 2017, Contura announced that it would pay a special dividend of $8.997 per share,
equal to $100.7 million(1)
Tender Offer
▪ On September 26, 2017, Contura announced that it commenced a modified dutch auction tender
offer in a price range between $58.00 - $64.00 per share for an aggregate value of $31.8 million
tender
▪ On December 21, 2017, the results of the tender offer were finalized resulting in the repurchase of
530,000 shares at $60.00 per share
Share Repurchase
▪ In December 2018, Contura announced and completed a share repurchase plan for $15 million of
the Company’s shares
▪ Plan represents all available capacity currently allowed under the company’s credit agreement
▪ Beginning with the first quarter of 2019, Contura expects to begin to build additional
restricted payment capacity based upon excess cash flows generated during the quarter
(1) Includes both the Dividend and the Dividend Equivalent.
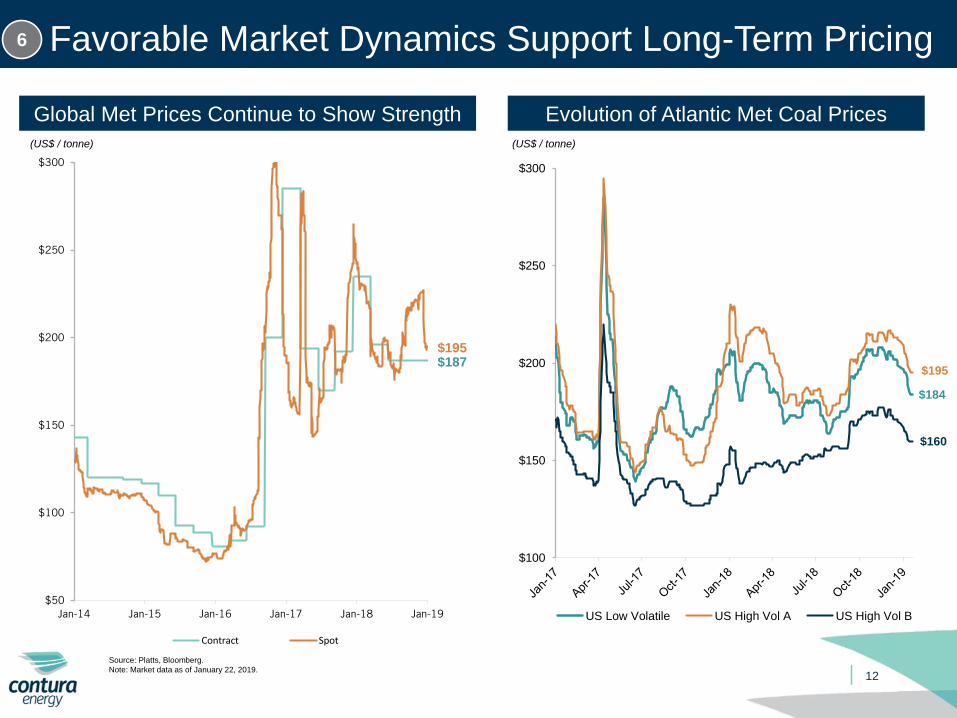
$184
$195
$160
$100
$150
$200
$250
$300
US Low Volatile US High Vol A US High Vol B
12
Favorable Market Dynamics Support Long-Term Pricing6
Evolution of Atlantic Met Coal PricesGlobal Met Prices Continue to Show Strength
(US$ / tonne)
Source: Platts, Bloomberg.
Note: Market data as of January 22, 2019.
(US$ / tonne)
$187
$50
$100
$150
$200
$250
$300
Jan-14 Jan-15 Jan-16 Jan-17 Jan-18 Jan-19
Contract Spot
$195
13
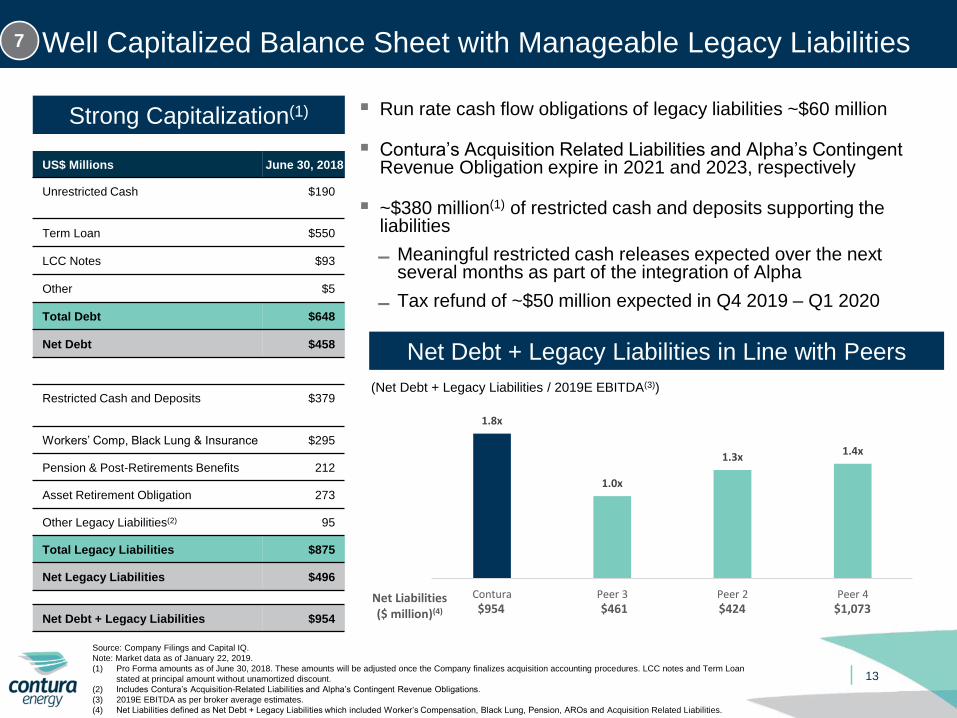
Well Capitalized Balance Sheet with Manageable Legacy Liabilities
Net Debt + Legacy Liabilities in Line with Peers
Net Liabilities ($ million)(4) $954 $461 $424 $1,073
7
Strong Capitalization(1)
US$ Millions June 30, 2018
Unrestricted Cash $190
Term Loan $550
LCC Notes $93
Other $5
Total Debt $648
Net Debt $458
Restricted Cash and Deposits $379
Workers’ Comp, Black Lung & Insurance $295
Pension & Post-Retirements Benefits 212
Asset Retirement Obligation 273
Other Legacy Liabilities(2) 95
Total Legacy Liabilities $875
Net Legacy Liabilities $496
Net Debt + Legacy Liabilities $954
Source: Company Filings and Capital IQ.
Note: Market data as of January 22, 2019.
(1) Pro Forma amounts as of June 30, 2018. These amounts will be adjusted once the Company finalizes acquisition accounting procedures. LCC notes and Term Loan
stated at principal amount without unamortized discount.
(2) Includes Contura’s Acquisition-Related Liabilities and Alpha’s Contingent Revenue Obligations.
(3) 2019E EBITDA as per broker average estimates.
(4) Net Liabilities defined as Net Debt + Legacy Liabilities which included Worker’s Compensation, Black Lung, Pension, AROs and Acquisition Related Liabilities.
(Net Debt + Legacy Liabilities / 2019E EBITDA(3))
1.8x
1.0x
1.3x 1.4x
Contura Peer 3 Peer 2 Peer 4
▪ Run rate cash flow obligations of legacy liabilities ~$60 million
▪ Contura’s Acquisition Related Liabilities and Alpha’s Contingent Revenue Obligation expire in 2021 and 2023, respectively
▪ ~$380 million(1) of restricted cash and deposits supporting the liabilities
▬ Meaningful restricted cash releases expected over the next several months as part of the integration of Alpha
▬ Tax refund of ~$50 million expected in Q4 2019 – Q1 2020
14
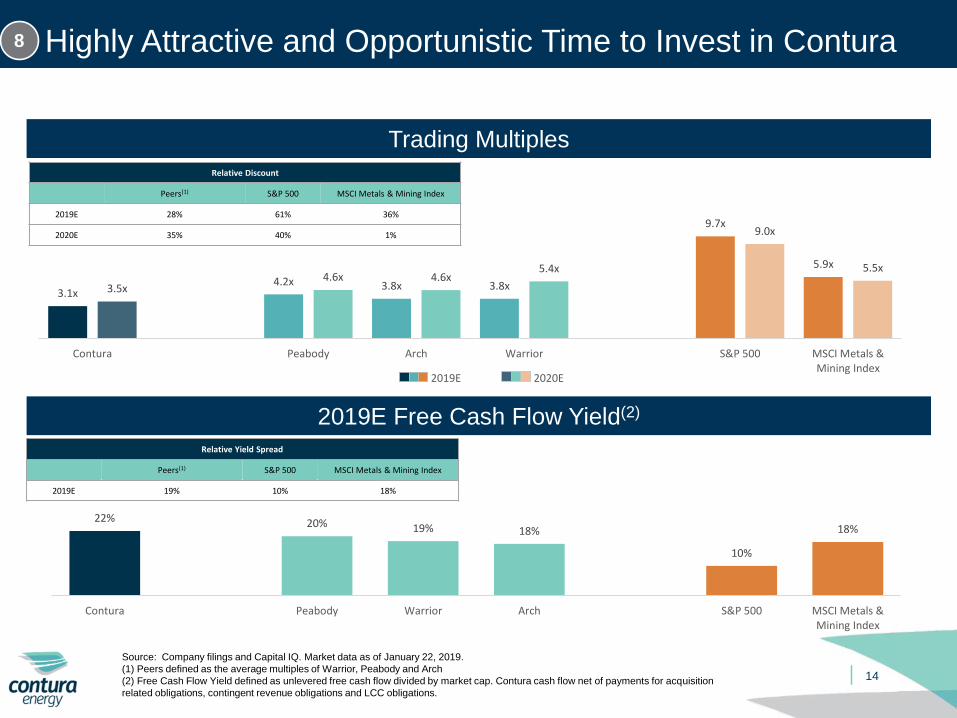
Highly Attractive and Opportunistic Time to Invest in Contura8
Trading Multiples
2019E Free Cash Flow Yield(2)
Source: Company filings and Capital IQ. Market data as of January 22, 2019.
(1) Peers defined as the average multiples of Warrior, Peabody and Arch
(2) Free Cash Flow Yield defined as unlevered free cash flow divided by market cap. Contura cash flow net of payments for acquisition
related obligations, contingent revenue obligations and LCC obligations.
2019E 2020E
Relative Discount
Peers(1) S&P 500 MSCI Metals & Mining Index
2019E 28% 61% 36%
2020E 35% 40% 1%
Relative Yield Spread
Peers(1) S&P 500 MSCI Metals & Mining Index
2019E 19% 10% 18%
3.1x 4.2x 3.8x 3.8x
9.7x
5.9x
3.5x 4.6x 4.6x
5.4x
9.0x
5.5x
Contura Peabody Arch Warrior S&P 500 MSCI Metals &Mining Index
22% 20% 19% 18%
10%
18%
Contura Peabody Warrior Arch S&P 500 MSCI Metals &Mining Index
15
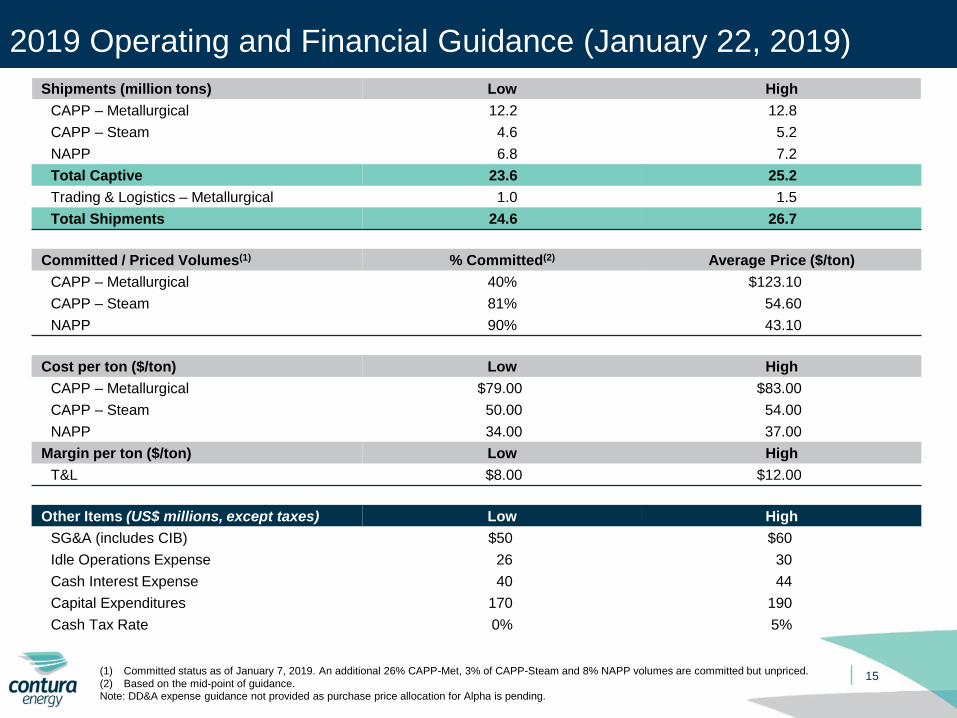
2019 Operating and Financial Guidance (January 22, 2019)
Shipments (million tons) Low High
CAPP – Metallurgical 12.2 12.8
CAPP – Steam 4.6 5.2
NAPP 6.8 7.2
Total Captive 23.6 25.2
Trading & Logistics – Metallurgical 1.0 1.5
Total Shipments 24.6 26.7
Committed / Priced Volumes(1) % Committed(2) Average Price ($/ton)
CAPP – Metallurgical 40% $123.10
CAPP – Steam 81% 54.60
NAPP 90% 43.10
Cost per ton ($/ton) Low High
CAPP – Metallurgical $79.00 $83.00
CAPP – Steam 50.00 54.00
NAPP 34.00 37.00
Margin per ton ($/ton) Low High
T&L $8.00 $12.00
Other Items (US$ millions, except taxes) Low High
SG&A (includes CIB) $50 $60
Idle Operations Expense 26 30
Cash Interest Expense 40 44
Capital Expenditures 170 190
Cash Tax Rate 0% 5%
(1) Committed status as of January 7, 2019. An additional 26% CAPP-Met, 3% of CAPP-Steam and 8% NAPP volumes are committed but unpriced.
(2) Based on the mid-point of guidance.Note: DD&A expense guidance not provided as purchase price allocation for Alpha is pending.
Appendix
January 2019
16
17
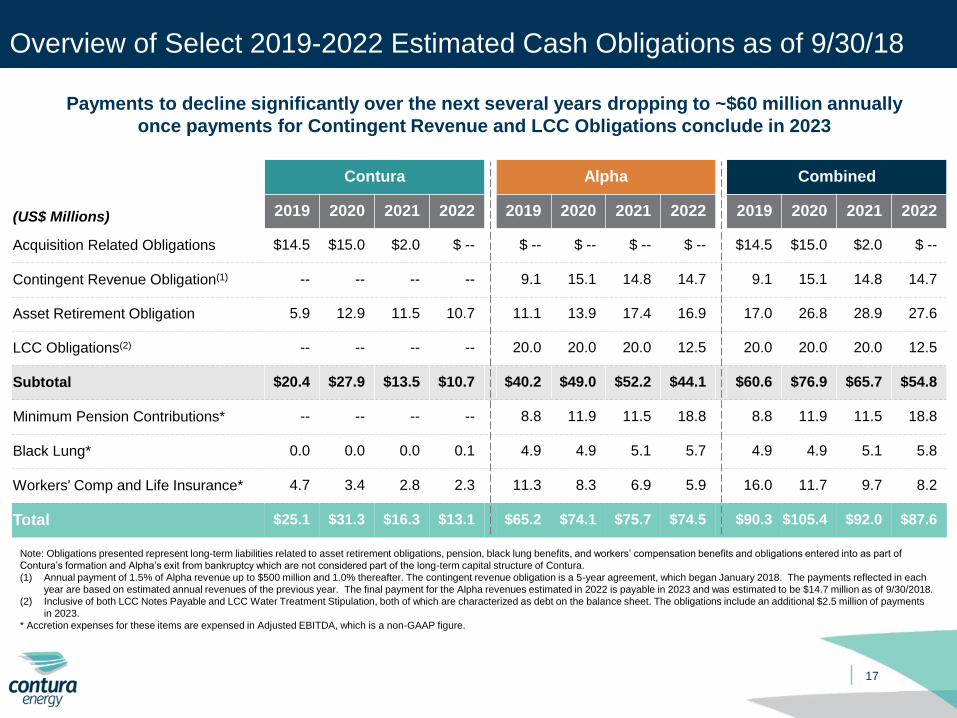
Overview of Select 2019-2022 Estimated Cash Obligations as of 9/30/18
Contura Alpha Combined
(US$ Millions) 2019 2020 2021 2022 2019 2020 2021 2022 2019 2020 2021 2022
Acquisition Related Obligations $14.5 $15.0 $2.0 $ -- $ -- $ -- $ -- $ -- $14.5 $15.0 $2.0 $ --
Contingent Revenue Obligation(1) -- -- -- -- 9.1 15.1 14.8 14.7 9.1 15.1 14.8 14.7
Asset Retirement Obligation 5.9 12.9 11.5 10.7 11.1 13.9 17.4 16.9 17.0 26.8 28.9 27.6
LCC Obligations(2) -- -- -- -- 20.0 20.0 20.0 12.5 20.0 20.0 20.0 12.5
Subtotal $20.4 $27.9 $13.5 $10.7 $40.2 $49.0 $52.2 $44.1 $60.6 $76.9 $65.7 $54.8
Minimum Pension Contributions* -- -- -- -- 8.8 11.9 11.5 18.8 8.8 11.9 11.5 18.8
Black Lung* 0.0 0.0 0.0 0.1 4.9 4.9 5.1 5.7 4.9 4.9 5.1 5.8
Workers' Comp and Life Insurance* 4.7 3.4 2.8 2.3 11.3 8.3 6.9 5.9 16.0 11.7 9.7 8.2
Total $25.1 $31.3 $16.3 $13.1 $65.2 $74.1 $75.7 $74.5 $90.3 $105.4 $92.0 $87.6
Note: Obligations presented represent long-term liabilities related to asset retirement obligations, pension, black lung benefits, and workers’ compensation benefits and obligations entered into as part of
Contura’s formation and Alpha’s exit from bankruptcy which are not considered part of the long-term capital structure of Contura.
(1) Annual payment of 1.5% of Alpha revenue up to $500 million and 1.0% thereafter. The contingent revenue obligation is a 5-year agreement, which began January 2018. The payments reflected in each
year are based on estimated annual revenues of the previous year. The final payment for the Alpha revenues estimated in 2022 is payable in 2023 and was estimated to be $14.7 million as of 9/30/2018.
(2) Inclusive of both LCC Notes Payable and LCC Water Treatment Stipulation, both of which are characterized as debt on the balance sheet. The obligations include an additional $2.5 million of payments
in 2023.
* Accretion expenses for these items are expensed in Adjusted EBITDA, which is a non-GAAP figure.
Payments to decline significantly over the next several years dropping to ~$60 million annually
once payments for Contingent Revenue and LCC Obligations conclude in 2023
18
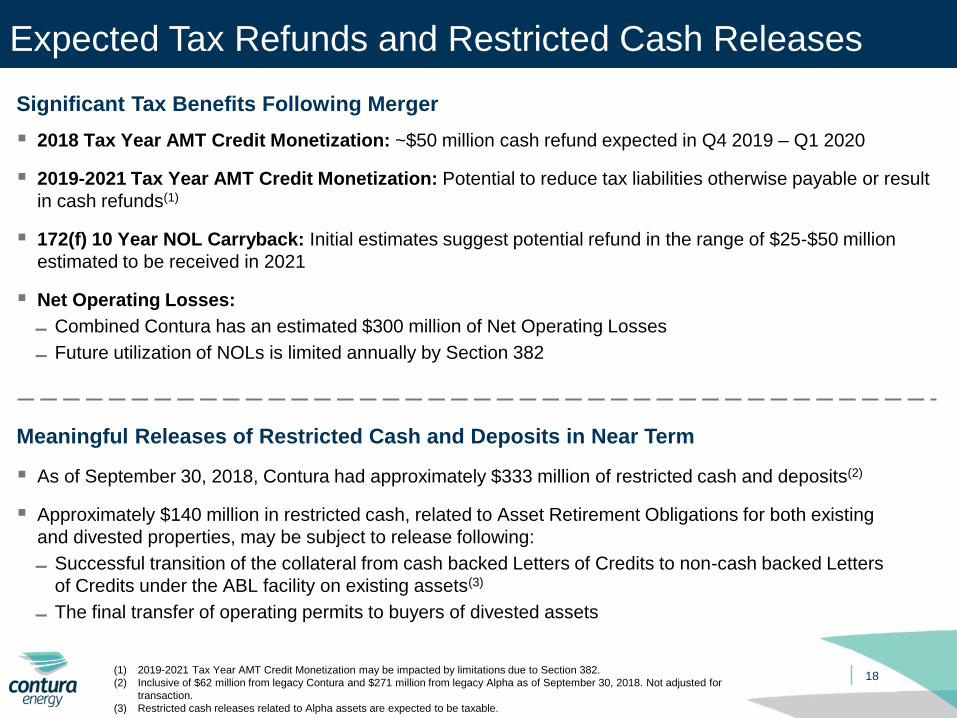
Expected Tax Refunds and Restricted Cash Releases
Meaningful Releases of Restricted Cash and Deposits in Near Term
▪ As of September 30, 2018, Contura had approximately $333 million of restricted cash and deposits(2)
▪ Approximately $140 million in restricted cash, related to Asset Retirement Obligations for both existing
and divested properties, may be subject to release following:
▬ Successful transition of the collateral from cash backed Letters of Credits to non-cash backed Letters
of Credits under the ABL facility on existing assets(3)
▬ The final transfer of operating permits to buyers of divested assets
Significant Tax Benefits Following Merger
▪ 2018 Tax Year AMT Credit Monetization: ~$50 million cash refund expected in Q4 2019 – Q1 2020
▪ 2019-2021 Tax Year AMT Credit Monetization: Potential to reduce tax liabilities otherwise payable or result
in cash refunds(1)
▪ 172(f) 10 Year NOL Carryback: Initial estimates suggest potential refund in the range of $25-$50 million
estimated to be received in 2021
▪ Net Operating Losses:
▬ Combined Contura has an estimated $300 million of Net Operating Losses
▬ Future utilization of NOLs is limited annually by Section 382
(1) 2019-2021 Tax Year AMT Credit Monetization may be impacted by limitations due to Section 382.
(2) Inclusive of $62 million from legacy Contura and $271 million from legacy Alpha as of September 30, 2018. Not adjusted for
transaction.
(3) Restricted cash releases related to Alpha assets are expected to be taxable.
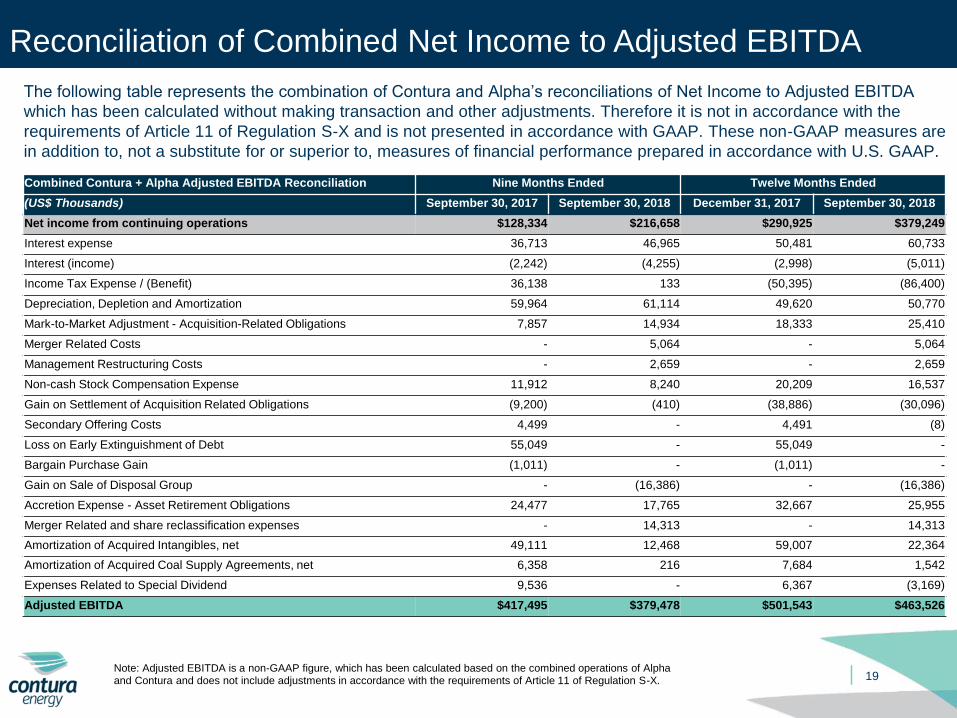
Combined Contura + Alpha Adjusted EBITDA Reconciliation Nine Months Ended Twelve Months Ended
(US$ Thousands) September 30, 2017 September 30, 2018 December 31, 2017 September 30, 2018
Net income from continuing operations $128,334 $216,658 $290,925 $379,249
Interest expense 36,713 46,965 50,481 60,733
Interest (income) (2,242) (4,255) (2,998) (5,011)
Income Tax Expense / (Benefit) 36,138 133 (50,395) (86,400)
Depreciation, Depletion and Amortization 59,964 61,114 49,620 50,770
Mark-to-Market Adjustment - Acquisition-Related Obligations 7,857 14,934 18,333 25,410
Merger Related Costs - 5,064 - 5,064
Management Restructuring Costs - 2,659 - 2,659
Non-cash Stock Compensation Expense 11,912 8,240 20,209 16,537
Gain on Settlement of Acquisition Related Obligations (9,200) (410) (38,886) (30,096)
Secondary Offering Costs 4,499 - 4,491 (8)
Loss on Early Extinguishment of Debt 55,049 - 55,049 -
Bargain Purchase Gain (1,011) - (1,011) -
Gain on Sale of Disposal Group - (16,386) - (16,386)
Accretion Expense - Asset Retirement Obligations 24,477 17,765 32,667 25,955
Merger Related and share reclassification expenses - 14,313 - 14,313
Amortization of Acquired Intangibles, net 49,111 12,468 59,007 22,364
Amortization of Acquired Coal Supply Agreements, net 6,358 216 7,684 1,542
Expenses Related to Special Dividend 9,536 - 6,367 (3,169)
Adjusted EBITDA $417,495 $379,478 $501,543 $463,526
19
Reconciliation of Combined Net Income to Adjusted EBITDA
The following table represents the combination of Contura and Alpha’s reconciliations of Net Income to Adjusted EBITDA
which has been calculated without making transaction and other adjustments. Therefore it is not in accordance with the
requirements of Article 11 of Regulation S-X and is not presented in accordance with GAAP. These non-GAAP measures are
in addition to, not a substitute for or superior to, measures of financial performance prepared in accordance with U.S. GAAP.
Note: Adjusted EBITDA is a non-GAAP figure, which has been calculated based on the combined operations of Alpha and Contura and does not include adjustments in accordance with the requirements of Article 11 of Regulation S-X.
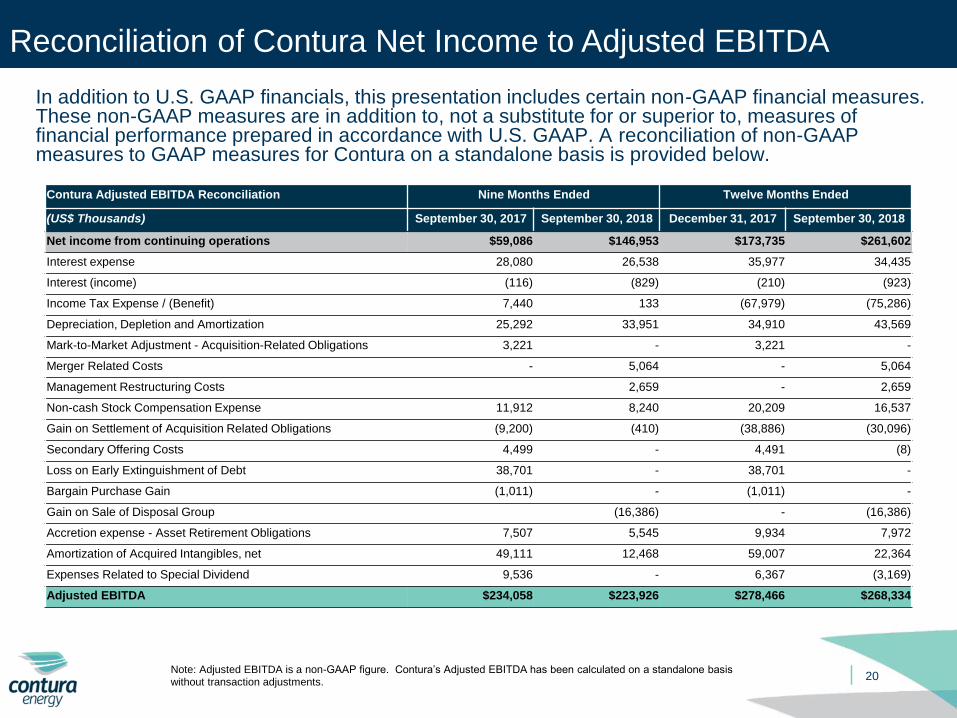
Contura Adjusted EBITDA Reconciliation Nine Months Ended Twelve Months Ended
(US$ Thousands) September 30, 2017 September 30, 2018 December 31, 2017 September 30, 2018
Net income from continuing operations $59,086 $146,953 $173,735 $261,602
Interest expense 28,080 26,538 35,977 34,435
Interest (income) (116) (829) (210) (923)
Income Tax Expense / (Benefit) 7,440 133 (67,979) (75,286)
Depreciation, Depletion and Amortization 25,292 33,951 34,910 43,569
Mark-to-Market Adjustment - Acquisition-Related Obligations 3,221 - 3,221 -
Merger Related Costs - 5,064 - 5,064
Management Restructuring Costs 2,659 - 2,659
Non-cash Stock Compensation Expense 11,912 8,240 20,209 16,537
Gain on Settlement of Acquisition Related Obligations (9,200) (410) (38,886) (30,096)
Secondary Offering Costs 4,499 - 4,491 (8)
Loss on Early Extinguishment of Debt 38,701 - 38,701 -
Bargain Purchase Gain (1,011) - (1,011) -
Gain on Sale of Disposal Group (16,386) - (16,386)
Accretion expense - Asset Retirement Obligations 7,507 5,545 9,934 7,972
Amortization of Acquired Intangibles, net 49,111 12,468 59,007 22,364
Expenses Related to Special Dividend 9,536 - 6,367 (3,169)
Adjusted EBITDA $234,058 $223,926 $278,466 $268,334
20
Reconciliation of Contura Net Income to Adjusted EBITDA
In addition to U.S. GAAP financials, this presentation includes certain non-GAAP financial measures. These non-GAAP measures are in addition to, not a substitute for or superior to, measures of financial performance prepared in accordance with U.S. GAAP. A reconciliation of non-GAAP measures to GAAP measures for Contura on a standalone basis is provided below.
Note: Adjusted EBITDA is a non-GAAP figure. Contura’s Adjusted EBITDA has been calculated on a standalone basis without transaction adjustments.
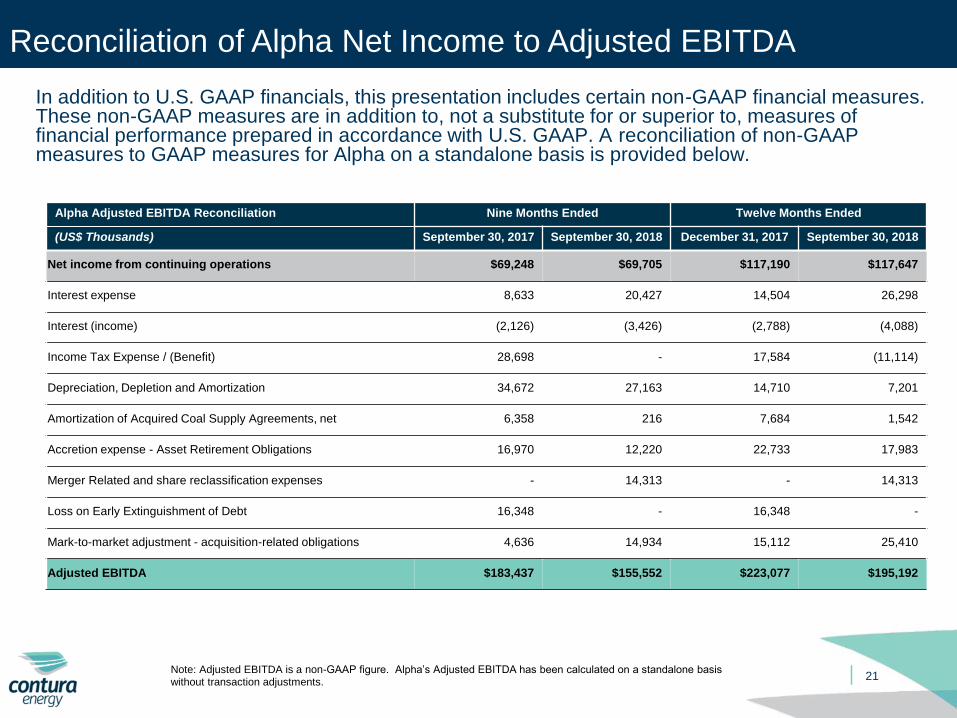
Alpha Adjusted EBITDA Reconciliation Nine Months Ended Twelve Months Ended
(US$ Thousands) September 30, 2017 September 30, 2018 December 31, 2017 September 30, 2018
Net income from continuing operations $69,248 $69,705 $117,190 $117,647
Interest expense 8,633 20,427 14,504 26,298
Interest (income) (2,126) (3,426) (2,788) (4,088)
Income Tax Expense / (Benefit) 28,698 - 17,584 (11,114)
Depreciation, Depletion and Amortization 34,672 27,163 14,710 7,201
Amortization of Acquired Coal Supply Agreements, net 6,358 216 7,684 1,542
Accretion expense - Asset Retirement Obligations 16,970 12,220 22,733 17,983
Merger Related and share reclassification expenses - 14,313 - 14,313
Loss on Early Extinguishment of Debt 16,348 - 16,348 -
Mark-to-market adjustment - acquisition-related obligations 4,636 14,934 15,112 25,410
Adjusted EBITDA $183,437 $155,552 $223,077 $195,192
21
Reconciliation of Alpha Net Income to Adjusted EBITDA
In addition to U.S. GAAP financials, this presentation includes certain non-GAAP financial measures. These non-GAAP measures are in addition to, not a substitute for or superior to, measures of financial performance prepared in accordance with U.S. GAAP. A reconciliation of non-GAAP measures to GAAP measures for Alpha on a standalone basis is provided below.
Note: Adjusted EBITDA is a non-GAAP figure. Alpha’s Adjusted EBITDA has been calculated on a standalone basis without transaction adjustments.