Embed Size (px)
Citation preview

ORNL/TM-2012/14
CONTROLLING INTAKE OF URANIUM IN THE WORKPLACE: APPLICATIONS OF BIOKINETIC MODELING AND OCCUPATIONAL MONITORING DATA
January 2012
Prepared by R. W. Leggett1, K. F. Eckerman1, C. W. McGinn1, R. A. Meck2 1Environmental Sciences Division Oak Ridge National Laboratory P.O. Box 2008 Oak Ridge, TN 37831-6153 2Science and Technology Systems, LLC 9408 Corsica Drive Bethesda, MD 20814-2814

ii
DOCUMENT AVAILABILITY
Reports produced after January 1, 1996, are generally available free via the U.S. Department of Energy (DOE) Information Bridge. Web site http://www.osti.gov/bridge
Reports produced before January 1, 1996, may be purchased by members of the public from the following source. National Technical Information Service 5285 Port Royal Road Springfield, VA 22161 Telephone 703-605-6000 (1-800-553-6847) TDD 703-487-4639 Fax 703-605-6900 E-mail [email protected] Web site http://www.ntis.gov/support/ordernowabout.htm
Reports are available to DOE employees, DOE contractors, Energy Technology Data Exchange (ETDE) representatives, and International Nuclear Information System (INIS) representatives from the following source. Office of Scientific and Technical Information P.O. Box 62 Oak Ridge, TN 37831 Telephone 865-576-8401 Fax 865-576-5728 E-mail [email protected] Web site http://www.osti.gov/contact.html
This report was prepared as an account of work sponsored by an agency of the United States Government. Neither the United States Government nor any agency thereof, nor any of their employees, makes any warranty, express or implied, or assumes any legal liability or responsibility for the accuracy, completeness, or usefulness of any information, apparatus, product, or process disclosed, or represents that its use would not infringe privately owned rights. Reference herein to any specific commercial product, process, or service by trade name, trademark, manufacturer, or otherwise, does not necessarily constitute or imply its endorsement, recommendation, or favoring by the United States Government or any agency thereof. The views and opinions of authors expressed herein do not necessarily state or reflect those of the United States Government or any agency thereof.

CONTROLLING INTAKE OF URANIUM IN THE WORKPLACE: APPLICATIONS OF BIOKINETIC MODELING AND OCCUPATIONAL MONITORING DATA
January 2012
Prepared by R. W. Leggett1, K. F. Eckerman1, C. W. McGinn1, R. A. Meck2 1Environmental Sciences Division Oak Ridge National Laboratory P.O. Box 2008 Oak Ridge, TN 37831-6153 2Science and Technology Systems, LLC 9408 Corsica Drive Bethesda, MD 20814-2814
OAK RIDGE NATIONAL LABORATORY Oak Ridge, Tennessee 37831-6283 Managed by UT-BATTELLE, LLC
for the U.S. DEPARTMENT OF ENERGY under contract DE-AC05-00OR22725


iii
ABSTRACT
This report provides methods to interpret and apply occupational uranium monitoring data. The
methods are based on current international radiation protection guidance, current information on
the chemical toxicity of uranium, and best available biokinetic models for uranium. Emphasis is
on air monitoring data and three types of bioassay data: the concentration of uranium in urine;
the concentration of uranium in feces; and the externally measured content of uranium in the
chest. Primary Reference guidance levels for prevention of chemical effects and limitation of
radiation effects are selected based on a review of current scientific data and regulatory
principles for setting standards. Generic investigation levels and immediate action levels are
then defined in terms of these primary guidance levels. The generic investigation and immediate
actions levels are stated in terms of radiation dose and concentration of uranium in the kidneys.
These are not directly measurable quantities, but models can be used to relate the generic levels
to the concentration of uranium in air, urine, or feces, or the total uranium activity in the chest.
Default investigation and immediate action levels for uranium in air, urine, feces, and chest are
recommended for situations in which there is little information on the form of uranium taken into
the body. Methods are prescribed also for deriving case-specific investigation and immediate
action levels for uranium in air, urine, feces, and chest when there is sufficient information on
the form of uranium to narrow the range of predictions of accumulation of uranium in the main
target organs for uranium: kidneys for chemical effects and lungs for radiological effects. In
addition, methods for using the information herein for alternative guidance levels, different from
the ones selected for this report, are described.


v
FOREWORD
This report provides a detailed description of uranium biokinetics and bioassays applicable to
evaluation of health risks from potential intakes in an occupational setting. The report addresses
both the radiotoxicity and chemical (renal) toxicity of uranium. For reference occupational
exposure scenarios, predictions of the time-dependent concentration of uranium in tissues and
bioassay are based on biokinetic models currently recommended by the International
Commission on Radiological Protection (ICRP). The ICRP’s models and default assumptions
for uranium were based primarily on data for human subjects exposed to uranium in controlled
studies or in occupational or environmental settings. In addition, the ICRP considered an
extensive database for uranium in laboratory animals. Sensitivity studies examine the robustness
of these models and assumptions to ensure that radiation doses and accumulation of uranium in
the kidneys are not underestimated. For example, analyses indicate that a default 5 µm activity
median aerodynamic diameter particle size can lead to an underestimation of radiation dose as
well as the concentration of uranium in the kidneys if inhaled particles are very small. Graphs
and tables illustrate interchanges of action levels depending on whether radiotoxicity or chemical
toxicity is the limiting consideration for a given form and isotopic composition of uranium.
Different chemical and physical forms of uranium require different bioassay methods for the
most reliable results. These methods include urine and fecal analyses and in vivo analysis. An
appendix critically examines the feasibility of using hair or nails as a bioassay for uranium.
Other appendices address bioassay programs, other radionuclides frequently encountered at
uranium facilities, and the current regulatory status of occupational standards for uranium among
U.S. Federal agencies.
This report is an up-to-date, technical resource on uranium biokinetics and bioassays. It is
expected to be a useful reference or text for training and the classroom.


vii
TABLE OF CONTENTS
Page
ABSTRACT ................................................................................................................................... iii
FOREWORD .................................................................................................................................. v
TABLE OF CONTENTS .............................................................................................................. vii
LIST OF FIGURES ....................................................................................................................... ix
LIST OF TABLES ......................................................................................................................... xi
ACRONYMS AND ABBREVIATIONS ..................................................................................... xv
1 INTRODUCTION .................................................................................................................. 1
2 Reference PRIMARY GUIDANCE LEVELS ....................................................................... 9
2.1 Reference Primary Guidance for Uranium as a Chemical Hazard ............................... 9 2.2 Reference Primary Guidance for Uranium as a Radiation Hazard ............................. 12
3 BIOKINETIC MODELS USED TO DERIVE SECONDARY REFERENCE GUIDANCE
LEVELS FOR EXPOSURE TO URANIUM ....................................................................... 15 3.1 Respiratory Kinetics.................................................................................................... 15
3.1.1 General Features of the ICRP’s Human Respiratory Tract Model ................. 15 3.1.2 Application of the HRTM to Various Forms of Uranium .............................. 19
3.1.3 Typical Sizes of Airborne Particles in Work Environments ........................... 24 3.1.4 Sensitivity of Derived Secondary Reference Guidance Levels to AMAD ..... 26 3.1.5 Comparison of AMAD and MMAD ............................................................... 29
3.2 Gastrointestinal Kinetics ............................................................................................. 31
3.2.1 ICRP Models of Gastrointestinal Transit ........................................................ 31 3.2.2 Pub30 Model of the GI Tract .......................................................................... 31 3.2.3 ICRP’s Updated Human Alimentary Tract Model ......................................... 32
3.2.4 Gastrointestinal Absorption of Uranium ......................................................... 33 3.3 Biokinetics of Uranium that Reaches Blood ............................................................... 34 3.4 Model Predictions of Retention and Excretion of Uranium Following Acute
Inhalation .............................................................................................................................. 37 3.5 Estimates of Effective Dose Per Unit Intake of Natural Uranium Isotopes ............... 51
4 VARIATION WITH TIME IN URINARY URANIUM: A COMPLICATING FACTOR IN
INTERPRETATION OF URINE MEASUREMENTS ........................................................ 53
5 DERIVATION OF INVESTIGATION AND IMMEDIATE ACTION LEVELS .............. 61
5.1 Objective ..................................................................................................................... 61 5.2 Models and Assumptions Used in the Derivations ..................................................... 61
5.3 Action Levels Based on Air Monitoring ..................................................................... 62 5.3.1 Action Levels for the Concentration of Airborne Uranium if the Form of
Uranium is Not Known ................................................................................... 63 5.3.2 Action Levels for the Concentration of Uranium in Air for Reasonably Well
Characterized Forms of Uranium .................................................................... 66 5.4 Action Levels Based on Urinary Uranium.................................................................. 74

viii
5.4.1 Action Levels for Urinary Uranium for Inhalation of an Unknown Form of
Uranium .......................................................................................................... 74 5.4.2 Action Levels for Urinary Uranium for Inhalation of a Reasonably Well
Characterized Form of Uranium ..................................................................... 77
5.4.3 Action Levels for Urinary Uranium for Intake through a Wound .................. 78 5.5 Action Levels Based on Measurement of Uranium in Feces ...................................... 81 5.6 Action Levels Based on External Measurement of Uranium in the Chest ................. 82
6 REFERENCES ..................................................................................................................... 85
APPENDIX A: BASIC COMPONENTS OF A URANIUM BIOASSAY PROGRAM .............. 1
A.1 . Common Methods of Monitoring for Uranium .......................................................... 1 A.2 . Frequency and Normalization of Bioassay Measurements ......................................... 2 A.3 . Overview of Analytical Methods for Uranium Bioassay ........................................... 3
A.3.1. In vitro Measurement of Uranium ............................................................................... 3 A.3.2. In vivo Measurement of Uranium ................................................................................ 6 A.4 . Examples of Ongoing Uranium Bioassay Programs .................................................. 7
A.4.1. Oak Ridge National Laboratory ................................................................................... 7 A.4.2. U.S. Army Center for Health Promotion and Preventive Medicine ............................ 9
APPENDIX B: FEASIBILITY OF USING HAIR AND NAILS AS BIOASSAY MEDIA FOR
URANIUM ............................................................................................................................. 1 B.1 . Studies of Uranium Levels in Hair and Nails ............................................................. 1
B.2 . The Problem of Distinguishing Between Internal and External Sources ................... 2 B.3 . Example of a Toxin for Which Hair is a Workable Bioassay Medium ...................... 3
APPENDIX C: OTHER RADIONUCLIDES FREQUENTLY ENCOUNTERED AT
URANIUM FACILITIES ....................................................................................................... 1
C.1 . Purpose of This Appendix .......................................................................................... 1 C.2 . Examples ..................................................................................................................... 1
C.3 . Biokinetic and Dosimetric Data for 226
Ra ................................................................... 3 C.4 . Biokinetic and Dosimetric Data for
230Th ................................................................... 6
C.5 . Exposure to 222
Rn Progeny ....................................................................................... 10
APPENDIX D: COMPARISON OF REFERENCE GUIDANCE IN THIS REPORT WITH U.S.
Federal Agency Guidance and Regulations ............................................................................ 1 D.1. U.S. Nuclear Regulatory Commission Regulatory Guides and Regulation.................... 1 D.1.1. Regulatory Guide 8.11: Applications of Bioassay for Uranium .................................. 1
D.1.2 Regulatory Guide 8.22: Bioassay at Uranium Mills ................................................... 2 D.1.3. Appendix B to 10CFR20 .............................................................................................. 5 D.2. U.S. Department of Energy Regulation and Technical Standard.................................. 11
D.2.1. 10 CFR 851.23 “Safety and Health Standards.” ........................................................ 11 D.3. U.S. Department of Labor, Occupational Safety and Health Administration (OSHA), 11 D.4. American Conference of Governmental Industrial Hygienists (ACGIH) Threshold
Limit Values (TLVs) for chemical substances and physical agents and Biological Exposure
Indices (BEIs), 2011. ............................................................................................................ 12

ix
LIST OF FIGURES
Page
Figure 3.1 Structure of the ICRP’s respiratory tract model ..................................................... 15
Figure 3.2 Model within the HRTM describing time-dependent absorption to blood. ............. 17
Figure 3.3 Simplification of the model of time-dependent absorption to blood by removal
of the compartment “Bound material” ..................................................................... 17
Figure 3.4 Model of time-dependent absorption within the HRTM generally applied
when the dissolution rate of the material decreases with time.. .............................. 18
Figure 3.5 For inhaled 234
U, sensitivity of effective dose coefficient (E) and peak kidney
concentration (P-acute and P-chronic for acute and chronic intake, respectively)
to particle size .......................................................................................................... 28
Figure 3.6 Structure of the gastrointestinal tract model used by the ICRP since the late
1970s ........................................................................................................................ 31
Figure 3.7 Structure of the HATM. ........................................................................................... 32
Figure 3.8. The ICRP’s model structure for uranium................................................................. 35
Figure 3.9 Model predictions of the time-dependent concentration of uranium in the
kidneys, assuming either acute input of 1 μg to blood at time zero or
continuous input to blood at the rate 1 μg/d. ........................................................... 46
Figure 3.10 Model predictions of the concentration of uranium in the kidneys as a function
of time after acute inhalation of 1 μg of uranium of Type F, Type M, or
Type S (5 μm AMAD). ............................................................................................ 46
Figure 3.11 Model predictions of the concentration of uranium in the kidneys as a function
of time after start of continuous inhalation of uranium of Type F, Type M, or
Type S (5 μm AMAD) at the rate 1 μg/d. ................................................................ 47
Figure 3.12 Model predictions of the concentration ratio of uranium in kidneys (μg/g) to
uranium in urine (μg/mL) as a function of time after acute inhalation of uranium
(particle size 5 μm AMAD). .................................................................................... 49
Figure 3.13 Model predictions of the concentration ratio of uranium in kidneys (μg/g) to
uranium in urine (μg/mL) as a function of duration of continuous inhalation of
uranium at a constant rate ........................................................................................ 51
Figure 4.1 For the hypothetical case described in Example 4.1, model predictions of the
urinary excretion rate (rate of entry of uranium into the urinary bladder
contents) during Week 4. ......................................................................................... 54

x
LIST OF FIGURES (continued)
Page
Figure 4.2 For inhalation of a relatively soluble form of uranium (Type F, 5 μm
AMAD; intake = 1 mg/wk), projected urinary excretion rate and
concentration of uranium in kidneys for different patterns of exposure:
continuous intake at a constant rate or inhalation at a constant rate
during regular work hours........................................................................................ 56
Figure 4.3 For inhalation of a moderately soluble form of uranium (Type M, 5 μm
AMAD; intake = 1 mg/wk), projected urinary excretion rate and
concentration of uranium in kidneys for different patterns of exposure:
continuous intake at a constant rate or inhalation at a constant rate
during regular work hours........................................................................................ 57
Figure 4.4 For inhalation of a relatively insoluble form of uranium (Type S, 5 μm
AMAD; intake = 1 mg/wk), projected urinary excretion rate and
concentration of uranium in kidneys for different patterns of exposure:
continuous intake at a constant rate or inhalation at a constant rate
during regular work hours........................................................................................ 58
Figure 4.5 For inhalation of a relatively soluble (Type F, top panel) or moderately
soluble (Type M) form of uranium (5 μm AMAD, intake = 1 mg/wk),
projected urinary excretion rate for different patterns of exposure:
continuous intake at a constant rate or inhalation at a constant rate
during regular work hours........................................................................................ 59
Figure 4.6 Sequential measurements of urinary uranium in a worker acutely exposed to
uranium as an oxide. ................................................................................................ 60
Figure 5.1 Graphs used to determine investigation levels for the concentration of uranium
in air. The cases considered are depleted, natural, or 235
U-enriched uranium of
Type F, M, or S (5 μm AMAD) ............................................................................... 69
Figure 5.2 Graphs used to determine immediate action levels for the concentration of
uranium in air ........................................................................................................... 72
Figure 5.3 Pattern of change with time in urinary uranium for the hypothetical worker
in Example 5.4 ......................................................................................................... 79
Figure 5.4 Urinary data for the hypothetical case described in Example 5.5. ........................... 80
Figure C.1 Structure of the systemic biokinetic model for thorium .............................................7
Figure D.1 For an unknown form of uranium, guidance values given in this report for
the average concentration of uranium for different exposure periods ....................... 5

xi
LIST OF TABLES
Page
Table 1.1 Generic criteria for investigation levels and immediate action levels ....................... 4
Table 1.2 Summary of investigation and immediate action levels for inhalation
exposure to an unknown form of uranium ................................................................. 6
Table 3.1 Default absorption types for different forms of airborne uranium .......................... 20
Table 3.2 Default and material-specific parameter values of the model shown in
Figure 3.4, representing time-dependent dissolution rates of uranium
compounds ............................................................................................................... 23
Table 3.3 Sizes of uranium aerosols in work environments .................................................... 25
Table 3.4 Transfer coefficients in ICRP’s model for systemic uranium ................................. 36
Table 3.5 Model predictions of retention and excretion (fraction of intake) of uranium
following acute input of uranium into blood ........................................................... 38
Table 3.6 Model predictions of retention and excretion (multiple of daily intake) of
uranium during continuous input of uranium into blood at a constant rate ............. 39
Table 3.7 Model predictions of retention and excretion of uranium (fraction of
intake) following acute inhalation of a relatively soluble form (Type F,
5 μm AMAD) ........................................................................................................... 40
Table 3.8 Model predictions of retention and excretion of uranium (fraction of
intake) following acute inhalation of a moderately soluble form (Type M,
5 μm AMAD) ........................................................................................................... 41
Table 3.9 Model predictions of retention and excretion of uranium (fraction of
intake) following acute inhalation of a relatively insoluble form (Type S,
5 μm AMAD) ........................................................................................................... 42
Table 3.10 Model predictions of retention and excretion of uranium (multiple of daily
intake) as a function of time after start of continuous inhalation of a
relatively soluble form (Type F, 5 μm AMAD) ...................................................... 43
Table 3.11 Model predictions of retention and excretion of uranium (multiple of daily
intake) as a function of time after start of continuous inhalation of a
moderately soluble form (Type M, 5 μm AMAD) .................................................. 44
Table 3.12 Model predictions of retention and excretion of uranium (multiple of daily
intake) as a function of time after start of continuous inhalation of a
relatively insoluble form (Type S, 5 μm AMAD) ................................................... 45
Table 3.13 Model predictions of kidney to urine concentration ratio as a function of
time following acute inhalation of uranium by a worker (particle size =
5 μm AMAD) ........................................................................................................... 48

xii
LIST OF TABLES (continued)
Page
Table 3.14 Model predictions of kidney to urine concentration ratio as a function of
time after the start of continuous intake of uranium at a constant rate by
inhalation, ingestion, or direct input into blood ....................................................... 50
Table 3.15 Effective dose coefficients for intravenously injected U isotopes ........................... 52
Table 3.16 Effective dose coefficients for inhalation of uranium isotopes of Type F,
M, or S (5 μm AMAD) ............................................................................................ 52
Table 3.17 Specific activities of U isotopes ............................................................................... 52
Table 4.1 Model predictions of total uranium intake based on urinary uranium
measurement after weekend and alternate assumed patterns of exposure ............... 55
Table 5.1 Investigation and immediate action levels of uranium in air for application
to cases in which the form of uranium is not known ............................................... 66
Table 5.2 Investigation levels for the concentration of depleted, natural, or 235
U-enriched uranium in air for different levels of solubility of uranium,
based on the default particle size 5 μm AMAD ....................................................... 70
Table 5.3 Immediate action levels for the concentration of depleted, natural, or 235
U-enriched uranium in air for different levels of solubility (different
absorption types) of uranium, based on the default particle size 5 μm
AMAD ..................................................................................................................... 73
Table 5.4 Investigation and immediate action levels for urine for application to cases
in which the form of airborne uranium is not known .............................................. 77
Table 5.5 Investigation and immediate action levels for feces for cases in which
chronic inhalation of a relatively insoluble form of uranium is known
or suspected.............................................................................................................. 82
Table 5.6 Investigation and immediate action levels for uranium in the chest based
on routine periodic measurements ........................................................................... 84
Table A.1 Uranium detection levels for different analytical methods .........................................4
Table A.2 Instrument analysis techniques used for uranium in biological samples ................... 5
Table A.3 Limits of detection of variations of the ICP-MS method of measuring
uranium in urine ......................................................................................................... 6
Table A.4 ORNL administrative control action levels for an accidental exposure .................... 8
Table C.1 The 238
U chain and decay data ................................................................................... 2
Table C.2 The 235
U chain and decay data ................................................................................... 2

xiii
LIST OF TABLES (continued)
Page
Table C.3 Transfer coefficients in the biokinetic model for systemic radium ........................... 4
Table C.4 Model predictions of retention and excretion of 226
Ra (fraction of intake)
following acute inhalation of a relatively soluble form (Type F, 5 μm AMAD) ...... 5
Table C.5 Model predictions of retention and excretion of 226
Ra (fraction of intake)
following acute inhalation of a moderately soluble form (Type M, 5 μm
AMAD) ...................................................................................................................... 6
Table C.6 Effective dose coefficients for inhaled 226
Ra (5 μm AMAD) .................................... 6
Table C.7 Transfer coefficients in the biokinetic model for systemic thorium .......................... 8
Table C.8 Model predictions of retention and excretion of 230
Th (fraction of intake)
following acute inhalation of a moderately soluble form (Type M, 5 μm
AMAD) ...................................................................................................................... 9
Table C.9 Model predictions of retention and excretion of 230
Th (fraction of intake)
following acute inhalation of a moderately soluble form (Type S, 5 μm
AMAD) ...................................................................................................................... 9
Table C.10 Effective dose coefficients for inhaled 230
Th (5 μm AMAD) .................................. 10
Table D.1 Comparison of guidance in this report with Regulatory Guide 8.22 ......................... 4
Table D.2 Tissue weighting factors given in ICRP Publications 26 (1977), 60 (1991),
and 103 (2008) ........................................................................................................... 6
Table D.3 Comparison of action levels for 234
U, 235
U, and 238
U in air derived in this
report with DACs from Appendix B of 10CFR20 ..................................................... 8
Table D.4 Comparison of committed effective dose coefficients E26, E60, and E103
for inhaled 234
U, 235
U, or 238
U (5 μm AMAD) based on tissue weighting
factors from ICRP Publications 26, 60, and 103, respectively ................................ 10


xv
ACRONYMS AND ABBREVIATIONS
ACGIH American Conference of Governmental Industrial Hygienists
AI Alveolar interstitium
ALARA As Low as Reasonably Achievable
ALI Annual Limit on Intake
AMAD Activity median aerodynamic diameter
ASTM American Society for Testing and Materials
ATSDR Agency for Toxic Substances and Disease Registry
BB Bronchi
bb Bronchioles
Bq Becquerel
C Centigrade
CDC Centers for Disease Control
CEDE Committed effective dose equivalent
CFR Code of Federal Regulations
Ci Curie
d Day
DAC Derived Air Concentration
DOE or USDOE United States Department of Energy
DU Depleted uranium
E Effective dose
EPA or USEPA United States Environmental Protection Agency
ET Extrathoracic
Exch Exchangeable (with blood plasma)
g Gram
GI Gastrointestinal
GSD Geometric standard deviation
Gy Gray
h Hour
HATM Human Alimentary Tract Model
HP Health physicist
HR-ICP-MS High Resolution Inductively Coupled Plasma Mass Spectrometry
HRTM Human Respiratory Tract Model
ICP-MS Inductively Coupled Plasma Mass Spectrometry
ICRP International Commission on Radiological Protection
ISL In situ leaching
J Joule
keV Thousand electron volts
L Liter
LLI Lower large intestine
LN Lymph nodes
m Meter
MC-ICP-MS Multi-Collector Inductively Coupled Plasma Mass Spectrometry
µCi Microcurie
MDA Minimum detectable activity

xvi
ACRONYMS AND ABBREVIATIONS (continued)
MeV Million electron volts
mg Milligram
µg Microgram
mL Milliliter
µm Micrometer
MMAD Mass median aerodynamic diameter
mo Month
MOX Mixed oxide fuel
MPDc Maximum Permissible Dose Commitment
NCRP National Council on Radiation Protection and Measurements
ng Nanogram
nm Nanometer
Nonexch Nonexchangeable (with blood plasma)
NRC or USNRC United States Nuclear Regulatory Commission
NUREG US Nuclear Regulatory Commission Regulation
ORNL Oak Ridge National Laboratory
OSHA Occupational Safety and Health Administration
Pub30 Publication 30 of the International Commission on Radiological Protection
Q-ICP-MS Quadrupole Inductively Coupled Plasma Mass Spectrometry
RBC Red blood cells
RG Regulatory Guide
SD Standard deviation
SEQ Sequestered (in respiratory tissue)
SF-ICP-MS Sector Field Inductively Coupled Plasma Mass Spectrometry
SI Small intestine
σg Geometric standard deviation
SpA Specific activity
St Stomach
ST0 Soft tissues with rapid turnover rate
ST1 Soft tissues with intermediate turnover rate
ST2 Soft tissues with slow turnover rate
Sv Sievert
TH Thoracic
U Uranium
ULI Upper large intestine
UNSCEAR United Nations Scientific Committee on the Effects of Atomic Radiation
USACHPPM U.S. Army Center for Health Promotion and Preventive Medicine
UV Ultraviolet
WHO World Health Organization
wk Week
WL Working Level
WLM Working Level Month
wT Tissue weighting factor
y Year

1
1 INTRODUCTION
Health risks associated with elevated intake of uranium may be divided into two categories:
chemical toxicity to tissues, primarily the kidneys; and radiogenic injury to lungs, bone, and
other tissues that may result in an increased risk of cancer of these tissues.
The relative significance of the chemical and radiation hazards from intake of the natural
uranium isotopes 234
U, 235
U, and 238
U depends on their isotopic mixture and the chemical and
physical form of uranium taken into the body. Chemical toxicity generally has been considered
the overriding hazard for intake of relatively soluble uranium compounds with naturally
occurring isotopic mixtures, based on studies on laboratory animals (Wrenn, et al. 1985). This
would also apply to intake of relatively soluble forms of depleted uranium, which has an even
lower specific activity (radioactive decays per second per gram of material) than natural
uranium. The radiogenic risk increases with the level of 235
U-enrichment due mainly to an
associated increase in the percentage of 234
U, which has a higher specific activity than 235
U or 238
U. For inhalation of relatively insoluble uranium compounds, the radiation dose to the lungs
could become the prevailing consideration even for natural or depleted uranium due to an
increased residence time in the lungs and low fractional absorption of deposited uranium to
blood.
The purpose of this report is to provide methods for interpreting uranium monitoring data and
limiting exposure to uranium in the workplace. Although various types of monitoring data and
different exposure pathways are considered, emphasis is on interpretation of air monitoring data
and three main types of bioassay data: the concentration of uranium in urine, the concentration of
uranium in feces, and the externally measured content of uranium in the chest.
Recommendations concerning limiting values for these quantities are based on current radiation
protection guidance, current information on chemical toxicity of uranium, and the best available
biokinetic models for uranium. A recommended limiting value is based on the more restrictive
of two derived values, one determined from primary guidance for uranium as a chemical hazard
and the other from primary guidance for uranium as a radiation hazard.
The primary guidance for prevention of chemical toxicity is intended to ensure that the
concentration of uranium in the kidneys in workers remains well below levels projected to result
in nephrotoxicity, as judged from data on human subjects and laboratory animals. The primary
guidance for limitation of radiation effects is consistent with guidance in Publications 60 and 103
of the International Commission on Radiological Protection (ICRP 1991, 2008).
Primary guidance for prevention of chemical toxicity: The concentration of uranium in
the kidneys should not exceed 1.0 μg U/g kidney at any time.
Primary guidance for limitation of radiation effects: The committed effective dose from
intake of uranium during any 1-y period (the “annual effective dose”) should not exceed
0.02 Sv as an average over any 5-y period and should not exceed 0.05 Sv in any single
year. The value 0.02 Sv should be used for planning purposes for any 1-y period.
Background information on these primary guidance levels is given in Section 2.

2
The primary guidance levels given above are not directly measurable quantities but provide a
basis for derivation of secondary guidance levels that are measurable (e.g., the concentration of
uranium in air or urine). Derivation of secondary guidance levels requires the application of
biokinetic and dosimetric models for internally deposited uranium. The dosimetry system
applied in this report is based on ICRP Publication 60 (1991) and Publication 68 (1994b) except
that an updated model of transit of material through the alimentary tract is applied.
The biokinetic models used in this report are summarized in Section 3 and include:
the ICRP’s Human Respiratory Tract Model (HRTM) adopted in ICRP Publication 66
(1994a);
the ICRP’s Human Alimentary Tract Model (HATM) adopted in ICRP Publication 100
(2006), together with gastrointestinal absorption fractions applied in ICRP Publication 68
(1994b) for relatively soluble and relatively insoluble forms of uranium;
the biokinetic model for systemic uranium in adults, adopted in ICRP Publication 69
(1995a).
Derivations of secondary guidance levels for exposure to uranium are based on characteristics of
a reference adult male as defined in ICRP Publication 89 (2002). Analyses done for this report
indicate that derived guidance values would differ little if characteristics of a reference adult
female were applied instead (Section 5).
Three default levels of solubility or “absorption types” of inhaled uranium are considered:
Relatively soluble aerosols. These are represented by Type F material as defined in ICRP
Publication 66 (1994a). The assumed particle size is 5 μm AMAD (activity median
aerodynamic diameter), which is the ICRP’s default particle size for consideration of
occupational intakes. Parameter values for Type F depict fast dissolution in the
respiratory tract and a high level of absorption from the respiratory tract to blood. For
uranium of Type F, a gastrointestinal absorption fraction of 0.02 is applied to activity that
is swallowed after escalation from the respiratory tract.
Moderately soluble aerosols. These are represented by Type M material (5 μm AMAD)
as defined in ICRP Publication 66 (1994a). Parameter values for Type M depict a
moderate rate of dissolution and an intermediate level of absorption to blood. For
uranium of Type M, a gastrointestinal absorption fraction of 0.02 is applied as a
cautiously high value to activity that is swallowed after escalation from the respiratory
tract.
Relatively insoluble aerosols. These are represented by Type S (5 μm AMAD) material
as defined in ICRP Publication 66 (1994a). Respiratory parameter values for Type S
depict a low rate of dissolution and a low level of absorption to blood. For uranium of
Type S, a gastrointestinal absorption fraction of 0.002 is applied to activity that is
swallowed after escalation from the respiratory tract.
Guidance is given in Section 3 regarding association of specific chemical forms of uranium with
specific default absorption types (Type F, Type M, or Type S), or assignment of material-
specific parameter values.
Because the frequency and duration of exposure to uranium vary from one facility to another and
from one worker to another in the same facility, it is not feasible to derive secondary guidance

3
values for a comprehensive set of potential exposure patterns. The secondary guidance values
given in this report are based on consideration of two idealized patterns of exposure: acute
exposure, or continuous exposure at a constant rate. The case of continuous exposure is used as
a surrogate for chronic occupational exposure. Section 3 provides tables and figures of ICRP
model predictions of retention and excretion of uranium based on these two idealized exposure
patterns, various forms of uranium taken into the body, and different pathways of entry into the
body. Section 3 also includes an analysis of the sensitivity of derived secondary guidance to the
assumed particle size.
Section 4 compares model predictions of retention and excretion of uranium based on the
assumption of continuous intake with predictions for intermittent exposure patterns that could
occur in the workplace. Section 4 also discusses the problem of interpreting routine urinary
uranium measurements in view of the rapid fluctuations of urinary uranium that can occur in
uranium workers due to relatively fast urinary clearance of a substantial portion of absorbed
uranium. For example, the concentration of uranium in a urine sample collected during or
shortly after work hours may be dominated by intake occurring earlier in the day and may be a
misleading indicator of total exposure that has occurred since the previous urine measurement.
Sampling schemes are proposed for determining reasonable estimates of the average rate of
urinary excretion of uranium in chronically exposed workers.
The background material provided in Sections 2–4 is applied in Section 5 to derive secondary
guidance levels for exposure to different forms of uranium in the workplace. These secondary
guidance levels are referred to as investigation levels and immediate action levels and are given
in terms of the mass concentration or activity concentration of uranium in air, urine, or feces, or
the total uranium activity in the chest. Essentially, an investigation level indicates the need to
confirm the validity of measurements and adequacy of confinement controls and determine
whether work limitations are appropriate. An immediate action level indicates that a number of
safeguards should be put into place immediately, including removal of workers from further
exposure until exposure conditions are found to be acceptable.
Table 1.1 lists “generic” investigation and immediate action levels and the actions that should be
taken at each level. These levels are generic in the sense that they are defined in terms of the
primary guidance levels given earlier rather than in terms of specific measurable quantities.

4
Table 1.1 Generic criteria for investigation levels and immediate action levels
Type of information Interpretation Actions
Monitoring data indicate both of the
following:
(a) The kidney concentration does not
exceed 0.3 μg U/g kidney and is not
projected on the basis of models to
exceed this value at current levels of
exposure.
(b) The annual effective dose has not
exceeded 0.02 Sv over the past year
and is not projected to exceed this
value at current levels of exposure.
U confinement
indicated to be
adequate.
No corrective actions needed.
Monitoring data indicate one or both of the
following:
(a) The kidney concentration has exceeded
or will eventually exceed 0.3 μg U/g
kidney at current levels of exposure.
(b) The annual effective dose has exceeded
or will eventually exceed 0.02 Sv at
current levels of exposure.
Investigation
level. Uranium
confinement or
respiratory
controls may not
provide
adequate margin
of safety.
1. Confirm results underlying the model
prediction (e.g., repeat latest urinalysis
and increase frequency of urine
sampling).
2. Reassess model predictions. Where
feasible, apply worker-specific exposure
scenarios in place of the idealized
scenarios underlying the derived
investigation levels.
3. Identify cause of elevated monitoring
data and initiate additional control
measures if initial results are confirmed.
4. If monitoring data are found to be
anomalous, investigate sampling and
measurement procedures and correct if
necessary.
5. If elevated exposure to a worker is
confirmed, determine whether other
workers may have been exposed and
make bioassay measurements for those
workers.
6. Consider work assignment limitations for
workers with elevated intakes of
uranium.
Monitoring data indicate one or more of
the following:
(a) The kidney concentration has exceeded
or will eventually exceed 1.0 μg U/g
kidney at current levels of exposure.
(b) The annual effective dose has exceeded
or will eventually exceed 0.05 Sv at
current levels of exposure.
Immediate
action level.
Uranium
confinement,
respiratory
protection, or
monitoring
program not
acceptable.
1. Take the actions indicated above.
2. Immediately remove from further
exposure any workers estimated to have
a kidney uranium concentration
approaching or exceeding 1.0 μg U/g
kidney.
3. Continue operations only if source of
elevated uranium is clearly identified and
corrected, or if it is clearly established
that the monitoring data leading to the
model predictions are incorrect.
4. Analyze bioassay samples weekly or
more frequently for workers in affected
area.

5
Table 1.1 provides the basis for derivation of numerical investigation and immediate action
levels based on the following types of measurements:
The concentration of uranium in air: Continuous air monitoring during work hours typically
is the primary method for monitoring and control of airborne uranium. An air monitoring
program should include not only measurement of the mass concentration and activity
concentration of airborne uranium but also measurement of the solubility of aerosols in
which uranium is carried. The main purpose of such measurements is to determine whether a
significant portion of the airborne material is highly insoluble. This is important because
inhalation of highly insoluble material may result in accumulation of uranium in the lungs
and elevated radiation dose to lung tissue. Special determinations of the solubility of
uranium aerosols are needed when changes in operations may affect the solubility of the
material to which workers are exposed.
Urine measurements: Measurement of the rate of excretion of uranium in urine is another
important component of a uranium monitoring program. Urinary excretion measurements
may detect significantly high acute exposures or gradual unfavorable trends in exposure not
evident from air monitoring data alone. Urine sampling generally is performed at regular
intervals, with the frequency of sampling depending on the exposure potential of the
individual.
In vivo thorax (chest) measurements: Periodic in vivo thorax measurements are needed in
cases where there is a potential for inhalation of elevated quantities of relatively insoluble
forms of uranium. Special in vivo thorax measurements are used to estimate the level of
intake in the event of known or suspected short-term exposure to relatively insoluble
uranium. Exposure to relatively insoluble forms of uranium may not be revealed by
urinalysis due to a low rate of dissolution of the inhaled material in the lungs and absorption
of uranium to blood. In vivo thorax measurements typically are performed at wider time
intervals than routine urinalysis.
Fecal measurements: Fecal analysis generally is not performed routinely but can be a useful
assessment tool if it is suspected that workers have been exposed to relatively insoluble
uranium aerosols. Inhalation of a relatively insoluble uranium aerosol cannot be determined
by urinary excretion measurements alone. A low urinary to fecal excretion ratio for uranium
in a worker provides suggestive evidence that most or all of the inhaled uranium is in
relatively insoluble form, although the possibility usually cannot be ruled out that fecal
uranium represents largely ingested activity.
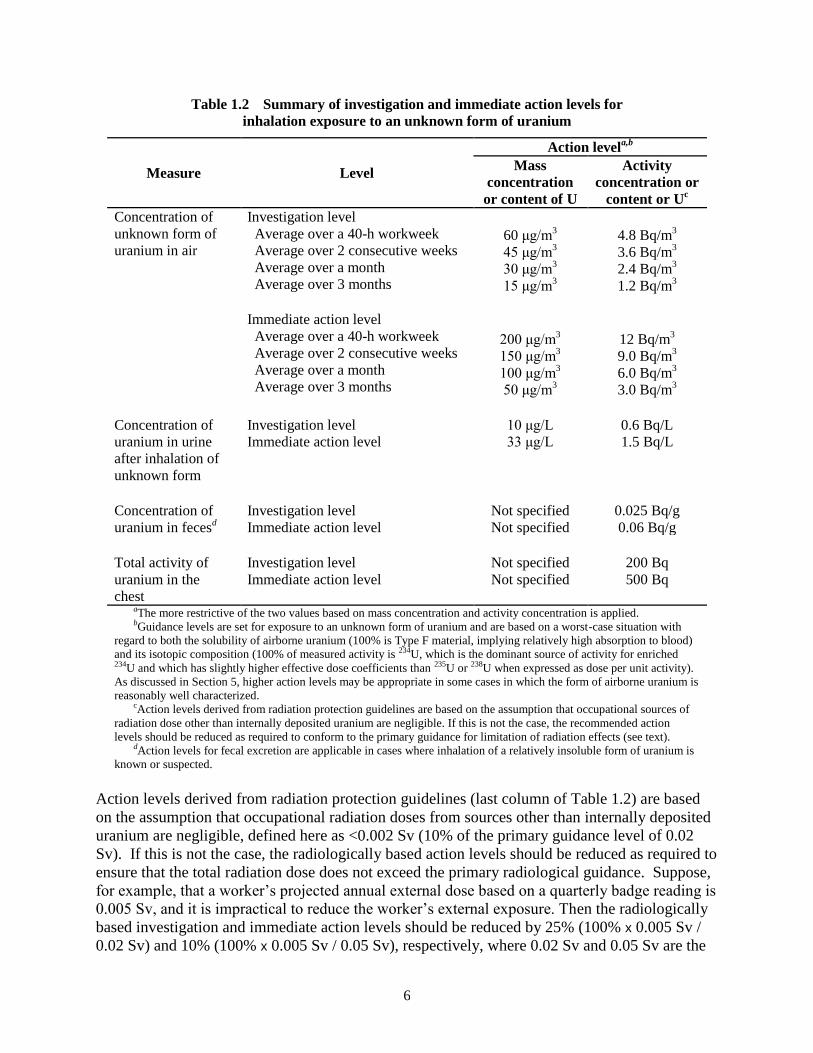
Table 1.2 summarizes investigation levels and immediate action levels derived in Section 5 for
uranium in air, urine, feces, and chest. The values in Table 1.2 apply to inhalation of an
unknown form of uranium. In the case of fecal or chest measurements the values apply either to
an unknown form of inhaled uranium or a form known to have a relatively insoluble component.
6
Table 1.2 Summary of investigation and immediate action levels for
inhalation exposure to an unknown form of uranium
Measure Level
Action levela,b
Mass
concentration
or content of U
Activity
concentration or
content or Uc
Concentration of
unknown form of
uranium in air
Investigation level Average over a 40-h workweek Average over 2 consecutive weeks Average over a month Average over 3 months Immediate action level
Average over a 40-h workweek Average over 2 consecutive weeks Average over a month Average over 3 months
60 μg/m
3 45 μg/m
3 30 μg/m
3 15 μg/m
3
200 μg/m
3 150 μg/m
3 100 μg/m
3 50 μg/m
3
4.8 Bq/m
3 3.6 Bq/m
3 2.4 Bq/m
3 1.2 Bq/m
3
12 Bq/m
3 9.0 Bq/m
3 6.0 Bq/m
3 3.0 Bq/m
3 Concentration of
uranium in urine
after inhalation of
unknown form
Investigation level Immediate action level
10 μg/L 33 μg/L
0.6 Bq/L 1.5 Bq/L
Concentration of
uranium in fecesd
Investigation level Immediate action level
Not specified Not specified
0.025 Bq/g 0.06 Bq/g
Total activity of
uranium in the
chest
Investigation level Immediate action level
Not specified Not specified
200 Bq 500 Bq
aThe more restrictive of the two values based on mass concentration and activity concentration is applied. bGuidance levels are set for exposure to an unknown form of uranium and are based on a worst-case situation with
regard to both the solubility of airborne uranium (100% is Type F material, implying relatively high absorption to blood)
and its isotopic composition (100% of measured activity is 234U, which is the dominant source of activity for enriched 234U and which has slightly higher effective dose coefficients than 235U or 238U when expressed as dose per unit activity).
As discussed in Section 5, higher action levels may be appropriate in some cases in which the form of airborne uranium is
reasonably well characterized. cAction levels derived from radiation protection guidelines are based on the assumption that occupational sources of
radiation dose other than internally deposited uranium are negligible. If this is not the case, the recommended action
levels should be reduced as required to conform to the primary guidance for limitation of radiation effects (see text). dAction levels for fecal excretion are applicable in cases where inhalation of a relatively insoluble form of uranium is
known or suspected.
Action levels derived from radiation protection guidelines (last column of Table 1.2) are based
on the assumption that occupational radiation doses from sources other than internally deposited
uranium are negligible, defined here as <0.002 Sv (10% of the primary guidance level of 0.02
Sv). If this is not the case, the radiologically based action levels should be reduced as required to
ensure that the total radiation dose does not exceed the primary radiological guidance. Suppose,
for example, that a worker’s projected annual external dose based on a quarterly badge reading is
0.005 Sv, and it is impractical to reduce the worker’s external exposure. Then the radiologically
based investigation and immediate action levels should be reduced by 25% (100% x 0.005 Sv /
0.02 Sv) and 10% (100% x 0.005 Sv / 0.05 Sv), respectively, where 0.02 Sv and 0.05 Sv are the
7
primary guidance values underlying radiologically based investigation and immediate action
levels, respectively. An action level would then be the more restrictive of the unchanged value
derived from chemical guidance and the re-derived value based on radiological guidance.
Derivations of the investigation and immediate action levels given in Table 1.2 are based on
worst-case assumptions regarding the form of uranium entering the body by the inhalation
pathway. Since this report addresses intakes in the occupational environment, inhalation and
wounds are the only intake pathways considered in the derivations. Swallowed uranium is taken
into account as a secondary pathway associated with transfer of inhaled uranium from the
respiratory tract to the alimentary tract. However, oral ingestion of uranium is considered to be a
relatively unimportant pathway for intake of uranium in the workplace and is not addressed in
this report. If there is reasonably good information on the form of inhaled uranium, higher action
levels may be implied by the generic criteria in Table 1.1. Section 5 provides methods for
deriving case-specific action levels for the following situations:
Concentration of a known form of uranium in air. If the airborne uranium is reasonably well
characterized with regard both to solubility (as defined by any of the ICRP’s default
absorption types) and isotopic mixture (representing natural, 235
U-enriched, or 235
U-depleted
uranium), the investigation and immediate action levels may be determined from graphs
given in Section 5.
Concentration of uranium in urine following inhalation of a known form. When the form of
inhaled uranium is reasonably well characterized, investigation and immediate action levels
based on urinary uranium may be calculated from tables given in Section 3, as illustrated in
Section 5.
Action levels for urinary uranium in the case of intake of uranium through a wound. It is
important to monitor a worker who has been exposed to uranium through a wound to
determine whether removal from further exposure or medical intervention is indicated.
Section 5 illustrates how urinary excretion measurements may be used, together with tables
in Section 3 (or predictions of a wound model plus systemic model) to estimate the rate of
transfer of uranium from a wound to blood.
All investigation and immediate actions levels derived in Section 5 and all illustrative examples
given in that section are based on application of default model parameter values recommended
by the ICRP. Action levels may be derived from material-specific parameter values describing
dissolution and absorption in the lungs or fractional absorption from the gastrointestinal tract,
whenever there is reasonably strong information in support of such parameter values.
Information that might be used to develop material-specific dissolution rates include site-specific
data from in vitro dissolution studies of the material in simulated lung fluid and reported
measurements on workers exposed to the same material. With regard to application of published
material-specific parameter values, it should be kept in mind that the dissolution rate of some
materials depends on factors that may differ from site to site such as the process of formation of
the material.

8
Appendix A of this report discusses basic components of a uranium bioassay program, including
analytical methods commonly employed as part of in vitro and in vivo monitoring activities. The
basic components of a uranium bioassay program are illustrated in the context of the bioassay
program for uranium and other radionuclides at Oak Ridge National Laboratory. A brief
discussion is given of a more narrowly focused bioassay program developed by the U.S. Army
Center for Health Promotion and Preventive Medicine (USACHPPM) for U.S. soldiers
potentially exposed in battle to depleted uranium.
Appendix B examines the practicality of using hair and nails as biomarkers in a uranium
bioassay program. The main conclusion is that uranium measured in hair and nails cannot be
assumed to arise wholly, or even mainly, from internally deposited uranium.
Appendix C addresses radionuclides other than the natural uranium isotopes 234
U, 235
U, and 238
U
that may be found in relatively high quantities at a uranium facility. Decay data are provided for
members of the 238
U and 235
U chains, which are commonly encountered at uranium facilities.
Effective dose coefficients and biokinetic model predictions needed for interpretation of bioassay
are tabulated for the following potentially significant types of internal exposure at uranium
facilities: acute inhalation of soluble or moderately soluble forms of 226
Ra; acute inhalation of
moderately soluble or relatively insoluble forms of 230
Th; and chronic inhalation of short-lived 222
Rn progeny.
Appendix D summarizes the guidance provided in Regulatory Guide 8.11, “Applications of
Bioassay for Uranium”; Regulatory Guide 8.22, “Bioassay at Uranium Mills”; and Appendix B
of 10CFR20 and makes comparisons with guidance proposed in the present report. Appendix D
also examines the sensitivity of committed effective dose coefficients, and hence the
radiologically based action levels given in this report, to the choice among tissue weighting
factors recommended in ICRP Publication 26 (1977), Publication 60 (1991), and Publication 103
(2008). In addition, Appendix D compares guidance levels in this report to DOE and OSHA
regulations and to ACGIH guidance.

9
2 REFERENCE PRIMARY GUIDANCE LEVELS
2.1 Reference Primary Guidance for Uranium as a Chemical Hazard
Primary guidance levels provide the basis for interpretation of monitoring data for uranium and
limitation of uranium in the monitored media. The authors have selected reference primary
guidance levels on the basis of a review of the scientific literature related to potential
radiological and chemical effects of uranium and consideration of the role of health effects
classification in setting standards by U.S. Federal agencies. A summary of the literature review
and criteria for standards follows.
Toxic effects of uranium on the kidneys are assumed to occur only when the renal uranium
concentration exceeds some threshold level. Since the early 1950s a concentration of 3 μg U/g
kidney has served as a primary guidance level for avoidance of chemical toxicity in workers
exposed to uranium (Voegtlin and Hodge 1953, Spoor and Hursh 1973, Stopps and Todd 1982).
This level represents a committee's judgment based primarily on results of animal experiments
conducted in the 1940s.
Information collected since the 1940s indicates that the traditional guidance level of 3 μg U/g
kidney is above the no-effects level but probably below a serious-effects level with regard to
renal dysfunction. Subjects with intakes resulting in estimated peak concentrations near
3 μg U/g kidney have shown transient biochemical indicators of renal dysfunction but no acute
illnesses or indications of long-term adverse health effects (U.S. National Research Council
2008). On the other hand, acutely exposed persons with estimated peak concentrations
substantially exceeding 6 μg U/g kidney have shown protracted biochemical indicators of renal
dysfunction and sometimes severe illness (U.S. National Research Council 2008). Kathren and
Burklin (2008) concluded from a review of the literature that there have been no reported human
deaths attributable to chemical toxicity of uranium.
Guilmette and coworkers (2004) reviewed information on renal toxicity of uranium as part of the
Capstone health risk assessment study of military uses of depleted uranium. They concluded
that:
uranium concentrations ≤ 2.2 μg U/g kidney will not result in detectable effects;
concentrations > 2.2 μg U/g kidney but ≤ 6.4 μg U/g kidney may result in transient
indicators of renal dysfunction without overt symptoms of illness;
concentrations > 6.4 μg U/g kidney but ≤ 18 μg U/g kidney may result in protracted
symptoms of renal dysfunction and possibly illness;
concentrations >18 μg U/g kidney are likely to result in severe clinical symptoms of renal
dysfunction.
These conclusions refer to peak concentrations following brief exposure to uranium. These
authors also reviewed twenty-seven cases of human U exposures reported in the scientific
literature and listed transient effects in the kidney in eight cases. The peak kidney concentration
for those eight cases, apparently calculated by these authors or the original investigators using
selected biokinetic models, ranged from 1 to 6 μg U/g kidney. In a ninth case, a biochemical

10
indicator of renal dysfunction persisted for three weeks, and the estimated peak kidney
concentration was 3 μg U/g kidney.
By contrast to the no-effects level of 2.2 μg U/g kidney proposed by those authors, a U.S.
National Research Council committee recently concluded that transient adverse renal effects of
uranium including proteinuria and glucosuria may occur at peak kidney concentrations as low as
1.0 μg U/g kidney (U.S. National Research Council 2008).
In a cohort of Gulf War veterans with embedded fragments of depleted uranium (DU) metal
resulting from “friendly fire” incidents, uranium concentrations in urine measured every two
years since 1993 persistently range from 10 to over 500 times normal levels (Squibb et al. 2005).
This indicates that the embedded DU fragments are gradually releasing uranium to blood in these
subjects. The biokinetic models applied in the present report were used to estimate kidney
uranium concentrations in these veterans based on their urinary uranium excretion through about
2001 (Squibb et al. 2005). Estimated kidney concentrations exceeded 0.1 μg U/g kidney in
several veterans and ≥ 0.6 μg U/g kidney in two cases. Subtle changes in measures of renal
proximal tubule function have been evident in some of the veterans, but no clinical evidence of
decreased renal function has been observed in this cohort (Squibb et al. 2005).
A 16-year follow-up study of 35 members of a larger cohort of 77 of these Gulf I veterans, 11 of
whom are bearing DU embedded fragments, were examined in a broad spectrum of medical and
laboratory tests. The subjects with embedded fragments continue to excrete elevated
concentrations of urine U as a function of the DU fragment burden. A high exposure group was
defined as having current urine U concentrations ≥ 0.1 µg U/g creatinine. The maximum
measured concentration of urinary U was 60 µg U/g creatinine. Differences between the high
and low exposure groups were compared. Although subtle trends are suggested with regard to
renal proximal tubular function and bone formation, the high exposure cohort exhibits few
clinically significant U-related health effects. Of 17 laboratory biomarker parameters for renal
effects, only five approached statistical significance, with p ≤ 0.11. Differences between the
high and low exposure groups for two of these five parameters were in the expected direction,
and three were in the opposite direction expected. The report did not address the presence or
absence of casts in the urine (McDiarmid, et al. 2009).
Results of animal studies suggest that mild renal injury with transient elevation in urinary
biochemical indices may occur in chronically exposed animals at renal uranium concentrations
of a few tenths of a microgram U per gram kidney (Leggett 1989, Foulkes 1990). The return of
the biochemical indices to normal during chronic exposure may reflect a kind of acquired
tolerance to uranium associated with structural changes in the luminal surfaces of regenerated
kidney tubule cells (Leggett 1989). Several reviewers have suggested that the traditional
chemical guidance level for uranium of 3 μg U/g kidney should be reduced, particularly for
consideration of chronic exposures (Morrow et al. 1982, Wrenn et al. 1985, Morrow 1984,
Sula et al. 1989, Leggett 1989, SuLu and Zhao 1990, Foulkes 1990). Guidance values in the
range 0.3–1 μg U/g kidney have been proposed.
Established methods for assigning limits for exposure to hazardous chemicals were taken into
account in the selection of the reference primary guidance levels for the chemical toxicity of

11
uranium. Chou and Pohl (2005) have explained the derivation of standards based on renal injury
used by two Federal agencies. They write:
…the U.S. Health and Human Services’ Agency for Toxic Substances and Disease
Registry (ATSDR) derives minimal risk levels (MRLs)…an MRLs is an estimate of the
daily human exposure to a hazardous substance that is likely to be without appreciable risk
of adverse non-cancer health effects over a specified duration of exposure…MRLs are
derived using the no-observed-adverse-effect level/uncertainty factor (NOAEL/UF)
approach. They are used for acute (1-14 days), intermediate (15-364 days), and chronic
(365 days and longer) exposure durations, and for the oral and inhalation routes of
exposure. MRLs are based on non-cancer health end points…and are derived based on the
highest NOAEL, or in the absence of a NOAEL, the lowest less-serious lowest-observed-
adverse-effect level (LOAEL) for the most sensitive health effect end point for a given
route and exposure duration in the database. Uncertainty factors (UFs) are applied to
account for human variability, for use of a LOAEL, for interspecies extrapolation when
animal studies are used in the absence of adequate human data, and for extrapolation
across exposure duration.
The U.S. Environmental Protection Agency (EPA) also derives health-based guidance
values for hazardous chemicals; EPA’s values are called reference concentrations (RfCs)
and reference doses (RfDs) for inhalation and oral exposures, respectively…ATSDR
derived an intermediate-duration oral MRL of 0.002 mg/kg/day for highly soluble uranium
salts. If extrapolated to chronic exposure, this MRL would be one order of magnitude
lower than the RfD. …ATSDR used a LOAEL of 0.05 mg/kg/day in rabbits from the
[Gilman et al. 1998] study and a UF [uncertainty factor] of 30, whereas EPA derived the
RfD for soluble uranium salts of 0.003 mg/kg/day using a LOAEL of 2.8 mg/kg/day and a
UF of 1000 on the basis of a 30-day oral bioassay in rabbits by [Maynard and Hodge
1949].
The U.S. Nuclear Regulatory Commission likely based its occupational limit for U in 10 CFR
20.1201 (e) and10 CFR 20 Appendix B, Footnote 3 on recommendations in ICRP Publication 2
(ICRP 1959).
The availability of human data from the literature review, especially data from the Gulf War I
veterans, provide for the establishment of a reference guidance level on the LOAEL basis. We
take subtle changes in the renal proximal tubular function, including the presence of urinary casts
(Luessenhop, et al. 1958, Kathern and Moore, 1986), as the LOAEL indicators. We calculate
from reference man data (ICRP 2002) and the method illustrated in Example 5.5 of this report
that the high exposure group of the Gulf War I veterans (McDiarmid, et al. 2009) have a
concentration of U ranging from 0.001 to 0.7 μg U/g kidney. Given that there were transient
effects at the upper end of these levels and the data are subject to interpretation, it appears that
the upper end of this range is on the cusp between a NOAEL and a LOAEL. These data are
consistent with the conclusion of the U.S. National Research Council that transient adverse renal
effects of uranium including proteinuria and glucosuria may occur at peak kidney concentrations
as low as 1.0 μg U/g kidney, as noted above.

12
In this report, the concentration 1.0 μg U/g kidney is adopted as the reference primary guidance
level for prevention of chemical toxicity. This value is used to derive immediate action levels in
terms of measurable quantities such as the concentration of uranium in air or the concentration of
uranium in urine. The equilibrium value 0.3 μg U/g kidney is used to derive investigation levels
in terms of measurable quantities.
Reference primary guidance for prevention of chemical toxicity from intake of uranium:
The concentration of uranium in the kidneys should not exceed 1.0 μg U/g kidney at any
time.
2.2 Reference Primary Guidance for Uranium as a Radiation Hazard
To place all ionizing radiations on a common scale with regard to their potential health
detriment, the ICRP uses quantities called the equivalent dose and the effective dose. The
equivalent dose is the absorbed dose averaged over an organ or tissue and multiplied by a
radiation weighting factor that reflects the relative biological effectiveness of the type (and
energy in the case of neutrons) of radiation causing the dose. The effective dose takes into
account that the relationship between equivalent dose and the probability of radiogenic effects
depends on the organ or tissue irradiated. The effective dose is a weighted sum of equivalent
doses to radiosensitive tissues, with the tissue weighting factor representing the relative
contribution of that tissue to the total detriment for the case of uniform irradiation of the whole
body.
The concept of effective dose (equivalent) was introduced in ICRP Publication 26 (1977), along
with weighting factors for radiosensitive tissues and primary guidance levels concerning
acceptable doses from occupational intakes. Radiogenic health effects were categorized as
stochastic, meaning that the probability of occurrence is a function of dose (e.g., cancer or
genetic disorders), or nonstochastic, meaning that the effect is expected to occur when the dose
reaches or exceeds a threshold value (e.g., acute radiation syndrome or the formation of
cataracts). To prevent nonstochastic effects, the dose equivalent (referred to as the equivalent
dose in later ICRP documents) to body organs from intakes in a year was limited to 0.5 Sv,
except that the lens of the eye was limited to 0.15 Sv. To constrain the occurrence of stochastic
effects, the effective dose to the body from exposures or intakes in a year was limited to 0.05 Sv,
although averaging over periods considerably longer than a year was acceptable.
ICRP Publication 26 was superseded by ICRP Publication 60 (ICRP 1991). The guidance in
Publication 60 is also based on the concept of effective dose, but revised weighting factors and a
revised limit on the effective dose are provided to reflect later information on the effects of
radiation exposures. Guidance is provided in ICRP Publication 60 for prevention of non-
stochastic effects, but that guidance is usually less restrictive than the guidance for stochastic
effects. ICRP Publication 60 limits the effective dose (50-y integral) to 0.02 Sv per year (i.e.,
from intake during a 1-y period) averaged over defined periods of five years and 0.05 Sv in any
single year. The value 0.02 Sv rather than 0.05 Sv is intended for planning purposes, even for 1-
y periods.

13
ICRP Publication 60 was recently superseded by ICRP Publication 103 (2008). The primary
guidance in ICRP Publication 60 summarized in the preceding paragraph was retained in ICRP
Publication 103.
In this report, an annual effective dose of 0.02 Sv is adopted as the reference primary guidance
level for control of radiation effects from intake of uranium. The same value is used to derive
investigation levels in terms of measurable quantities such as the concentration of uranium in air
or the concentration of uranium in urine. An annual effective dose of 0.05 Sv is used to derive
immediate action levels in terms of measurable quantities.
Reference primary guidance for limitation of radiation effects from intake of uranium:
The annual effective dose from intake of uranium should not exceed 0.02 Sv as an
average over any 5-y period and should not exceed 0.05 Sv in any single year. The
value 0.02 Sv for intake during any 1-y period should be used for planning purposes.


15
3 BIOKINETIC MODELS USED TO DERIVE SECONDARY
REFERENCE GUIDANCE LEVELS FOR EXPOSURE TO
URANIUM
3.1 Respiratory Kinetics
3.1.1 General Features of the ICRP’s Human Respiratory Tract Model
The ICRP’s Human Respiratory Tract Model (HRTM) was introduced in ICRP Publication 66
(1994a). Default parameter values describing deposition, retention, translocation, and absorption
of inhaled particles or gases are provided in Publication 66, but material-specific parameter
values may be substituted when information allows.
The compartments of the HRTM and the paths of mechanical clearance of deposited particles are
shown in Figure 3.1. Reference values for particle transport rate constants are shown beside the
arrows and are in units of d-1
. The rates of particle transport are assumed to be independent of
particle size.
Particle transport is in competition with the dissolution of particles, which determines the rate of
absorption of the contained radionuclide to blood. Dissolution models used in conjunction with
the particle transport model shown in Figure 3.1 are described below. Absorption to blood is
assumed to occur from all respiratory compartments except ET1. This is in addition to activity
that is absorbed to some extent from the alimentary tract after it is escalated from the lungs and
swallowed. The total absorption of activity to blood from the respiratory and alimentary tracts
determines the level of urinary excretion of activity.
Figure 3.1 Structure of the ICRP’s respiratory tract model (ICRP 1994a). The numbers
adjacent to the arrows indicate particle transport rates (d-1
). Absorption to blood is assumed to
occur from all respiratory compartments except ET1. Abbreviations: AI = alveolar interstitium,

16
BB = bronchi, bb = bronchioles, ET = extrathoracic, LN = lymph nodes, SEQ = sequestered, and
TH = thoracic.
The HRTM divides the respiratory system into extrathoracic (ET) and thoracic tissues. The
airways of the ET region are further divided into the anterior nasal passages in which deposits
are removed by extrinsic means such as nose blowing and the posterior nasal passages
(nasopharynx, oropharynx, and the larynx) from which deposits are swallowed or absorbed to
blood. The airways of the thorax include the bronchi (BB), bronchioles (bb), and alveolar
interstitium (AI). Uranium or other material deposited in the thoracic airways is cleared into
blood by absorption, to the gastrointestinal tract by mechanical processes (i.e., transported
upward and swallowed), and to the regional lymph nodes via lymphatic channels.
The dissolution rate depends on the chemical and physical form of the inhaled element.
Dissolved activity generally is assumed to be immediately absorbed to blood, although the
HRTM allows for binding of dissolved activity to tissues of the respiratory tract and gradual
absorption of bound activity to blood when indicated by specific information. Absorption is
assumed to occur at the same rate in all regions of the respiratory tract except ET1, where it is
assumed that no absorption takes place. The ICRP’s default parameter values for relatively
soluble, moderately soluble, and relatively insoluble aerosols imply that the absorption rate
decreases with time. A level absorption rate or an increasing absorption rate may be assigned.
The dissolution-absorption model within the HRTM is shown in Figure 3.2. This is a first-order
model that is designed to depict a time-dependent rate of absorption to blood. This model
applies to each compartment of the respiratory tract other than ET1, from which there is assumed
to be no absorption. All of the deposit in the respiratory tract is initially assigned to a
compartment representing an initial state, i.e., an initial rate of dissolution of inhaled particles in
the respiratory tract. Material in the initial state dissolves at the rate sp but is simultaneously
transformed in undissolved form at the rate spt to a material with a different dissolution rate st. A
fraction fb of activity dissolved from particles either in the initial state or the transformed state
enters a respiratory tissue compartment called “Bound material” and a fraction 1-fb goes directly
to blood. Activity transfers from the bound state to blood at the rate sb.
The implementation of the dissolution-absorption model shown in Figure 3.2 is illustrated using
the bronchiolar compartment identified in Figure 3.1 as bb2. A compartment with the same name
(bb2) is used to represent the initial state of material in bb2, and a compartment named bb2-T (not
shown in Figure 3.1) is used to represent the transformed state of that material at the same
location in the respiratory tract. The change of material at this location from the initial state to
the transformed state is represented by a transfer coefficient from bb2 to bb2-T. The transfer
coefficient from bb2 to bb2-T is the value spt indicated in Figure 3.2. The transfer coefficient
describing absorption from the initial state compartment bb2 to blood is (1-fb)sp, and the transfer
coefficient describing absorption from the transformed state compartment bb2-T to blood is
(1-fb)st. The transfer coefficients from bb2 and bb2-T to the “bound” compartment within the
bronchiolar region are fbsp and fbst, respectively. The particle transport rate 0.03 d-1
from bb2 to
BB1 shown in Figure 3.1 is used as both the transfer coefficient from the transformed state
compartment bb2-T to the transformed state compartment BB1-T and the transfer coefficient
from the initial state compartment bb2 to the initial state compartment BB1.

17
Figure 3.2 Model within the HRTM describing time-dependent absorption to blood. Inhaled
material deposited in the respiratory tract initially dissolves at rate sp. Dissolution is in competition
with transformation at rate spt to a material with dissolution rate st. Fractions 1-fb and fb of
dissolved activity enter blood and bind to respiratory tissues, respectively. Activity transfers from
the bound state to blood at the rate sb.
The compartment in Figure 3.2 labeled “Bound material” is rarely used due to lack of
information on binding of dissolved activity to respiratory tissues. For most practical purposes
the dissolution-absorption model shown in Figure 3.2 can be reduced to the simpler model
shown in Figure 3.3.
Figure 3.3 Simplification of the model of time-dependent absorption to blood by removal of
the compartment “Bound material”. All of the deposit is assigned to a compartment labeled
“Particles in initial state”. Material is transferred from this compartment to body fluids at rate sp
(absorption) and to a compartment called “Particles in transformed state” at rate spt. Particles in
the transformed state have a different absorption rate st.

18
If the dissolution rate decreases with time as is often the case, the model shown in Figure 3.3
may be replaced by the even simpler model shown in Figure 3.4. In the latter model, which is
the most commonly used version, it is assumed that a fraction fr of deposited material dissolves
at the relatively fast rate sr and the remaining fraction 1-fr dissolves more slowly at the rate ss.
The relatively soluble and less soluble fractions are assigned to separate compartments upon
deposition. The models shown in Figures 3.3 and 3.4 give the same results when the two sets of
parameter values are related as follows:
sp = ss + fr(sr – ss)
spt = (1-fr)(sr – ss)
st = ss
These relations are useful because material-specific dissolution rates usually are reported in
terms of the model shown in Figure 3.4, and some computer applications of the HRTM are based
on the more general model shown in Figure 3.3.
Figure 3.4 Model of time-dependent absorption within the HRTM generally applied when the
dissolution rate of the material decreases with time. Fractions fr and 1-fr of deposited material have
different dissolution rates (sr and ss, respectively).
In most applications of the HRTM, inhaled particulate material is assigned to one of three
generic absorption types: Type F, representing fast dissolution and a high level of absorption to
blood; Type M, representing a moderate rate of dissolution and an intermediate level of
absorption to blood; and Type S, representing slow dissolution and a low level of absorption to
blood. In terms of the ICRP’s dissolution model as depicted in Figure 3.4, Type F has
dissolution parameters fr = 1 (i.e., there is no slow dissolution fraction) and sr = 100 d-1
; Type M
has dissolution parameters fr = 0.1, sr = 100 d-1
, and ss = 0.005 d-1
; and Type S has dissolution
parameters fr = 0.001, sr = 100 d-1
, and ss = 0.0001 d-1
. Each of these parameter values is applied
to each respiratory compartment shown in Figure 3.1, except ET1, to define the absorption rate to
blood from that compartment. The user selects Type F, M, or S based either on ICRP
recommendations or independent interpretation of site-specific data and information from the
literature.

19
3.1.2 Application of the HRTM to Various Forms of Uranium
The pattern of clearance of uranium from the respiratory tract has been studied frequently in
laboratory animals and uranium workers following inhalation of various forms of uranium.
Also, the rate of dissolution in simulated lung fluid has been determined for different forms of
uranium. The collective data provide a basis for assigning default absorption types (Type F,
Type M, or Type S) to commonly encountered uranium compounds.
The default absorption types given in Table 3.1 may be applied to the indicated forms of uranium
in the absence of specific information. In cases where data from different studies are
inconsistent, the assigned absorption type represents the most frequently observed pattern if
evident. Where data are too limited to assign a most frequently observed pattern, the
intermediate absorption type, Type M, is assigned as a method of avoiding large under- or
overestimates of residence time in the lungs and absorption to blood.

20
Table 3.1 Default absorption types for different forms of airborne uraniuma
Inhaled form Default type Comments References
Uranyl nitrate
(UO2(NO3)2)
F Widely encountered in aqueous solution
in nuclear fuel fabrication and
reprocessing. Type F behavior is most
frequently observed for uranyl nitrate
but Type M behavior is suggested by
some data.
Cook and Holt 1974;
Cooper et al. 1982;
Ballou et al. 1986;
Ellender 1987;
Stradling et al. 1991;
Eidson 1994;
Hodgson et al. 2000
Uranium
dioxide (UO2)
S Final product in the manufacture of
nuclear fuel pellets and also present as
depleted uranium in mixed oxide fuel
(MOX). Human, animal, and in vitro
data indicate low solubility of UO2 in
lungs. See UO2-specific dissolution
rates in Table 3.2.
Leach et al. 1973;
Cook and Holt 1974;
Pomroy and Noel 1981;
Schieferdecker et al. 1985;
Price 1989;
Stradling et al. 1989b;
Métivier et al. 1992;
Eidson 1994;
Chazel et al. 2000b;
Ansoborlo et al. 2002;
Stradling et al. 2002
Uranium
trioxide (UO3
or
UO3 ∙ nH2O)
M Formed by heating uranyl nitrate, which
in the fuel fabrication cycle is then
reduced to form UO2. Behavior of UO3
is sensitive to the hydration state, and
its solubility depends on the parameter
n. Rat data indicate either Type F or
Type M behavior.
Harris 1961;
Morrow et al. 1972;
Cook and Holt 1974;
Eidson 1994;
Ansoborlo et al. 2002;
Stradling et al. 2002
Uranium
octoxide
(U3O8)
M Present in yellowcake and also occurs
in later stages of the uranium fuel cycle.
Occupational, animal, and in vitro data
available. Dissolution rate is variable
and apparently dependent on the
process of manufacture. Most data are
consistent with Type M but Type S is
sometimes indicated. See U3O8-
specific dissolution rates in Table 3.2.
Cook and Holt 1974;
West et al. 1979;
Eidson and Mewhinney 1980;
Chalabreysse et al. 1989;
Stradling et al. 1989a, 2002;
Eidson 1990, 1994;
Métivier et al. 1992;
Barber and Forrest 1995;
Ansoborlo et al. 1998b, 2002;
Chazel et al. 1998
Uranium
peroxide
hydrate (UO4
or UO4 ∙ nH2O)
F Present at one stage of uranium fuel
cycle and consists of small needles with
AMAD near 1 µm. Type F behavior
indicated by rat data. See UO4-specific
dissolution rates in Table 3.2..
Ansoborlo et al. 1998a

21
Table 3.1 (continued)
Inhaled form Default type Comments References
Uranium
tetrafluoride
(UF4)
M An intermediate product in the uranium
fuel cycle. Can be reduced to uranium
metal or oxidized by fluorine to form
UF6. Animal studies indicate Type F or
Type M; in vitro solubility studies
indicate Type M. See UF4-specific
dissolution rates in Table 3.2..
Cook and Holt 1974;
Stradling et al. 1985, 2002;
Chalabreysse et al. 1989;
André et al. 1989;
Ansoborlo et al. 1990, 2002;
Eidson 1994; Chazel et al.
2000a
Uranium
hexafluoride
(UF6)
F Exists in vapor form but in presence of
water in the atmosphere or respiratory
tract is converted to uranyl fluoride
(UO2F2) aerosol. Exposure likely to
involve both chemical forms
simultaneously and also hexafluoride
fumes. Rapid absorption from lungs to
blood indicated accidental human
exposures and animal and in vitro data.
Cook and Holt 1974;
Boback 1975;
Morrow et al. 1982;
Moore and Kathren 1985;
Beau and Chalabreysse 1989;
Fisher et al. 1991;
Eidson 1994;
Bailey and Davis 2002
Uranyl Tri-
Butyl-
Phosphate
(U-TBP)
F Used as extractant in nuclear fuel
fabrication and for separation of U and
Pu during reprocessing.
Pellow et al. 1996;
Stradling et al. 2002
Vaporized
uranium metal
M Method of U enrichment based on laser
isotopic separation can produce three
types of aerosols identified as variable
mixtures of U metal, UO2, and U3O8.
Rat studies suggest Type M behavior.
Ansoborlo et al. 1998b
Uranium ore
dust
M Often variable mixtures of relatively
soluble and insoluble fractions.
Moderate solubility indicated by some
in vitro data. Human exposure data
indicate extended lung retention of
portion of intake.
Kalkwarf 1979;
Fisher et al. 1982;
Alexander et al. 1986;
Duport et al. 1991;
Eidson 1994
Ammonium
diuranate
(ADU)
((NH4)2U2O7)
M A component of yellowcake. Rat
studies data indicate moderate solubility
in lungs. In vitro data are variable and
indicate relatively fast to moderate
solubility.
Galibin and Parfenov 1971;
Cook and Holt 1974;
Boback 1975;
Eidson and Mewhinney 1980;
Damon et al. 1984;
Stradling et al. 1987, 2002;
Eidson 1994;
Ansoborlo et al. 2002

22
Table 3.1 (continued)
Inhaled form Default type Comments References
Yellowcake M Yellowcake is a complex mixture of
diuranates, uranyl sulfate, and hydrated
uranium oxides and contains 70–90%
uranium. The main component is U3O8.
In vitro studies indicate dissolution rate
varies with mixture of materials and
preparation process. Differences found
in dissolution rates of low-fired
yellowcake (dried at less than 400° C)
and high-fired (calcined) yellowcake
(dried at 400+° C). See material-
specific dissolution rates in Table 3.2.
Eidson and Mewhinney 1980;
Dennis et al. 1982;
Alexander et al. 1986;
Canu et al. 2008
Uranium
aluminide
(UAlx)
S Experience at one site indicates initially
low solubility followed by rapid
dissolution a few months after intake.
Material-specific parameter values are
given in Leggett et al. 2005.
Leggett et al. 2005
Uranyl
carbonate
complexes
M Little direct information. Theoretical
considerations indicate these complexes
generally may be stable at the pH of
lung fluid but may break down at the
pH of gastric fluid. Data for rats
indicate respiratory kinetics broadly
similar for uranyl nitrate and
bicarbonate but lung retention of
bicarbonate is slightly greater.
Ellender 1987;
USEPA 1999a, 1999b;
Sutton and Burastero 2004
aFor use in the absence of specific information on the in vivo or in vitro solubility of the inhaled material.
Inhalation of uranyl carbonate complexes has received little attention in radiation protection but
is an important consideration for workers involved in extraction or processing of uranium mined
by in situ leaching techniques. With these techniques uranium ores are leached underground by
the introduction of a solvent solution, called a lixiviant, through injection wells drilled into the
ore body. Lixiviants used in U.S. operations often consist of water containing added oxygen and
carbon dioxide or sodium bicarbonate, which mobilize uranium. The injected lixiviant passes
through the ore body and mobilizes the uranium, and the uranium-bearing solution is pumped to
the surface. In a carbonate leach system the uranium would be complexed as uranyl carbonate.
The pregnant leach solution is processed to extract the uranium, usually by ion exchange or by
solvent extraction. The uranium in the pregnant lixiviant conceivably could pose an inhalation
exposure hazard if the material were accidentally released, particularly indoors. For example,
the material could be released due to a pipe or valve failure during processing of the pregnant
lixiviant. Type M is recommended in Table 3.1 as a most likely or default absorption type for
uranyl carbonate, but to derive a worst-case dose one could assume Type S behavior in the

23
respiratory tract. Theoretical considerations suggest, however, that uranyl carbonate complexes
are likely to break down in the acid environment of the stomach (USEPA, 1999a, 1999b; Sutton
and Burastero, 2004). Even if one assumes Type S behavior, the gastrointestinal uptake fraction
for soluble uranium (0.02) should be applied to uranium escalated up the respiratory tract and
swallowed, rather than the value 0.002 applied by the ICRP to inhaled uranium of Type S.
Material-specific parameter values have been proposed in the literature for some forms of
uranium. These have been based on in vitro dissolution studies, animal studies, or relatively
detailed follow-up of cases with elevated intakes of known forms of uranium. Material-specific
parameter values formulated in terms of the model shown in Figure 3.4 are summarized in
Table 3.2. The materials addressed are U3O8 from manufacturing of enriched pellets; industrial
UO2 from mixed oxide (MOX) fuel manufacturing; UF4, used in the hexafluoride process; UO4,
an intermediate compound in the uranium fuel cycle; low-fired yellowcake (dried at less than
400°); and high-fired yellowcake (dried at higher temperatures). Also included for comparison
in Table 3.2 are the corresponding parameter values for the three default absorption types:
Type F, Type M, and Type S.
Table 3.2 Default and material-specific parameter values of the
model shown in Figure 3.4, representing time-dependent
dissolution rates of uranium compoundsa
Material fr sr (d-1
) ss (d-1
)
Type F 1.0 100 – Type M 0.1 100 0.005 Type S 0.001 100 0.0001 U3O8 0.017 2.6 0.00037 UO2 0.03 1.25 0.0015 UF4 0.58 0.21 0.0026 UO4 0.87 0.93 0.024 Yellowcake
(low-firedb)
0.61 0.87 0.017
Yellowcake
(high-firedb)
0.35 0.7 0.0035
aParameter values from ICRP 2002a except values for yellowcake are
based on estimates by Alexander et al. 1986. bLow-fired yellowcake is dried at ≤ 400° C and high-fired (calcined)
yellowcake is dried at 400+° C.
Material-specific parameter values given in the literature, including ICRP documents, must be
used with caution. It should be kept in mind that the dissolution rate of some materials depends
on factors that may differ from site to site, such as the process of formation of the material.
In general, a choice between the ICRP’s default parameter values and material-specific
parameter values should reflect the level of information available on the material to which
workers are being exposed. As a rule of thumb, material-specific parameter values should be
applied only when there is strong information on the dissolution properties of a material and high
24
confidence that the workers were exposed mainly to that material. Application of a given default
absorption type requires only broad information on the solubility properties of an inhaled
material. If information is insufficient to decide whether an inhaled material is best described as
relatively soluble (Type F), moderately soluble (Type M), or relatively insoluble (Type S), then
comparison with exposure limits should be based on the most restrictive of the three default
absorption types with regard to the case of interest.
3.1.3 Typical Sizes of Airborne Particles in Work Environments
The aerodynamic diameter of a particle is defined as the diameter of a unit-density sphere having
the same terminal settling velocity as that particle. In ICRP documents, particle sizes generally
are expressed in terms of the activity median aerodynamic diameter (AMAD), defined as the
aerodynamic diameter of an aerosol particle whose activity is the median for the aerosol.
The default particle size recommended by the ICRP for estimation of doses from inhalation of
particulate aerosols in the workplace is 5 μm AMAD (ICRP 1994b). This value was based on a
survey of published values of AMAD measured in working environments (Dorrian and Bailey
1995). Results compiled from 52 studies indicated a range of 0.12–20 μm AMAD for operations
involving uranium and 0.12–25 μm AMAD for all work environments. The collected data were
fit reasonably well by a lognormal distribution with a median value of 4.4 μm. Data from both
the nuclear power and nuclear fuel handling industries gave a median value of about 4 μm. Data
from uranium mills gave a median value of about 7 μm with AMADs sometimes exceeding
10 μm. High temperature and arc saw cutting operations generated submicron particles and
occasionally bimodal lognormal particle size distributions.
Particle size distributions listed by Dorrian and Bailey (1995) for operations involving uranium
are summarized in Table 3.3. In view of the wide range of reported values for different uranium
operations, sampling to characterize aerosol particle size distributions for individual work
practices is recommended.

25
Table 3.3 Sizes of uranium aerosols in work environments (Dorrian and Bailey, 1995)
Type of workplace Process and comments AMAD (μm) GSD
Uranium mill Activities involving yellowcake
Drum loading 6-12 --
Powder sampling 12-20 --
Lid sealing 12-20 --
After 2 h inactivity 3-6 --
Uranium mill Product packaging 13 4.1
Uranium mill Drum filling 9.1 3.2
Uranium mill Drum filling 5.8 2.7
Dust fall from hopper 14 4.1
Uranium mill Activities involving yellowcake
Filtration 0.72 2.5
Packaging 4.5 2.3
Powder sampling 5.7 2.2
Packaging area, no activity 0.5 2.8
Uranium mill U, Th 7 --
Uranium plant Uranyl fluoride production 1-9 --
Preparing U ore concentrates 5 --
Slag crushing 4-8 --
Annealing, inspection of U metal rods 3.5 --
Weighing UF4/Mg pellets 2.5 --
Uranium plant Saw operation 0.3 --
Oxide burner operation 0.12 --
Uranium plant Burning of uranium cuttings 6.0, 0.49
(bimodal)
--
Uranium plant Metal fabrication >1 --
Uranium mines Stopes (underground) 5 --
Crusher–rock breaker (underground,
U, Th)
7 --
Uranium mine (open pit) Normal mining operations (long-lived
alpha emitters)
11.7 --
Copper-uranium-gold mine Stopes (underground, long-lived alpha
emitters)
5
Uranium mine Ore crushing, transport operations
(underground, U, Th, Ra)
3 --
Natural uranium workshop -- 3.5-6.0 --
Enrichment plant -- 8 --

26
Table 3.3 (continued)
Type of workplace Process and comments AMAD (μm) GSD
Fuel fabrication plant All generation conditions at various
work areas
8.2 --
Fuel fabrication plant Pellet press 6.1 2.1
Fuel fabrication plant Fuel pellet loading 5.2 1.8
Grinding pellets 5.7 2.1
Sintering furnace area 5.3 2.1
Waste treatment area 5.7 2.0
Pellet press 3.9 2.0
Powder blending 3.7 1.8
Powder drum handling 5.2 1.9
Fuel fabrication plant Pellet pressing 8.8 --
Pellet turning 7.1 --
Mixed oxide reactor fuel
fabrication plant
Glove box operations (Pu, U)
Blending of mixed oxide 2.5 1.5
Jet milling 1.6 1.6
Dumping after jet milling 2.3 1.7
Blending after jet milling 2.6 1.5
Slug pressing 3.1 1.5
Grinding slugs 2.3 1.7
Fuel pellet pressing 1.9 1.5
Grinding of fuel pellets 2.1 1.6
Mixed oxide reactor fuel
fabrication plant
Glove box operations, grinding (Pu,
U)
2.4 1.1
Demonstration fuel fabrication
plant (MOX)
Powder blending and mixing (Pu, U) 1.9 1.6
Grinding 2.3 1.6
Spent fuel bays Transfer, cutting, storage and
shipment of fuel (Pu, U, Sr, Cs)
6.8 2.8
Monazite sand separation plant Th, U 1.4 2.0
Mineral sand reprocessing plant Dry mill area (Th, U) 3.2 2.8
Mineral sand processing plants Dry separation plants (Th, U)
All particles 9.0 5.3
Particles <20 μm 2.7 3.6
3.1.4 Sensitivity of Derived Secondary Reference Guidance Levels to AMAD
The secondary reference guidance levels for occupational exposure to airborne uranium given in
this report are largely determined by derived values E = committed effective dose per unit
activity intake of uranium and P = peak concentration of uranium in the kidneys for idealized
27
exposure scenarios. Action levels derived from primary reference radiological guidance levels
alone (i.e., if primary reference chemical guidance levels were not also considered) vary
inversely with E, and action levels derived from primary reference chemical guidance alone vary
inversely with P. The values E and P depend on the size distribution of particles carrying the
airborne uranium, which is expressed in this report in units of AMAD. An AMAD of 5 μm is
used to derive default action levels. This appears to be a reasonable central estimate for uranium
aerosols based on measurements in a variety of uranium facilities (Table 3.3), but values for
individual sites or work stations vary from about 0.1 μm to well over 10 μm.
Figure 3.5 summarizes results of an analysis of the sensitivity of E and P to variation in AMAD
within the range of particle sizes listed in Table 3.3, for uranium of Type F, Type M, or Type S.
Results for particle sizes >10 μm (not shown) are continuations of the indicated trends for sizes
from 5 μm to 10 μm. All of the curves in the figure were based on inhalation of 234
U but would
be virtually identical if based on 235
U, 238
U, or a mixture of 234
U, 235
U, and 238
U. The committed
effective dose E is based on acute intake. Because the peak kidney concentration P can vary
strongly from one exposure pattern to another, the sensitivity of P to AMAD was examined both
for acute and chronic exposure scenarios. The curves labeled P-acute and P-chronic represent
the peak concentration of uranium in the kidneys following acute intake and during continuous
intake at a constant rate, respectively. Each curve in Figure 3.5 is normalized to the value 1.0 at
5 μm AMAD as follows. A committed effective dose coefficient E derived for a given particle
size is divided by the inhalation dose coefficient for 234
U (Table 3.16) for the same absorption
type and particle size 5 μm AMAD. Values for P-acute are based on acute intake of 1 μg U and
are normalized by dividing by the value of P-acute derived for particle size 5 μm AMAD.
Values for P-chronic are based on continuous intake at the rate 1 μg U/d and are normalized by
dividing by the value of P-chronic derived for particle size 5 μm AMAD.
For inhalation of uranium of Type F, the normalized curves for E, P-acute, and P-chronic are
virtually identical. For example, a change in the AMAD that leads to a 15% increase in E will
also lead to a 15% increase in P-acute or P-chronic. The values E, P-acute, and P-chronic are
only moderately sensitive to AMAD, varying by <35% from values derived from the default
AMAD of 5 μm as the AMAD ranges from 0.1 to 20 μm. The relatively small variation of these
values with AMAD indicates that action levels based on the default AMAD should be
appropriate for application to exposures to uranium aerosols with sizes in the range 0.1–20 μm.
P-acute was also found to be only moderately sensitive to AMAD for inhalation of uranium
aerosols of Type M, varying by about 35% from the value of P-acute at 5 μm AMAD as the
particle size varies in the range 0.1–20 μm AMAD. P-acute was found to be somewhat more
sensitive to AMAD for Type S material, varying by about 65% from the value of P-acute at 5 μm
AMAD as the particle size varies in the range 0.1–20 μm AMAD. For both Type M and Type S
material, however, the value of P-acute at 5 μm AMAD is near the peak value for particle sizes
in the range 0.1–20 μm AMAD. Hence, it seems reasonable to apply action levels based on the
default AMAD in virtually any situation where P-acute is the limiting consideration.

28
Figure 3.5 For inhaled
234U, sensitivity of effective dose coefficient (E) and peak kidney
concentration (P-acute and P-chronic for acute and chronic intake, respectively) to particle size.
For each absorption type the curves for E, P-acute, and P-chronic are each normalized to 1.0 for
inhaled particle size 5 μm (represented by a square).
For inhalation of uranium of Type M or Type S, the values E and P-chronic vary nearly in
parallel and are more sensitive to AMAD than in the case of inhalation of Type F material.
E and P-chronic generally increase with decreasing particle size. The steepest climb occurs as the
AMAD decreases from 0.5 μm to 0.1 μm, where values reach about 3–4.5 times the values based
on the default particle size. The relatively high sensitivity of E and P-chronic to changes in the

29
AMAD below 0.5 μm results from HRTM predictions that fractional deposition of inhaled
activity in deep lungs increases sharply with decreasing particle size for submicron particles.
According to the HRTM, a substantial portion of material of Type M or Type S deposited in the
AI is retained for an extended period. Derived lung doses for long-lived uranium isotopes are
nearly proportional to the assumed residence time in AI. Also, fractional absorption of uranium
to blood and hence uptake by the kidneys increases roughly in proportion to the fraction of
inhaled material retained in the AI region for an extended period, due essentially to slow net
mechanical clearance from AI compared with the competing rate of absorption to blood.
As indicated in Table 3.3, sizes of airborne uranium particles in the workplace typically are in
the range 1–20 μm AMAD, but certain tasks such as high temperature and arc saw cutting
operations may involve particle sizes <1 μm AMAD. For workers involved in operations known
or suspected to produce a relatively high quantity of submicron particles, it is prudent to take
special measures to ensure that the primary reference chemical and radiological guidance levels
(see Sections 1 and 2) are not exceeded. Examples of special measures that may be taken
include derivation of air concentration guidelines specific to measured particle sizes based on the
methods described in Section 5, limiting work time in the area, or increasing urinary uranium
measurements and chest counts for frequent comparison with action levels in Table 1.2.
3.1.5 Comparison of AMAD and MMAD
The mass median aerodynamic diameter (MMAD) is defined as the aerodynamic diameter of an
aerosol particle whose mass is the median for the aerosol. The MMAD is equal to the AMAD if
the activity per unit mass is constant among all particles in the aerosol, which is not always the
case. For example, Kotrappa et al. 1979 found that radioactivity per unit mass or volume
increased with decreasing particle size in airborne uranium ore dust in a uranium crusher house.
The study was carried out on particles with area diameter in the range 0.6–3 μm. The area
diameter of a particle is the diameter of a circle having a cross sectional area equivalent to that of
the particle.
Kotrappa and coworkers (1979) proposed that the AMAD of ore dust can be estimated from the
MMAD using the equation:
( ) Eq. 3. 1
where, ln2 is the square of the natural logarithm and σg is the geometric standard deviation
(GSD). A typographical error in the equation given in the paper by Kotrappa and coworkers has
been corrected.
Equation 3.1 implies that the AMAD is less than the MMAD for ore dust. For example, an
MMAD of 5.0 μm with GSD of 2.1 corresponds to an AMAD of 3.0 μm; an MMAD of 2 μm
with GSD of 1.7 corresponds to an AMAD of 1.5 μm; and an MMAD of 0.7 μm with GSD of
2.0 corresponds to an AMAD of 0.44 μm.
Equation 3.1 does not hold for uranium aerosols in general. For example, Bhanti et al. 1986
found that the concentration of uranium in monazite sand varies with the cube of the diameter of

30
airborne particles in the size range 0.6–2 μm (area diameter). This indicates that activity is
roughly proportional to mass and hence that MMAD is approximately the same as AMAD in this
case. Monleau et al. 2006 measured MMAD and AMAD for aerosols generated from UO2 and
UO4 powders found in work areas of uranium fuel cycle facilities. For UO2 aerosols the AMAD
was 2.53 μm with GSD of 1.93, and the MMAD was 1.8 μm with GSD 1.66. For UO4 aerosols
the AMAD was 2.34 μm with GSD 2.01, and the MMAD was 1.31 μm with GSD 1.70. Based
on the measured MMADs and associated GSDs, Equation 3.1 would predict an AMAD of 1.41
μm for UO2 aerosols compared with the measured value of 2.53 μm, and an AMAD of 1.0 for
UO4 aerosols compared with the measured value of 2.34 μm.
Ideally, the MMAD of a uranium aerosol would be used to estimate total and regional deposition
in the respiratory tract if the goal is to estimate the time-dependent mass concentration of
uranium in the kidneys, and the AMAD would be used to estimate deposition if the goal is to
estimate radiation doses to tissues. Based on reported relations of MMAD and AMAD for
uranium aerosols, however, differences between the MMAD and AMAD may not to be of much
practical consequence with regard to interpretation of uranium monitoring data. For example,
for inhaled UO2 of Type S, the derived effective dose per unit intake based on an assumed
AMAD of 1.8 μm (the MMAD measured by Monleau and coworkers for UO2 aerosols) differs
by only 14% from the value based on the measured AMAD of 2.53 μm. For inhaled UO4 of
Type F, the derived peak concentration of uranium in the kidneys per unit intake based on an
assumed MMAD of 2.34 μm (the AMAD measured by Monleau and coworkers for UO4
aerosols) differs by only 13% from the value based on the measured MMAD of 1.31 μm (this
applies to both acute and chronic intake). For moderately soluble (Type M) uranium ore dust
inhaled as fine particles (say, size 0.70 μm MMAD with GSD = 2.0), the derived peak
concentration of uranium in the kidneys per unit intake based on the MMAD differs by only 12%
from the value based on an assumed MMAD of 0.44 μm [the AMAD derived from Equation 3.1]
(this applies to both acute and chronic intake). For the same case of inhaled uranium ore dust,
the effective dose per unit intake derived from an assumed AMAD of 0.70 μm (the MMAD)
differs by only 12% from the value based on an AMAD of 0.44 μm.
To summarize, the MMAD of a uranium aerosol ideally would be used as model input to derive
the peak mass concentration of uranium in the kidneys, and the AMAD ideally would be used as
input to estimate radiation doses to tissues. In practice, any predictive error resulting from
equating MMAD and AMAD is likely to be negligible compared with other sources of error
including uncertainty and variability in the biokinetics of well characterized forms of uranium
and case-specific uncertainties such as the form of uranium inhaled, the average concentration of
uranium in air in the work area, intake by a given worker in the area, and the average
concentration of uranium in urine in a given worker. Thus, if the MMAD of an aerosol is known
and the AMAD is not, it is reasonable to assume that the AMAD is equal to the MMAD. If the
AMAD is known and the MMAD is not, it is reasonable to assume that the MMAD is equal to
the AMAD.
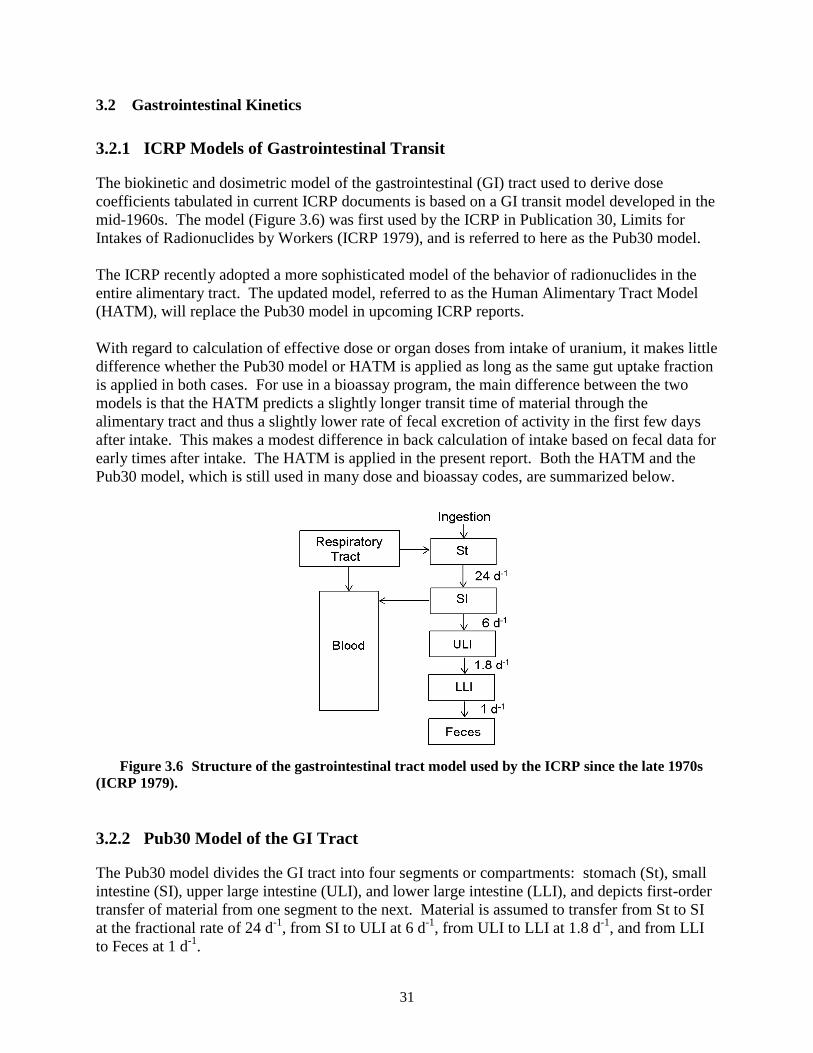
31
3.2 Gastrointestinal Kinetics
3.2.1 ICRP Models of Gastrointestinal Transit
The biokinetic and dosimetric model of the gastrointestinal (GI) tract used to derive dose
coefficients tabulated in current ICRP documents is based on a GI transit model developed in the
mid-1960s. The model (Figure 3.6) was first used by the ICRP in Publication 30, Limits for
Intakes of Radionuclides by Workers (ICRP 1979), and is referred to here as the Pub30 model.
The ICRP recently adopted a more sophisticated model of the behavior of radionuclides in the
entire alimentary tract. The updated model, referred to as the Human Alimentary Tract Model
(HATM), will replace the Pub30 model in upcoming ICRP reports.
With regard to calculation of effective dose or organ doses from intake of uranium, it makes little
difference whether the Pub30 model or HATM is applied as long as the same gut uptake fraction
is applied in both cases. For use in a bioassay program, the main difference between the two
models is that the HATM predicts a slightly longer transit time of material through the
alimentary tract and thus a slightly lower rate of fecal excretion of activity in the first few days
after intake. This makes a modest difference in back calculation of intake based on fecal data for
early times after intake. The HATM is applied in the present report. Both the HATM and the
Pub30 model, which is still used in many dose and bioassay codes, are summarized below.
Figure 3.6 Structure of the gastrointestinal tract model used by the ICRP since the late 1970s
(ICRP 1979).
3.2.2 Pub30 Model of the GI Tract
The Pub30 model divides the GI tract into four segments or compartments: stomach (St), small
intestine (SI), upper large intestine (ULI), and lower large intestine (LLI), and depicts first-order
transfer of material from one segment to the next. Material is assumed to transfer from St to SI
at the fractional rate of 24 d-1
, from SI to ULI at 6 d-1
, from ULI to LLI at 1.8 d-1
, and from LLI
to Feces at 1 d-1
.

32
Absorption of ingested activity to blood is assumed to occur in SI and is described by an
element-specific or, in some cases, a compound-specific “f1 value” representing fractional
absorption of the stable element to blood. For dosimetric calculations each segment of the tract
is represented as an idealized geometric figure. Estimates of dose to tissues of the GI tract from
non-penetrating radiations emitted in the contents of the tract are based on simplistic
assumptions. For beta and alpha emitters the dose to the walls of the GI tract from activity in the
GI contents is taken as 100% and 1%, respectively, of the dose at the surface of the contents.
This is in addition to the dose to the walls of the GI tract from absorbed activity, which is often
the dominant source of dose to the walls of the tract, particularly from long-lived radionuclides.
3.2.3 ICRP’s Updated Human Alimentary Tract Model
The structure of the HATM is shown in Figure 3.7. The compartments and paths of movement
represent the following processes: entry of a radionuclide into the oral cavity by ingestion or
into the esophagus after mechanical clearance from the respiratory tract; sequential transfer
through the lumen of the oral cavity, esophagus, stomach, small intestine, and segments of the
colon, followed by emptying in feces; radionuclide deposition and retention on or between the
teeth and return to the oral cavity; deposition and retention in the oral mucosa or walls of the
stomach or intestines; transfer from the oral mucosa or walls of the stomach or intestines back
into the lumenal contents or into blood (absorption); and transfer from secretory organs or blood
into the contents of segments of the tract.
Figure 3.7 Structure of the HATM. The dashed boxes are not part of the HATM but are
included in the schematic to show connections between the HATM and respiratory and systemic
models.
Entry into the alimentary tract by ingestion or transfer from the respiratory tract and sequential
transfer through the lumen of the tract are regarded as generic processes in that the rates are

33
assumed to be independent of the radionuclide. The other processes addressed by the HATM are
assumed to occur at element-specific rates. For example, element-specific parameter values are
required to describe uptake and retention in the walls of the alimentary tract. An element-
specific process is addressed in HATM applications only if information is available to assign a
non-zero transfer rate to that process. For most elements, specific information on behavior in the
alimentary tract is limited to measurements of fractional absorption to blood.
Separate transit times are provided for transfer of ingested solids, liquids, and total diet through
the mouth and esophagus and for transit of non-caloric liquids, caloric liquids, solids, and total
diet through the stomach. The material-specific values were developed for application to special
cases. Transit values for total diet are intended for standard applications of the HATM.
For purposes of calculating absorbed fractions for short-range radiations originating in the
contents of the alimentary tract, the segments of the tract are represented as a set of idealized
geometric figures and the contents as a homogenous material. For example, the stomach is
treated as a sphere and the esophagus and intestines as right circular cylinders.
The HATM and Pub30 model yield similar tissue dose estimates for most radionuclides, but in
some cases the HATM will yield substantially different doses to walls of the alimentary tract for
one or both of the following reasons:
Retention of radionuclides in the walls of the tract can be specified in the HATM when
information is available. This feature can result in substantial increases in the estimated
dose to the walls.
The location of sensitive cells of different regions of the tract is modeled explicitly in the
HATM. The targets for all effects are taken to be the epithelial stem cells, which are
known to be removed by some distance from the lumen of the tract. For some alpha and
beta emitters, this change from the Pub30 model results in substantially reduced dose
estimates because alpha emissions and low-energy beta emissions originating in the
contents of the tract do not penetrate to the depth at which the sensitive cells are
estimated to reside.
3.2.4 Gastrointestinal Absorption of Uranium
Uranium may be absorbed from the alimentary tract to blood after oral intake or after swallowing
of inhaled activity that has been escalated up the respiratory airways to the pharynx. Fractional
absorption of uranium from the alimentary tract after escalation from the respiratory tract cannot
be determined directly due to simultaneous absorption of uranium from the respiratory tract.
Estimated fractional absorption of uranium after oral intake ranges from less than 0.001 to about
0.06 for individual subjects (Leggett and Harrison 1995; Harrison et al. 2001). Central values
estimated in controlled studies on humans range from about 0.01 to about 0.025. Environmental
studies yield central estimates in the range 0.003–0.03. Data from studies on laboratory animals
indicate that fractional uptake of forms of uranium commonly encountered in the workplace
depends strongly on the chemical form ingested. Absorption appears to be greatest for uranium
ingested as UO2(NO3)2∙6H2O, UO2F2, or Na2U2O7, roughly half as great for UO4 or UO3, and
1–2 orders of magnitude lower for UCl4, U3O8, UO2, and UF4 (Leggett and Harrison 1995).

34
In current documents of the ICRP (1994b, 1995a, 1995b), fractional uptake from the alimentary
tract to blood is assumed to be 0.02 for relatively soluble forms of uranium including uranium in
food or drink and 0.002 for relatively insoluble forms of uranium. For activity that is swallowed
after escalation from the respiratory tract, the value 0.02 is applied to uranium inhaled as Type F
or Type M material, and 0.002 is applied to uranium inhaled as Type S material.
As is the case for parameter values describing dissolution and absorption in the respiratory tract,
the ICRP’s default values for fractional absorption of uranium from the gastrointestinal tract may
be replaced by material-specific values whenever there is supporting information or suggestive
evidence that the default values are not sufficiently cautious. This is illustrated in an earlier
discussion of inhaled uranyl carbonate complexes in Section 3.1.2.
3.3 Biokinetics of Uranium that Reaches Blood
The ICRP’s current systemic biokinetic model for uranium was adopted in ICRP Publication 69
(1995a). The model structure is shown in Figure 3.8. This is a generic model structure applied
by the ICRP to several elements that tend to follow the movement of calcium in bone (Leggett
1992). Uranium is not a physiological analogue of calcium in most respects, but the uranyl ion
follows the movement of calcium in bone sufficiently closely that the structure of the calcium
model is applicable to uranium (Leggett 1994). There is evidence that UO2++
exchanges with
Ca++
at the surfaces of bone mineral crystals, although UO2++
apparently does not participate in
crystal formation or enter existing crystals. The gross distribution of uranium in the skeleton is
similar to that of calcium at early times after uptake to blood. Uranium is initially present on all
bone surfaces but is most highly concentrated in areas of growth. Perhaps depending on the
microscopic structure of the bone of each species, uranium on bone surfaces may gradually
diffuse into bone volume. As is the case for calcium, a substantial portion of uranium deposited
in bone apparently is lost to blood plasma by processes that occur more rapidly than bone
resorption.
Parameter values for uranium in a reference adult are given in Table 3.4. Some of these values
are generic for the so-called “bone-volume-seeking” elements. For example, values describing
removal from non-exchangeable bone volume compartments are estimated in terms of bone
remodeling rates and therefore are independent of the element. Most of the transfer coefficients
in the model are element specific. Uranium-specific parameter values given in Table 3.4 were
based mainly on the following sources of information: measurements of uranium in blood and
excreta of several human subjects who were intravenously injected with uranium; postmortem
measurements of uranium in tissues of some of those subjects; postmortem measurements of
uranium in tissues of occupationally and environmentally exposed subjects; data on baboons,
dogs, or smaller laboratory animals exposed to uranium for experimental purposes; and
consideration of the physiological processes thought to determine retention and translocation of
uranium in the body (Leggett 1994; ICRP 1995a). The methods of selection of the parameter
values of the ICRP’s systemic model for uranium are described by Leggett (1994).

35
Figure 3.8. The ICRP’s model structure for uranium (after ICRP Publication 69 1995a);
exch = exchangeable; nonexch = nonexchangeable.

36
Table 3.4 Transfer coefficients in ICRP’s model for
systemic uranium (ICRP 1995a)
Path Transfer coefficient
(d-1
) From plasma to: ST0 RBC Urinary bladder contents Kidney 1 Kidney 2 Upper large intestine contents Liver 1 ST1 ST2 Trabecular bone surfaces Cortical bone surfaces
1.050 × 10
1 2.450 × 10
-1 1.543 × 10
1 2.940 × 10
0 1.220 × 10
-2 1.220 × 10
-1 3.670 × 10
-1 1.630 × 10
0 7.350 × 10
-2 2.040 × 10
0 1.630 × 10
0 To plasma from: ST0 RBC Kidney 2 Liver 1 Liver 2 ST1 ST2 Bone surfaces
a Nonexch. trabecular bone volume Nonexch. cortical bone volume
8.320 × 10
0 3.470 × 10
-1 3.800 × 10
-4 9.200 × 10
-2 1.900 × 10
-4 3.470 × 10
-2 1.900 × 10
-5 6.930 × 10
-2 4.930 × 10
-4 8.210 × 10
-5 From Kidney 1 to urinary bladder contents
9.900 × 10
-2 From Liver 1 to Liver 2
6.930 × 10
-3 From bone surfaces to exchangeable bone volume
a
6.930 × 10⁻²
From exchangeable bone volume to bone surfaces
a
1.730 × 10⁻²
From exchangeable bone volume to
nonexchangeable volumea
5.780 × 10
-3
aApplies both to trabecular and cortical bone compartments.

37
3.4 Model Predictions of Retention and Excretion of Uranium Following Acute Inhalation
Because it is not feasible to derive action levels for each of a comprehensive set of exposure
patterns that may arise in the workplace, derived values are based on two idealized patterns of
exposure: (1) acute intake, and (2) continuous intake at a constant rate. The second pattern does
not actually occur in the workplace but for computational convenience is used as a surrogate for
chronic occupational intake for purposes of projecting accumulation of activity in tissues and
radiation doses and evaluating bioassay data. Section 4 compares predictions of retention and
excretion of uranium based on continuous exposure with predictions based on more complex
patterns of exposure that might occur in the workplace. The tables and figures that follow in the
present section give model predictions, based on either acute intake or continuous intake at a
constant rate, of quantities such as urinary and fecal excretion rates and retention in the lungs
that may be useful for interpreting monitoring data or bioassay data for uranium.
Model predictions of retention and excretion of long-lived uranium isotopes as a function of time
following acute uptake of uranium into blood at time zero are given in Table 3.5. Predictions of
retention and excretion during continuous uptake to blood at a constant rate are given in
Table 3.6. Table 3.5 might be used to evaluate situations in which short-term uptake to blood is
suspected (e.g., a puncture wound case involving a relatively soluble form of uranium).
Table 3.5 might also be used to estimate urinary and fecal excretion rates and total systemic
retention of uranium in any case where the input to blood occurs over an extended period,
provided the rate of input to blood can be estimated as a function of time.
Model predictions of retention and excretion of long-lived uranium isotopes as a function of time
following acute inhalation of relatively soluble (Type F), moderately soluble (Type M), and
relatively insoluble (Type S) forms by a reference worker are given in Tables 3.7-3.9,
respectively. Model predictions of retention and excretion of long-lived uranium isotopes as a
function of time following the start of continuous exposure (24 hours a day, 7 days a week) of
relatively soluble (Type F), moderately soluble (Type M), and relatively insoluble (Type S)
forms by a reference worker are given in Tables 3.10-3.12, respectively. A gastrointestinal
uptake fraction of 0.02 was applied to Type F and Type M, and 0.002 was applied to Type S.
Figures 3.9-3.11 address the concentration of uranium in the kidneys as a function of time after
acute intake of uranium or during chronic exposure to uranium. The mass of the kidneys is
assumed to be 310 g, the value given in ICRP Publication 89 (2002b) for a reference adult male.
Figure 3.9 addresses direct input of uranium to blood either acutely, as might occur in the case of
a uranium-contaminated puncture wound, or chronically, as might occur in the case of a wound
in which a small piece of uranium metal is left embedded in muscle tissue. Figure 3.10 shows
model predictions of the concentration of uranium in the kidneys as a function of time after acute
inhalation of 1 μg of relatively soluble (Type F), moderately soluble (Type M), or relatively
insoluble (Type S) uranium of particle size 5 μm AMAD. Figure 3.11 shows model predictions
of the concentration of uranium in the kidneys as a function of time after start of continuous
inhalation of these three generic forms of uranium at the rate 1 μg U/d. It can be shown that the
uranium concentration in the kidney converges to essentially the same value over an extended
period regardless of the pattern of intake within any one-week or one-month period, as long as
the total weekly or monthly intake is constant. Model predictions of the mass concentration of

38
uranium in the kidneys gradually approach 0.003 μg U /g kidney for inhalation of Type F
material, 0.00075 μg U /g kidney for inhalation of Type M material, and 0.000078 μg U /g
kidney for inhalation of Type S material.
Table 3.5 Model predictions of retention and excretion (fraction of intake) of
uranium following acute input of uranium into blood
Day
after
intakea
Urine Feces Retained
in kidneys
Retained
in total
body 24 h Cumulative 24 h Cumulative
1 6.4E-01 6.4E-01 1.3E-03 1.3E-03 1.1E-01 3.5E-01
2 2.3E-02 6.7E-01 2.3E-03 3.7E-03 1.0E-01 3.3E-01
3 1.8E-02 6.8E-01 1.1E-03 4.7E-03 9.5E-02 3.1E-01
4 1.6E-02 7.0E-01 3.5E-04 5.1E-03 8.7E-02 2.9E-01
5 1.5E-02 7.2E-01 1.3E-04 5.2E-03 8.0E-02 2.8E-01
6 1.3E-02 7.3E-01 6.8E-05 5.3E-03 7.4E-02 2.7E-01
7 1.2E-02 7.4E-01 5.1E-05 5.3E-03 6.8E-02 2.5E-01
8 1.1E-02 7.5E-01 4.4E-05 5.4E-03 6.2E-02 2.4E-01
9 1.0E-02 7.6E-01 4.0E-05 5.4E-03 5.7E-02 2.3E-01
10 9.4E-03 7.7E-01 3.6E-05 5.4E-03 5.3E-02 2.2E-01
15 6.1E-03 8.1E-01 2.3E-05 5.6E-03 3.5E-02 1.8E-01
20 4.2E-03 8.4E-01 1.7E-05 5.7E-03 2.3E-02 1.6E-01
30 2.3E-03 8.7E-01 1.1E-05 5.8E-03 1.1E-02 1.3E-01
40 1.5E-03 8.9E-01 7.9E-06 5.9E-03 5.7E-03 1.1E-01
50 1.0E-03 9.0E-01 6.1E-06 6.0E-03 3.5E-03 9.7E-02
60 7.9E-04 9.1E-01 4.9E-06 6.0E-03 2.5E-03 8.7E-02
70 6.2E-04 9.1E-01 4.0E-06 6.1E-03 1.9E-03 8.0E-02
80 5.0E-04 9.2E-01 3.3E-06 6.1E-03 1.6E-03 7.5E-02
90 4.2E-04 9.2E-01 2.7E-06 6.1E-03 1.4E-03 7.0E-02
100 3.5E-04 9.3E-01 2.3E-06 6.2E-03 1.3E-03 6.6E-02
150 1.6E-04 9.4E-01 1.1E-06 6.2E-03 8.9E-04 5.4E-02
200 8.5E-05 9.5E-01 5.6E-07 6.3E-03 7.4E-04 4.8E-02
300 3.1E-05 9.5E-01 2.1E-07 6.3E-03 6.2E-04 4.3E-02
400 1.6E-05 9.5E-01 1.1E-07 6.3E-03 5.7E-04 4.1E-02
500 1.2E-05 9.5E-01 7.7E-08 6.3E-03 5.5E-04 4.0E-02
600 1.0E-05 9.6E-01 6.6E-08 6.3E-03 5.2E-04 3.8E-02
700 9.3E-06 9.6E-01 6.2E-08 6.4E-03 5.0E-04 3.7E-02
800 8.8E-06 9.6E-01 5.8E-08 6.4E-03 4.9E-04 3.7E-02
900 8.4E-06 9.6E-01 5.6E-08 6.4E-03 4.7E-04 3.6E-02
1000 8.1E-06 9.6E-01 5.4E-08 6.4E-03 4.5E-04 3.5E-02
1500 6.6E-06 9.6E-01 4.4E-08 6.4E-03 3.8E-04 3.1E-02
2000 5.5E-06 9.7E-01 3.6E-08 6.4E-03 3.1E-04 2.8E-02
3000 3.8E-06 9.7E-01 2.5E-08 6.4E-03 2.2E-04 2.4E-02
4000 2.8E-06 9.7E-01 1.8E-08 6.5E-03 1.5E-04 2.0E-02
5000 2.1E-06 9.8E-01 1.4E-08 6.5E-03 1.0E-04 1.8E-02
6000 1.6E-06 9.8E-01 1.1E-08 6.5E-03 7.2E-05 1.6E-02
7000 1.3E-06 9.8E-01 8.6E-09 6.5E-03 5.1E-05 1.5E-02
8000 1.1E-06 9.8E-01 7.2E-09 6.5E-03 3.6E-05 1.3E-02
9000 9.3E-07 9.8E-01 6.2E-09 6.5E-03 2.5E-05 1.2E-02
10000 8.1E-07 9.8E-01 5.4E-09 6.5E-03 1.8E-05 1.2E-02 a24-h excretion values for Day 1 refer to 0–24 h after intake, Day 2 to 24–48 h after intake, and so
forth. Retention values for Day 1 refer to retention at 24 h after intake, for Day 2 at 48 h, and so forth.

39
Table 3.6 Model predictions of retention and excretion (multiple of daily intake) of
uranium during continuous input of uranium into blood at a constant rate
Day after start
of intakea
Urine Feces Retained
in
kidneys
Retained
in total
body 24 h Cumulative 24 h Cumulative
1 5.2E-01 5.2E-01 4.3E-04 4.3E-04 1.0E-01 4.7E-01
2 6.6E-01 1.2E+00 2.6E-03 3.0E-03 2.1E-01 8.1E-01
3 6.8E-01 1.9E+00 4.3E-03 7.3E-03 3.1E-01 1.1E+00
4 6.9E-01 2.5E+00 4.9E-03 1.2E-02 4.0E-01 1.4E+00
5 7.1E-01 3.3E+00 5.1E-03 1.7E-02 4.9E-01 1.7E+00
6 7.2E-01 4.0E+00 5.2E-03 2.3E-02 5.6E-01 2.0E+00
7 7.4E-01 4.7E+00 5.3E-03 2.8E-02 6.3E-01 2.3E+00
8 7.5E-01 5.5E+00 5.3E-03 3.3E-02 7.0E-01 2.5E+00
9 7.6E-01 6.2E+00 5.4E-03 3.9E-02 7.6E-01 2.7E+00
10 7.7E-01 7.0E+00 5.4E-03 4.4E-02 8.1E-01 3.0E+00
15 8.1E-01 1.1E+01 5.6E-03 7.2E-02 1.0E+00 4.0E+00
20 8.4E-01 1.5E+01 5.7E-03 1.0E-01 1.2E+00 4.8E+00
30 8.7E-01 2.4E+01 5.8E-03 1.6E-01 1.3E+00 6.2E+00
40 8.9E-01 3.2E+01 5.9E-03 2.2E-01 1.4E+00 7.4E+00
50 9.0E-01 4.1E+01 6.0E-03 2.7E-01 1.5E+00 8.4E+00
60 9.1E-01 5.0E+01 6.0E-03 3.3E-01 1.5E+00 9.4E+00
70 9.1E-01 5.9E+01 6.1E-03 4.0E-01 1.5E+00 1.0E+01
80 9.2E-01 6.9E+01 6.1E-03 4.6E-01 1.5E+00 1.1E+01
90 9.2E-01 7.8E+01 6.1E-03 5.2E-01 1.5E+00 1.2E+01
100 9.3E-01 8.7E+01 6.2E-03 5.8E-01 1.6E+00 1.2E+01
150 9.4E-01 1.3E+02 6.2E-03 8.9E-01 1.6E+00 1.5E+01
200 9.5E-01 1.8E+02 6.3E-03 1.2E+00 1.6E+00 1.8E+01
300 9.5E-01 2.8E+02 6.3E-03 1.8E+00 1.7E+00 2.2E+01
400 9.5E-01 3.7E+02 6.3E-03 2.5E+00 1.8E+00 2.7E+01
500 9.5E-01 4.7E+02 6.3E-03 3.1E+00 1.8E+00 3.1E+01
600 9.6E-01 5.6E+02 6.3E-03 3.7E+00 1.9E+00 3.5E+01
700 9.6E-01 6.6E+02 6.4E-03 4.4E+00 1.9E+00 3.8E+01
800 9.6E-01 7.5E+02 6.4E-03 5.0E+00 2.0E+00 4.2E+01
900 9.6E-01 8.5E+02 6.4E-03 5.6E+00 2.0E+00 4.6E+01
1000 9.6E-01 9.4E+02 6.4E-03 6.3E+00 2.1E+00 4.9E+01
1500 9.6E-01 1.4E+03 6.4E-03 9.5E+00 2.3E+00 6.6E+01
2000 9.7E-01 1.9E+03 6.4E-03 1.3E+01 2.5E+00 8.0E+01
3000 9.7E-01 2.9E+03 6.4E-03 1.9E+01 2.7E+00 1.1E+02
4000 9.7E-01 3.8E+03 6.5E-03 2.6E+01 2.9E+00 1.3E+02
5000 9.8E-01 4.8E+03 6.5E-03 3.2E+01 3.0E+00 1.5E+02
6000 9.8E-01 5.8E+03 6.5E-03 3.9E+01 3.1E+00 1.6E+02
7000 9.8E-01 6.8E+03 6.5E-03 4.5E+01 3.2E+00 1.8E+02
8000 9.8E-01 7.8E+03 6.5E-03 5.2E+01 3.2E+00 1.9E+02
9000 9.8E-01 8.7E+03 6.5E-03 5.8E+01 3.2E+00 2.1E+02
10000 9.8E-01 9.7E+03 6.5E-03 6.5E+01 3.3E+00 2.2E+02 a24-h excretion for Day 1 refers to 0–24 h after start of intake, for Day 2 to 24–48 h, and so
forth. Retention values for Day 1 refer to retention at 24 h after start of intake, for Day 2 at 48 h, and so forth.

40
Table 3.7 Model predictions of retention and excretion of uranium (fraction of intake)
following acute inhalation of a relatively soluble form (Type F, 5 μm AMAD)
Day after
intakea
24-h urinary
excretion 24-h fecal
excretion Retained in
lungsb
Retained in
kidneys Retained in
total body 1 1.8E-01 4.2E-02 0.0E+00 3.2E-02 3.8E-01 2 6.4E-03 9.3E-02 0.0E+00 2.9E-02 2.0E-01 3 5.1E-03 4.5E-02 0.0E+00 2.7E-02 1.2E-01 4 4.6E-03 1.3E-02 0.0E+00 2.5E-02 9.4E-02 5 4.2E-03 3.2E-03 0.0E+00 2.3E-02 8.3E-02 6 3.8E-03 7.0E-04 0.0E+00 2.1E-02 7.7E-02 7 3.5E-03 1.5E-04 0.0E+00 1.9E-02 7.3E-02 8 3.2E-03 3.7E-05 0.0E+00 1.8E-02 6.9E-02 9 2.9E-03 1.6E-05 0.0E+00 1.6E-02 6.6E-02
10 2.7E-03 1.1E-05 0.0E+00 1.5E-02 6.3E-02 15 1.7E-03 6.6E-06 0.0E+00 9.9E-03 5.3E-02 20 1.2E-03 4.9E-06 0.0E+00 6.6E-03 4.5E-02 30 6.6E-04 3.1E-06 0.0E+00 3.1E-03 3.6E-02 40 4.2E-04 2.3E-06 0.0E+00 1.6E-03 3.1E-02 50 3.0E-04 1.7E-06 0.0E+00 1.0E-03 2.8E-02 60 2.2E-04 1.4E-06 0.0E+00 7.0E-04 2.5E-02 70 1.8E-04 1.1E-06 0.0E+00 5.5E-04 2.3E-02 80 1.4E-04 9.3E-07 0.0E+00 4.6E-04 2.1E-02 90 1.2E-04 7.8E-07 0.0E+00 4.0E-04 2.0E-02
100 9.9E-05 6.5E-07 0.0E+00 3.6E-04 1.9E-02 150 4.6E-05 3.0E-07 0.0E+00 2.5E-04 1.5E-02 200 2.4E-05 1.6E-07 0.0E+00 2.1E-04 1.4E-02 300 8.8E-06 5.8E-08 0.0E+00 1.8E-04 1.2E-02 400 4.6E-06 3.0E-08 0.0E+00 1.6E-04 1.2E-02 500 3.3E-06 2.2E-08 0.0E+00 1.6E-04 1.1E-02 600 2.8E-06 1.9E-08 0.0E+00 1.5E-04 1.1E-02 700 2.6E-06 1.8E-08 0.0E+00 1.4E-04 1.1E-02 800 2.5E-06 1.7E-08 0.0E+00 1.4E-04 1.0E-02 900 2.4E-06 1.6E-08 0.0E+00 1.3E-04 1.0E-02
1000 2.3E-06 1.5E-08 0.0E+00 1.3E-04 9.9E-03 1500 1.9E-06 1.3E-08 0.0E+00 1.1E-04 8.9E-03 2000 1.6E-06 1.0E-08 0.0E+00 8.9E-05 8.0E-03 3000 1.1E-06 7.2E-09 0.0E+00 6.2E-05 6.7E-03 4000 7.8E-07 5.2E-09 0.0E+00 4.3E-05 5.8E-03 5000 5.9E-07 3.9E-09 0.0E+00 3.0E-05 5.1E-03 6000 4.6E-07 3.0E-09 0.0E+00 2.1E-05 4.6E-03 7000 3.7E-07 2.5E-09 0.0E+00 1.4E-05 4.2E-03 8000 3.1E-07 2.1E-09 0.0E+00 1.0E-05 3.8E-03 9000 2.7E-07 1.8E-09 0.0E+00 7.2E-06 3.5E-03
10000 2.3E-07 1.5E-09 0.0E+00 5.1E-06 3.3E-03 a24-h excretion values for Day 1 after intake refer to cumulative excretion 0–24 h after intake, Day 2
to 24–48 h after intake, and so forth. Retention values for Day 1 refer to retention at 24 h after intake,
for Day 2 at 48 h, and so forth. bTotal content of thoracic compartments shown in Figure 3.1.
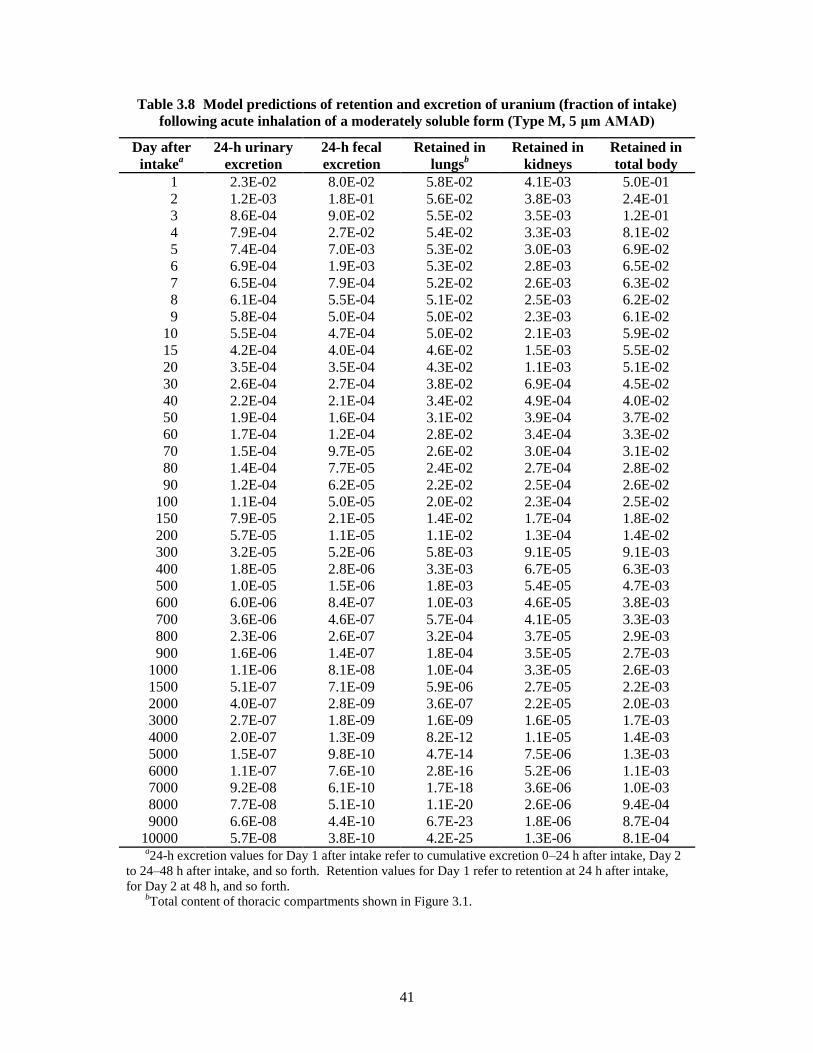
41
Table 3.8 Model predictions of retention and excretion of uranium (fraction of intake)
following acute inhalation of a moderately soluble form (Type M, 5 μm AMAD)
Day after
intakea
24-h urinary
excretion 24-h fecal
excretion Retained in
lungsb
Retained in
kidneys Retained in
total body 1 2.3E-02 8.0E-02 5.8E-02 4.1E-03 5.0E-01 2 1.2E-03 1.8E-01 5.6E-02 3.8E-03 2.4E-01 3 8.6E-04 9.0E-02 5.5E-02 3.5E-03 1.2E-01 4 7.9E-04 2.7E-02 5.4E-02 3.3E-03 8.1E-02 5 7.4E-04 7.0E-03 5.3E-02 3.0E-03 6.9E-02 6 6.9E-04 1.9E-03 5.3E-02 2.8E-03 6.5E-02 7 6.5E-04 7.9E-04 5.2E-02 2.6E-03 6.3E-02 8 6.1E-04 5.5E-04 5.1E-02 2.5E-03 6.2E-02 9 5.8E-04 5.0E-04 5.0E-02 2.3E-03 6.1E-02
10 5.5E-04 4.7E-04 5.0E-02 2.1E-03 5.9E-02 15 4.2E-04 4.0E-04 4.6E-02 1.5E-03 5.5E-02 20 3.5E-04 3.5E-04 4.3E-02 1.1E-03 5.1E-02 30 2.6E-04 2.7E-04 3.8E-02 6.9E-04 4.5E-02 40 2.2E-04 2.1E-04 3.4E-02 4.9E-04 4.0E-02 50 1.9E-04 1.6E-04 3.1E-02 3.9E-04 3.7E-02 60 1.7E-04 1.2E-04 2.8E-02 3.4E-04 3.3E-02 70 1.5E-04 9.7E-05 2.6E-02 3.0E-04 3.1E-02 80 1.4E-04 7.7E-05 2.4E-02 2.7E-04 2.8E-02 90 1.2E-04 6.2E-05 2.2E-02 2.5E-04 2.6E-02
100 1.1E-04 5.0E-05 2.0E-02 2.3E-04 2.5E-02 150 7.9E-05 2.1E-05 1.4E-02 1.7E-04 1.8E-02 200 5.7E-05 1.1E-05 1.1E-02 1.3E-04 1.4E-02 300 3.2E-05 5.2E-06 5.8E-03 9.1E-05 9.1E-03 400 1.8E-05 2.8E-06 3.3E-03 6.7E-05 6.3E-03 500 1.0E-05 1.5E-06 1.8E-03 5.4E-05 4.7E-03 600 6.0E-06 8.4E-07 1.0E-03 4.6E-05 3.8E-03 700 3.6E-06 4.6E-07 5.7E-04 4.1E-05 3.3E-03 800 2.3E-06 2.6E-07 3.2E-04 3.7E-05 2.9E-03 900 1.6E-06 1.4E-07 1.8E-04 3.5E-05 2.7E-03
1000 1.1E-06 8.1E-08 1.0E-04 3.3E-05 2.6E-03 1500 5.1E-07 7.1E-09 5.9E-06 2.7E-05 2.2E-03 2000 4.0E-07 2.8E-09 3.6E-07 2.2E-05 2.0E-03 3000 2.7E-07 1.8E-09 1.6E-09 1.6E-05 1.7E-03 4000 2.0E-07 1.3E-09 8.2E-12 1.1E-05 1.4E-03 5000 1.5E-07 9.8E-10 4.7E-14 7.5E-06 1.3E-03 6000 1.1E-07 7.6E-10 2.8E-16 5.2E-06 1.1E-03 7000 9.2E-08 6.1E-10 1.7E-18 3.6E-06 1.0E-03 8000 7.7E-08 5.1E-10 1.1E-20 2.6E-06 9.4E-04 9000 6.6E-08 4.4E-10 6.7E-23 1.8E-06 8.7E-04
10000 5.7E-08 3.8E-10 4.2E-25 1.3E-06 8.1E-04 a24-h excretion values for Day 1 after intake refer to cumulative excretion 0–24 h after intake, Day 2
to 24–48 h after intake, and so forth. Retention values for Day 1 refer to retention at 24 h after intake,
for Day 2 at 48 h, and so forth. bTotal content of thoracic compartments shown in Figure 3.1.
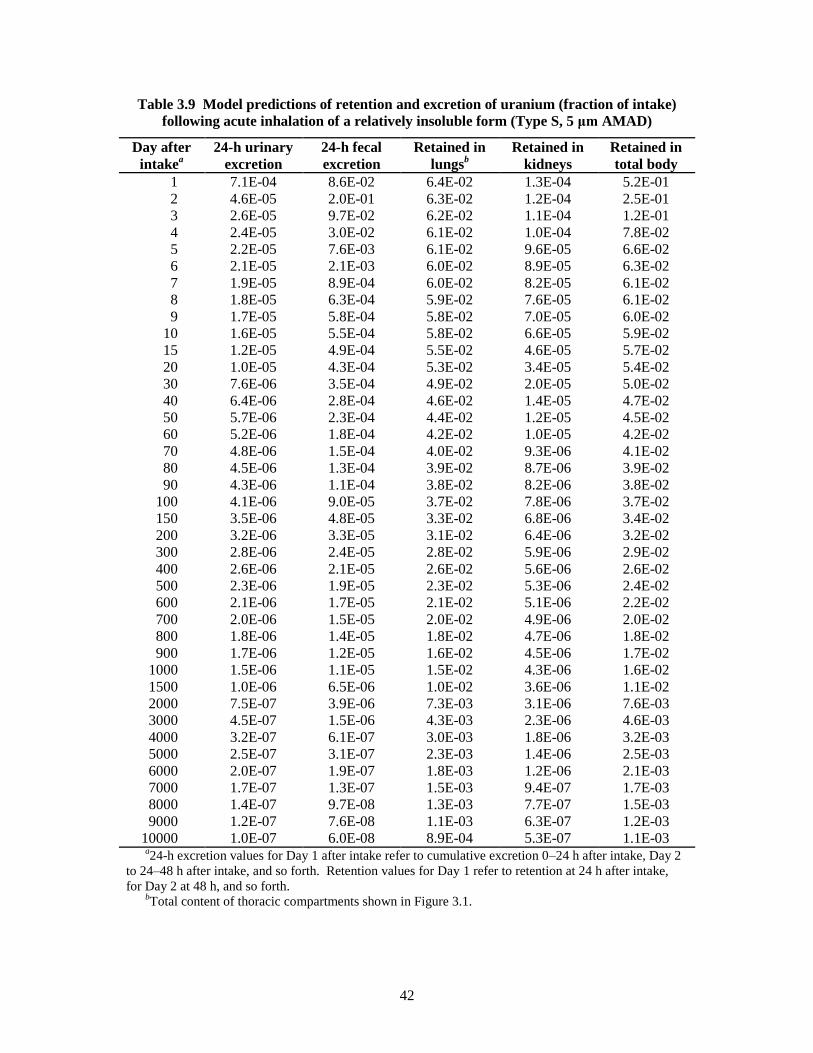
42
Table 3.9 Model predictions of retention and excretion of uranium (fraction of intake)
following acute inhalation of a relatively insoluble form (Type S, 5 μm AMAD)
Day after
intakea
24-h urinary
excretion 24-h fecal
excretion Retained in
lungsb
Retained in
kidneys Retained in
total body 1 7.1E-04 8.6E-02 6.4E-02 1.3E-04 5.2E-01 2 4.6E-05 2.0E-01 6.3E-02 1.2E-04 2.5E-01 3 2.6E-05 9.7E-02 6.2E-02 1.1E-04 1.2E-01 4 2.4E-05 3.0E-02 6.1E-02 1.0E-04 7.8E-02 5 2.2E-05 7.6E-03 6.1E-02 9.6E-05 6.6E-02 6 2.1E-05 2.1E-03 6.0E-02 8.9E-05 6.3E-02 7 1.9E-05 8.9E-04 6.0E-02 8.2E-05 6.1E-02 8 1.8E-05 6.3E-04 5.9E-02 7.6E-05 6.1E-02 9 1.7E-05 5.8E-04 5.8E-02 7.0E-05 6.0E-02
10 1.6E-05 5.5E-04 5.8E-02 6.6E-05 5.9E-02 15 1.2E-05 4.9E-04 5.5E-02 4.6E-05 5.7E-02 20 1.0E-05 4.3E-04 5.3E-02 3.4E-05 5.4E-02 30 7.6E-06 3.5E-04 4.9E-02 2.0E-05 5.0E-02 40 6.4E-06 2.8E-04 4.6E-02 1.4E-05 4.7E-02 50 5.7E-06 2.3E-04 4.4E-02 1.2E-05 4.5E-02 60 5.2E-06 1.8E-04 4.2E-02 1.0E-05 4.2E-02 70 4.8E-06 1.5E-04 4.0E-02 9.3E-06 4.1E-02 80 4.5E-06 1.3E-04 3.9E-02 8.7E-06 3.9E-02 90 4.3E-06 1.1E-04 3.8E-02 8.2E-06 3.8E-02
100 4.1E-06 9.0E-05 3.7E-02 7.8E-06 3.7E-02 150 3.5E-06 4.8E-05 3.3E-02 6.8E-06 3.4E-02 200 3.2E-06 3.3E-05 3.1E-02 6.4E-06 3.2E-02 300 2.8E-06 2.4E-05 2.8E-02 5.9E-06 2.9E-02 400 2.6E-06 2.1E-05 2.6E-02 5.6E-06 2.6E-02 500 2.3E-06 1.9E-05 2.3E-02 5.3E-06 2.4E-02 600 2.1E-06 1.7E-05 2.1E-02 5.1E-06 2.2E-02 700 2.0E-06 1.5E-05 2.0E-02 4.9E-06 2.0E-02 800 1.8E-06 1.4E-05 1.8E-02 4.7E-06 1.8E-02 900 1.7E-06 1.2E-05 1.6E-02 4.5E-06 1.7E-02
1000 1.5E-06 1.1E-05 1.5E-02 4.3E-06 1.6E-02 1500 1.0E-06 6.5E-06 1.0E-02 3.6E-06 1.1E-02 2000 7.5E-07 3.9E-06 7.3E-03 3.1E-06 7.6E-03 3000 4.5E-07 1.5E-06 4.3E-03 2.3E-06 4.6E-03 4000 3.2E-07 6.1E-07 3.0E-03 1.8E-06 3.2E-03 5000 2.5E-07 3.1E-07 2.3E-03 1.4E-06 2.5E-03 6000 2.0E-07 1.9E-07 1.8E-03 1.2E-06 2.1E-03 7000 1.7E-07 1.3E-07 1.5E-03 9.4E-07 1.7E-03 8000 1.4E-07 9.7E-08 1.3E-03 7.7E-07 1.5E-03 9000 1.2E-07 7.6E-08 1.1E-03 6.3E-07 1.2E-03
10000 1.0E-07 6.0E-08 8.9E-04 5.3E-07 1.1E-03 a24-h excretion values for Day 1 after intake refer to cumulative excretion 0–24 h after intake, Day 2
to 24–48 h after intake, and so forth. Retention values for Day 1 refer to retention at 24 h after intake,
for Day 2 at 48 h, and so forth. bTotal content of thoracic compartments shown in Figure 3.1.

43
Table 3.10 Model predictions of retention and excretion of uranium (multiple of daily intake)
as a function of time after start of continuous inhalation of a relatively soluble form
(Type F, 5 μm AMAD)
Days after
start of
intakea
24-h
urinary
excretion
24-h fecal
excretion Retained in
lungsb
Retained in
kidneys Retained in
total body
1 1.5E-01 1.1E-02 8.1E-04 3.0E-02 5.3E-01 2 1.8E-01 9.0E-02 8.1E-04 6.0E-02 8.0E-01 3 1.9E-01 1.6E-01 8.1E-04 8.8E-02 9.6E-01 4 2.0E-01 1.9E-01 8.1E-04 1.1E-01 1.1E+00 5 2.0E-01 2.0E-01 8.1E-04 1.4E-01 1.2E+00 6 2.1E-01 2.0E-01 8.1E-04 1.6E-01 1.3E+00 7 2.1E-01 2.0E-01 8.1E-04 1.8E-01 1.3E+00 8 2.1E-01 2.0E-01 8.1E-04 2.0E-01 1.4E+00 9 2.2E-01 2.0E-01 8.1E-04 2.2E-01 1.5E+00
10 2.2E-01 2.0E-01 8.1E-04 2.3E-01 1.5E+00 15 2.3E-01 2.0E-01 8.1E-04 2.9E-01 1.8E+00 20 2.4E-01 2.0E-01 8.1E-04 3.3E-01 2.1E+00 30 2.5E-01 2.0E-01 8.1E-04 3.8E-01 2.5E+00 40 2.5E-01 2.0E-01 8.1E-04 4.0E-01 2.8E+00 50 2.6E-01 2.0E-01 8.1E-04 4.2E-01 3.1E+00 60 2.6E-01 2.0E-01 8.1E-04 4.2E-01 3.4E+00 70 2.6E-01 2.0E-01 8.1E-04 4.3E-01 3.6E+00 80 2.6E-01 2.0E-01 8.1E-04 4.3E-01 3.8E+00 90 2.6E-01 2.0E-01 8.1E-04 4.4E-01 4.0E+00
100 2.6E-01 2.0E-01 8.1E-04 4.4E-01 4.2E+00 150 2.7E-01 2.0E-01 8.1E-04 4.6E-01 5.1E+00 200 2.7E-01 2.0E-01 8.1E-04 4.7E-01 5.8E+00 300 2.7E-01 2.0E-01 8.1E-04 4.9E-01 7.1E+00 400 2.7E-01 2.0E-01 8.1E-04 5.1E-01 8.3E+00 500 2.7E-01 2.0E-01 8.1E-04 5.2E-01 9.4E+00 600 2.7E-01 2.0E-01 8.1E-04 5.4E-01 1.1E+01 700 2.7E-01 2.0E-01 8.1E-04 5.5E-01 1.2E+01 800 2.7E-01 2.0E-01 8.1E-04 5.6E-01 1.3E+01 900 2.7E-01 2.0E-01 8.1E-04 5.8E-01 1.4E+01
1000 2.7E-01 2.0E-01 8.1E-04 5.9E-01 1.5E+01 1500 2.7E-01 2.0E-01 8.1E-04 6.5E-01 1.9E+01 2000 2.8E-01 2.0E-01 8.1E-04 7.0E-01 2.4E+01 3000 2.8E-01 2.0E-01 8.1E-04 7.7E-01 3.1E+01 4000 2.8E-01 2.0E-01 8.1E-04 8.2E-01 3.7E+01 5000 2.8E-01 2.0E-01 8.1E-04 8.6E-01 4.3E+01 6000 2.8E-01 2.0E-01 8.1E-04 8.9E-01 4.7E+01 7000 2.8E-01 2.0E-01 8.1E-04 9.0E-01 5.2E+01 8000 2.8E-01 2.0E-01 8.1E-04 9.2E-01 5.6E+01 9000 2.8E-01 2.0E-01 8.1E-04 9.2E-01 5.9E+01
10000 2.8E-01 2.0E-01 8.1E-04 9.3E-01 6.3E+01 a24-h excretion values for Day 1 after intake refer to cumulative excretion 0–24 h after intake, Day 2
to 24–48 h after intake, and so forth. Retention values for Day 1 refer to retention at 24 h after intake, for
Day 2 at 48 h, and so forth. bTotal content of thoracic compartments shown in Figure 3.1.

44
Table 3.11 Model predictions of retention and excretion of uranium (multiple of daily intake)
as a function of time after start of continuous inhalation of a moderately soluble form
(Type M, 5 μm AMAD)
Days after
start of
intakea
24-h urinary
excretion 24-h fecal
excretion Retained in
lungsb
Retained in
kidneys Retained in
total body
1 1.8E-02 2.2E-02 6.1E-02 3.6E-03 6.6E-01 2 2.4E-02 1.8E-01 1.2E-01 7.5E-03 1.0E+00 3 2.5E-02 3.1E-01 1.7E-01 1.1E-02 1.2E+00 4 2.6E-02 3.7E-01 2.3E-01 1.5E-02 1.3E+00 5 2.6E-02 3.8E-01 2.8E-01 1.8E-02 1.4E+00 6 2.7E-02 3.9E-01 3.3E-01 2.1E-02 1.4E+00 7 2.8E-02 3.9E-01 3.9E-01 2.3E-02 1.5E+00 8 2.8E-02 3.9E-01 4.4E-01 2.6E-02 1.5E+00 9 2.9E-02 3.9E-01 4.9E-01 2.8E-02 1.6E+00
10 2.9E-02 3.9E-01 5.4E-01 3.0E-02 1.7E+00 15 3.2E-02 3.9E-01 7.8E-01 4.0E-02 2.0E+00 20 3.4E-02 4.0E-01 1.0E+00 4.6E-02 2.2E+00 30 3.7E-02 4.0E-01 1.4E+00 5.5E-02 2.7E+00 40 3.9E-02 4.0E-01 1.8E+00 6.1E-02 3.1E+00 50 4.1E-02 4.0E-01 2.1E+00 6.5E-02 3.5E+00 60 4.3E-02 4.0E-01 2.4E+00 6.9E-02 3.9E+00 70 4.5E-02 4.1E-01 2.7E+00 7.2E-02 4.2E+00 80 4.6E-02 4.1E-01 2.9E+00 7.5E-02 4.5E+00 90 4.7E-02 4.1E-01 3.1E+00 7.7E-02 4.7E+00
100 4.9E-02 4.1E-01 3.3E+00 8.0E-02 5.0E+00 150 5.3E-02 4.1E-01 4.2E+00 8.9E-02 6.1E+00 200 5.7E-02 4.1E-01 4.8E+00 9.7E-02 6.9E+00 300 6.1E-02 4.1E-01 5.6E+00 1.1E-01 8.0E+00 400 6.4E-02 4.1E-01 6.1E+00 1.2E-01 8.8E+00 500 6.5E-02 4.1E-01 6.3E+00 1.2E-01 9.3E+00 600 6.6E-02 4.1E-01 6.4E+00 1.3E-01 9.7E+00 700 6.6E-02 4.1E-01 6.5E+00 1.3E-01 1.0E+01 800 6.6E-02 4.1E-01 6.6E+00 1.3E-01 1.0E+01 900 6.7E-02 4.1E-01 6.6E+00 1.4E-01 1.1E+01
1000 6.7E-02 4.1E-01 6.6E+00 1.4E-01 1.1E+01 1500 6.7E-02 4.1E-01 6.6E+00 1.6E-01 1.2E+01 2000 6.7E-02 4.1E-01 6.6E+00 1.7E-01 1.3E+01 3000 6.8E-02 4.1E-01 6.6E+00 1.9E-01 1.5E+01 4000 6.8E-02 4.1E-01 6.6E+00 2.0E-01 1.7E+01 5000 6.8E-02 4.1E-01 6.6E+00 2.1E-01 1.8E+01 6000 6.8E-02 4.1E-01 6.6E+00 2.2E-01 1.9E+01 7000 6.8E-02 4.1E-01 6.6E+00 2.2E-01 2.0E+01 8000 6.8E-02 4.1E-01 6.6E+00 2.2E-01 2.1E+01 9000 6.8E-02 4.1E-01 6.6E+00 2.3E-01 2.2E+01
10000 6.9E-02 4.1E-01 6.6E+00 2.3E-01 2.3E+01 a24-h excretion values at 1 d refer to cumulative excretion 0–24 h after start of intake, at 2 d to 24–48 h
after start of intake, and so forth. Retention values at 1 d refer to retention at 24 h after start of intake, at 2
d to 48 h after start of intake, and so forth. bTotal content of thoracic compartments shown in Figure 3.1.

45
Table 3.12 Model predictions of retention and excretion of uranium (multiple of daily intake)
as a function of time after start of continuous inhalation of a relatively insoluble form
(Type S, 5 μm AMAD)
Days after
start of
intakea
24-h
urinary
excretion
24-h fecal
excretion Retained in
lungsb
Retained in
kidneys Retained in
total body
1 4.7E-04 2.3E-02 6.8E-02 9.7E-05 6.7E-01 2 7.3E-04 1.9E-01 1.3E-01 2.2E-04 1.0E+00 3 7.7E-04 3.4E-01 1.9E-01 3.3E-04 1.2E+00 4 8.0E-04 4.0E-01 2.6E-01 4.4E-04 1.3E+00 5 8.2E-04 4.1E-01 3.2E-01 5.4E-04 1.4E+00 6 8.4E-04 4.2E-01 3.8E-01 6.3E-04 1.4E+00 7 8.6E-04 4.2E-01 4.4E-01 7.2E-04 1.5E+00 8 8.8E-04 4.2E-01 5.0E-01 8.0E-04 1.6E+00 9 8.9E-04 4.2E-01 5.5E-01 8.6E-04 1.6E+00
10 9.0E-04 4.2E-01 6.1E-01 9.3E-04 1.7E+00 15 9.8E-04 4.2E-01 9.0E-01 1.2E-03 2.0E+00 20 1.0E-03 4.3E-01 1.2E+00 1.4E-03 2.2E+00 30 1.1E-03 4.3E-01 1.7E+00 1.7E-03 2.8E+00 40 1.2E-03 4.3E-01 2.2E+00 1.8E-03 3.3E+00 50 1.3E-03 4.4E-01 2.6E+00 2.0E-03 3.7E+00 60 1.3E-03 4.4E-01 3.0E+00 2.1E-03 4.2E+00 70 1.4E-03 4.4E-01 3.4E+00 2.2E-03 4.6E+00 80 1.4E-03 4.4E-01 3.8E+00 2.3E-03 5.0E+00 90 1.4E-03 4.4E-01 4.2E+00 2.3E-03 5.4E+00
100 1.5E-03 4.4E-01 4.6E+00 2.4E-03 5.7E+00 150 1.7E-03 4.5E-01 6.3E+00 2.8E-03 7.5E+00 200 1.8E-03 4.5E-01 7.9E+00 3.1E-03 9.1E+00 300 2.1E-03 4.5E-01 1.1E+01 3.7E-03 1.2E+01 400 2.4E-03 4.5E-01 1.4E+01 4.3E-03 1.5E+01 500 2.6E-03 4.5E-01 1.6E+01 4.8E-03 1.7E+01 600 2.9E-03 4.6E-01 1.8E+01 5.4E-03 2.0E+01 700 3.1E-03 4.6E-01 2.0E+01 5.9E-03 2.2E+01 800 3.3E-03 4.6E-01 2.2E+01 6.3E-03 2.4E+01 900 3.4E-03 4.6E-01 2.4E+01 6.8E-03 2.5E+01
1000 3.6E-03 4.6E-01 2.6E+01 7.2E-03 2.7E+01 1500 4.2E-03 4.7E-01 3.2E+01 9.2E-03 3.3E+01 2000 4.7E-03 4.7E-01 3.6E+01 1.1E-02 3.8E+01 3000 5.3E-03 4.7E-01 4.2E+01 1.4E-02 4.4E+01 4000 5.6E-03 4.7E-01 4.5E+01 1.6E-02 4.8E+01 5000 5.9E-03 4.7E-01 4.8E+01 1.7E-02 5.0E+01 6000 6.1E-03 4.7E-01 5.0E+01 1.8E-02 5.3E+01 7000 6.3E-03 4.7E-01 5.1E+01 1.9E-02 5.5E+01 8000 6.5E-03 4.7E-01 5.3E+01 2.0E-02 5.6E+01 9000 6.6E-03 4.7E-01 5.4E+01 2.1E-02 5.8E+01
10000 6.7E-03 4.7E-01 5.5E+01 2.2E-02 5.9E+01 a24-h excretion values at 1 d refer to cumulative excretion 0-24 h after start of intake, at 2 d to 24-48
h after start of intake, and so forth. Retention values at 1 d refer to retention at 24 h after start of intake,
at 2 d to 48 h after start of intake, and so forth. bTotal content of thoracic compartments shown in Figure 3.1.

46
Figure 3.9 Model predictions of the time-dependent
concentration of uranium in the kidneys, assuming either acute input
of 1 μg to blood at time zero or continuous input to blood at the rate
1 μg/d.
Figure 3.10 Model predictions of the concentration of uranium
in the kidneys as a function of time after acute inhalation of 1 μg of
uranium of Type F, Type M, or Type S (5 μm AMAD).

47
Figure 3.11 Model predictions of the concentration of uranium
in the kidneys as a function of time after start of continuous
inhalation of uranium of Type F, Type M, or Type S (5 μm AMAD)
at the rate 1 μg/d.
Model predictions of the concentration ratio R of uranium in kidneys (μg U/g kidney) to uranium
in urine (μg U/mL urine) are listed in Table 3.13 for acute inhalation of uranium; predictions are
shown graphically in Figure 3.12. The ratio R is higher for Type F than for Type M or Type S,
which differ only slightly from one another.

48
Table 3.13 Model predictions of kidney to urine concentration
ratio as a function of time following acute inhalationb
of uranium by a worker
(particle size = 5 μm AMAD)
Time after
exposurea
(d)
Concentration ratio Kidney U (μg/g) : Urinary U (μg/mL)
Type Fb Type M Type S
1 16 10 5.7 2 28 22 22 3 29 22 23 4 29 22 23 5 29 22 23 6 30 22 23 7 30 22 23 8 30 21 22 9 30 21 22
10 30 21 22 15 29 19 20 20 28 17 17 30 24 14 14 40 20 12 12 50 17 11 11 60 16 10 10 70 16 10 10 80 17 10 10 90 18 10 10
100 C 10 10 110 C 11 10 120 C 11 10 130 C 11 10 140 C 11 10 150 C 11 10 175 C 12 10 200 C 12 10 225 C 13 10 250 C 13 11 275 C 14 11 300 C 15 11 325 C 16 11 365 C 18 11
aDay 1 refers to ratio at 24 h after exposure, Day 2 at 48 h after
exposure, and so forth. bRatios for Type F are applicable to intravenous injection of
uranium and, for Day 2 and beyond, to ingestion of uranium. cProjected ratios for acute intake of soluble material may involve
large errors beyond 3 mo after intake because urine levels would
have declined by several orders of magnitude by this time.

49
Figure 3.12 Model predictions of the concentration ratio of
uranium in kidneys (μg/g) to uranium in urine (μg/mL) as a function
of time after acute inhalation of uranium (particle size 5 μm AMAD).
Model predictions of the concentration ratio R of uranium in kidneys to uranium in urine are
listed in Table 3.14 for continuous intake of uranium; predictions are shown graphically in
Figure 3.13. For all practical purposes the same curve may be applied to inhalation of any of the
default absorption types, ingestion, or direct input into blood, provided the intake rate remains
constant.

50
Table 3.14 Model predictions of kidney to urine concentration
ratio as a function of time after the start of continuous
intake of uranium at a constant rate by inhalation,
ingestion, or direct input into blood
Time after
exposurea
(d)
Concentration ratiob
Kidney U (μg/g) : Urinary U
(μg/mL)
1 0.8 2 1.6 3 2.3 4 2.9 5 3.5 6 4.0 7 4.4 8 4.8 9 5.2
10 5.5 15 6.6 20 7.2 30 7.9 40 8.2 50 8.4 70 8.5
100 8.6 200 9.0 300 9.3 400 9.6 500 9.9 700 10
1000 11 2000 13 3000 14 4000 15 5000 16 7000 17
10000 17 aDay 1 refers to ratio at 24 h after start of exposure,
Day 2 at 48 h after start of exposure, and so forth. bValues derived for inhalation of relatively soluble
(Type F) material but model estimates are not sensitive
to absorption type or mode of intake provided rate of
uptake to blood remains nearly constant.

51
Figure 3.13 Model predictions of the concentration ratio of uranium in
kidneys (μg/g) to uranium in urine (μg/mL) as a function of duration of
continuous inhalation of uranium at a constant rate. The curve applies to any
absorption type (particle size 5 μm AMAD).
3.5 Estimates of Effective Dose Per Unit Intake of Natural Uranium Isotopes
Determination of compliance with radiation reference guidance levels for uranium requires
application of effective dose coefficients for each of the major uranium isotopes. Effective dose
coefficients for 234
U, 235
U, and 238
U are given in Table 3.15 for the case of intravenous injection
and in Table 3.16 for inhalation of relatively soluble (Type F), moderately soluble (Type M), or
relatively insoluble (Type S) forms of uranium. For the inhalation cases the assumed particle
size is 5 μm AMAD. The effective dose coefficients for intravenous injection might be applied,
for example, to the case of a puncture wound contaminated with a relatively soluble form of
uranium.
The dose coefficients listed in Tables 3.15 and 3.16 were initially derived in terms of dose per
unit activity (Sv/Bq). Conversion to dose per unit mass was based on the specific activities of 234
U, 235
U, and 238
U listed in Table 3.17. Coefficients given in terms of dose per unit mass may
be used to compare derived reference guidance for exposure to uranium based on radiological
reference guidance to reference guidance based on uranium as a chemical hazard.

52
Table 3.15 Effective dose coefficients for
intravenously injected U isotopes
U isotope Effective dose coefficient
Sv/Bq Sv/g 234
U 2.3 × 10⁻⁶
5.3 × 10²
235U 2.1 × 10
-6 1.7 × 10⁻¹
238U 2.1 × 10
-6 2.6 × 10⁻²
Table 3.16 Effective dose coefficients for
inhalation of uranium isotopes of
Type F, M, or S (5 μm AMAD)
Type U isotope E (Sv/Bq) E (Sv/g U)
F 234U 6.4 × 10
-7 1.5 × 10²
235
U 6.0 × 10⁻⁷ 4.8 × 10
-2
238
U 5.8 × 10⁻⁷ 7.3 × 10
-3
M 234U 2.1 × 10
-6 4.9 × 10²
235
U 1.8 × 10⁻⁶ 1.4 × 10
-1
238
U 1.6 × 10⁻⁶ 2.0 × 10
-2
S 234U 6.8 × 10
-6 1.6 × 10³
235
U 6.1 × 10⁻⁶ 4.9 × 10
-1
238
U 5.7 × 10⁻⁶ 7.1 × 10
-2
Table 3.17 Specific activities of U isotopes
U isotope Specific activity
(Bq/g) 234
U 2.32 108
235U 8.01 10
4 238
U 1.25 104

53
4 VARIATION WITH TIME IN URINARY URANIUM:
A COMPLICATING FACTOR IN INTERPRETATION OF
URINE MEASUREMENTS
Uranium has a high rate of renal clearance. According to the systemic model for uranium
described in Section 3, about two-thirds of uranium atoms entering blood at time zero are
excreted in urine during the first 24 h. Because of its high rate of clearance in urine, the
concentration of uranium in a urine sample collected during work hours may be dominated by
intake occurring earlier in the day. This is illustrated by the following hypothetical chronic
exposure case involving idealized conditions designed for computational and expository
convenience. It is assumed in this example that the biokinetic models described in Section 3 are
reasonably accurate predictors of the rate of urinary excretion of inhaled uranium.
Example 4.1. A person with no previous occupational exposure to uranium begins work at a
uranium mill. The work schedule is 8 am to 4 pm, Monday through Friday. (Greater detail
such as removal from exposure during lunch and breaks would not be useful for purposes of
this illustration.) The worker is exposed daily to a moderately soluble form (Type M) of
airborne uranium of particle size 5 μm AMAD. The concentration of airborne uranium in the
work area is constant during each workday but varies from one day to the next. Weekly
intake is 55 μg over each of the first three weeks. During the fourth week the ordered daily
intakes are 20, 12, 6, 2, and 15 μg U, again giving a total intake of 55 μg for the week. The
rate of urinary excretion of uranium over a 7-day period starting at 8 am on Monday of the
fourth week, as predicted by the models in Section 3 with the daily intakes described above
as model input (assuming a constant intake rate during each 8-h work period), are shown in
Figure 4.1. The urinary excretion rate rises sharply during work hours. During the
workweek the rate of urinary excretion is influenced considerably more by exposure during
that week than by cumulative exposure over the 4-week period. A measurement of the
urinary excretion rate during work hours in the fourth week would not be a useful indicator
of the cumulative exposure over the 4-week period unless the urine sample was collected at
the start of the workday. The best sampling period with regard to minimizing the influence
of very recent exposure would be on Monday morning before the start of work, after removal
from exposure for about 64 hours.
To back-calculate intake of uranium on the basis of urinary uranium, one must start with a
known or assumed pattern of exposure. If exposures are spread out over time it usually suffices
to assume either a constant intake rate during work hours or, to simplify calculations, continuous
exposure at a constant rate during the exposure period with no allowance for time away from
work. This is illustrated by the following hypothetical one-week exposure case.

54
Figure 4.1 For the hypothetical case described in Example 4.1, model predictions of the
urinary excretion rate (rate of entry of uranium into the urinary bladder contents) during
Week 4. Urinary U during most work hours in Week 4 results primarily from same-day intake
and is only a weak reflection of cumulative intake since the start of exposure.
Example 4.2. A person with no previous occupational exposure to uranium begins work at a
uranium mill. Measured air concentrations of uranium in his work area during the first week
average 4.0 μg/m3 on Monday, 2.4 μg/m
3 on Tuesday, 1.2 μg/m
3 on Wednesday, 0.4 μg/m
3
on Thursday, and 3.0 μg/m3 on Friday. A urine sample collected the following Monday
morning before the start of work shows an excretion rate of 0.039 μg U / d when extrapolated
to a daily urine volume of 1600 mL (reference value for an adult male given in ICRP
Publication 89, 2002). A site health physicist (HP) uses the biokinetic models described in
Section 3 to back-calculate the worker’s total intake the preceding week based on the
urinalysis. The HP assumes the worker was exposed to Type M material of particle size 5
μm AMAD based on recent measurements of solubility and particle size of airborne material
in the building. The HP makes three estimates of total intake based on three different
assumptions concerning the pattern of intake:
Case (a) – The rate of intake each day was proportional to the average concentration of
uranium in air in the building that day.
Case (b) – Intake occurred at a constant rate during the 40 work hours.
Case (c) – Intake occurred at a constant rate from 8 am on Monday to 4 pm on Friday
including hours away from work (104 hours elapsed time).
Back-calculations of uranium intake are made as follows. In Case (a) it is assumed that there
was a unit intake (1 μg) on Monday. Because daily intakes are assumed to be proportional to
the average air concentration of uranium in the building, assumed intakes are 1 μg x 2.4/4.0 =
0.6 μg on Tuesday, 1 μg x 1.2/4.0 = 0.3 μg on Wednesday, 1 μg x 0.4/4.0 = 0.1 μg on
Thursday, and 1 μg x 3.0/4.0 = 0.75 μg on Friday. With these intakes as model input, the
models in Section 3 predict a urinary excretion rate of 0.00196 μg/d at 8 am on Monday
morning. Because the observed urinary excretion rate is 0.039 μg/d, the intakes used as
model input must be increased by a factor of 0.039/0.00196 = 19.90 to reproduce the
observed excretion rate. Therefore, based on the exposure pattern assumed in Case (a), the

55
estimated total intake is 19.90 x (1.0+0.6+0.3+0.1+0.75) μg = 54.7 μg. In Case (b) it is
assumed that intake was 1 μg each 8-h workday. With this intake rate used as model input,
the models predict a urinary excretion rate of 0.00363 μg/d at 8 am on Monday morning.
Because the observed urinary excretion rate is 0.039 μg/d, the intake rate used as model input
must be increased by a factor of 0.039/0.00363 = 10.74 to reproduce the observed excretion
rate. Therefore, based on the exposure pattern assumed in Case (b), the estimated intake is
10.74 x (1.0+1.0+1.0+1.0+1.0) μg = 53.7 μg. In Case (c) it is assumed that intake was 1 μg
each 24-h period. With this intake rate used as input, the models predict a urinary excretion
rate of 0.00313 μg/d at 8 am on Monday morning. Because the observed urinary excretion
rate is 0.039 μg/d, the intake rate used as model input must be increased by a factor of
0.039/0.00313 = 12.46 to reproduce the observed excretion rate. Therefore, based on the
exposure pattern assumed in Case (c), the estimated intake is 12.46 x (104 h x 1 μg/24 h) =
54.0 μg. The results of the analysis, including the predicted concentration of uranium in the
kidneys at 8 am on Monday morning, are summarized in Table 4.1. The three different
patterns of assumed intake yield essentially the same estimates of total intake (and hence
effective dose) and kidney concentration of uranium. In this example, the estimate of total
intake of uranium for the week and the concentration of uranium in the kidney are insensitive
to the assumed temporal pattern of intake during the week, provided urinary uranium is
measured after the rapidly excreted portion of the uranium intake has been eliminated.
Table 4.1 Model predictions of total uranium intake based on
urinary uranium measurement after weekend and alternate
assumed patterns of exposure (see Example 4.2)
Assumed exposure pattern Estimated
total intake
(μg U)
Model prediction of kidney U
concentration at time of urine
measurement
(μg U / g kidney) Proportional to average concentration of
uranium in air in building 54.7 0.00054
Constant intake rate during work hours
53.7
0.00054
Constant, continuous intake
(including non-work hours)
Monday, 8 am – Friday, 4 pm
54.0
0.00054
The following examples are based on the idealized situation in which the concentration of
uranium in air in the workplace is constant and the worker is exposed to the contaminated
atmosphere for 8 hours a day, five days a week.
The strong dependence of the measured concentration of uranium in urine on the time of
measurement is illustrated in Figures 4.2-4.4 for different forms of inhaled uranium. Also shown
in these figures is the projected change in the concentration of uranium in the kidneys over the
same period of exposure. Model predictions are for inhalation of uranium of Type F (Figure
4.2), Type M (Figure 4.3), or Type S (Figure 4.4) with a particle size of 5 μm AMAD. Model

56
predictions are based on an assumed total weekly intake of 1 mg U starting about 2 mo
(precisely, 9 full weeks or 63 days) before the first time shown. Two different patterns of
exposure are addressed in each of these figures: continuous inhalation at a constant rate (dashed
curves); and intake at a constant rate during work hours of 8 am to 4 pm, Monday through Friday
(solid curves). Compared with the urinary excretion rate based on continuous intake, the rate
based on intake during work hours only is about 3 times higher at the end of a work shift and
one-fourth to one-third times as high at the beginning of the next work shift. According to the
model, the concentration of uranium in the kidneys changes relatively slowly with time, and the
concentration resulting from intermittent intake can be approximated reasonably well as a
continuous exposure based on the same weekly intake.
Figure 4.2 For inhalation of a relatively soluble form of uranium (Type F, 5 μm AMAD;
intake = 1 mg/wk), projected urinary excretion rate (top panel) and concentration of uranium in
kidneys (bottom panel) for different patterns of exposure: continuous intake at a constant rate
(dashed curve) or inhalation at a constant rate during regular work hours (solid curve). It is
assumed that exposure began 9 wk before earliest time shown.

57
Figure 4.3 For inhalation of a moderately soluble form of uranium (Type M, 5 μm AMAD;
intake = 1 mg/wk), projected urinary excretion rate (top panel) and concentration of uranium in
kidneys (bottom panel) for different patterns of exposure: continuous intake at a constant rate
(dashed curve) or inhalation at a constant rate during regular work hours (solid curve). It is
assumed that exposure began 9 wk before earliest time shown.

58
Figure 4.4 For inhalation of a relatively insoluble form of uranium (Type S, 5 μm AMAD;
intake = 1 mg/wk), projected urinary excretion rate (top panel) and concentration of uranium in
kidneys (bottom panel) for different patterns of exposure: continuous intake at a constant rate
(dashed curve) or inhalation at a constant rate during regular work hours (solid curve). It is
assumed that exposure began 9 wk before earliest time shown.
As illustrated in Figure 4.5, rapid increases and declines in the urinary excretion rate of uranium
due to discontinuities in exposure is expected to occur even after exposure to uranium for several
years. As in Figures 4.2-4.4, two different patterns of exposure are addressed in Figure 4.5:
continuous inhalation at a constant rate (dashed curves); and intake at a constant rate during
work hours of 8 am to 4 pm, Monday through Friday (solid curves). Again, weekly intake of
uranium is assumed to be 1 mg, but in this case the exposure is assumed to have started five
years before the times depicted in the figure. After this length of time the contribution of
recently absorbed uranium to urinary uranium has declined slightly due to buildup of uranium in
skeleton and other tissues and release from these tissues to blood; however, recently absorbed

59
uranium still represents a substantial portion of the total excreted in urine, particularly for Type F
material.
Figure 4.5 For inhalation of a relatively soluble (Type F, top panel) or moderately soluble
(Type M, bottom panel) form of uranium (5 μm AMAD, intake = 1 mg/wk), projected urinary
excretion rate for different patterns of exposure: continuous intake at a constant rate (dashed
curve) or inhalation at a constant rate during regular work hours (solid curve). It is assumed that
exposure began 5 y earlier.
To summarize, a major portion of uranium entering blood at time zero is excreted in urine within
the next 24 h. As a result, a urine sample collected during or soon after work hours may not
provide a useful measure of exposure over the period since the previous urine measurement. In
the design of a monitoring program for uranium, the potentially rapid variation in urinary
uranium should be taken into account, and a method of urine sampling should be developed with
the goal of determining, or at least not underestimating, the average rate of urinary excretion of
uranium in each chronically exposed worker. The most efficient or feasible method of meeting
this goal may vary from one site to another. A method that may be workable in most cases

60
involves collection of a spot sample 48–72 hours after the last potentially elevated exposure to
uranium (e.g., upon return to work after a weekend) after potentially large variations in the rate
of urinary excretion of uranium have subsided. Due to variation in the rate of urinary excretion
of uranium over any 24-h period, the uranium content of a spot sample should be converted to an
estimate of 24-h excretion rate of uranium as described in Section A.2 of Appendix A. Also, it
should be taken into account that 24-h urinary excretion of urine determined a few days after
exposure may underestimate the average concentration in urine. Ideally, the extent of
underestimate, if any, would be checked from time to time (perhaps quarterly) by making
extensive measurements during a one-week period and comparing the derived average rate of
excretion of uranium based on the collective samples with an estimate based on a spot sample
collected the next Monday morning. If this type of occasional check on results from spot
samples is not feasible at a given site, adjustments to measured concentrations of uranium in
urine after removal from exposure for 48–72 h could be based on model predictions such as
those shown in Figures 4.2-4.5. Model predictions described in this section indicate that if the
concentration of uranium in air in the work place were constant over an extended period, then the
concentration of uranium in a Monday morning urine sample would be roughly a factor of 3.5
below the average based on 168 hours of continuous exposure for inhalation of uranium as
Type F material and roughly a factor of 2 below the average for inhalation of uranium as Type M
or Type S material.
The above considerations apply to chronic rather than acute exposures. After an acute exposure
the urinary uranium concentrations are expected to change in a somewhat smoother (although
not perfectly smooth) pattern than suggested in Figures 4.1-4.5 for chronic occupational intakes.
This is illustrated in Figure 4.6, which shows the pattern of decline of urinary uranium in a
worker acutely exposed to uranium as an oxide (actual case study).
Figure 4.6 Sequential measurements of urinary uranium in a worker
acutely exposed to uranium as an oxide.

61
5 DERIVATION OF INVESTIGATION AND
IMMEDIATE ACTION LEVELS
5.1 Objective
The investigation and immediate action levels given in Table 1.1 are expressed in terms of the
uranium concentration in the kidneys and the annual effective dose, which are not measurable
quantities. The present section gives investigation levels and immediate action levels in terms of
measurable quantities. Derivations of action values are explained in sufficient detail to allow
calculation of site-specific values when warranted.
5.2 Models and Assumptions Used in the Derivations
It is not known whether there are significant differences with gender in the biokinetics of
uranium, dose per unit exposure to airborne uranium, or concentration of uranium in the kidneys
per unit exposure. Some components of the models used to calculate dose or tissue
concentration per unit intake of uranium apparently depend on gender, but these factors tend to
offset one another in calculations of dose or tissue concentration per unit exposure to airborne
uranium. For example, the average adult female might receive a higher effective dose per unit
intake of uranium than the average adult male due to gender differences in organ masses, but in
terms of effective dose per unit exposure to airborne uranium this difference would be offset by
gender differences in air intake rates. Similarly, it might be that the concentration of uranium in
the kidneys builds to a higher level on average in adult females than adult males following
inhalation of a unit mass of uranium due to gender differences in kidney mass, but the kidney
concentration per unit exposure may not be strongly gender dependent due to offsetting gender
differences in the air intake rate.
The action levels derived in this report are based on characteristics of a reference adult male as
defined in ICRP Publication 89 (2002). Derivations of action levels involving the rate of intake
of airborne uranium are based on a breathing rate of 1.2 m3 h
-1. Derivations involving chronic
exposure to airborne uranium in the workplace are based on exposure to a fixed concentration of
uranium in air for 2000 h y-1
, giving an annual air intake 2400 m3. The volume of urine excreted
daily is assumed to be 1.6 L and the mass of feces excreted daily is assumed to be 150 g, based
on reference values for an adult male given in ICRP Publication 89 (2002b). The assumed
particle size of airborne uranium is 5 μm AMAD, the default value for occupational intake
recommended in ICRP Publication 68 (1994b). The models summarized in Section 3 or, where
applicable, the tables of model predictions in Section 3 are used to convert the primary chemical
and radiological guidance levels to measurable quantities.
The isotopic mixtures of uranium considered in this section are depleted, natural, and enriched
uranium with different levels of 235
U enrichment. Natural uranium is assumed to contain
0.0057% 234
U, 0.72% 235
U, and 99.2743% 238
U by mass, corresponding to 50.45% 234
U, 2.20% 235
U, and 47.35% 238
U by activity based on specific activities of 234
U, 235
U, and 238
U given in
Table 3.17. Depleted uranium is assumed to contain 0.0005% 234
U, 0.25% 235
U, and 99.7495% 238
U by mass, corresponding to 8.39% 234
U, 1.45% 235
U, and 90.16% 238
U by activity based on

62
specific activities of these isotopes given in Table 3.17. The 234
U content of enriched uranium is
assumed to be related to the 235
U content by the equation:
%
234U = 0.0015 + 0.0058E + 0.000054E
2 Eq. 5. 1
where, E = %235
U by mass. Equation 5.1 is a curve fit to measurements of 234
U in uranium
enriched by the gaseous diffusion technique. The equation is reasonably consistent with limited
data on the 234
U content of uranium enriched by the gas centrifuge method (Bush et al. 2001).
Equation 5.1 can be used together with the specific activities of 234
U, 235
U, and 238
U given in
Table 3.17 to derive the following expression for the specific activity, SpA, of depleted, natural,
or enriched uranium:
Eq. 5. 2
The factor 0.43 +0.38E + 0.0034E2 in Equation 5.2 represents the specific activity in units of
μCi/g (units traditionally used in the United States), and the factor 3.7 × 10⁴ is used to convert
from μCi/g to Bq/g. The factor 0.43 + 0.38E + 0.0034E2 is nearly identical to the expression for
the specific activity of enriched uranium given in Appendix B to 10CRF20: 0.4 +0.38E +
0.0034E2 μCi/g.
Derivations of action levels for acute exposure, defined as an exposure occurring within an 8-h
workday, are based on the assumption of instantaneous intake of uranium. Derivations for
exposure periods between one day and one month (typically about 22 workdays) are based on an
intermittent exposure pattern approximating potential exposure times during a workweek. For
example, action levels for the average concentration of uranium in air for a 40-h workweek are
based on the assumption of continuous intake of uranium at a constant rate from 8 am to 4 pm
each workday for five consecutive days, with no lunch break or other breaks. Calculations for
chronic exposures over periods greater than one month are based on the assumption of
continuous intake 24 hours a day and 7 days each week at a rate that produces the intended total
intake per workweek. For example, if it is assumed that total intake during each 8-h workday is
1 μg, then the weekly intake would be 5 workdays/wk × 1 μg/workday = 5 μg/wk, and the intake
rate based on the computationally convenient assumption of continuous exposure would be:
(5 μg/wk) / (7 d/wk) = 0.714 μg/d.
5.3 Action Levels Based on Air Monitoring
This section provides information on action levels for the case of exposure to an unknown form
of airborne uranium (“worst case”) and for cases where some information is known on the
absorption type or the isotopic composition (e.g., percent 235
U enrichment) or both.

63
5.3.1 Action Levels for the Concentration of Airborne Uranium if the Form of
Uranium is Not Known
In many cases of exposure to airborne uranium the form of inhaled uranium is not known with
much certainty. Secondary reference guidance levels for such cases are set to: (1) prevent
nephrotoxicity assuming a worst-case situation with regard to the solubility of the airborne
material [i.e., 100% of airborne uranium is assumed to be relatively soluble (Type F)]; and (2)
limit radiogenic cancer risk assuming a worst-case situation for radiological toxicity with regard
to the solubility of airborne uranium [i.e., 100% of airborne uranium is assumed to be 234
U in
relatively insoluble form (Type S)]. Effective dose coefficients for 234
U are applied as a cautious
measure in that the isotopic ratio of uranium often is not known with much certainty, and
coefficients for 234
U are slightly higher than coefficients for 235
U or 238
U (Table 3.16). If
information is sufficient to narrow the range of plausible forms of uranium, the secondary
reference guidance levels provided below could be modified by applying the same methods to
the narrower range of plausible situations.
The peak concentration of uranium in the kidneys resulting from intake of a given mass of
uranium depends on the length of the exposure period. Thus, action levels designed to avoid
chemical toxicity are provided here for relatively short, intermediate, and relatively long
exposure periods.
The estimated committed effective dose from annual intake of a given activity of uranium is
independent of the pattern of intake during the year, but it is important to bound intake of activity
in any given part of the year to avoid having to impose stringent action levels during other parts
of the year. Hence, action levels designed to limit radiation effects are also provided here for
short, intermediate, and long exposure periods.
The biokinetic models described in Section 3 predict that inhalation of air with a mass
concentration of 1 μg U/m3 over a single 40-h work week results in a predicted peak kidney
concentration of 0.0044 μg U/g kidney, based on Type F material of particle size 5 μm AMAD.
Investigation and immediate action levels for avoidance of chemical toxicity are based on peak
kidney concentrations of 0.3 and 1.0 μg U/g kidney, respectively (Table 1.1). The investigation
level for the average concentration of uranium in air over a 40-h workweek is calculated as
follows:
1 μg U/m3 x (0.3 μg U/g)/ (0.0044 μg U/g) = 68 μg U/m
3.
The immediate action level is calculated as follows:
1 μg U/m3 x (1.0 μg U/g)/ 0.0044 μg U/g = 227 μg U/m
3.
This derived immediate action level is conservatively rounded down to 200 μg U/m3. For
consistency between different action levels, the immediate action level of 68 μg U/m3 derived
above is rounded down to 60 μg U/m3 (i.e., 0.3 times the rounded immediate action level).

64
Inhalation of air with a concentration of 1 μg U/m3 over two consecutive workweeks results in a
predicted peak kidney concentration of about 0.0068 μg U/g kidney. The investigation level
based on this concentration is calculated as follows:
1 μg U/m3 x (0.3 μg U/g)/ 0.0068 μg U/g = 44 μg U/m
3.
The immediate action level is calculated as follows:
1 μg U/m3 x (1.0 μg U/g)/ 0.0068 μg U/g = 147 μg U/m
3.
These investigation and immediate action levels are rounded to 45 and 150 μg U/m3,
respectively.
Inhalation of air with a concentration of 1 μg U/m3 over one month (22 workdays) results in a
predicted peak kidney concentration of about 0.009 μg U/g kidney. The investigation level
based on this concentration is calculated as follows:
1 μg U/m3 x (0.3 μg U/g)/ 0.009 μg U/g = 33 μg U/m
3.
The immediate action level is calculated as follows:
1 μg U/m3 x (1.0 μg U/g)/ 0.009 μg U/g = 111 μg U/m
3.
These investigation and immediate action levels are rounded to 30 and 100 μg U/m3,
respectively.
For avoidance of chemical toxicity, action levels for long-term average concentrations of
uranium in air, defined as averages over 3 mo or longer, are based on predicted equilibrium
concentrations of uranium in the kidneys occurring for long-term continuous exposure to
airborne uranium at a constant rate. As indicated in Section 3, daily inhalation of 1 μg of Type F
uranium of particle size 5 μm AMAD for an extended period is predicted to result in an
equilibrium concentration of 0.003 μg U/g kidney. The intake rate that would result in an
equilibrium concentration of 0.3 μg U/g kidney, the investigation level, is calculated as follows:
(0.3/0.003) μg U/d = 100 μg U/d = 36,500 μg U/y.
The mass concentration of Type F uranium in air in the workplace corresponding to this intake
rate is calculated as follows:
36,500 μg/y / [(2000 h/y) ∙ (1.2 m3/h)] = 15 μg/m
3.
The fixed mass concentration of Type F material in air that would result in an equilibrium
concentration of 1.0 μg U / g kidney (an immediate action level) is calculated as follows:
(1.0/0.3) × 15 μg/m3 = 50 μg/m
3.

65
Action levels for limitation of radiation effects are based on the assumption that airborne
uranium is in relatively insoluble form (Type S). The committed effective dose coefficient for
inhalation of 234
U of Type S (5 μm AMAD) is 6.8 x 10⁻⁶
Sv/Bq. The annual intake of 234
U of
Type S corresponding to an effective dose of 0.02 Sv (investigation level) is calculated as
follows:
0.02 Sv / 6.8 × 10⁻⁶
Sv/Bq = 2940 Bq.
The fixed activity concentration of 234
U in air based on this intake over one year of occupational
exposure is calculated as follows:
2940 Bq/y / [(2000 h/y) ∙ (1.2 m3/h)] = 1.2 Bq/m
3.
The fixed activity concentration of 234
U in air corresponding to an annual effective dose of
0.05 Sv (immediate action level) is calculated as follows:
(0.05 Sv / 0.02 Sv) x 1.2 Bq/m3 = 3.0 Bq/m
3.
The action levels derived above for an unknown form of airborne uranium are summarized in
Table 5.1. For consistency with action levels based on mass concentration, the activity
concentrations applied to long-term exposure is increased by factors of 2, 3, and 4 for application
to exposures over 1 mo, 2 wk, and 1 wk, respectively.
For example, if the mass concentration of uranium in air averaged over 3 mo does not exceed
15 μg /m3 and the average activity concentration over that time does not exceed 1.2 Bq/m
3,
uranium confinement is considered to be adequate and no action is required. If the average mass
concentration in air exceeds 15 μg /m3 but does not exceed 50 μg /m
3, or the average activity
concentration in air exceeds 1.2 Bq/m3 but does not exceed 3.0 Bq/m
3, an investigation level has
been reached and the investigative procedures listed in Table 1.1 should be performed. If the
average mass concentration in air exceeds 50 μg /m3 or the average activity concentration in air
exceeds 3.0 Bq/m3, an immediate action level has been reached and the immediate actions listed
in Table 1.1 should be performed.
For depleted uranium, natural uranium, or slightly enriched uranium, the mass concentrations
given in Table 5.1 are more restrictive than the corresponding activity concentrations. With
regard to the investigation level, the activity concentration 1.2 Bq/m3 is more restrictive than the
mass concentration 15 μg/m3
for 235
U enrichment levels greater than 4.5%. With regard to the
immediate action level, the activity concentration 3 Bq/m3 is more restrictive than the mass
concentration 50 μg/m3 for
235U enrichment levels greater than 3%.

66
Table 5.1 Investigation and immediate action levels of uranium in air for
application to cases in which the form of uranium is not known
Level Mass
concentration (μg/m
3)
Activity
concentration (Bq/m
3)
Investigation level
a Average over a 40-h workweek Average over 2 consecutive 40-h workweeks Average over a month (22 workdays) Average over 3 mo
60 45 30 15
4.8
b 3.6
b 2.4
b 1.2
Immediate action level
a
Average over a 40-h workweek Average over 2 consecutive 40-h workweeks Average over a month (22 workdays) Average over 3 mo
200 150 100 50
12
b 9.0
b 6.0
b 3.0
aThe more restrictive of two values, the mass concentration and activity concentration, is
applied. bFor consistency with action levels based on mass concentration, the activity concentration
applied to long-term exposure is increased by factors of 2, 3, and 4 for application to
exposures over 1 mo, 2 wk, and 1 wk, respectively.
The action levels listed in Table 5.1 have implications regarding action levels for shorter
exposure periods. For example, an 8-h average air concentration exceeding 1 mg U/m3
indicates
that immediate action is needed because the average over a 40-h workweek would exceed
200 μg U/m3 regardless of the air concentration during the remainder of the week. Similarly, an
average air concentration of 23 μg U/m3 for two consecutive months indicates that immediate
action is needed because the average over 3 mo would exceed 15 μg U/m3 regardless of the air
concentration during the third month.
5.3.2 Action Levels for the Concentration of Uranium in Air for Reasonably Well
Characterized Forms of Uranium
If airborne uranium is reasonably well characterized with regard both to solubility and isotopic
mixture, higher action levels than those given in Table 5.1 may apply. In the following
hypothetical example, action levels for the air concentration of uranium averaged over a 1-y
period are recalculated on the basis of known characteristics of the airborne material.
Example 5.1. Suppose airborne uranium is known to be depleted uranium with solubility
properties consistent with Type M material, and the particle size is determined to be about
5 μm AMAD. As indicated in Section 3, the equilibrium concentration of uranium in the
kidneys based on continuous inhalation at the rate 1 μg U/d is 0.00075 μg U/g kidney for
Type M material (5 μm AMAD). The annual intake eventually leading to the limiting
concentration of 0.3 μg U/g kidney is calculated as:
(365 d x 1 μg U / d x 0.3 μg U / g kidney) / 0.00075 μg U /g kidney = 146,000 μg U.

67
The concentration of uranium in air corresponding to this intake, and hence to an equilibrium
concentration of 0.3 μg U /g kidney, is derived by dividing 146,000 μg by the reference value
for occupational intake of air in a year:
146,000 μg / 2400 m3 = 61 μg/m
3.
Thus, the chemically based investigation level for this known form of airborne uranium is
about four times greater than the chemically based investigation level for airborne uranium of
unknown form (Table 5.1).
The radiologically based investigation level in terms of mass concentration of airborne
depleted uranium of Type M and particle size 5 μm AMAD is calculated as:
[(0.02 Sv / E) / 2400 m3] / SpA(DU),
where E is the effective dose coefficient for depleted uranium with the reference isotopic
composition given in Section 5.2 and SpA(DU) is the specific activity of that isotopic
mixture.
The value E is derived as a linear combination of the effective dose coefficients given in
Table 3.16 for 234
U (2.1 x 10⁻⁶
Sv/Bq), 235
U (1.8 x 10⁻⁶
Sv/Bq), and 238
U (1.6 x 10⁻⁶
Sv/Bq) of
Type M and particle size 5 μm AMAD:
E = 0.0839 x (2.1 x 10-6
Sv/Bq) + 0.0145 x (1.8 × 10
-6 Sv/Bq)
+ 0.9016 x (1.6 x 10-6
Sv/Bq) = 1.645 x 10⁻⁶
Sv/Bq,
where, 0.0839, 0.0145, and 0.9016 are reference fractions of total activity in depleted
uranium represented by 234
U, 235
U, and 238
U, respectively (Section 5.2). Thus, the
radiologically based investigation level for the air concentration of this form of uranium is
[0.02 Sv / 1.645 x 10⁻⁶
Sv/Bq] / 2400 m3 = 5.065 Bq/m
3.
This investigation level is about four times greater than the radiologically based investigation
level for airborne uranium of unknown form (Table 5.1).
Based on the reference composition of depleted uranium given in Section 5.2, the specific
activity SpA(DU) of depleted uranium is 1.383 x 10⁴ Bq/g. Therefore, the radiologically
based investigation level of 5.065 Bq/m3 derived above is equivalent to
5.065 Bq/m3 / 1.383 x 10
4 Bq/g = 0.000366 g/m
3 = 366 μg/m
3.
Thus, the chemically based investigation level of 61 μg/m3 derived earlier is more restrictive
than the radiologically based value for airborne depleted uranium of Type M and particle size
5 μm AMAD.

68
The methods used in the above example to derive a radiologically based action level for depleted
uranium of known solubility and particle size can be generalized to any form of airborne
uranium of known solubility, isotopic composition, and particle size. The following equation
can be used to derive a radiologically based investigation level R in units of μg U/m3 and hence
directly comparable with chemically based levels:
Eq. 5. 3
where,
0.02 Sv is the primary reference guidance level for radiologically based investigation levels;
F4, F5, and F8 are mass fractions of 234
U, 235
U, and 238
U, respectively, in the material;
E4, E5, and E8 are effective dose coefficients (Sv/Bq) for 234
U, 235
U, and 238
U, respectively,
each derived on the basis of the solubility and particle size distribution of the material;
S4 = specific activity of 234
U = 2.32 x 10⁸ Bq/g;
S5 = specific activity of 235
U = 8.01 x 10⁴ Bq/g;
S8 = specific activity of 238
U = 1.25 x 10⁴ Bq/g; and
2400 m3 is a reference value for annual intake of air during work hours.
Equation 5.3 was used to calculate radiologically based investigation levels for airborne uranium
(averages over a 1-y period) in units of μg U /m3, for depleted uranium, natural uranium, or
235U
enriched uranium of Type F, Type M, or Type S. The default particle size 5 μm AMAD was
applied. Effective dose coefficients E4, E5, and E8 for these absorption types were taken from
Table 3.16. Results of the analysis are summarized and compared with chemically based
investigation levels in Figure 5.1 and Table 5.2. The chemically based investigation levels are
derived from the equilibrium concentrations of uranium in the kidneys indicated in Section 3 for
continuous inhalation of uranium at the constant rate of 1 μg/d:
0.003 μg U /g kidney for Type F;
0.00075 μg U /g kidney for Type M;
0.000078 μg U /g kidney for Type S.
The method of calculation of the chemically based investigation levels was described earlier.
The labels Rad X and Chem X, where X represents absorption type F, M, or S, in Figure 5.1
refer to radiologically (Rad) and chemically (Chem) based limits, respectively, for inhalation of
uranium of Type X. The investigation level for Type X and a given isotopic composition is
determined by the lower of the curves Chem X and Rad X at their points of intersection with a
vertical line drawn through the 235
U content on the horizontal axis. If the percentage of 235
U by
weight is known, but the solubility of the material is unknown, the lower of the curves Chem F
and Rad S directly above the percentage of 235
U by weight should be used. If the percentage of 235
U by weight is known only within a range, the upper limit of the range should be used.

69
The calculations indicate the following with regard to investigation levels for airborne
depleted, natural, or 235
U-enriched uranium of particle size 5 μm AMAD:
Investigation levels derived from the chemical primary reference guidance level depend
on the solubility but not the isotopic composition of the airborne material and are 15
μg/m3, 61 μg/m
3, and 585 μg/m
3 for Types F, M, and S, respectively.
Investigation levels derived from the radiological primary reference guidance level vary
with the isotopic composition as well as the solubility of the airborne material and
become increasingly restrictive with increasing 235
U content, due primarily to increasing
levels of accompanying 234
U.
For Type F material, the chemical reference guidance is limiting for 235
U content up to
about 44% 235
U by mass, and radiological reference guidance is limiting for higher 235
U
content.
For Type M material, the chemical reference guidance is limiting for 235
U content up to
about 3.7% 235
U by mass, and the radiological reference guidance is limiting for higher 235
U content.
For Type S material, the radiological reference guidance is limiting regardless of the
isotopic composition of the material.
Figure 5.1 Graphs used to determine investigation levels for the concentration of uranium
in air. The cases considered are depleted, natural, or 235
U-enriched uranium of Type F, M,
or S (5 μm AMAD). The investigation level for Type X (X = F, M, or S) and a given
isotopic composition is determined by the lower of the curves Chem X and Rad X at their
points of intersection with a vertical line through the 235
U content (horizontal axis).

70
Table 5.2 Investigation levels for the concentration of depleted, natural, or 235
U-
enriched uranium in air for different levels of solubility of uranium, based on the
default particle size 5 μm AMAD. The investigation level for Type X (X = F, M,
or S) and a given isotopic composition is the lower of the derived values based on
chemical and radiological reference guidance.
Percentage of 235
U in
mixture by mass Concentration of uranium in air (μg/m
3)
Type F Type M Type S
Investigation levels based on radiological reference guidance
0.25a 1030 366 104
0.72b 521 171 50.8
1c
449 146 43.5 2
c 299 95.4 28.8
3c
224 70.5 21.4 4
c 178 55.7 17.0
5c
147 46.0 14.0 7
c 109 33.8 10.3
10c
77.4 23.9 7.33 15
c 51.2 15.8 4.84 20
c 37.6 11.5 3.55
30c
23.7 7.25 2.23 40
c 16.7 5.12 1.58
50c
12.6 3.86 1.19 60
c 9.93 3.04 0.94
70c
8.06 2.46 0.76 75
c 7.33 2.24 0.69
80c
6.70 2.05 0.63 85
c 6.15 1.88 0.58
90c 5.67 1.73 0.53
93c
5.41 1.65 0.51 95
c 5.24 1.60 0.49
97c 5.09 1.55 0.48
99c 4.94 1.51 0.47
Investigation levels based on chemical reference guidance Any mixture of
234U,
235U, and
238U 15 61 585
aRepresents depleted uranium;
234U content assumed to be 0.0005% by mass.
bRepresents unprocessed natural uranium;
234U content assumed to be 0.0057% by mass.
cDerivations of air concentrations of uranium based on relative contents of
234U and
235U
typically found in uranium enriched by the gaseous diffusion process.

71
Example 5.2. Suppose that workers are exposed to natural uranium in air. The 235
U content
of natural uranium is about 0.72% by mass. The investigation level for airborne uranium can
be determined either from Figure 5.1 or Table 5.2. Based on Figure 5.1:
The investigation level for a relatively soluble form (Type F) is about 15 μg/m3,
because a vertical line passing through 0.72 on the E-axis (E = % 235
U by weight)
would intersect the curve labeled Chem F at about 15 μg/m3 and the curve Rad F at a
much higher value, about 500 μg/m3. In this case the investigation level based on
chemical reference guidance is the same as given in Table 5.1 because inhalation of
Type F material is the most restrictive situation regarding chemical toxicity when
dealing with an unknown form of uranium.
The investigation level for a moderately soluble form (Type M) is about four times
higher (~60 μg/m3) than that for Type F, because a vertical line passing through 0.72
on the E-axis would intersect the curve Rad M near 60 μg/m3 and would intersect the
curve Chem M at a higher value.
The investigation level for a relatively insoluble form (Type S) is about 50 μg/m3,
because a vertical line passing through 0.72 on the E-axis would intersect the curve
Rad S near 50 μg/m3 and would intersect the curve Chem S near 600 μg/m
3.
Table 5.2 is easier to use than Figure 5.1 for natural uranium or other isotopic compositions
addressed in the table. Based on Table 5.2:
The investigation level for a relatively soluble form (Type F) of natural uranium is 15
μg/m3. This is the investigation level for any mixture of
234U,
235U, and
238U based on
chemical reference guidance. It is lower than the value 521 μg/m3 based on
radiological reference guidance.
The investigation level for a moderately soluble form (Type M) of natural uranium is
61 μg/m3, which is the value based on chemical reference guidance. This value is less
than the value 171 μg/m3 based on radiological reference guidance.
The investigation level for a relatively insoluble form (Type S) of natural uranium is
50.8 μg/m3, which is the value based on radiological reference guidance. This value
is less than the value 585 μg/m3 based on chemical reference guidance.
Analogous graphs and tabulated values for determining immediate action levels for the
concentration of depleted, natural, or enriched uranium in air are given in Figure 5.2 and Table
5.3, respectively. The methods of derivation of immediate action levels for different mixtures of 234
U, 235
U, and 238
U are the same as described above for investigation levels, with the limiting
kidney concentration changed from 0.3 to 1.0 μg U/g kidney and the limiting annual effective
dose coefficient changed from 0.02 to 0.05 Sv.

72
The calculations indicate the following with regard to immediate action levels for airborne
depleted, natural, or 235
U-enriched uranium of particle size 5 μm AMAD:
Immediate action levels derived from chemical reference guidance depend on the
solubility but not the isotopic composition of the airborne material and are 50 μg/m3, 203
μg/m3, and 1950 μg/m
3 for Types F, M, and S, respectively.
Immediate action levels derived from radiological reference guidance vary with the
isotopic composition as well as the solubility of the airborne material and become
increasingly restrictive with increasing 235
U content, due primarily to increasing levels of
accompanying 234
U.
For Type F material, chemical reference guidance is limiting for 235
U content up to about
35% 235
U by mass, and radiological reference guidance is limiting for higher 235
U
content.
For Type M material, chemical reference guidance is limiting for 235
U content up to about
2.5% 235
U by mass, and radiological reference guidance is limiting for higher 235
U
content.
For Type S material, radiological reference guidance is limiting regardless of the isotopic
composition of the material.
Figure 5.2 Graphs used to determine immediate action levels for the concentration of
uranium in air. The cases considered are depleted, natural, or 235
U-enriched uranium of
Type F, M, or S (5 μm AMAD). The immediate action level for Type X (X = F, M, or S)
and a given isotopic composition is determined by the lower of the curves Chem X and

73
Rad X at their points of intersection with a vertical line through the 235
U content
(horizontal axis).
Table 5.3 Immediate action levels for the concentration of depleted, natural, or 235
U-enriched uranium in air for different levels of solubility (different absorption
types) of uranium, based on the default particle size 5 μm AMAD. The immediate
action level for Type X (X = F, M, or S) and a given isotopic composition is the
lower of the derived values based on chemical and radiological reference guidance.
Percentage of 235
U in
mixture by mass Concentration of uranium in air (μg/m
3)
Type F Type M Type S
Investigation levels based on radiological reference guidance 0.25
a 2570 916 260 0.72
b 1300 428 127 1
c 1120 365 109
2c
748 238 71.9 3
c 559 176 53.5
4c
445 139 42.4 5
c 368 115 35.0
7c
272 84.5 25.8 10
c 193 59.8 18.3
15c 128 39.4 12.1
20c
93.9 28.8 8.87 30
c 59.1 18.1 5.58
40c
41.8 12.8 3.94 50
c 31.5 9.65 2.97
60c
24.8 7.59 2.34 70
c 20.2 6.16 1.90
75c
18.3 5.60 1.73 80
c 16.7 5.12 1.58
85c
15.4 4.70 1.45 90
c 14.2 4.33 1.34 93
c 13.5 4.13 1.27
95c
13.1 4.00 1.23 97
c 12.7 3.88 1.20 99
c 12.3 3.77 1.16
Investigation levels based on chemical reference guidance Any mixture of
234U,
235U, and
238U
50 203 1950
aRepresents depleted uranium;
234U content assumed to be 0.0005% by mass.
bRepresents unprocessed natural uranium;
234U content assumed to be 0.0057% by mass.
cDerivations of air concentrations of uranium based on relative contents of
234U and
235U
typically found in uranium enriched by the gaseous diffusion process.

74
5.4 Action Levels Based on Urinary Uranium
Action levels based on the concentration of uranium in urine depend on the exposure conditions,
including the form of inhaled uranium and the time-course of exposure relative to the time of
collection of the urine sample. If the form of the radionuclide or pattern of exposure is not
known, worst-case assumptions are made.
Interpretation of routine urinary uranium measurements becomes increasingly difficult as the
sampling interval is widened. In the following it is assumed that urinary uranium measurements
are made routinely at intervals no greater than 3 months. Also, it is assumed that the site
bioassay program has been designed as far as feasible to avoid substantial underestimates of the
average rate of urinary excretion of uranium for chronically exposed workers (see Section 4).
Suppose, for example, that a worker is chronically exposed to moderately soluble uranium and a
24-h urine sample is collected 48–72 h after the last potential exposure. Then the average
urinary excretion level could be assumed to be twice the measured value based on model
predictions discussed in Section 4, or adjustment of the measured value could be made on the
basis of site-specific information as discussed in Section 4. If a urine sample is a composite of
several samples taken at different times of day during a work week, no adjustment of the
measured value would be needed.
Designers of a monitoring program for uranium should keep in mind that urinary uranium is a
reflection of the amount of uranium reaching the systemic circulation and may not be a reliable
indicator of the content of uranium in the lungs. In situations where airborne uranium is likely to
include a relatively insoluble component, the monitoring program should supplement urinary
measurements with regular fecal measurements, external chest measurements, or both.
5.4.1 Action Levels for Urinary Uranium for Inhalation of an Unknown Form of
Uranium
Tables 3.13 and 3.14 can be used to estimate the maximum concentration of uranium in the
kidneys based on an elevated level of uranium in a routine urine sample, provided sampling is
performed at least quarterly.
Regardless of the form of inhaled uranium or the pattern of exposure during a period no greater
than 3 mo, the concentration of uranium in the kidneys in units of μg U/g kidney is predicted to
be no more than 30 times the concentration in urine in units of μg U/mL urine (Tables 3.13 and
3.14). The investigation level of 0.3 μg U/g kidney corresponds to (0.3 μg/g) / (30 μg / g per
μg/mL) = 0.01 μg/mL urine or 10 μg U / L urine. The immediate action level 1.0 μg U/g kidney
corresponds to 33 μg U/L urine.
Assignment of radiologically based action levels for an unknown form of uranium is complicated
by the fact that relatively low concentrations of uranium in urine do not preclude the possibility
of intake of elevated quantities of insoluble uranium and buildup of activity in the lungs. If the
presence of an insoluble component is known or suspected, urinary uranium data should be
supplemented with regular fecal measurements, external chest measurements, or both.
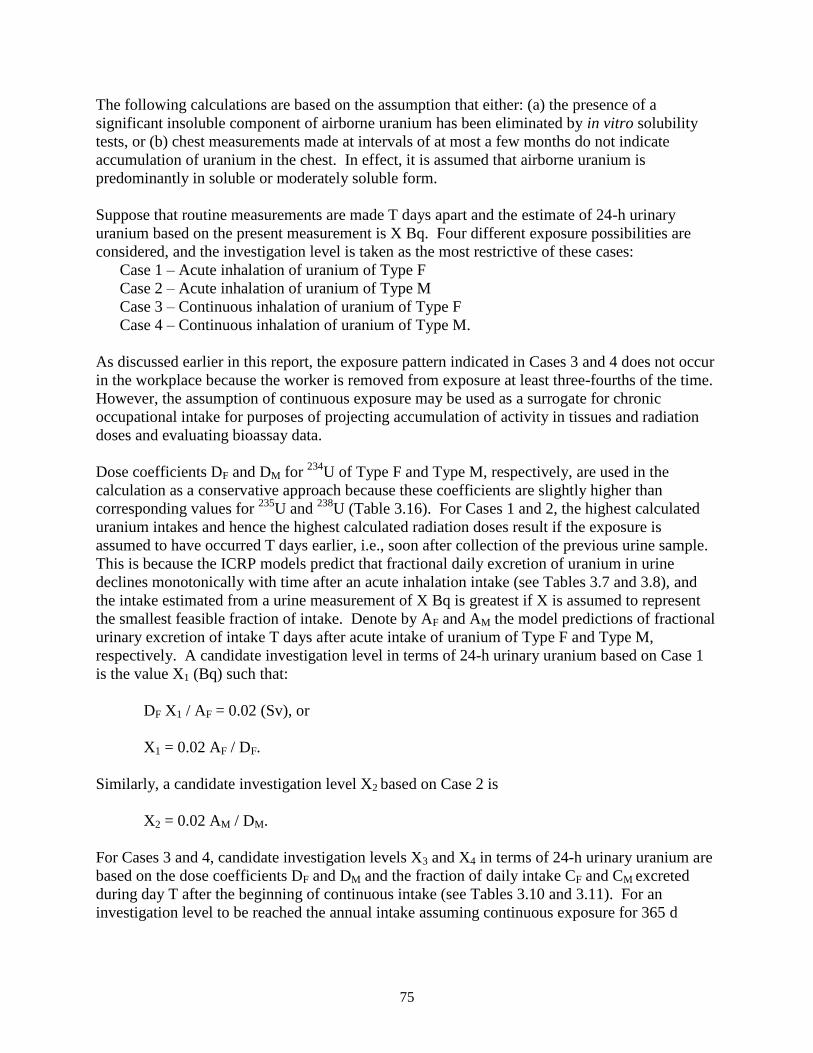
75
The following calculations are based on the assumption that either: (a) the presence of a
significant insoluble component of airborne uranium has been eliminated by in vitro solubility
tests, or (b) chest measurements made at intervals of at most a few months do not indicate
accumulation of uranium in the chest. In effect, it is assumed that airborne uranium is
predominantly in soluble or moderately soluble form.
Suppose that routine measurements are made T days apart and the estimate of 24-h urinary
uranium based on the present measurement is X Bq. Four different exposure possibilities are
considered, and the investigation level is taken as the most restrictive of these cases:
Case 1 – Acute inhalation of uranium of Type F
Case 2 – Acute inhalation of uranium of Type M
Case 3 – Continuous inhalation of uranium of Type F
Case 4 – Continuous inhalation of uranium of Type M.
As discussed earlier in this report, the exposure pattern indicated in Cases 3 and 4 does not occur
in the workplace because the worker is removed from exposure at least three-fourths of the time.
However, the assumption of continuous exposure may be used as a surrogate for chronic
occupational intake for purposes of projecting accumulation of activity in tissues and radiation
doses and evaluating bioassay data.
Dose coefficients DF and DM for 234
U of Type F and Type M, respectively, are used in the
calculation as a conservative approach because these coefficients are slightly higher than
corresponding values for 235
U and 238
U (Table 3.16). For Cases 1 and 2, the highest calculated
uranium intakes and hence the highest calculated radiation doses result if the exposure is
assumed to have occurred T days earlier, i.e., soon after collection of the previous urine sample.
This is because the ICRP models predict that fractional daily excretion of uranium in urine
declines monotonically with time after an acute inhalation intake (see Tables 3.7 and 3.8), and
the intake estimated from a urine measurement of X Bq is greatest if X is assumed to represent
the smallest feasible fraction of intake. Denote by AF and AM the model predictions of fractional
urinary excretion of intake T days after acute intake of uranium of Type F and Type M,
respectively. A candidate investigation level in terms of 24-h urinary uranium based on Case 1
is the value X1 (Bq) such that:
DF X1 / AF = 0.02 (Sv), or
X1 = 0.02 AF / DF.
Similarly, a candidate investigation level X2 based on Case 2 is
X2 = 0.02 AM / DM.
For Cases 3 and 4, candidate investigation levels X3 and X4 in terms of 24-h urinary uranium are
based on the dose coefficients DF and DM and the fraction of daily intake CF and CM excreted
during day T after the beginning of continuous intake (see Tables 3.10 and 3.11). For an
investigation level to be reached the annual intake assuming continuous exposure for 365 d

76
would have to correspond to a committed effective dose of 0.02 Sv. For inhalation of Type F
material this means that
365DFX3 / CF = 0.02, or
X3 = 0.02CF / 365DF.
Similarly, for inhalation of Type M material this means that
X4 = 0.02CM / 365DM.
Therefore, in terms of 24-h urinary uranium, the investigation level is the minimum of these four
values:
X1 = 0.02 AF / DF
X2 = 0.02 AM / DM
X3 = 0.02 CF / 365DF
X4 = 0.02 CM / 365DM.
The fractions AF and AM based on acute intake of Types F and M are taken from Tables 3.7 and
3.8, respectively. The fractions CF and CM based on chronic intake of Type F and M are taken
from Tables 3.10 and 3.11, respectively. The dose coefficients DF and DM are both taken from
Table 3.16. For example, if measurements are made monthly (T = 30 d), the four values X1, X2,
X3, and X4 are as follows:
X1 = (0.02 x 6.6 x 10-4
) / 6.4 x 10-7
= 21 Bq
X2 = (0.02 x 2.6 x 10-4
) / 2.1 x 10-6
= 2.6 Bq
X3 = (0.02 x 0.25) / (365 x 6.4 x 10-7
) = 21 Bq
X4 = (0.02 x 0.037) / (365 x 2.1 x 10-6
) = 0.97 Bq.
The minimum of these four values, 0.97 Bq, is the investigation level in terms of 24-h urinary
uranium. Expressed in terms of the concentration of uranium in urine, the investigation level is
0.97 Bq / 1.6 L = 0.6 Bq/L, where 1.6 L is the reference value for the volume of urine excreted
per day.
The immediate action level based on radiological reference guidance can be calculated in the
same way, with the committed effective dose 0.02 Sv replaced by 0.05 Sv. As a result of the 2.5
times higher target dose, the immediate action level is 2.5 times higher than the investigation
level, or:
2.5 x 0.6 Bq/L = 1.5 Bq/L.
For any sampling interval between 1 wk and 3 mo, the radiologically based investigation or
immediate action level for an uncertain form of uranium based on urinary uranium is determined
by exposure Case 4 (continuous inhalation of Type M material), provided the possibility of
relatively insoluble uranium or buildup of uranium in the chest has been eliminated.

77
Investigation and immediate action levels based on Case 4 do not depend strongly on the
sampling interval provided T is at least 1 wk. Therefore, the investigation level 0.6 Bq/L and
immediate action level 1.5 Bq/L are adopted for uncertain forms of uranium and any sampling
interval up to 3 mo.
The derived action levels for an unknown form of airborne uranium based on urinary excretion
measurements are summarized in Table 5.4.
Table 5.4 Investigation and immediate action levels for
urine for application to cases in which the form of
airborne uranium is not knowna
Level Mass concentration
in urine (μg/L)
Activity concentration
in urine (Bq/L)
Investigation level
10
0.6
b Immediate action level
33
1.5
b
aAssuming urine sampling is performed at least quarterly.
bIt is assumed that the presence of a relatively insoluble form of airborne
uranium is considered unlikely in view of in vitro solubility tests or that reasonably
frequent chest measurements do not indicate accumulation of uranium in the chest.
5.4.2 Action Levels for Urinary Uranium for Inhalation of a Reasonably Well
Characterized Form of Uranium
When the form of inhaled uranium is reasonably well characterized, investigation and immediate
action levels based on urinary uranium may be calculated from the appropriate table in Section3.
The method of derivation of action levels in this case is the same as described above for an
unknown form of airborne uranium except that one limits attention to a specific form of uranium
rather than considering alternate forms and taking the minimum derived value.
Example 5.3. Suppose that a worker is chronically exposed to low levels of airborne uranyl
nitrate confirmed by in vitro testing to be highly soluble in simulated lung fluid, and there is no
reason to suspect intake of other forms of uranium. Suppose further that urine measurements are
made monthly. The chemically based investigation and immediate action levels can be derived
from Table 3.14, which provides kidney to urine concentration ratios for continuous intake of
any form of uranium. According to Table 3.14, the kidney to urine concentration ratio at 30 d
would be 7.9. The investigation level of 0.3 μg U / g kidney corresponds to:
0.3 μg/g / 7.9 μg/g per μg/mL = 0.038 μg/mL urine or 38 μg U / L urine.
The immediate action level 1.0 μg U / g kidney corresponds to 127 μg U / L urine. Table 3.10,
which addresses continuous intake of uranium of Type F, can be used to derive the radiologically

78
based investigation and immediate action levels. The radiologically based investigation level of
urinary uranium would be:
(0.02 x 0.25) / (365 x 6.4 x 10-7
) = 21 Bq/d,
where
0.25 is the fraction of daily intake excreted in urine on Day 30 after the start of intake,
and
6.4 x 10⁻⁷
Sv/Bq is the dose coefficient for inhalation of uranium of Type F.
This corresponds to an activity concentration in urine of:
21 Bq d-1
/ 1.6 L urine d-1
= 13 Bq/L.
The radiologically based immediate action level would be 2.5 times higher or 33 Bq/L.
5.4.3 Action Levels for Urinary Uranium for Intake through a Wound
Uranium can enter the systemic circulation through a puncture wound or by penetration through
burned, scraped, or even intact skin. In general, this type of exposure must be limited through
enforcement of safe work practices rather than through numerical guidelines for uranium
concentrations in the work environment or bioassay. Nevertheless, it is important to monitor a
worker who has been exposed to uranium through a wound or intact skin to determine whether
removal from further exposure or medical intervention is indicated.
Depending on the information available, Table 3.5 and Table 3.6 might be used to estimate the
rate of transfer of uranium from a wound or skin to blood on the basis of urinary excretion
measurements. If there is no evidence of intake of uranium by inhalation or ingestion, the rate of
transfer of uranium from the wound to blood can be estimated from a series of urine samples
taken after the wound incident. A rapid fall in the urinary excretion rate in the days following
the incident suggests fast mobilization of the uranium from the wound to blood, as may occur
after a soluble form of uranium enters the body through a puncture wound. A slowly declining,
constant, or increasing rate of urinary excretion over an extended period indicates the presence of
a less soluble form of uranium.
Example 5.4. A worker involved in fuel fabrication for a research reactor receives a puncture
wound from an object contaminated with highly enriched uranium with specific activity
estimated as 2 × 10⁶ Bq/g [see Equation 5.2]. He is removed from further exposure. The
uranium content of 24-h urine samples is determined for Days 1 (0–24 h), 2, 3, 5, 7, 15, 20, and
30 after the incident. Measured values for these eight days are 5000, 235, 120, 140, 100, 90, 30,
and 18 Bq, respectively. The measurements are plotted (Figure 5.3), and it is determined that the
excretion pattern over time is reasonably similar to that given in Table 3.5 (see Column 2) for the
case of acute uptake of uranium to blood at time zero. Based on the assumption of acute uptake
to blood, total uptake is estimated from data for each 24-h observation period by dividing the
24-h excretion value by the fraction of uptake indicated for the corresponding day in Table 3.5.
For example, 24-h excretion on Day 2 is 235 Bq, and Table 3.5 indicates that about 2.3% of the
total uptake would be excreted on Day 2, giving estimated uptake of 235/0.023 = 10,200 Bq.

79
Estimates derived in this way for Days 1, 3, 5, 7, 15, 20, and 30 are 7810, 6670, 9330, 8330,
14800, 7140, and 7830 Bq, respectively. The average of the eight estimates of uptake to blood is
~9000 Bq. Based on a specific activity of 2 x 10⁶ Bq/g, the mass of uranium absorbed to blood
is:
9000 Bq / 2 × 10⁶ Bq/g = 0.0045 g = 4500 μg.
According to Table 3.5, the kidney content at 1 d after acute uptake to blood is 11% of the
uptake or
0.11 × 4500 μg = 495 μg.
The concentration of uranium in the kidneys at this time would be approximately
495 μg U / 310 g kidney = 1.6 μg U / g kidney,
which exceeds the primary chemical reference guidance level of 1.0 μg U / g kidney. Based on
the retention values for kidneys given in Table 3.5, the kidney concentration would fall below
1.0 μg U / g kidney within the next two weeks. From Table 3.15, the dose coefficient for
intravenous injection of 234
U (the most conservative of the coefficients for 234
U, 235
U, and 238
U)
is 2.3 x 10⁻⁶
Sv/Bq. The projected effective dose from the intake is:
9000 Bq x 2.3 x 10-6
Sv/Bq = 0.021 Sv.
This exceeds the primary radiological reference guidance level (0.02 Sv) for intake during any 1-
y period. The worker should not return to uranium work areas for about a year.
Figure 5.3 Pattern of change with time in urinary uranium
for the hypothetical worker in Example 5.4. Curve is
model fit to measured values (circles) based on acute
uptake of uranium to blood at time zero (see Table 3.5).

80
Example 5.5. A worker receives an injury that leaves a small piece of depleted uranium metal
embedded in muscle tissue. A decision is made not to remove the metal surgically unless urinary
uranium measurements indicate the need for intervention at some point based, for example, on
the general reference guidance given in Table 1.1. Periodic urine measurements over the first 2 y
after the incident indicate a nearly constant urinary excretion rate of about 8 (6–10) μg U/d, or
roughly 3 mg/y (Figure 5.4). The steady rate of urinary excretion of uranium suggests a nearly
constant rate of migration of uranium from the embedded metal to blood, estimated from the
systemic model for uranium to be nearly the same as the urinary excretion rate (~3 mg/y).
At 2 y after intake the uranium concentration in the kidneys in units of μg U /g kidney is
predicted on the basis of Table 3.14 to be about 10 times the concentration of uranium in urine in
units of μg U /mL urine. In this case the nearly constant concentration in urine is about
(8 μg U/d) / (1600 mL urine/d) ~ 0.005 μg U/mL. Therefore, the concentration of uranium in the
kidneys is estimated as:
10 (μg U/g kidney/ μg U/mL) x 0.005 μg U/mL or 0.05 μg U / g kidney.
This is well below the investigation level of 0.3 μg U / g kidney based on chemical toxicity. For
evaluation of the potential radiological hazard, effective dose coefficients given in Table 3.15 in
units of Sv/g are used to derive an effective dose coefficient E for the case of direct input of
depleted uranium to blood, based on the assumption that depleted uranium consists of 0.25% 235
U, 0.0005% 234
U, and 99.7495% 238
U:
EDU = (0.000005 530) + (0.0025 0.17) + (0.997495 0.026) = 0.029 Sv/ g.
The level of input of U to blood required to yield the radiological criterion for investigative
actions is:
0.02 Sv y-1
/ 0.029 Sv g-1
= 0.69 g/y = 690 mg/y,
which is about 230 times the estimated rate of migration of uranium from the embedded metal.
Thus, medical intervention is not indicated in this case.
Figure 5.4 Urinary data for the hypothetical case
described in Example 5.5.

81
The systemic model described in Section 3 may be used in conjunction with a wound model that
predicts the rate of mobilization of uranium from a wound to blood, but in any event it is
important to continue to monitor the actual rate of mobilization of uranium to blood as reflected
in urinary excretion measurements. The reader is referred to NCRP Report No. 156 (2006) for
information on the behavior of uranium and other radionuclides in wounds and a description of a
model depicting idealized rates of mobilization of activity to blood. Experimental data on the
rate of penetration of uranium through burned, scraped, or intact skin and references to related
studies can be found in papers by de Rey et al. 1983, Lopez et al. 2000, and Petitot et al. 2007.
5.5 Action Levels Based on Measurement of Uranium in Feces
In the case of inhalation of uranium in relatively insoluble form, with no significant soluble
component, the radiation dose to the lungs is the main concern. For such forms there will
generally be little deposition of uranium in the kidneys because of the low level of absorption of
uranium to blood. Fecal excretion measurements may be made in conjunction with urinary
excretion measurements to examine the possibility of inhalation of an insoluble form of uranium
or to estimate radiation doses from such an exposure.
Radiologically based action levels for fecal uranium are applicable in cases where inhalation of a
relatively insoluble form of uranium is known or suspected. Inhalation of a relatively insoluble
form of uranium might be indicated, for example, by published solubility data for the type of
material being handled, by in vitro solubility measurements of the specific material to which
workers are thought to be exposed, by indications of buildup of uranium in the chest based on
external measurements, or by determination of the ratio of the rates of fecal and urinary excretion
of uranium in chronically exposed workers. A relatively insoluble form of uranium is indicated
if the fecal excretion rate is more than an order of magnitude greater than the urinary excretion
rate.
Radiologically based action levels for fecal uranium are determined by the same general
approach used to derive radiologically based action levels for urinary uranium, with urinary
excretion rates replaced in the computations by fecal excretion rates. The approach is illustrated
by the following hypothetical case.
Example 5.6. A group of workers is exposed daily to an airborne uranium compound generally
considered to be soluble or, at worst, moderately soluble in the lungs. However, routine
measurements of urinary uranium 30 d after the start of exposure are much lower than predicted
from air monitoring data if inhalation of either Type F or Type M material is assumed. Fecal
measurements are made, and it is found that daily fecal excretion in the workers is about two
orders of magnitude greater than daily urinary excretion. It is concluded that all or nearly all of
the airborne uranium is relatively insoluble (Type S). The investigation level corresponds to a
fecal excretion rate of:
(0.02 x 0.43)/ (365 x 6.8 x 10-6
) = 3.5 Bq/d,
where
0.02 Sv is the dosimetric criterion for an investigation level,

82
0.43 is the fraction of daily intake projected to be excreted in feces on Day 30 after the
start of exposure assuming Type S material (Table 3.12), and
6.8 x 10⁻⁶
Sv/Bq is the inhalation dose coefficient for 234
U of Type S (Table 3.16).
Assuming that the mass of feces excreted per day is 150 g, the investigation level in terms of the
concentration of uranium in feces is:
3.5 Bq d-1
/ 150 g d-1
= 0.023 Bq/g feces.
The immediate action level corresponds to a fecal excretion rate of:
(0.05 x 0.43) / (365 x 6.8 x 10-6
) = 8.7 Bq/d.
In terms of the concentration of uranium in feces the immediate action level is:
8.7 Bq d-1
/ 150 g d-1
~ 0.058 Bq/g feces.
The investigation and immediate action levels derived above for a 30-d interval between
measurements turns out to be relatively insensitive to the length of time between routine
measurements. This is because the predicted fraction of inhaled uranium of Type S excreted
daily in feces quickly approaches the deposition fraction in the respiratory tract, excluding the
anterior nasal passages (~0.48 for the particle size 5 μm AMAD) (Table 3.12). Therefore, the
action levels derived above are adopted (after rounding) as action levels for fecal uranium for
cases in which a high ratio (>30) of daily fecal uranium to daily urinary uranium is determined.
Rounded investigation and immediate action levels based on fecal measurements are listed in
Table 5.5.
Table 5.5 Investigation and immediate action levels for feces
for cases in which chronic inhalation of a relatively insoluble
form of uranium is known or suspected
Level Activity concentration in feces
(Bq/g)
Investigation level
0.025
Immediate action level
0.06
5.6 Action Levels Based on External Measurement of Uranium in the Chest
External measurements over the chest are used to detect accumulation of uranium in the lungs.
The preferred detector is a germanium detector (WHO, 2001), but sodium iodide and phoswich
detectors have also been used (ATSDR, 1999). The 235
U activity in the lungs is estimated from
measurement of photon emissions from 235
U (186 keV). In some measurement systems the 238
U

83
activity is also estimated by measurement of photon emissions from its daughter 234
Th (63 keV
and 93 keV), assuming that 234
Th is in equilibrium with 238
U.
The minimum detectable activity (MDA) of 235
U or 238
U (i.e., 234
Th) in the lungs depends on the
type of detector used and the counting time. The MDA for a counting time of 45-60 min using a
germanium detector is on the order of 4 Bq of 235
U and 100 Bq of 238
U (WHO 2001; Kramer et
al. 2003).
The MDA expressed in terms of total uranium in the chest depends on the isotopic composition
of uranium. For example, if 235
U is measured with a germanium detector and the counting time
is 30 min, the MDA may be on the order of 100–150 Bq for natural uranium but 40–70 Bq for
5% enriched uranium.
Default action levels for routine periodic in vivo lung measurements recommended in this report
are based on the assumption that the estimated lung content represents steady-state conditions.
That is, the rate of deposition of inhaled uranium in the lungs is assumed to equal the rate of loss
of uranium from the lungs.
For purposes of deriving action levels for in vivo lung counts, the counts are assumed to
represent activity in the 10 thoracic compartments of the HRTM shown in Figure 3.1: AI1, AI2,
AI3, bb1, bb2, bbSEQ, BB1, BB2, BBSEQ, and LNTH. Action levels are derived under the
assumption that inhaled uranium is Type M material and the particle size is 5 μm AMAD. This
is a cautious assumption in that it yields a higher lung dose from a fixed amount of uranium in
the lungs than if the material were assumed to be Type S. This is because Type M and Type S
materials are predicted to have different time-dependent distributions in the lungs due to
different transfer rates among respiratory compartments, and a larger portion of Type M than
Type S material is predicted to reside in the bronchi (BB compartments in Figure 3.1) and
bronchioles (bb compartments). Due to the relatively small masses of the bronchi and
bronchioles, the dose per unit alpha activity within each of these regions is substantially higher
than the dose per unit alpha activity within the relatively massive alveolar-interstitial region.
The HRTM predicts that under steady-state conditions the annual lung dose is approximately
8 x 10⁻⁴
Sv per Bq of uranium of Type M in the lungs (range 7–9 x 10⁻⁴
Sv/Bq, depending on the
assumed isotopic composition of uranium). The lung dose represents about 92% of the effective
dose for inhaled uranium of Type M and particle size 5 μm AMAD. The investigation level
should be the steady-state uranium content in the lungs corresponding to an annual lung dose of
0.92 x 0.02 Sv/0.12 = 0.153 Sv, where 0.02 Sv is the limiting committed effective dose for an
investigation level and 0.12 is the tissue weighting factor applied to lung in the derivation of
effective dose. Therefore, the investigation level for an in vivo measurement of uranium in the
lungs is 0.153 Sv / 8 x 10⁻⁴
Sv Bq-1
= 191 Bq. This is rounded to 200 Bq in view of the sizable
uncertainties in estimates of total uranium in the lungs.
The immediate action level is calculated in the same way, substituting 0.05 Sv for 0.02 Sv as the
limiting annual committed effective dose. The derived immediate action level for the lung
burden is 500 Bq when rounded to one significant digit.

84
Investigation and immediate action levels for routine periodic external measurement of uranium
in the chest are listed in Table 5.6.
Table 5.6 Investigation and immediate action levels for uranium
in the chest based on routine periodic measurements
Level Total activity in the lungs (Bq)
Investigation level
200
Immediate action level
500
Special chest measurements may be required for workers thought to have been acutely exposed
to moderately soluble or relatively insoluble uranium, to determine whether work restrictions
should be imposed. For example, if a chest measurement is made 10 d after acute inhalation of
material thought to be highly insoluble, the immediate action level would be:
(0.05 x 0.058) / 6.8 x 10-6
= 426 Bq,
where,
0.05 Sv/y is the dosimetric criterion for an immediate action level,
0.058 is the fraction of intake predicted to be retained in the lungs 10 d after acute intake
of Type S material (Table 3.9), and
6.8 x 10⁻⁶
Sv/Bq is the inhalation dose coefficient for 234
U of Type S (Table 3.16).

85
6 REFERENCES
Akamine, A. U.; Duchen Silva, M. A.; Saiki, M.; Vasconcellos, M. B. A.; de Andrade, S. L.;
Fulfaro, R. (2007). “Determination of uranium in human head hair of a Brazilian population
group by epithermal neutron activation analysis.” J. Radioanal. Nucl. Chem. 271:607–609.
Alberth, D. P; Szrom, F. (2007). “Operation Iraqi freedom depleted uranium bioassay screening
program update.” Health Physics Program, U.S. Army Center for Health Promotion and
Preventive Medicine, 2007 Force Health Protection Conference, August 6–10, 2007.
Alexander, R. E. (1974). Applications of Bioassay for Uranium. WASH-1251, Washington, DC:
USAEC.
Alexander, R. E.; Neel, R. B.; Puskin, J. S.; Brodsky, A. (1986). Internal Dosimetry Model for
Applications to Bioassay at Uranium Mines. NUREG-0874, U.S. Nuclear Regulatory
Commission, Washington, DC.
André, S.; Métivier, H.; Auget, D.; Lantenois, G.; Boyer, M.; Masse, R. (1989). “Lung
dissolution of uranium tetrafluoride in rats and baboons. Comparison with dissolution by
alveolar macrophages in culture and chemical dissolution.” Human Toxicol. 8:111–119.
Ansoborlo, E.; Chazel, V.; Houpert, P.; Hengé-Napoli, M. H.; Paquet, F.; Hodgson, A.;
Stradling, N. (1998a). “Assessment of physico-chemical and biokinetic properties of uranium
peroxide hydrate UO4.” Health Phys. 75:389–397.
Ansoborlo, E.; Hodgson, A.; Stradling, G. N.; Hodgson, S.; Metivier, H.; Hengé-Napoli, M. H.;
Jarvis, N.; Birchall, A. (1998b). “Exposure implications for uranium aerosols formed at a new
laser enrichment facility: Application of the ICRP respiratory tract and systemic model.” Radiat.
Prot. Dosim. 79:23–27.
Ansoborlo, E; Chalabreysse, J.; Escallon, S.; Hengé-Napoli, M. H. (1990). “In vitro solubility of
uranium tetrafluoride with oxidizing medium compared with in vivo solubility in rats.” Int. J.
Radiat. Biol. 58:681–689.
Ansoborlo, E.; Chazel, V.; Hengé-Napoli, M. H.; Pihet, P.; Rannou, A.; Bailey, M. R.;
Tradling, N. (2002). “Determination of the physical and chemical properties, biokinetics, and
dose coefficients of uranium compounds handled during nuclear fuel fabrication in France.”
Health Phys. 82:279–289.
Assistant Secretary of Defense. Guidance for depleted uranium (DU) bioassay urinalysis,
attachment to the Memorandum, Policy for the Operation Iraqi Freedom depleted uranium (DU)
medical management, HA Policy: 03-012; Department of Defense; 2003. (Available at
http://www.ha.osd.mil/policies/2003/03-012.pdf.)
ATSDR (1999). Toxicological Profile for Uranium. U.S. Department of Health and Human
Services. Public Health Service. Agency for Toxic Substances and Disease Registry.

86
ATSDR (2001). “Summary report. Hair analysis panel discussion: Exploring the state of the
science.” Meeting held June 12–13, 2001 in Atlanta, GA. Agency for Toxic Substances and
Disease Registry (available at http://www.atsdr.cdc.gov/hac/hair_analysis/pdfs.html).
Bailey, M.; Davis, K. (2002). “Estimations of kidney uranium concentrations from published
reports of uranium intakes in man where subsequent effects on kidney function were monitored.”
Annexe A to The Health Hazards of Depleted Uranium Munitions Part II. The Royal Society,
London. www.royalsoc.ac.uk/du.
Ballou, J. E.; Gies, R. A.; Case, A. C.; Haggard, D. L.; Bushbom, R. L.; Ryan, J. L. (1986).
“Deposition and early disposition of inhaled 233
UO2(NO3)2 and 232
UO2(NO3)2 in the rat.” Health
Phys. 51:755–771.
Barber, J. M.; Forrest, R. D. (1995). “A study of uranium lung clearance at a uranium processing
plant.” Health Phys. 68:661–669.
Beau, P. G.; Chalabreysse, J. (1989). “Knowledge gained from bioassay data on some metabolic
and toxicological features of uranium hexafluoride and its degradation products.” Radiat. Prot.
Dosim. 26:107–112.
Becker, J. S.; Burow, M.; Boulyga, S. F.; Pickhardt, C.; Hille, R.; Ostapczuk, P. (2002). “ICP-
MS determination of uranium and thorium concentrations and U-235/U-238 isotope ratios at
trace and ultratrace levels in urine.” Atomic Spectroscopy 23:177–182.
Becker, J. S.; Burow, M.; Zoriy, M. V.; Pickhardt, C.; Ostapczuk, P.; Hille, R. (2004).
“Determination of uranium and thorium at trace and ultratrace levels in urine by laser ablation
ICP-MS.” Atomic Spectroscopy 25:197–202.
Becker, J. S. (2005). “Inductively coupled plasma mass spectrometry (ICP-MS) and laser
ablation ICP-MS for isotope analysis of long-lived radionuclides.” Int. J. Mass Spectrometry
242:183–195.
Bencze, K. ( 1994). “Determination of metals in human hair.” In Seiler, H.; Sigel, A.; Sigel, H.,
Handbook on Metals in Clinical and Analytical Chemistry. Boca Raton, FL. CRC Press,
pp. 201–216.
Bentley, K. W.; Wyatt, J. H.; Wilson, D. J.; Dixon, R. J. (1982). “Uranium and plutonium in hair
as an indicator of body burden in mice of different age and sex.” Bull. Environ. Contam. Toxicol.
28:691–696.
Bhanti, D. P.; Malvankar, S. V.; Kotrappa, P. (1986). “Measurement of specific alpha
radioactivity with respect to size for Kerala monazite sand using aerosol centrifuge.” J. Nucl. Sci.
Technol. 23:1023–1025.

87
Boback, M. W. (1975). “A review of uranium excretion and clinical urinalysis data in accidental
exposure cases.” Proceedings of the Conference on Occupational Health Experience with
Uranium, pp. 226–243. Arlington, Virginia, April 28–30, 1975, ERDA 93, U.S. Energy Research
and Development Administration.
Bogard, J. S. (1996). Review of Uranium Bioassay Techniques. ORNL 5867. Oak Ridge National
Laboratory, Oak Ridge Tennessee.
Bouvier-Capely, C.; Ritt, J.; Baglan, N; Cossonnet, C. (2004). “Potentialities of mass
spectrometry (ICP-MS) for actinides determination in urine.” Appl. Radiat. Isotopes 60:629-633.
Brown, S. H. (2008). “The new generation of uranium in situ recovery facilities: Design
improvements should reduce radiological impacts relative to first generation uranium solution
mining plants.” WM 08 Conference, February 25–March 1, 2008, Phoenix, Arizona;
Paper #8414.
Bush, W.; Ekenstam, G.; Janov, J.; Kuhn, E.; Ryjinski, M. (2001). “IAEA experience with
environmental sampling at gas centrifuge enrichment plants in the European Union.”
Proceedings of the 42nd
Annual Meeting of the Institute of Nuclear Materials Management.
IAEA-SM-367/10/04. Indian Wells, California.
Byrne, A. R.; Benedik, L. (1991). “Uranium content of blood, urine and hair of exposed and non-
exposed persons determined by radiochemical neutron activation analysis, with emphasis on
quality control.” Sci. Total Environ. 107:143–157.
Canu, I. G.; Ellis, E. D.; Tirmarche, M. (2008). “Cancer risk in nuclear workers occupationally
exposed to uranium – emphasis on internal exposure.” Health Phys. 94:1-17.
Centers for Disease Control and Prevention, National Center for Environmental Health, Third
National Report on Human Exposure to Environmental Chemicals, National Health and
Nutrition Examination Surveys (NHANES), July 2005. (Available at
http://www.cdc.gov/exposurereport/results_01.htm.)
Cernichiari, E.; Brewer, R.; Myers, G. J.; Marsh, D. O.; Lapham, L. W.; Cox, C.; Shamlaye, C.
F.; Berlin, M.; Davidson, P. W.; Clarkson, T. W. (1995). “Monitoring methyl mercury during
pregnancy: Maternal hair predicts fetal brain exposure.” Neurotoxicology 16:705–710.
Cernichiari, E.; Myers, G. J.; Ballatori, N.; Zareba, G.; Vyas, J.; Clarkson, T. (2007). “The
biological monitoring of prenatal exposure to methylmercury.” Neurotoxicology 28:1015-1022.
Chalabreysse, J. (1970). “Etude et résultats d’examens effectués à la suite d’une inhalation de
composés dits solubles d’uranium naturels.” Radioprotection 5:pp. 1–17 and pp. 305–310.
Chalabreysse, J.; Beau, P. G.; Chevalier, C.; Jeanmaire, L.; Bataller, G.; Bérard, P.; Gibert, B.
(1989). “French experience with uranium compounds.” Radiat. Prot. Dosim. 26:49–56.

88
Chazel, V.; Houpert, P.; Ansoborlo, E. (1998). “Effect of U3O8 specific surface area on in vitro
dissolution, biokinetics, and dose coefficients.” Radiat. Prot. Dosim. 79:39–42.
Chazel, V.; Houpert, P.; Hengé-Napoli, M. H.; Paquet, F.; Ansoborlo, E (2000a). “Experimental
determination of the solubility of industrial UF4 particles.” Radiat. Prot. Dosim. 92:289–294.
Chazel, V.; Houpert, P.; Ansoborlo, E.; Hengé-Napoli, M. H.; Paquet, F. (2000b). “Variation of
solubility, biokinetics and dose coefficients of industrial uranium oxides according to specific
surface area.” Radiat. Prot. Dosim. 88:223–231.
Chou, C.-H. S. J.; Pohl, H.R.(2005). “Health effects classification and its role in the derivation of
minimal risk levels: Renal effects.” Regul. Toxicol. Pharm. 42:202-208.
Cook, N.; Holt, F. B. (1974). “The solubility of some uranium compounds in simulated lung
fluid.” Health Phys. 27:69–77.
Cooper, J. R.; Stradling, G. N.; Smith, H.; Ham, S. E. (1982). “The behaviour of uranium-233
oxide and uranyl-233 nitrate in rats.” Int. J. Radiat. Biol. 41:421–433.
Damon, E. G.; Eidson, A. F.; Hahn, F. F.; Griffith, W. W.; Guilmette, R. A. (1984).
“Comparison of early lung clearance of yellowcake aerosols in rats with in vitro dissouton and
IR analysis.” Health Phys. 42:469–477.
Dennis, N. A.; Blauer, H. M.; Kent, J. E. (1982). “Dissolution fractions and half times of single
source yellowcake in simulated lung fluids.” Health Phys. 42:469–477.
de Rey, B. M.; Lanfranchi, H. E.; Cabrini, R. L. (1983). “Percutaneous absorption of uranium
compounds.” Environ. Res. 30:480–491.
DOE (1988). Health Physics Manual of Good Practices for Uranium Facilities. EGG-2530 UC-
41. Department of Energy, Idaho National Engineering Laboratory.
Dorrian, M. D.; Bailey, M. R. (1995). “Particle size distributions of radioactive aerosols
measured in workplaces.” Radiat. Prot. Dosim. 60:119–113.
Duport, P.; Robertson, R.; Ho, K.; Horvath, F. (1991). “Flow-through dissolution of uranium-
thorium ore dust, uranium concentrate, uranium dioxide, and thorium alloy in simulated lung
fluid.” Radiat. Prot. Dosim. 38:121–133.
Eidson, A. F.; Mewhinney, J. A. (1980). “In vitro solubility of yellow cake samples from four
uranium mills and implications for bioassay interpretation.” Health Phys. 39:893–902.
Eidson, A. F. (1990). Biological Characterisation of Radiation Exposure and Dose Estimates for
Inhaled Uranium Mining Effluents. NUREG/CR-5489 TI90 012914, U.S. Nuclear Regulatory
Commission.

89
Eidson, A. F. (1994). “The effect of solubility on inhaled uranium compound clearance: A
review.” Health Phys. 67:1–14.
Ellender, M. (1987). “The clearance of uranium after deposition of the nitrate and bicarbonate in
two regions of the rat lung.” Human Toxicol. 6:479–482.
Endo, A.; Yamaguchi, Y.; Eckerman, K. F. (2005). Nuclear Decay Data for Dosimetry
Calculations – Revised Data of ICRP Publication 38, JAERI 1347, Japan Atomic Energy
Research Institute.
Fisher, D. R.; Jackson, P. O.; Brodaczynski, G. G.; Scherpelz, R. I. (1982). Measurements of 234
U, 238
U, and 230
Th in Excreta of Uranium Mill Crushermen. NUREG/CR 2503, PNL-4027,
Pacific Northwest Laboratory, Richland, Washington.
Fisher, D. R; Swint, M. J.; Kathren, R. L. (1991). “Modified biokinetic model for uranium from
analysis of acute exposure to UF6.” Health Phys. 60:335–342.
Fisher, D. R.; Briant, J. K (1994). “Assessment of accidental intakes of uranyl acetylacetonate
(UAA).” Radiat. Prot. Dosim. 53:263–267.
Foulkes, E. C. (1990). “The concept of critical levels of toxic heavy metals in target tissues.”
Crit. Rev. Toxicol. 20:327–339.
Galibin, G. P.; Parfenov, Y. D. (1971). “Inhalation study on metabolism of insoluble uranium
compounds.” In Walton, W. H., ed., Inhaled Particles 111. Vol. 1, 201–208. Old Woking Surrey,
United Kingdom: Unwin Bros. Ltd.
Gilman, A. P.; Villeneuve, D. C.; Secours, V. E.; Yagminas, A. P.; Tracy, B. L.; Quinn, J. M.;
Valli, V. E.; Moss, M. A. (1998). “Uranyl nitrate: 91-day toxicity studies in the New Zealand
white rabbit.” Toxicol. Sci. 41:129-137.
Gonnen, R.; Kol, R.; Laichter, Y.; Marcus, P.; Halicz, L.; Karpas, Z. (2000). “Determination of
uranium in human hair by acid digestion and FIAS-ICPMS.” J. Radioanal. Nucl. Chem.
243:559–562.
Guilmette, R. A.; Parkhurst, M. A.; Miller, G.; Hahn, E. F.; Roszell, L. E.; Daxon, E. G.; Little,
T. T.; Whicker, J. J.; Cheng, Y. S.; Traub, R. J.; Lodde, G. M.; Szrom, F.; Bihl, D. E.; Creek,
K. L.; McKee, C. B. (Project Administrator) (2004). “Human health risk assessment of Capstone
depleted uranium aerosols.” Attachment 3 to the Capstone Summary Report. October 2004.
Hang, W.; Zhu, L. W.; Zhong, W. W.; Mahan, C. (2004). “Separation of actinides at ultra-trace
level from urine matrix using extraction chromatography-inductively coupled plasma mass
spectrometry.” J. Analyt. Atomic Spectrometry 19:966–972.
Harris, W. B. (1961). “The experimental clearance of uranium dust from the human body.” In
Davies, C. N., ed. Inhaled Particles and Vapors. Vol. I. London: Pergamon Press; 209–220.

90
Harrison, J. D.; Metivier, H.; Leggett, R. W.; Nosske, D.; Paquet, F.; Phipps, A.; Taylor, D.
(2001). “Reliability of the ICRP's dose coefficients for members of the public. II. Uncertainties
in the absorption of ingested radionuclides and the effect on dose estimates.” Radiat. Prot.
Dosim. 95:295–308.
Hinners, T. A.; Terrill, W. J.; Kent, J. L.; Colucci, A. V. (1974). “Hair-metal binding.”
Environmental Health Perspectives 8:191–199.
Hodgson, A.; Moody, J. C.; Stradling, G. N.; Bailey, M. R.; Birchall A. (2000). Application of
the ICRP Respiratory Tract Model to Uranium Compounds Produced During the Manufacture of
Nuclear Fuel. NRPB Report M1156. Chilton, UK.
ICRP (1959). International Commission on Radiological Protection. Report of Committee 2 on
Permissible Dose for Internal Radiation. ICRP Publication 2. Oxford: Pergamon Press.
ICRP (1977). International Commission on Radiological Protection. Recommendations of the
International Commission on Radiological Protection. ICRP Publication 26. Oxford: Pergamon
Press.
ICRP (1979). International Commission on Radiological Protection. Limits for Intakes of
Radionuclides by Workers. ICRP Publication 30, Part 1. Oxford: Pergamon Press.
ICRP (1980). International Commission on Radiological Protection. Limits for Intakes by
Workers. ICRP Publication 30, Part 2. Oxford: Pergamon Press.
ICRP (1981). International Commission on Radiological Protection. Limits for Intakes by
Workers, ICRP Publication 30, Part 3. Oxford: Pergamon Press.
ICRP (1987). International Commission on Radiological Protection. Lung Cancer Risk from
Indoor Exposures to Radon Daughters. ICRP Publication 50. Oxford: Pergamon Press.
ICRP (1988). International Commission on Radiological Protection. Limits for Intakes by
Workers. ICRP Publication 30, Part 4. Oxford: Pergamon Press.
ICRP (1991). International Commission on Radiological Protection. 1990 Recommendations of
the International Commission on Radiological Protection. ICRP Publication 60. Oxford:
Pergamon Press.
ICRP (1993a). International Commission on Radiological Protection. Age-dependent Doses to
Members of the Public from Intake of Radionuclides, Part 2, ICRP Publication 67. Oxford:
Pergamon Press.
ICRP (1993b). International Commission on Radiological Protection. Protection Against
Radon-222 at Home and at Work. ICRP Publication 65. Oxford: Pergamon Press.
91
ICRP (1994a). International Commission on Radiological Protection. Human Respiratory Tract
Model for Radiological Protection. ICRP Publication 66. Oxford: Pergamon Press.
ICRP (1994b). International Commission on Radiological Protection. Dose Coefficients for
Intakes of Radionuclides by Workers. ICRP Publication 68. Oxford: Pergamon Press.
ICRP (1995a). International Commission on Radiological Protection. Age-dependent Doses to
Members of the Public from Intake of Radionuclides, Part 3, ICRP Publication 69. Oxford:
Pergamon Press.
ICRP (1995b). International Commission on Radiological Protection. Age-dependent Doses to
Members of the Public from Intake of Radionuclides, Part 4, ICRP Publication 71. Oxford:
Pergamon Press.
ICRP (2002a). International Commission on Radiological Protection. Supporting Guidance 3.
Guide for the Practical Application of the ICRP Human Respiratory Tract Model. Oxford:
Pergamon Press.
ICRP (2002b). International Commission on Radiological Protection. Basic Anatomical and
Physiological Data for Use in Radiological Protection: Reference Values. ICRP Publication 89.
Oxford: Pergamon Press.
ICRP (2006). International Commission on Radiological Protection. Human Alimentary Tract
Model for Radiological Protection. ICRP Publication 100. Oxford: Pergamon Press.
ICRP (2008). International Commission on Radiological Protection. The 2007
Recommendations of the International Commission on Radiological Protection. ICRP
Publication 103. Oxford: Pergamon Press.
Jackson, S. (1966). “Creatinine in urine as an index of urinary excretion rate.” Health Phys.
12:843–850.
Kalkwarf, D. R. (1979). Solubility Classification of Airborne Products from Uranium Ores and
Tailings Piles. NUREG/CR-0350, PNL-2870. Pacific Northwest Laboratory, Richland,
Washington.
Karpas, Z.; Halicz, L.; Roiz, J.; Marko, R.; Katorza, E.; Lorber, A.; Goldbart, Z. (1996).
“Inductively coupled plasma mass spectrometry as a simple, rapid, and inexpensive method for
determination of uranium in urine and fresh water. Comparison with LIF.” Health Phys. 71:879–
885.
Karpas, Z.; Lorber, A.; Elish, P.; Marcus, P.; Roiz, J.; Marko, R.; Kol, R.; Brikner, D.; Halicz, L.
(1998). “Uranium in urine – normalization to creatinine.” Health Phys. 74:86–90.
Karpas, Z. (2001). “Uranium Bioassay - Beyond Urinalysis.” Health Phys. 81:460–463.

92
Karpas, Z.; Lorber, A.; Sela, H.; Paz-Tal, O.; Hagag, Y.; Kurttio, P.; Salonen, L. (2005a).
“Measurement of the U-234/U-238 ratio by MC-ICPMS in drinking water, hair, nails, and urine
as an indicator of uranium exposure.” Health Phys. 89:315–321.
Karpas, Z.; Paz-Tal, O.; Lorber, A.; Salonen, L.; Komulainen, H.; Auvinen, A.; Saha, H.;
Kurttio, P. (2005b). “Urine, hair, and nails as indicators for ingestion of uranium in drinking
water.” Health Phys. 88:229–242.
Kathren, R. L.; Moore, R. H. (1986); “Acute accidental inhalation of U: A 38-year follow-up.”
Health Phys. 51:609-619.
Kathren, R. L.; Burklin, R. K. (2008). “Acute chemical toxicity of uranium.” Health Phys.
94:170–179.
Kotrappa, P.; Bhanti, D. P.; Jha, G. (1979). “Measurement of specific alpha radioactivity with
respect to size for uranium ore dust using aerosol centrifuge.” Health Phys. 36:738–740.
Kramer, G. H.; Hauck, B. M.; Allen, S. A.; Dantas, B. M.; Dantas, A. L.; Azeredo, A. (2003).
“Lung counting: summing techniques to reduce the MDA.” Health Phys. 85:220–227.
Krystek, P.; Ritsema, R. (2008). “An incident study about acute and chronic human exposure to
uranium by high-resolution inductively coupled plasma mass spectrometry.” Int. J. Hygiene
Environ. Health, Jan 8, 2008 (Epub ahead of print).
Leach, L. J.; Yuile, C. L.; Hodge, H. C.; Sylvester, G. E.; Wilson, H. B. (1973). “A five-year
inhalation study with natural uranium dioxide (UO2) dust—II. Post-exposure retention and
biologic effects in the monkey, dog and rat.” Health Phys. 25:239–258.
Leggett, R. W. (1989). “The behavior and chemical toxicity of uranium in the kidney: A
reassessment.” Health Phys. 57:365–383.
Leggett, R. W. (1992). “A generic age-specific biokinetic model for calcium-like elements.”
Radiat. Prot. Dosim. 41:183–198.
Leggett, R. W. (1994). “Basis for the ICRP's age-specific biokinetic model for uranium.” Health
Phys. 67:589–610.
Leggett, R. W.; Harrison, J. D. (1995). “Fractional absorption of ingested U in humans.” Health
Phys. 68:484–498.
Leggett, R. W.; Eckerman, K. F.; Boice, J. D. (2005). “A respiratory model for uranium
aluminide based on occupational data.” J. Radiol. Prot. 25:1–12.
Luessenhop, A.J.; Gallimore, J. C; Sweet, W. H.; Struxness, E. G.; Robinson, J (1958). The
toxicology in man of hexavalent uranium following intravenous administration.” Amer. J. Roent.
79:83-100.

93
López, R.; Díaz, S.; Ubios, A. M.; Cabrini, R. L. (2000). “Percutaneous toxicity of uranyl nitrate:
its effect in terms of exposure area and time.” Health Phys. 78:434–437.
Marco, R.; Katorza, E.; Gonen, R.; German, U.; Tshuva, A.; Pelled, O.; Paz-Tal, O.; Adout, A.;
Karpas, Z. (2008). “Normalisation of spot urine samples to 24-h collection for assessment of
exposure to uranium.” Rad. Prot. Dosim. 130:213–223.
Maxell, S. L; Fauth, D. J. (2002). Rapid Actinide Column Extraction Methods for Bioassay
Samples. WSRC-MS-2002-00997. Westinghouse Savannah River Company.
Maynard, E. A.; Hodge, H. C. (1949). “Studies of the toxicity of various uranium compounds
when fed to experimental animals.” In Voegetlin, C.; Hodge, H. C., ed., The Pharmocology and
Toxicology of Uranium Compounds. National Nuclear Energy Service, Division VI, Vol. 1, 309-
376. New York: McGraw-Hill.
McDiarmid, M. A.; Engelhardt, S. M.; Dorsey, C. D.; Oliver, M.; Gucer, P.; Wilson, P. D.;
Kane, R.; Cernich, A.; Kaup, B.; Anderson, L.; Hoover, D.; Brown, L.; Albertini, R.; Gudi, R.;
Squibb, K. S. (2009). “Surveillance results of depleted uranium-exposed Gulf War I veterans:
Sixteen years of follow-up.” J. Toxicol. Environ. Health A. 72:14-29.
McLaughlin, D. A. (2005). Oak Ridge National Laboratory Internal Dosimetry Program
Technical Basis Document, Revision 7, December 21, 2005.
Métivier, H.; Poncy, J. L.; Rateau, G., Stradling, G. N.; Moody, J. C.; Gray, S. A. (1992).
“Uranium behaviour in the baboon after the deposition of a ceramic form of uranium dioxide and
uranium octoxide in the lungs: implications for human exposure.” Radioprotection 27:263–281.
Mohagheghi, A. H.; Shanks, S. T.; Zigmond, J. A.; Simmons, G. L.; Ward, S. L. A (2005). “A
Survey of Uranium and Thorium Background Levels in Water, Urine, and Hair and
Determination of Uranium Enrichments by ICP-MS.” J. Radioanalyt. Nucl. Chem. 263:189–195.
Monleau, M.; De Meo, M.; Paquet, F.; Chazel, V.; Gerard Dumenil, G.; Donnadieu-Claraz, M.
(2006). “Genotoxic and Inflammatory Effects of Depleted Uranium Particles Inhaled by Rats.”
Toxicological Sciences 89:287–295.
Moore, R. H.; Kathren R. L. (1985). “A World War II uranium hexafluoride inhalation event
with pulmonary implications for today.” J. Occup. Med. 27:753–756.
Morrow, P. E.; Gibb, F. R.; Beiter, H. D. (1972). “Inhalation studies of uranium trioxide.” Health
Phys. 23:273–280.
Morrow, P. E.; Gelein, R. M.; Beiter, H. D.; Scott, J. B.; Picano, J. J.; Yuile, C. L. (1982).
“Inhalation and intravenous studies of UF6/UO2F2 in dogs.” Health Phys. 43:859–873.

94
Morrow, P. E. (1984). “Biokinetics and toxicology of uranium.” In Moore, R. H., ed. Biokinetics
and analysis of uranium in man. United States Uranium Registry, USUR-05, HEHF-47,
1984:E1-E27. Available from National Technical Information Service, 5285 Port Royal Road,
Springfield, VA, 22151.
NCRP (1987). Use of Bioassay Procedures for Assessment of Internal Radionuclide Deposition,
National Council on Radiation Protection and Measurements, NCRP Report No. 87. Bethesda,
Maryland.
NCRP (2006). Development of a Biokinetic Model for Radionuclide-contaminated Wounds and
Procedures for Their Assessment, Dosimetry and Treatment. NCRP Report No. 156. Bethesda,
Maryland: National Council on Radiation Protection and Measurements.
NHANES (2005). Third National Report on Human Exposure to Environmental Chemicals.
Centers for Disease Control, U.S. Department of Human and Health Services, Public Health
Service, Atlanta, Georgia.
Ough, E. A.; Lewis, B. J.; Andrews, W. S.; Bennett, L. G. I.; Hancock, R. G. V.;
Scott, K. (2002). “An examination of uranium levels in Canadian Forces personnel who served
in the Gulf War and Kosovo.” Health Phys. 82:527–532.
Parrish, R. R.; Thirlwall, M.; Pickford, C.; Horstwood, M. S. A.; Gerdes, A.; Anderson, J.;
Coggon, D. (2006). “Determination of 238
U/235
U, 236
U/238
U and uranium concentration in urine
using SF-ICP-MS and MC-ICP-MS: An interlaboratory comparison.” Health Phys. 90:127–138.
Pellow, P. G.; Stradling, G. N.; Hodgson, A.; Fell, T. P.; Phipps, A.; Ellender, M. (1996).
Biokinetics of Uranium Tributyl Phosphate in the Rat: Implications for Occupational Exposure.
NRPB Report M682. Chilton, UK.
Petitot, F.; Felon, S.; Moreels, A. M.; Claraz, M.; Delissen, O.; Tourlonias, E.; Dhieux, B.;
Maubert, C.; Paquet, F. (2007). “Incorporation and distribution of uranium in rats after a
contamination on intact or wounded skin.” Health Phys. 92:464–474.
Pomroy, C.; Noel, L. (1981). “Retention of uranium thorax burdens in fuel fabricators.” Health
Phys. 41:393–400.
Price, A. (1989). “Review of methods for assessment of intake of uranium by workers at BNFL
Springfields.” Radiat. Prot. Dosim. 26:35–42.
Priest, N. D.; Howell, G. R.; Grenn, D.; Haines, J. W. (1982). “Uranium in bone – metabolic and
autoradiographic studies in rat.” Human Toxicol. 1:97–114.
Rich, B.; Hinnefeld, S.; Lagerquist, C.; Mansfield, W.; Munson, L.; Wagner, E.; Vallario, E.
(1988). Health Physics Manual of Good Practices at Uranium Facilities. EGG-2530, UC-41,
U.S. Department of Energy.

95
Schieferdecker, H.; Dilger, H.; Doerfel, H. (1985). “Inhalation of U aerosols from UO2 fuel
element fabrication.” Health Phys. 48:29–48.
Schaumlöffel, D.; Giusti, P.; Zoriy, M. V.; Pickhardt, C.; Szpunar, J.; Lobinski, R.; Becker, S. J.
(2005). “Ultratrace determination of uranium and plutonium by nano-volume flow injection
double-focusing sector field inductively coupled plasma mass spectrometry (nFI–ICP-SFMS).”
J. Analyt. Atomic Spectrometry 20:17–21.
Spoor, N. L.; Hursh, J. B. (1973). “Protection criteria.” In Hodge, H. C.; Stannard, J. N.; Hursh,
J. B.; Eds. Uranium, Plutonium, Transplutonic Elements: Handbook of Experimental
Pharmacology, Vol. 36, Chap. 5., 241–270, Springer-Verlag, New York.
Squibb, K. S.; Leggett, R. W.; McDiarmid, M. (2005). “Prediction of renal concentrations of
depleted uranium and radiation dose in Gulf War veterans with embedded shrapnel.” Health
Phys. 89:267–273.
Stopps, G. J.; Todd, M. (1982). The Chemical Toxicity of Uranium with Special Reference to
Effects on the Kidney and the Use of Urine for Biological Monitoring. INFO-0074. Atomic
Energy Control Board of Canada, Box 1046, Ottawa, K1P5S9.
Stradling, G. N.; Stather, J. W.; Strong, J. C.; Sumner, S. A.; Towndrow, C. G.; Moody, J. C.;
Sedgwick, D.; Cooke, N. (1985). “The metabolism of some industrial uranium tetrafluorides
after deposition in the rat lung.” Human Toxicol. 4:159–168.
Stradling, G. N.; Stather, J. W.; Gray, S. A.; Moody, J. C.; Ellender, M., Hodgson, A.;
Sedgwick, D.; Cooke, N. (1987). “Metabolism of uranium in the rat after inhalation of two
industrial forms of ore concentrate: The implications for occupational exposure.” Human
Toxicol. 4:563–572.
Stradling, G. N.; Stather, J. W.; Price, A.; Cooke, N. (1989a). “Limits on intake and the
interpretation of monitoring data for workers exposed to industrial uranium bearing dusts.”
Radiat. Prot. Dosim. 26:83–87.
Stradling, G. N.; Stather, J. W.; Strong, J. C.; Sumner, S. A.; Moody, J. C.; Towndrow, C. G.;
Hodgson, A.; Sedgwick, D.; Cooke, N. (1989b). “Metabolism of an industrial UO2 dust after
deposition in the rat lung.” Human Toxicol. 4:563–572.
Stradling, G. N.; Hodgson, A.; Ansoborlo, E.; Berard, P.; Etherington, G.; Fell, T.; Rance, E.;
Le Guen, B. (2002). Industrial Uranium Compounds: Exposure Limits, Assessment of Intake and
Toxicity after Inhalation. NRPB Report W22. Chilton, UK.
Struxness, E. G.; Luessenhop, A. J.; Bernard, S. R.; Gallimore, J. C. (1956). “The distribution
and retention of hexavalent uranium in man.” Proceedings of International Conference on the
Peaceful Uses of Atomic Energy, Vol. 10, pp. 186–195. United Nations, New York.

96
Sula, M. J.; Carbaugh, E. H.; Bihl, D. E. (1989). Technical Basis for Internal Dosimetry at
Hanford. PNL-6866, UC-41. Pacific Northwest Laboratory, Richland, Washington.
SuLu, Zhao Fu-Yao (1990). “Nephrotoxic limit and annual limit on intake for natural U.” Health
Phys. 58:619–623.
Sutton, M.; Burastero, S. R. (2004). “Uranium(VI) solubility and speciation in simulated
elemental human biological fluids.” Chem. Res. Toxicol. 17:1468–1480.
Swift, J. A. (1996). “Morphology and histochemistry of human hair.” In Jolles, P.; Zahn, H.;
Hoecker, H., Formation and Structure of Human Hair, 149–175. Birkhaueser, Basel,
Switzerland.
Szrom, F., Alberth, D.P. (2007). “Operation Iraqi freedom depleted uranium bioassay screening
program update.” Health Physics Program, U.S. Army Center for Health Promotion and
Preventive Medicine, 2007 Force Health Protection Conference, August 6–10, 2007.
Todorov, T. I.; Ejnik, J. W.; Millick, F. G.; Centeno, J. A. (2007). “Chemical and histological
assessment of depleted uranium in tissues and biological fluids.” In Depleted Uranium
Properties, Uses, and Health Consequences. Miller, A. C., ed. CRC Press, Boca Raton, Florida.
UNSCEAR (2000). Sources and Effects of Ionizing Radiation. United Nations Scientific
Committee on the Effects of Atomic Radiation UNSCEAR 2000 Report to the General Assembly
with Scientific annexes. New York: United Nations.
US Army Medical Command. Medical management of Army personnel exposed to depleted
uranium (DU); OTSG/MEDCOM Policy Memo 07-022, 26 June 2007; Ft. Sam Houston, TX:
Office of the US Army Surgeon General; 2007. (Available at
http://www.pdhealth.mil/downloads/OTSG-MEDCOM_Policy_Memo_07-022.pdf.)
USEPA (1999a). Understanding Variation in Partition Coefficient, Kd Values, Vol 1: The Kd
Model, Methods of Measurement, and Application of Chemical Reaction Codes. EPA 402-R-99-
004A. U.S. Environmental Protection Agency, Washington, DC.
USEPA (1999b). Understanding Variation in Partition Coefficient, Kd values, Vol 2: Review of
Geochemistry and Available Kd Values for Cadmium, Cesium, Chromium, Lead, Plutonium,
Radon, Strontium, Thorium, Tritium (3H), and Uranium. EPA 402-R-99-004B. U.S.
Environmental Protection Agency, Washington, DC.
USEPA (1988). Limiting Values of Radionuclide Intake and Air Concentration and Dose
Conversion Factors for Inhalation, Submersion, and Ingestion. EPA-520/1-88-020;
Environmental Protection Agency, Washington, DC, United States Government Printing Office;
Federal Guidance Report 11.
USNRC (1974). Applications of Bioassay for Uranium. Regulatory Guide 8.11. U.S. Nuclear
Regulatory Commission, Washington, DC.

97
USNRC (1988). Bioassay at Uranium Mills. Regulatory Guide 8.22. U.S. Nuclear Regulatory
Commission, Washington, DC.
USNRC (1991). Standards for Protection Against Radiation. Nuclear Regulatory Commission,
Washington, DC: United States Government Printing Office; Title 10, Code of Federal
Regulations, Part 20, Appendix B.
U.S. National Research Council (2008). Review of Toxicologic and Radiologic Risks to Military
Personnel from Exposure to Depleted Uranium During and After Combat. The National
Academies Press, Washington, DC.
Voegtlin, C.; Hodge, H. C., eds. (1953). Pharmacology and Toxicology of Uranium Compounds,
National Nuclear Energy Series, Division VI - Volume I, Parts III and IV. McGraw-Hill, New
York.
West, C. M.; Scott, L.; Schultz, N. B. (1979). “Sixteen years of uranium personnel monitoring
experience. In retrospect.” Health Phys. 36:665–669.
WHO (2001). Depleted Uranium. Sources, Exposure and Health Effects. Department of
Protection of the Human Environment, WHO/SDE/PHE/01.1. World Health Organization,
Geneva.
Wrenn, M. E.; Durbin, P. W.; Howard, B.; Lipsztein, J.; Rundo, J.; Still, E. T.; Willis, D. L.
(1985). “Metabolism of ingested U and Ra.” Health Phys. 48:601–633.


1
APPENDIX A: BASIC COMPONENTS OF A URANIUM
BIOASSAY PROGRAM
A.1 . Common Methods of Monitoring for Uranium
A uranium monitoring program should include bioassay measurements for individual workers as
well as direct monitoring of workplace conditions. A bioassay measurement is defined as an
analysis of radioactive material in biological material excreted or otherwise removed from the
body (in vitro measurement) or in body organs or the whole body by external measurement
(in vivo measurement).
Continuous air monitoring during work hours generally is the primary method of monitoring
uranium exposure in the workplace. An air monitoring program should include not only
determination of the mass concentration and activity concentration of uranium in air but also
measurement of the solubility of aerosols in which uranium is carried. The main purpose of the
solubility measurements is to determine whether a substantial portion of airborne material is
likely to be insoluble (i.e., dissolved at an extremely slow rate) in lung fluid and thus to present
an increased radiation hazard due to long-term retention in the lungs.
Other methods of monitoring of the workplace include use of portable survey meters to measure
alpha or beta activity on surfaces or gamma radiation in air, and detection of removable
radionuclides on surfaces based on smear samples. These types of measurements are not easily
converted to meaningful estimates of intake of uranium and are not addressed in this report.
Bioassay measurements provide checks on the effectiveness of direct monitoring of workplace
conditions and allow derivation of radiation dose estimates and uranium concentrations in the
kidneys when intakes of uranium are identified. Three main types of bioassay measurements are
used in monitoring programs for uranium:
measurement of uranium in urine;
measurement of uranium in feces;
in vivo measurements of uranium in the chest.
In addition, nostril swabs are used to check for possible inhalation of uranium following an
accidental release. Nostril swabs are not reliable quantitative measures of inhaled uranium and
are not addressed in this report.
Some investigators have evaluated hair and toenails as bioassay media for uranium (Karpas
2001; Karpas et al. 2005; Mohagheghi et al. 2005). As discussed in Appendix B, the value of
hair or nail samples as measures of uranium intake is limited by the possible presence of
significant external deposits of uranium that cannot be removed by washing the samples.

2
A.2 . Frequency and Normalization of Bioassay Measurements
Bioassay measurements are divided into four categories:
baseline measurements;
routine measurements during potential exposure to uranium;
special measurements;
termination measurements.
Baseline bioassay measurements are made prior to initial work activities involving uranium.
Routine bioassay measurements are made at regular intervals during the period of work with
uranium to confirm that appropriate controls exist and to assess radiation dose and the
concentration of uranium in the kidneys associated with routine intake of uranium.
Special bioassay measurements may be made if an abnormally high intake of uranium is known
or suspected. Circumstances indicating the need for special measurements include:
presence of unusually high levels of radionuclides in nasal passages;
entry into contaminated areas without appropriate exposure controls;
operational events with a reasonable likelihood that a worker was exposed to unknown
quantities of airborne radioactive material (e.g., loss of container integrity);
incidents that result in entry of radionuclides through wounds;
an unfavorable trend in routine measurements.
A termination bioassay measurement is made when a worker is no longer subject to the uranium
bioassay program because of termination of employment or change in work location.
Urinary uranium is the most common type of bioassay measurement made for uranium workers.
Action levels for urinary uranium generally are given in terms of 24-h urinary excretion of
uranium. In practice, the rate of excretion of uranium in urine often is based on a spot sample
rather than 24-h collection of urine. Due to diurnal variation in the rate of urinary excretion of
uranium, the mass or activity of uranium in a spot sample should be normalized to a 24-h
excretion rate on the basis of the creatinine content of the sample (Jackson, 1966; Karpas et al.
1998; Marco et al. 2008). Reference values for 24-h creatinine excretion are 1.7 g/d for an adult
male and 1.0 g/d for an adult female (ICRP 2002). If the creatinine content of a spot urine
sample has not been determined, 24-h urinary uranium should be estimated by normalizing the
excreted volume of urine to the reference 24-h volume of 1.6 L for adult males and 1.2 L for
adult females (ICRP 2002). Although the action levels given in this report are based on
characteristics of a reference adult male, estimates of 24-h urinary uranium based on spot
samples should be based on gender-specific 24-h values for urine volume and creatinine
excretion.
Determination of the frequency of routine urine measurements depends mainly on the exposure
potential of the individual. At least quarterly sampling is recommended for workers who are
frequently near uranium sources. Weekly urine sampling is recommended for workers such as
uranium miners or millers who routinely work in areas with elevated concentrations of airborne
uranium.
3
When an elevated intake of uranium is known or suspected, special urinalyses should be used to
estimate the level of intake and determine the rate of removal of uranium from the body. Special
samples might be collected daily for a few days following an incident and at wider intervals after
a pattern of change with time in urinary uranium starts to emerge. Special samples are ended
when background concentrations of urinary uranium are approached. Measurements involving
about 5000 individuals across the U.S. indicate that the concentration of uranium in urine in
persons without occupational exposure typically is on the order of 9 ng per liter (geometric
mean) and rarely above 50 ng per liter (NHANES 2005).
Fecal bioassay generally is not collected routinely but may be included in special bioassay
programs as an aid in determining total intake and the possibility of accumulation of insoluble
activity in the lungs. In case of inhalation of a relatively insoluble uranium aerosol, there may be
little absorption of uranium to blood and hence little urinary excretion of uranium, but typically
there is still clearance from the lungs to feces. A low urinary to fecal excretion ratio for uranium
in a worker provides suggestive evidence that all or nearly all of the inhaled uranium is in
relatively insoluble form.
In vivo thorax measurements should be made routinely on an annual or semi-annual basis, even if
airborne uranium is thought to be in soluble form. Special in vivo thorax measurements should
be used to estimate the level of intake in the event of known or suspected short-term exposure to
relatively insoluble uranium. Exposure to relatively insoluble forms of uranium may not be
revealed by urinalysis due to a low rate of dissolution of the inhaled material in the lungs and
subsequent absorption of uranium to blood.
A.3 . Overview of Analytical Methods for Uranium Bioassay
A.3.1. In vitro Measurement of Uranium
In general, methods of measurement of urinary uranium also apply to fecal uranium except that
for fecal measurement the matrix requires extensive preparation. For example, for alpha
spectroscopy the preparation of fecal samples includes ashing, cleaning by co-precipitation, and
solvent extraction followed by electrodeposition and alpha spectroscopy (ATSDR 1999).
Bogard 1996 reviewed approximately 50 articles on measurements of uranium in excreta and
tissues. The major methods identified include alpha spectrometry, liquid scintillation
spectrometry, fluorometry, phosphorometry, neutron activation analysis, fission-track counting,
UV-visible absorption spectrophotometry, resonance ionization mass spectrometry, and
inductively-coupled plasma mass spectrometry (ICP-MS). Table A.1 provides an overview of
the analytical methods identified (Bogard 1996).
Articles published in the last few years describe new approaches for sample analysis such as
laser ablation ICP-MS and chromatography-inductively coupled plasma mass spectrometry.
Also, there has been improved effectiveness and reduced cost of some older methods.
A recent review by Todorov et al. 2007 on analytical methods for detection of uranium in tissues
and biological fluids contains a comparative summary of methods including sample preparation

4
and cost (Table A.2). The review by Todorov and coworkers was concerned with measurement
of depleted uranium, but the same methods are applicable to natural or enriched uranium.
Table A.1 Uranium detection levels for different analytical methods (Bogard 1996)
Method Measurement
level
(ng/L)
Detection
limit
(ng/L) Description
UV-visible
spectrophotometry
5,000–66,000 NAa Uranium determined from
absorbance of uranyl-arsenazo III at
653 nm
UV-visible
spectrophotometry (variation)
NA 290
Measurement of difference in
absorbance at 665 and 800 nm using
dual-beam spectrophotometer. Fluorometry (NaF and
NaF/LiF) 100 ± 100 NA Based on ASTM standard (1983)
UV laser fluorometry 1000–7000 NA Use of laser provides frequency
control for used interference
UV laser fluorometry 0.01 NA Co-precipitating uranium from
aqueous solution with CaF2
Kinetic phosphorescence 15–30 10
Estimates uranyl ion concentration by
phosphorescence intensity after
pulsed laser excitation Alpha particle energy
spectrometry
NA
7E-07 1E-03 2E-03
8.0 40
U-232 U-233 U-234 U-235 U-238
Neutron activation
analysis
1–5000
NA
U-238
Fission-track analysis
100–700
10
U-235
Delayed neutron analysis
500
NA
U-235
Resonance ionization mass
spectroscopy 1000 50
Inductively coupled
plasma-mass spectrometry
74–372
2000–8000 NA
U-235 U-238
aNA = not available.

5
Table A.2 Instrument analysis techniques used for uranium in
biological samples (Todorov 2007)
Method
Total U
detection
limit
(ng/L)
Type of
analysis
possible Precision
a Sample
throughput Cost
Kinetic
phosphorescence
analysis 10 Total U 5% High Low
Alpha spectrometry 40 Total and
isotopic U 10% Low Moderate
Thermal ionization
mass spectrometry <1
Total and
isotopic U 0.02% Low High
Instrumental neutron
activation analysis 10
Total and
isotopic U 10% Low High
Delayed neutron
counting 10
Total and
isotopic U 10% Moderate High
Inductively coupled
plasma-mass
spectrometry
<1 Total and
isotopic U 0.1–5% High Moderate
aRelative standard deviation.
Use of ICP-MS for analysis of uranium in bioassay samples has increased considerably in recent
years (Becker 2005). Advantages of this method compared with other common techniques such
as alpha spectrometry include some or all of the following: high sensitivity, low cost, ease of
sample preparation, and short analysis time (Karpas et al 1996; Maxell and Fauth 2002;
Hang et al. 2004; Bouvier-Capely et al. 2004; Becker 2005). Table A.3 compares limits of
detections of variations of ICP-MS.

6
Table A.3 Limits of detection of variations of the ICP-MS method
of measuring uranium in urine
Reference Sample
Preparation Instrument
a Limit of
detection
(ng/L)
Becker 2004 Laser ablation SF-ICP-MS 0.1
Karpas et al. 1996
Nitric acid dilution
Q- ICP-MS
3.0
Hang et al. 2004
Online extraction
Q-ICP-MS
2.0
Schaumlöffel et al. 2005
Digestion,
preconcentration
SF-ICP-MS
1.6
Becker, et al. 2002
Digestion
SF-ICP-MS
0.1
Mohagheghi et al. 2005
Direct dilution
Q-ICP-MS
15
Parrish 2006
Digestion, extraction
MC-ICP-
MS
<1
Krystek et al. 2008
Direct dilution
HR-ICP-MS
0.2
aSF = sector field, Q = quadrupole, MC = multi-collector, HR = high resolution.
A.3.2. In vivo Measurement of Uranium
External measurements over the chest are used to detect accumulation of uranium in the lungs.
The preferred detector for uranium in vivo counting is a germanium detector (WHO 2001), but
sodium iodide and phoswich detectors have also been used (ATSDR 1999).
The 235
U activity in the lungs is estimated from measurement of photon emissions from 235
U
(186 keV). In some measurement systems the 238
U activity is also estimated by measurement of
photon emissions from its daughter 234
Th (63 keV and 93 keV), assuming that 234
Th is in
equilibrium with 238
U.
In vivo counting systems generally are calibrated using phantoms made of polystyrene or other
tissue equivalent material and having shapes similar to the human torso. Uranium sources with
known activity are inserted into the phantom at locations where uranium would be expected to
accumulate in a human body, and relationships are determined between the known and detected
activity (DOE 1988).
The accuracy of chest measurements of uranium is limited by:
the weak photon energies, particularly for 234
Th;
7
the low yield of photon emissions;
uncertainty in the calibration associated with uncertainties and individual differences in
chest wall thickness and location of internally deposited uranium in the chest;
uncertainty in the assumption of equilibrium of 234
Th and 238
U.
Additionally, the level of 234
U in the lungs is not revealed by external measurements and must be
estimated on the basis of an assumed isotopic composition of inhaled uranium. The isotopic
composition of inhaled uranium is reasonably well known in some cases from information on the
form of uranium being handled and also can be estimated from the relative concentrations of
uranium isotopes in urine of the exposed worker.
The minimum detectable activity (MDA) of total uranium in the chest depends on the type of
detector used, the counting time, and the isotopic composition of uranium in the chest. The
MDA for a counting time of 45-60 min using a germanium detector is on the order of 4 Bq of 235
U and 100 Bq of 238
U (WHO 2001; Kramer et al. 2003). The MDA for total activity in the
chest depends on the percentage of total activity represented by 235
U and 238
U and hence on the
isotopic composition of inhaled uranium.
A.4 . Examples of Ongoing Uranium Bioassay Programs
A.4.1. Oak Ridge National Laboratory
Oak Ridge National Laboratory (ORNL) is a Department of Energy (DOE) operation. DOE
requirements for occupational radiation protection are given in Title 10 of the Code of Federal
Regulations, Part 835 (10CFR835). These requirements include specific dose limits but are also
subject to the ALARA (As Low As Reasonably Achievable) principle. Dose limits specified in
10CFR835 are in terms of the committed effective dose equivalent (CEDE) as defined in ICRP
Publication 26 (1977). In the following description of the ORNL program, “dose” refers to
CEDE.
10CFR835 requires an employee to participate in a bioassay program if intakes of uranium or
other radionuclides in any 1-y period are likely to result in a dose exceeding 0.001 Sv. At a
minimum, bioassay programs must be able to demonstrate compliance with a dose limit of
0.05 Sv, but the goal is to keep doses below 0.001 Sv.
The bioassay program at ORNL addresses potential exposure to a number of different
radionuclides including uranium (McLaughlin 2005). The program bases monitoring
requirements on exposure trends and measured internal doses. Data from 1992 through 2004
indicate that ~15% of employees participate in the monitoring program, >95% of monitored
workers have no detectable intakes, >90% of detected intakes resulted in an estimated dose less
than 0.001 Sv, and all intakes resulting in doses of 0.001 Sv or greater arose from abnormal
events. From the evaluation of historical records it was determined that:
routine bioassay monitoring has detected intakes that were not identified by other
indicators;
internal doses exceeding 0.001 Sv are unusual;
the potential for exceeding regulatory dose limits exists at ORNL.

8
Participation in the routine monitoring program generally is based on an individual’s radiological
work history and present type of work, but any employee may choose to participate in the
program. Participants who have not performed radiological work for one year are considered for
removal from the program. The minimum monitoring frequency is an annual urinalysis and
in vivo lung count. More frequent monitoring is required in many workers on the basis of the
type of work performed, potential for exposure, and the individual’s work history.
Special monitoring is implemented only after an unplanned, uncontrolled radiation release that
could result in a dose >0.001 Sv. Following an incident, the need for special bioassay sampling
is determined on a situation specific basis by the Internal Dosimetrist and Surveillance Section
personnel. If the Internal Dosimetrist is unavailable, special monitoring can be initiated by any
of a number of possible findings such as a positive nostril swab, detection of radionuclides inside
a worker’s respiratory equipment, exposure to a specified level of uranium in air, identification
of specified levels of external alpha or beta-gamma activity on certain areas of the body, and
identification of specified levels of removable alpha or beta-gamma activity in and around work
areas.
Action levels that have been established to ensure that follow-up monitoring is taken as
appropriate are listed in Table A.4.
Table A.4 ORNL administrative control action levels
for an accidental exposure
>0.005 Sv Collect and analyze at least three consecutive 24-h urine
samples. Collect and analyze 24-h urine sample
approximately one week after intake. Continue to sample
on regular basis. Fecal sampling should be considered.
Perform whole body (or appropriate organ) count every two
to three days following intake.
Review air sample data.
Perform bioassay of others in area if appropriate.
Check external dose for the year and limit exposure as
necessary.
0.001–0.005 Sv Perform several appropriate bioassay measurements during
the 2–3 weeks following exposure.
Measurements should be distributed throughout time period.
Discontinue measurement method when results are below
detection for 2 consecutive sampling periods.
<0.001 Sv Use estimated dose equivalent as recorded value.
Confirmatory measurement may be performed 2–3 days
after exposure.
9
Urine sampling is the preferred method of in vitro measurement. Twenty-four hour urine
samples are suggested for the routine program and are mandatory in most cases for unusual
events. NCRP Report No. 87, “Use of Bioassay Procedures for Assessment of Internal
Radionuclide Deposition,” (NRCP 1987) is referred to for details.
For special bioassay requirements it is suggested that fecal samples be collected for several days
immediately after the event.
The following methods are employed in the analysis of in vitro samples: alpha spectrometry,
liquid scintillation, and gamma spectroscopy.
In vivo lung measurement is performed with a three-detector array of germanium detectors
placed in contact with the chest. The baseline count time is 30 min, but adjustments are made on
the basis of estimated chest wall thickness.
A.4.2. U.S. Army Center for Health Promotion and Preventive Medicine
Depleted uranium (DU) is used by the U.S. military in armor-piercing munitions and tank armor.
Largely as a result of lessons learned from the 1991 Gulf War, a DU bioassay program was
instituted for subsequently deployed U.S. military personnel who have the potential for exposure
to DU through embedded DU fragments, inhalation, ingestion, and contamination of wounds.
The U.S. Army Center for Health Promotion and Preventive Medicine (USACHPPM) has
developed a uranium bioassay program for U.S. Army personnel potentially exposed to DU. The
goal is to identify personnel with elevated exposures to DU and refer them to a follow-up and
medical surveillance program conducted by the U.S. Department of Veterans Affairs (Szrom and
Alberth 2007).
The U.S. Army program requires that redeployed personnel fill out a post-deployment health
assessment questionnaire, which is reviewed by medical personnel. If a potential exposure to
DU is indicated, a DU-specific questionnaire is completed and reviewed by medical personnel,
who assign one of three potential exposure categories:
Category I – soldiers in, on, or near an armored vehicle struck and penetrated with DU
munitions;
Category II – soldiers entering DU-damaged vehicles;
Category III – soldiers with incidental DU exposure.
Soldiers assigned to Category I or II must submit a urine specimen (24-h samples preferred) for
uranium and isotopic ratios analyses (Assistant Secretary of Defense 2003 and U.S. Army
Medical Command 2007). Participation is voluntary for soldiers assigned to Category III.
Inductively coupled plasma – mass spectrometry (ICP-MS) is used to determine the 238
U mass
concentration and 235
U/238
U ratio measurement in urine samples. Detection limits are ~1 ng/L or
~0.00001 Bq/L for 238
U concentration and ~5 ng 238
U/L for 235
U/238
U ratio measurements.
Interpretation of urinary uranium measurements is based on current ICRP models, e.g., the
respiratory model shown in Figure 3.1 and the systemic model shown in Figure 3.8. Exposure
10
dates are estimated from the DU questionnaires. The ICRP models are used to calculate
screening levels for urinary uranium based on the assumed exposure time and mode of exposure.
The screening level for a given case is indicative of an effective dose below 0.005 Sv and a
kidney concentration below 3 μg DU / g kidney.
Urinary uranium levels less than 25 ng U / L and less than the screening level for the specific
exposure case are considered as negative results. If the uranium concentration is greater than
25 ng U /L, an isotopic ratio analysis is performed in an effort to determine whether the excreted
uranium is largely DU. If the isotopic ratios are indicative of DU, the radiation dose and renal
concentration attributable to DU are estimated. The USACHPPM sends the results of the
analyses, including comparison with background urinary uranium concentrations (CDC 2005)
and interpretations, to the soldier’s health care provider who is responsible for communicating
the results to the soldier. The USACHPPM also provides archive copies of the results and
interpretations to the U.S. Army Dosimetry Center and the Department of Defense Deployment
Health Clinical Center (Szrom and Alberth 2007).

1
APPENDIX B: FEASIBILITY OF USING HAIR AND NAILS AS
BIOASSAY MEDIA FOR URANIUM
B.1 . Studies of Uranium Levels in Hair and Nails
A number of investigators have proposed the use of hair or toenails as biomarkers for intake of
uranium (Byrne and Benedik 1991; Karpas et al. 1996, 2005a, 2005b; Gonnen et al. 2000;
Karpas 2001; Ough et al. 2002; Akamine et al. 2007). A review of the literature was performed
to assess the potential usefulness and practicality of these biomarkers in a uranium bioassay
program.
The following paragraphs summarize the key findings of this review. The main conclusion is
that uranium measured in hair and nails cannot be assumed to arise wholly, or even mainly, from
internally deposited uranium.
Most of the studies of uranium in hair and nails have been aimed at determining baseline
concentrations of uranium in environmentally exposed persons. A wide range of uranium
concentrations have been found. For example, Gonnen et al. 2002 found a mean concentration in
hair of 62 ng U / g and a range of 10-180 ng U / g in an Israeli population, and Akamine et al.
2007 determined a mean of 15.4 ng U / g and a range of 2.1-49.8 ng U / g in a Brazilian
population.
Karpas et al. 2005a, 2005b estimated the relative quantities of absorbed uranium excreted in
urine, hair, and nails. They measured the concentration of uranium in urine, hair, and nails due
to continuous exposure through ingestion of drinking water. The study population consisted of
205 individuals living in 134 different households in southern Finland where drinking water is
supplied from private wells. The population was selected to include a wide range of daily intake
of uranium in drinking water. Hair and toenail samples were rinsed to remove external uranium
prior to acid digestion and analysis. The authors found that the uranium content in all excretion
pathways was correlated with the uranium intake. The amount of uranium removed per unit time
through each pathway was calculated using urinary volume, hair, and nail growth values for
Reference Man. The amounts of uranium excreted through urine and hair were estimated to be
roughly equivalent, and excretion through nails was estimated as <1% of total excretion.
Karpas et al. 2005b state that “The most significant conclusion from both types of analysis is that
the amount of uranium removed through hair growth is equivalent to removal through urine, as
has been pointed out previously (Karpas 2001). This clearly indicates that the omission of this
factor in the current biokinetic models [for uranium] is a shortcoming of these models.”
A high level of excretion of internally deposited uranium in hair as claimed by Karpas and
coworkers is inconsistent with extensive data on the fate of internally deposited uranium in
laboratory animals and humans. The preponderance of uranium that reaches blood is excreted in
urine within a few days after intake and in adults >90% is excreted in urine within a few weeks.
The balance is largely accounted for by bone and kidney deposits and fecal excretion. Very low
uranium concentrations in skin and hair have been found at times from a few days to a few
months after exposure (Struxness et al. 1956; Bentley et al. 1982).

2
The discrepancy between the results of the biokinetic studies of administered uranium and the
results of Karpas and coworkers is not clear, but it could be that the measured uranium in hair, at
least, is largely exogenous in origin despite the efforts of the investigators to clean the hair
samples. A review of the literature reveals the difficulty in distinguishing between internal and
external sources of metals in hair.
B.2 . The Problem of Distinguishing Between Internal and External Sources
Hair is composed of hard keratin and is chemically denser than other forms of keratin such as
calluses and dander flakes. Where the hair shaft separates from the follicle it undergoes
“disjunctive” keratizination, which involves the splitting of layers and exposing surfaces not
previously exposed. Keratinized cells have tiny pores littering their surfaces. The cells are
flattened and tightly bound to their neighbors in a very complex array that may begin to split
apart by an unknown process, allowing external agents to be trapped in openings near the outer
surface of the hair (ATSDR 2001). The binding of metals in hair is believed to involve sulfur,
which is found in high concentration in hair, as well as carboxyl groups (Hinners et al. 1974).
The common method for visualizing keratin groups in keratin fibers is with an aqueous solution
of uranyl salts in which ionic binding of the uranyl ion occurs (Swift 1996).
It has been found that trace elements bind to human hair to different degrees. For example,
copper is very firmly bound to hair and is difficult to remove by washing. In fact, measurements
have revealed that copper migrates into the hair on washing. In contrast, such a treatment causes
considerable loss of cadmium (Bencze 1994).
In samples taken at a lead-exposed workplace it was found that Turkish women had significantly
lower levels of lead in hair than German women although the blood lead levels were the same.
A closer investigation revealed that the Turkish women all worked in head scarves and the
German women worked bareheaded. The concentration difference was still appreciable after the
hair samples had been cleaned. The exogenous lead could not be removed completely (Bencze
1994).
The Agency for Toxic Substances and Disease Registry (ATSDR) convened a panel of experts in
fields of hair analysis, toxicology, and medicine to review and discuss the current state of the
science related to hair analysis, specifically its use in assessing environmental exposures
(ATSDR 2001). The panelists agreed that using hair analysis as a diagnostic tool for exposure to
metals is severely limited by difficulties in distinguishing between internal and external sources
of metals. Arsenic was frequently used by panel members to illustrate pros and cons of hair and
nails as biomarkers for internal exposure.
In a study of arsenic levels in tap water, urine, hair, and nails, persons drinking bottled
water but bathing in tap water with average arsenic concentration 345 μg/L had on
average 12 times higher levels of arsenic in hair than persons drinking and bathing in tap
water with arsenic containing 30 μg/L. Arsenic levels in urine were similar in the two
groups, indicating similar levels of absorbed arsenic in the groups. This example
illustrates the difficulties in using hair concentrations alone to draw inferences regarding
the magnitude of absorption of a metal to blood.

3
Various studies have examined the role or effectiveness of washing hair in order to
distinguish between endogenous and exogenous sources of arsenic. These studies
suggest that no truly good washing method exists to remove arsenic. If hair is not
washed aggressively, exogenous arsenic will remain. If hair is washed too aggressively,
endogenous arsenic may be removed. Concentrations of arsenic in hair will vary
depending on washing method, with no method shown to be capable of removing all
arsenic.
Findings suggest that external activity is also an issue with nails. For example, a study
that measured arsenic in nails over time following arsenic ingestion revealed the
following: (1) elevated levels of arsenic were measured in distal segments of unscraped
nails and believed to be deposited by sweat; (2) scraped nails during the same period did
not reveal elevated levels; and (3) samples of scraped nails taken later in time showed
elevated arsenic levels as a result of the ingestion episode.
Examples were given to demonstrate valid uses of nails, at least, as a biomarker. A
panelist summarized the results of a case study in which he was requested to evaluate an
individual with peripheral neuropathy months after possible exposures to lead and
arsenic. Total arsenic urinalysis had been performed closer to the time of exposure, but
not a fractionated analysis. To evaluate past exposures, a toenail sample was taken down
to the growth plate, which was negative. These results were used to conclude that the
individual had not been exposed to arsenic within the past year.
B.3 . Example of a Toxin for Which Hair is a Workable Bioassay Medium
The ATSDR hair analysis panelists generally agreed that despite considerable efforts to
determine relationships between concentration of various chemical toxins in hair and adverse
health effects from those toxins, relationships have been established for only one toxin:
methylmercury. For example, a relation has been established between maternal hair levels of
methylmercury and observed developmental neurological abnormalities in offspring.
Cernichiari et al. 1995, 2007 and Zareba 2008 discuss the advantages of maternal hair as
bioassay medium for estimating prenatal exposure to methylmercury. Their conclusions are
summarized below. Original references to the cited information can be found in
Cernichiari et al. 2007.
Studies on laboratory animals indicate that methylmercury enters hair via the follicle and is only
accumulated when the follicle is in the growing phase. These findings were confirmed in studies
of human hair grafted onto mice. Autoradiographic observations in these studies demonstrated
that radioactive methylmercury was taken up by the keratinocytes and eventually deposited in
the high sulfur keratin proteins. Once incorporated into the hair strand, the mercury level
remains stable. This suggests that the levels of mercury along the length of the hair strand
should provide a historical record of the levels of the transportable methylmercury in plasma.
Hair levels of mercury closely follow whole blood levels in the same individual and over a wide
range of concentrations in blood. The concentration ratio of hair to whole blood is expected to
show variation from one individual to another due to genetic differences. The ratio of hair to
whole blood levels appears to change with age, but this is not firmly established.

4
The uptake of mercury into hair is apparently selective to methylmercury and does not occur
with inorganic mercury. In several individuals who were highly exposed to inorganic mercury,
hair levels were slightly elevated over background, but were one to two orders of magnitude
lower than those that would be expected from the same blood levels of methylmercury. This is a
useful attribute of hair as a measure of methylmercury in blood because some inorganic mercury
may be present in the blood stream of fish eating populations. Some methylmercury is converted
to inorganic mercury in the GI tract, whereupon some absorption back into the blood stream may
occur. Methylmercury is slowly converted to inorganic mercury in various body tissues and this
might also contribute to blood levels of inorganic mercury. Maternal amalgam tooth fillings also
elevate levels of inorganic mercury in both maternal and cord blood.
Experimental data support the use of hair as a biological indicator of brain methylmercury levels.
Little uptake of inorganic mercury took place into hair. Inorganic mercury is known to be poorly
transported across the blood–brain barrier. In fact, blood levels of methylmercury that
correspond to the observed levels of inorganic mercury would have been expected to result in
severe brain damage. The fact that these subjects had no neurological signs or symptoms is
consistent with findings on the disposition of radioactive inorganic mercury where no
radioactivity was detected in the head region. Thus it appears that uptake into hair mimics
uptake into brain for both organic and inorganic species of mercury.
In the context of epidemiological studies, the hair sample offers appreciable practical advantages
in that the collection is non-invasive, transport and storage are simple, and no refrigeration is
required. A single hair sample can show the history of methylmercury levels in blood over
months or even years, depending on the length of the hair strands. Non-destructive physical
methods such as X-ray fluorescent spectrometry can measure mercury in single strands of hair.
The difference in mercury levels between each strand has been shown to be less than the
analytical variance.
Cernichiari et al. 2007 conclude that the use of maternal hair as an index of fetal brain levels is
well justified because it offers practical advantages and because it has a firm physiological basis.

1
APPENDIX C: OTHER RADIONUCLIDES FREQUENTLY
ENCOUNTERED AT URANIUM FACILITIES
C.1 . Purpose of This Appendix
Radionuclides other than the natural uranium isotopes 234
U, 235
U, and 238
U sometimes are present
in relatively high quantities at a uranium facility. The most frequently encountered such
radionuclides are members of the 238
U and 235
U chains, with 238
U progeny typically being much
more abundant than 235
U progeny. Health risks from exposure to 238
U progeny (excluding 234
U)
include lung cancer from inhalation of 230
Th, 226
Ra, or short-lived progeny of 222
Rn; risk of bone
cancer from inhalation or ingestion of 226
Ra; and risk of a number of different types of cancer
from external exposure to photons emitted by different members of these chains.
Manmade radionuclides may be present at trace levels at some types of uranium facilities. For
example, if the facility handles uranium feed material recycled from spent reactor fuel, the
material may contain transuranics (e.g., 237
Np and 238-241
Pu), fission products (e.g., 99
Tc), and
uranium isotopes not found in nature (e.g., 236
U) (Rich et al. 1988).
This appendix illustrates situations in which elevated levels of various members of the 238
U and 235
U chains may be encountered at uranium facilities and tabulates summary information on
members of the two chains. Effective dose coefficients and biokinetic model predictions needed
for interpretation of bioassay are tabulated for the following potentially significant types of
internal exposure at uranium facilities: acute inhalation of soluble or moderately soluble forms
of 226
Ra; acute inhalation of moderately soluble or relatively insoluble forms of 230
Th; and
chronic inhalation of short-lived 222
Rn progeny. It is beyond the scope of this report to provide
biokinetic and dosimetric predictions for a comprehensive set of radionuclides and exposure
situations encountered at uranium facilities.
C.2 . Examples
Uranium in raw ores is composed of approximately 99.27% 238
U, 0.72% 235
U, and 0.0057% 234
U
by mass. Uranium-234 is part of the 238
U chain, and 235
U heads a separate chain. The 238
U chain
typically represents about 98% of the total activity of these two chains in uranium ore.
The 238
U and 235
U chains (excluding members with trivial yield) and their summary decay data
are listed in Tables C.1 and C.2, respectively. Unprocessed uranium ore contains all of the
radionuclides listed in Tables C.1 and C.2, with chain members nearly in equilibrium with the
parent radionuclides 238
U and 235
U except for any reduction in activity in the lower portion of the 238
U chain due to escape of 222
Rn into air.
The kerma constants given in the last columns of Tables C.1 and C.2 indicate the relative hazards
of the chain members as sources of external exposure per unit activity present. Bismuth-214 in
the 238
U chain has a high yield of energetic photons and can be a particularly important source of
external exposure at uranium facilities where its long-lived predecessor 226
Ra is present in high
quantity.

2
Table C.1 The
238U chain and decay data (Endo et al. 2005)
Nuclide Half-life Decay
modea
Energy (MeV / nuclear transformation)
Total
alpha
Prominent
alpha Total
photon
Prominent
photon Total
electron
Kerma
constant
(Gy-m2/
Bq-s) Yield
(%) Energy
Yield
(%) Energy
U-238 4.47E+9 y α, SF 4.19 79 4.20 <0.01 3.04 0.016 0.009 2.0E-18
Th-234 24.1 d β- - - - 0.011 4.84 0.063 0.062 2.8E-18
Pa-234m 1.17 m β-, IT - - - 0.016 0.84 1.001 0.817 7.3E-19
U-234 2.46E+5 y α 4.76 71.4 4.78 <0.01 4.18 0.016 0.014 2.7E-18
Th-230 7.54E+4 y α 4.67 76.4 4.69 <0.01 3.32 0.015 0.015 2.4E-18
Ra-226 1600 y α 4.77 94.4 4.78 <0.01 3.59 0.186 0.004 5.1E-19
Rn-222 3.82 d α 5.49 99.9 5.49 <0.01 0.08 0.51 <0.001 1.5E-20
Po-218 3.1 m α, β- 6.00 100 6.00 - - - <0.001 -
Pb-214 26.8 m β- - - - 0.253 37.6 0.352 0.295 1.5E-17
Bi-214 19.9 m β-, α <0.1 0 5.45 1.48 46.1 0.609 0.663 5.0E-17
Po-214 1.6E-4 s α 7.69 100 7.69 <0.01 0.01 0.8 <0.001 3.1E-21
Pb-210 22.2 y β-, α <0.1 <0.01 3.72 <0.01 10.11 0.011 0.04 9.4E-18
Bi-210 5.01 d β-, α <0.1 <0.01 4.64 <0.01 <0.01 0.304 0.389 1.5E-23
Po-210 138.4 d Α 5.30 100 5.30 <0.01 <0.01 0.803 <0.001 3.6E-22 aSF = spontaneous fission, IT = isomeric transition
Table C.2 The
235U chain and decay data (Endo et al. 2005)
Nuclide Half-life Decay
modea
Energy (MeV / nuclear transformation)
Total
alpha
Prominent
alpha Total
photon
Prominent
photon Total
electron
Kerma
constant
(Gy-m2/
Bq-s) Yield
(%) Energy
Yield
(%) Energy
U-235 7.04E+8 y α 4.39 55.6 4.40 0.167 57.2 0.186 0.053 1.3E-17
Th-231 25.5 h β- - - - 0.027 26.55 0.013 0.162 1.8E-17
Pa-231 3.28E+4 y α 4.97 25.6 5.02 0.045 19.4 0.013 0.054 1.6E-17
Ac-227 21.8 y β-, α 0.07 0.6 4.95 <0.01 1.36 0.013 0.015 9.7E-19
Th-227 18.7 d α 5.88 24.1 6.04 0.132 19.66 0.012 0.075 2.0E-17
Fr-223 22.0 m β-, α <0.1 <0.01 5.46 0.058 33.9 0.05 0.383 1.1E-17
Ra-223 11.4 d α 5.67 51.6 5.72 0.141 25.94 0.084 0.078 1.3E-17
Rn-219 3.96 s α 6.75 79.4 6.82 0.059 10.8 0.271 0.007 2.5E-18
Po-215 1.8E-3 s α 7.39 99.9 7.39 <0.01 0.04 0.439 <0.001 6.9E-21
Pb-211 36.1 m β- - - - 0.064 3.78 0.405 0.454 2.6E-18
Bi-211 2.14 m α, β- 6.55 83.5 6.62 0.047 12.88 0.351 0.01 2.2E-18
Tl-207 4.77 m β- - - - <0.01 0.26 0.898 0.495 8.6E-20
Po-211 0.516 s α 7.44 98.9 7.45 <0.01 0.56 0.898 <0.001 3.1E-19

3
After extraction of uranium from ores mined by conventional techniques (underground or strip
mining), the mill tailings contain only a small percentage of the original uranium isotopes but
nearly all of most other members of the 238
U and 235
U chains. Because the concentrations of 230
Th and 226
Ra have not been reduced and 222
Rn and its short-lived progeny are still being
produced by decay of 226
Ra, the tailings represent many of the same internal and external
radiation hazards as the unprocessed uranium ore.
In situ leaching (ISL) has become a common method of extracting uranium from underground
deposits of low grade ores that are not economically recoverable by conventional mining
techniques (Brown 2008). ISL involves introduction of a solvent solution, called a lixiviant,
through injection wells drilled into the underground ore body. Lixiviants used in U.S. operations
often consist of water containing added oxygen and carbon dioxide or sodium bicarbonate, which
mobilize the uranium by reversing the chemical conditions that led to uranium deposition. The
pregnant leach solution is pumped to the surface, fed to a mill, and processed to extract the
uranium. Most radionuclides in the 238
U and 235
U chains are not mobilized from the underground
deposit to a significant extent by the lixiviant, but relatively large quantities of 230
Th, 226
Ra, and 222
Rn may be brought to the surface. The concentrations of these radionuclides in the solution
may be much different from that of 238
U. Typically, mobilized 226
Ra is in the form of carbonates
or sulfates and represents about 5-15% of the equilibrium 226
Ra in the host formation.
The radiation protection program requirements at an ISL facility are similar in many respects to
requirements at conventional uranium mining and milling facilities. For example, the
requirements at an ISL facility include a uranium bioassay program; monitoring of long-lived
alpha emitters (234
U, 235
U, 238
U, 230
Th, and 226
Ra) in air in process and packaging areas;
monitoring for external exposure; monitoring for 226
Ra build-up in equipment; and monitoring of 222
Rn and its short-lived progeny. Monitoring of 222
Rn at ISL facilities is particularly important
at the front end of the process where 222
Rn is most likely to emanate from solutions returning
from underground (Brown, 2008).
Monitoring at ISL facilities indicates considerable disequilibrium between 222
Rn and its short-
lived progeny in many cases. Situations have been observed in well-ventilated areas in which the
concentration of 222
Rn in air is high but concentrations of 222
Rn progeny are low. In contrast,
concentrations of 222
Rn progeny considerably higher than that of 222
Rn have been observed in
poorly ventilated areas. Thus, monitoring at ISL facilities should include measurement of 222
Rn
daughters as well as 222
Rn itself (Brown 2008).
C.3 . Biokinetic and Dosimetric Data for 226
Ra
Data on clearance of inhaled radium compounds from the respiratory tract in laboratory animals
and human subjects generally indicate that the compounds are relatively soluble (Type F) or
moderately soluble (Type M) in the lungs (ICRP 1995b). Estimated fractional absorption of
radium from the gastrointestinal tract to blood typically has been in the range 0.1–0.2 in studies
involving human subjects (ICRP 1993a). The ICRP applies an absorption fraction of 0.2 to
radium for the cases of ingestion or inhalation of soluble or moderately soluble forms by adults
(ICRP 1993a).

4
The systemic biokinetic model for radium currently recommended by the ICRP is described in
ICRP Publication 67 (1993a). The model structure is similar to that for uranium (Figure 3.8), but
some of the non-skeletal compartments in the uranium model are combined in the radium model.
For example, red blood cells and blood plasma are combined to form a single blood
compartment. Parameter values for radium are given in Table C.3.
Table C.3 Transfer coefficients in the biokinetic model for
systemic radium (ICRP 1993a)
Path Transfer coefficient
(d–1
)
Plasma to urinary bladder contents 6.060 × 10⁻¹
Plasma to upper large intestine contents 2.179 × 101
Plasma to trabecular bone surface 9.720 × 100
Plasma to cortical bone surface 7.780 × 100
Plasma to ST0 2.268 × 101
Plasma to ST1 7.000 × 100
Plasma to ST2 7.000 × 10⁻²
Plasma to Liver 1 3.500 × 10⁻¹
Trabecular bone surface to plasma 5.780 × 10⁻¹
Trabecular bone surface to exchangeable volume 1.160 × 10⁻¹
Cortical bone surface to plasma 5.780 × 10⁻¹
Cortical bone surface to exchangeable volume 1.160 × 10⁻¹
ST0 to plasma 7.560 × 100
ST1 to plasma 6.930 × 10⁻¹
ST2 to plasma 3.800 × 10⁻⁴
Liver to plasma 1.390 × 10⁻²
Exchangeable trabecular bone volume to surface 1.850 × 10⁻²
Exchangeable to nonexchangeable trabecular bone volume 4.600 × 10⁻³
Exchangeable cortical bone volume to surface 1.850 × 10⁻²
Exchangeable to nonexchangeable cortical bone volume 4.600 × 10⁻³
Nonexchangeable cortical bone volume to plasma 8.210 × 10⁻⁵
Nonexchangeable trabecular bone volume to plasma 4.930 × 10⁻⁴
The biokinetics of radioactive progeny of 226
Ra produced in the body is assumed to differ from
that of 226
Ra. Radon-222 produced in exchangeable and non-exchangeable bone volume
compartments is assumed to migrate to blood at rates of 1.5 and 0.36 d-1
, respectively.
Radon-222 produced in soft tissues or bone surface is assumed to be removed to blood at the rate
100 d-1
. Radon reaching blood is assumed to be removed from the body by exhalation at the rate
1 min-1
. Other radioactive progeny of 226
Ra are assumed to be removed to blood at the rate of
bone turnover if produced in bone volume, but if produced in other compartments they are
assumed to transfer rapidly to blood (1000 d-1
) and to behave according to their own
characteristic biological behavior. For example, 210
Pb that is transferred to blood after being
produced in soft tissues or bone surface is assumed to behave as described in the ICRP’s current

5
biokinetic model for lead (ICRP 1993a). Additional details concerning the assumed behavior of 226
Ra progeny produced in the body are given on pp. 86–87 of ICRP Publication 67 (1993a).
Model predictions of retention and excretion of 226
Ra following acute inhalation of soluble and
moderately soluble forms by a worker are given in Tables C.4 and C.5, respectively. The
assumed particle size in each case is 5 μm AMAD. Estimated 50-y effective doses for these
same cases are given in Table C.6.
Table C.4 Model predictions of retention and excretion of
226Ra
(fraction of intake) following acute inhalation of a relatively soluble form
(Type F, 5 μm AMAD)
Day after intake 24-h urinary
excretion 24-h fecal
excretion Retained in body
1 4.9E-03 1.0E-01 5.0E-01 2 8.3E-04 1.3E-01 2.9E-01 3 5.7E-04 8.1E-02 1.8E-01 5 2.8E-04 2.6E-02 9.1E-02 7 1.4E-04 1.0E-02 6.2E-02
10 5.5E-05 3.5E-03 4.7E-02 15 1.9E-05 9.2E-04 3.9E-02 20 1.2E-05 4.9E-04 3.6E-02 30 9.7E-06 3.6E-04 3.2E-02 40 8.1E-06 3.0E-04 2.8E-02 50 6.9E-06 2.5E-04 2.5E-02 60 5.8E-06 2.1E-04 2.3E-02 70 4.9E-06 1.8E-04 2.1E-02 80 4.2E-06 1.5E-04 1.9E-02 90 3.5E-06 1.3E-04 1.8E-02
100 3.0E-06 1.1E-04 1.7E-02
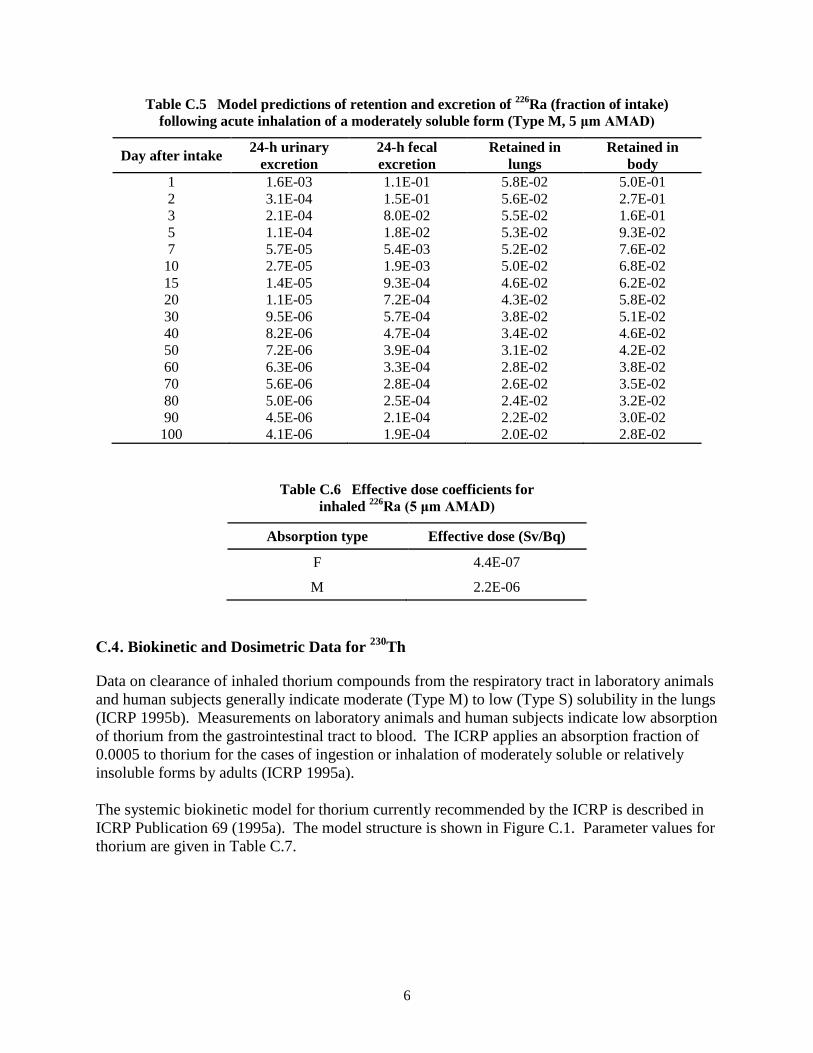
6
Table C.5 Model predictions of retention and excretion of 226
Ra (fraction of intake)
following acute inhalation of a moderately soluble form (Type M, 5 μm AMAD)
Day after intake 24-h urinary
excretion 24-h fecal
excretion Retained in
lungs Retained in
body 1 1.6E-03 1.1E-01 5.8E-02 5.0E-01 2 3.1E-04 1.5E-01 5.6E-02 2.7E-01 3 2.1E-04 8.0E-02 5.5E-02 1.6E-01 5 1.1E-04 1.8E-02 5.3E-02 9.3E-02 7 5.7E-05 5.4E-03 5.2E-02 7.6E-02
10 2.7E-05 1.9E-03 5.0E-02 6.8E-02 15 1.4E-05 9.3E-04 4.6E-02 6.2E-02 20 1.1E-05 7.2E-04 4.3E-02 5.8E-02 30 9.5E-06 5.7E-04 3.8E-02 5.1E-02 40 8.2E-06 4.7E-04 3.4E-02 4.6E-02 50 7.2E-06 3.9E-04 3.1E-02 4.2E-02 60 6.3E-06 3.3E-04 2.8E-02 3.8E-02 70 5.6E-06 2.8E-04 2.6E-02 3.5E-02 80 5.0E-06 2.5E-04 2.4E-02 3.2E-02 90 4.5E-06 2.1E-04 2.2E-02 3.0E-02 100 4.1E-06 1.9E-04 2.0E-02 2.8E-02
Table C.6 Effective dose coefficients for
inhaled 226
Ra (5 μm AMAD)
Absorption type Effective dose (Sv/Bq)
F 4.4E-07
M 2.2E-06
C.4 . Biokinetic and Dosimetric Data for 230
Th
Data on clearance of inhaled thorium compounds from the respiratory tract in laboratory animals
and human subjects generally indicate moderate (Type M) to low (Type S) solubility in the lungs
(ICRP 1995b). Measurements on laboratory animals and human subjects indicate low absorption
of thorium from the gastrointestinal tract to blood. The ICRP applies an absorption fraction of
0.0005 to thorium for the cases of ingestion or inhalation of moderately soluble or relatively
insoluble forms by adults (ICRP 1995a).
The systemic biokinetic model for thorium currently recommended by the ICRP is described in
ICRP Publication 69 (1995a). The model structure is shown in Figure C.1. Parameter values for
thorium are given in Table C.7.

7
Figure C.1 Structure of the systemic biokinetic model for thorium (ICRP 1995a).
The biokinetics of radioactive progeny of 230
Th produced in the body is assumed to differ from
that of 230
Th. The general scheme for treatment of progeny of 230
Th is the same as that described
above regarding progeny of 226
Ra produced in the body. Thorium-230 decays to 226
Ra, which is
assumed to be removed to blood at the rate of bone turnover if produced in bone volume but if
produced in other compartments is assumed to transfer rapidly to blood and to behave according
to the transfer coefficients for radium given in Table C.3. Subsequent members of the 230
Th
chain are assumed to behave as described in Section C.3 for 226
Ra progeny. Additional details
concerning the assumed behavior of thorium progeny produced in the body are given on
pp. 47–48 of ICRP Publication 69 (1995a).

8
Table C.7 Transfer coefficients in the biokinetic model for
systemic thorium (ICRP 1995a)
Path Transfer coefficient
(d–1
) Blood to Liver 1 9.700 × 10
-2 Blood to cortical surface 6.793 × 10
-1 Blood to trabecular surface 6.793 × 10
-1 Blood to urinary bladder contents 1.067 × 10
-1 Blood to kidneys (urinary path) 6.793 × 10
-2 Blood to other kidney tissue 1.940 × 10
-2 Blood to upper large intestine contents 9.700 × 10
-3 Blood to testes 6.800 × 10
-4 Blood to ovaries 2.100 × 10
-4 Blood to ST0 8.320 × 10
-1 Blood to ST1 2.430 × 10
-1 Blood to ST2 3.880 × 10
-2 ST0 to blood 4.620 × 10
-1 Kidneys urinary path to urinary bladder contents 4.620 × 10
-2 Other kidney tissue to blood 3.800 × 10
-4 ST1 to blood 9.500 × 10
-4 ST2 to blood 1.900 × 10
-5 Trabecular surface to volume 2.470 × 10
-4 Trabecular surface to marrow 4.930 × 10
-4 Cortical surface to volume 4.110 × 10
-5 Cortical surface to marrow 8.210 × 10
-5 Trabecular volume to marrow 4.930 × 10
-4 Cortical volume to marrow 8.210 × 10
-5 Bone marrow compartments to blood 7.600 × 10
-3 Liver 1 to Liver 2 9.500 × 10
-4 Liver 1 to small intestine contents 4.750 × 10
-4 Liver 1 to blood 4.750 × 10
-4 Liver 2 to blood 2.110 × 10
-4 Testes or ovaries to blood 1.900 × 10
-4
Model predictions of retention and excretion of 230
Th following acute inhalation of moderately
soluble (Type M) and relatively insoluble (Type S) forms by a worker are given in Tables C.8
and C.9, respectively. The assumed particle size in each case is 5 μm AMAD. Estimated 50-y
effective doses for these same cases are given in Table C.10.
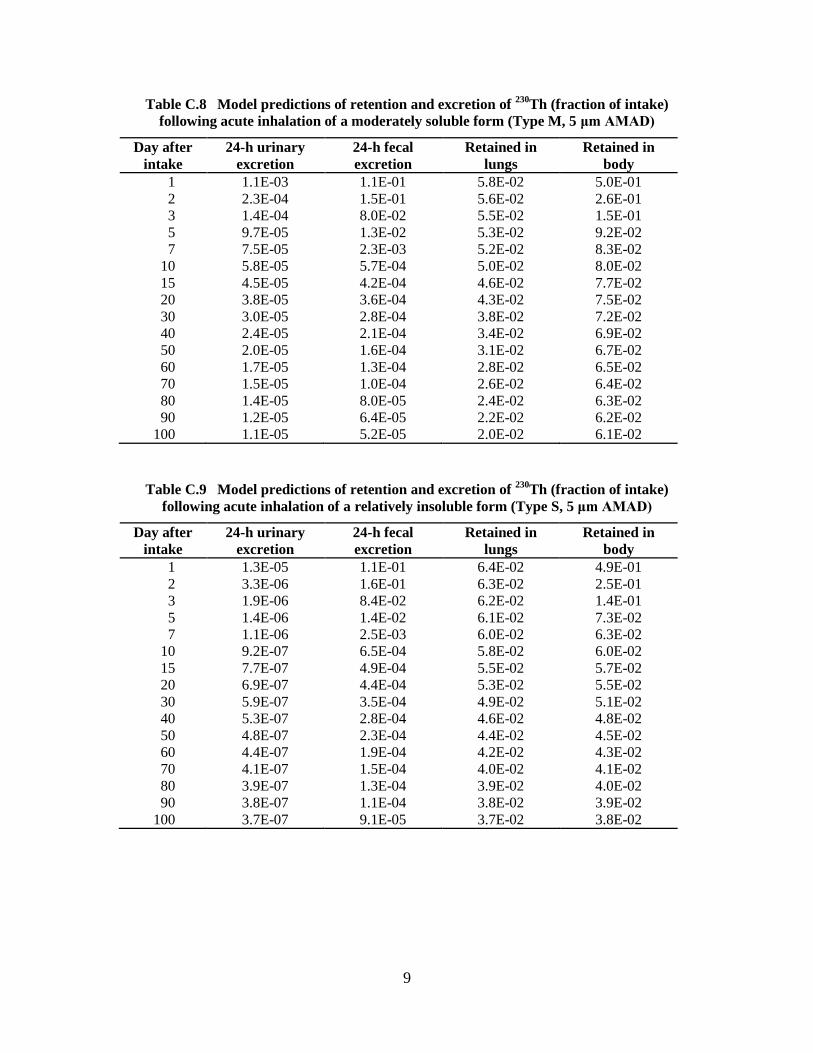
9
Table C.8 Model predictions of retention and excretion of 230
Th (fraction of intake)
following acute inhalation of a moderately soluble form (Type M, 5 μm AMAD)
Day after
intake 24-h urinary
excretion 24-h fecal
excretion Retained in
lungs Retained in
body 1 1.1E-03 1.1E-01 5.8E-02 5.0E-01 2 2.3E-04 1.5E-01 5.6E-02 2.6E-01 3 1.4E-04 8.0E-02 5.5E-02 1.5E-01 5 9.7E-05 1.3E-02 5.3E-02 9.2E-02 7 7.5E-05 2.3E-03 5.2E-02 8.3E-02
10 5.8E-05 5.7E-04 5.0E-02 8.0E-02 15 4.5E-05 4.2E-04 4.6E-02 7.7E-02 20 3.8E-05 3.6E-04 4.3E-02 7.5E-02 30 3.0E-05 2.8E-04 3.8E-02 7.2E-02 40 2.4E-05 2.1E-04 3.4E-02 6.9E-02 50 2.0E-05 1.6E-04 3.1E-02 6.7E-02 60 1.7E-05 1.3E-04 2.8E-02 6.5E-02 70 1.5E-05 1.0E-04 2.6E-02 6.4E-02 80 1.4E-05 8.0E-05 2.4E-02 6.3E-02 90 1.2E-05 6.4E-05 2.2E-02 6.2E-02
100 1.1E-05 5.2E-05 2.0E-02 6.1E-02
Table C.9 Model predictions of retention and excretion of
230Th (fraction of intake)
following acute inhalation of a relatively insoluble form (Type S, 5 μm AMAD)
Day after
intake 24-h urinary
excretion 24-h fecal
excretion Retained in
lungs Retained in
body 1 1.3E-05 1.1E-01 6.4E-02 4.9E-01 2 3.3E-06 1.6E-01 6.3E-02 2.5E-01 3 1.9E-06 8.4E-02 6.2E-02 1.4E-01 5 1.4E-06 1.4E-02 6.1E-02 7.3E-02 7 1.1E-06 2.5E-03 6.0E-02 6.3E-02
10 9.2E-07 6.5E-04 5.8E-02 6.0E-02 15 7.7E-07 4.9E-04 5.5E-02 5.7E-02 20 6.9E-07 4.4E-04 5.3E-02 5.5E-02 30 5.9E-07 3.5E-04 4.9E-02 5.1E-02 40 5.3E-07 2.8E-04 4.6E-02 4.8E-02 50 4.8E-07 2.3E-04 4.4E-02 4.5E-02 60 4.4E-07 1.9E-04 4.2E-02 4.3E-02 70 4.1E-07 1.5E-04 4.0E-02 4.1E-02 80 3.9E-07 1.3E-04 3.9E-02 4.0E-02 90 3.8E-07 1.1E-04 3.8E-02 3.9E-02
100 3.7E-07 9.1E-05 3.7E-02 3.8E-02

10
Table C.10 Effective dose coefficients for inhaled 230
Th
(5 μm AMAD)
Absorption type Effective dose
(Sv/Bq)
M 2.8E-05
S 7.2E-06
C.5 . Exposure to 222
Rn Progeny
Radon-222 is a naturally occurring radioactive gas, formed as the decay product of 226
Ra.
Because 222
Rn is inert, nearly all inhaled 222
Rn is subsequently exhaled. However, airborne 222
Rn decays into a series of solid short-lived radioisotopes (218
Po, 214
Pb, 214
Bi, and 214
Po) that
are inhaled along with 222
Rn and deposit in the respiratory tract. Because of their short half-
lives, these radionuclides may decay to a significant extent in the respiratory tract before
clearance can take place. Two of these progeny, 218
Po and 214
Po, are alpha emitters and represent
most of the dose to the lungs from inhaled 222
Rn and its progeny.
The ICRP currently does not apply its standard biokinetic and dosimetric modeling scheme for
internal emitters to the case of inhalation of 222
Rn progeny. Rather, the ICRP recommends that
assessment of risk from exposure to radon progeny should be based on epidemiological studies
relating excess lung cancer in miners to radon exposure (ICRP 1993b, 1994a).
Historically, the concentration of 222
Rn progeny in air has been measured in Working Levels
(WL), and exposure to 222
Rn progeny in air has been measured in Working Level Months
(WLM). A Working Level is defined as any combination of the short-lived radioactive progeny
in one liter of air that will result in the ultimate emission of 1.3E+05 MeV of alpha energy
(1 WL = 2.083E-05 J/m3). A Working Level Month is defined as exposure for 1 working month
(170 hours) to an airborne concentration of 1 WL (1 WLM = 1 WL × 170 hours = 0.00354
J∙h/m3).
ICRP Publication 50 (1987) gives an estimate of effective dose per unit exposure to 222
Rn
progeny of 6.4 mSv per WLM (ICRP 1987). UNSCEAR uses a similar value of 5.7 mSv per
WLM for its dose evaluations (UNSCEAR 2000). ICRP Publication 65 (1993b) gives an
estimated effective dose of 4 mSv per WLM for workers.
Recall that the following primary reference guidance for limitation of radiation effects is used in
this report as part of the basis for determining action levels from monitoring data for uranium
(see Sections 1 and 2): The committed effective dose from intake of uranium during any 1-y
period should not exceed 0.02 Sv as an average over any 5-y period and should not exceed 0.05
Sv in any single year, and the value 0.02 Sv should be used for planning purposes for any 1-y
period. For consistency, the same primary reference guidance should be applied to other
radionuclides encountered at uranium facilities. If the effective dose per unit exposure to 222
Rn
progeny is taken as the rounded value 5 mSv per WLM, an annual dose of 0.02 Sv would
correspond to exposure of 4 WLM per year. Both the NRC (1991) and EPA (1988) have
adopted limits of 4 WLM per year for exposure to 222
Rn in the workplace.

1
APPENDIX D: COMPARISON OF REFERENCE GUIDANCE IN
THIS REPORT WITH U.S. FEDERAL AGENCY GUIDANCE
AND REGULATIONS
D.1 . U.S. Nuclear Regulatory Commission Regulatory Guides and Regulation
D.1.1. Regulatory Guide 8.11: Applications of Bioassay for Uranium
Regulatory Guide 8.11 (USNRC, 1974) provides criteria for the development and
implementation of a bioassay program for natural uranium isotopes at any uranium facility. The
guidance is concerned with inhalation of uranium compounds and is programmatic in nature.
Guidance is given on determination of whether bioassay procedures are necessary, who should
participate in a bioassay program, selection of bioassay techniques, frequency of measurements,
bioassay results that should initiate actions, and specific actions that should be taken at each
action level.
The technical basis of Regulatory Guide 8.11 is WASH-1251, “Applications of Bioassay for
Uranium” (Alexander 1974). The guidance in WASH-1251 and hence in Regulatory Guide 8.11
is consistent with the version of 10CFR20 in effect at the time. The radiological guidance in that
version of 10CFR20 was based on the concept of the dose to the critical organ introduced in
ICRP Publication 2 (1959).
The guidance in Regulatory Guide 8.11 for avoidance of chemical toxicity from uranium was
designed to limit the mass concentration of uranium in the kidneys to 3 μg U/g kidney. The
guidance was expressed in terms of the mass of uranium reaching blood.
Regulatory Guide 8.11 gives rules for selection of bioassay measurement techniques based on
the purpose of measurements and the expected “transportability” (solubility) of inhaled uranium
compounds. For example, if the purpose is to check the adequacy of the air sampling program
and the airborne material is expected to be transportable (soluble) in the lungs, then urinary
uranium should be measured. If the purpose is to check the air sampling program and the
material is expected to be non-transportable (relatively insoluble) in the lungs, then an in vivo
lung count is the preferred measurement, measurement of uranium in feces is the second choice,
and measurement of uranium in urine is the third choice.
Rules also are given for measurement frequency on the basis of the type of measurement (urinary
excretion or in vivo lung count), the average and maximum bioassay measurement of that type
over the most recent quarter, and the solubility of the material in the lungs. Recommended
measurement frequencies are given in bioassays per year at equally spaced intervals and vary
from 1 to 12 for in vivo lung counts and from 2 to 52 for urinary excretion measurements.
Regulatory Guide 8.11 provides action points based on bioassay results for the case of acute
intake of uranium and lists associated actions. Action points for limiting radiological risk are
expressed as multiples of the annual Maximum Permissible Dose Commitment (MPDc) implied
by the bioassay results. The MPDc, taken from the version of 10CFR20 in effect at the time, is a
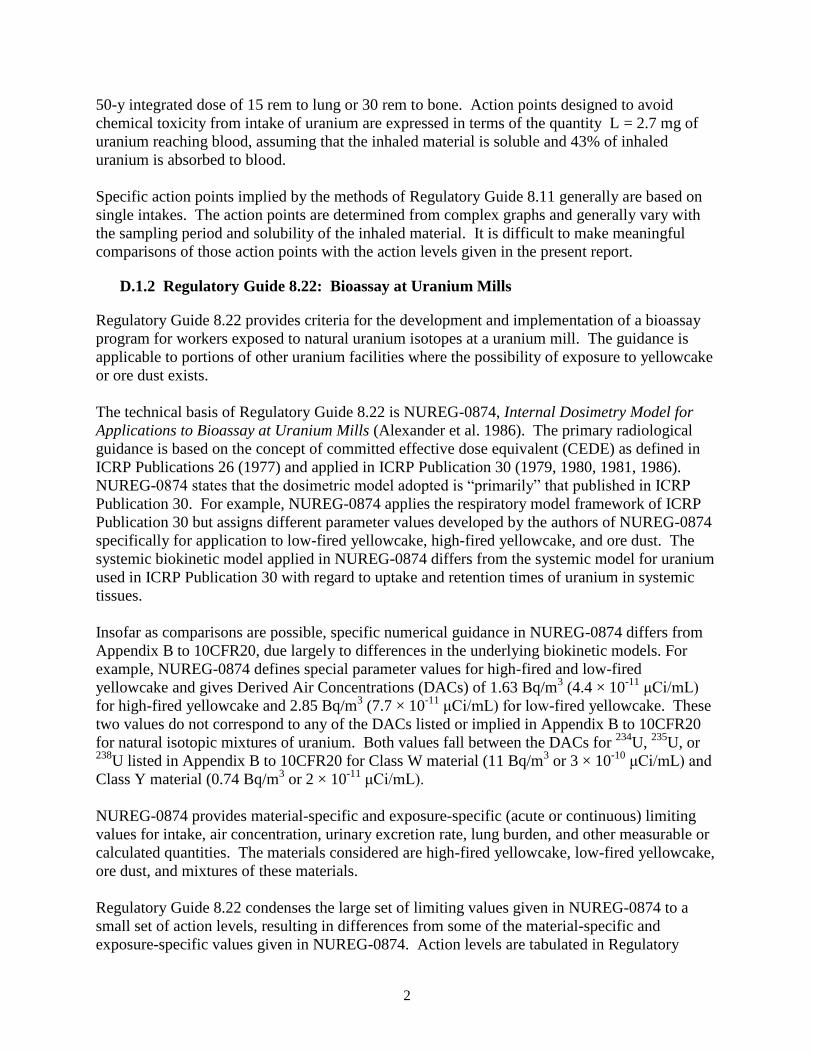
2
50-y integrated dose of 15 rem to lung or 30 rem to bone. Action points designed to avoid
chemical toxicity from intake of uranium are expressed in terms of the quantity L = 2.7 mg of
uranium reaching blood, assuming that the inhaled material is soluble and 43% of inhaled
uranium is absorbed to blood.
Specific action points implied by the methods of Regulatory Guide 8.11 generally are based on
single intakes. The action points are determined from complex graphs and generally vary with
the sampling period and solubility of the inhaled material. It is difficult to make meaningful
comparisons of those action points with the action levels given in the present report.
D.1.2 Regulatory Guide 8.22: Bioassay at Uranium Mills
Regulatory Guide 8.22 provides criteria for the development and implementation of a bioassay
program for workers exposed to natural uranium isotopes at a uranium mill. The guidance is
applicable to portions of other uranium facilities where the possibility of exposure to yellowcake
or ore dust exists.
The technical basis of Regulatory Guide 8.22 is NUREG-0874, Internal Dosimetry Model for
Applications to Bioassay at Uranium Mills (Alexander et al. 1986). The primary radiological
guidance is based on the concept of committed effective dose equivalent (CEDE) as defined in
ICRP Publications 26 (1977) and applied in ICRP Publication 30 (1979, 1980, 1981, 1986).
NUREG-0874 states that the dosimetric model adopted is “primarily” that published in ICRP
Publication 30. For example, NUREG-0874 applies the respiratory model framework of ICRP
Publication 30 but assigns different parameter values developed by the authors of NUREG-0874
specifically for application to low-fired yellowcake, high-fired yellowcake, and ore dust. The
systemic biokinetic model applied in NUREG-0874 differs from the systemic model for uranium
used in ICRP Publication 30 with regard to uptake and retention times of uranium in systemic
tissues.
Insofar as comparisons are possible, specific numerical guidance in NUREG-0874 differs from
Appendix B to 10CFR20, due largely to differences in the underlying biokinetic models. For
example, NUREG-0874 defines special parameter values for high-fired and low-fired
yellowcake and gives Derived Air Concentrations (DACs) of 1.63 Bq/m3 (4.4 × 10
-11 μCi/mL)
for high-fired yellowcake and 2.85 Bq/m3 (7.7 × 10
-11 μCi/mL) for low-fired yellowcake. These
two values do not correspond to any of the DACs listed or implied in Appendix B to 10CFR20
for natural isotopic mixtures of uranium. Both values fall between the DACs for 234
U, 235
U, or 238
U listed in Appendix B to 10CFR20 for Class W material (11 Bq/m3 or 3 × 10
-10 μCi/mL) and
Class Y material (0.74 Bq/m3 or 2 × 10
-11 μCi/mL).
NUREG-0874 provides material-specific and exposure-specific (acute or continuous) limiting
values for intake, air concentration, urinary excretion rate, lung burden, and other measurable or
calculated quantities. The materials considered are high-fired yellowcake, low-fired yellowcake,
ore dust, and mixtures of these materials.
Regulatory Guide 8.22 condenses the large set of limiting values given in NUREG-0874 to a
small set of action levels, resulting in differences from some of the material-specific and
exposure-specific values given in NUREG-0874. Action levels are tabulated in Regulatory

3
Guide 8.22 for urinary uranium expressed as mass of uranium per unit volume of urine (μg/L)
and externally measured uranium in the chest expressed as total activity in the chest (nCi or Bq).
Modifications and simplifications of limiting values proposed in NUREG-0874 are based mainly
on practical considerations such as the uncertainties in measurements of uranium in urine or in
the lungs at relatively low levels of intake, the need to provide simple guidance, and the
relatively high cost of in vivo lung counts.
The action levels for urinary excretion rates and lung burdens given in Regulatory Guide 8.22 are
intended to ensure that the average air concentration of yellowcake does not exceed
3.7 x 10⁻⁶
Bq/mL (10-10
μCi/mL) for a 40-h workweek and the average air concentration of ore
dust does not exceed 3.7 x 10⁻⁶
Bq/mL for a period of one calendar quarter. The activity
concentration 3.7 x 10⁻⁶
Bq U/mL corresponds to a mass concentration of 0.15 mg U/m3 for
yellowcake or ore dust. For comparison, Appendix B to 10CFR20 (Footnote 3) specifies a limit
of 0.20 mg U/m3 for airborne uranium containing no more 5%
235U by weight.
Regulatory Guide 8.22 indicates that site-specific action levels based on models and methods of
NUREG-0874 may be proposed to the NRC:
“Action levels and actions [tabulated in Regulatory Guide 8.22] are acceptable as a basis for
a uranium mill bioassay program. Proposals for other action levels and actions from an
applicant will be considered on a specific-case basis if accompanied by a description of how
the information in NUREG-0874 was used to derive those different criteria.”
Action levels listed in Regulatory Guide 8.22 are compared in Table D.1 with values
recommended in the present report. Overall, recommendations in the present report are more
restrictive than those given in Regulatory Guide 8.22. However, the values from the present
report are for poorly characterized forms of airborne uranium and thus are based on worst-case
assumptions, while those from Regulatory Guide 8.22 are for more narrowly determined
exposure situations.
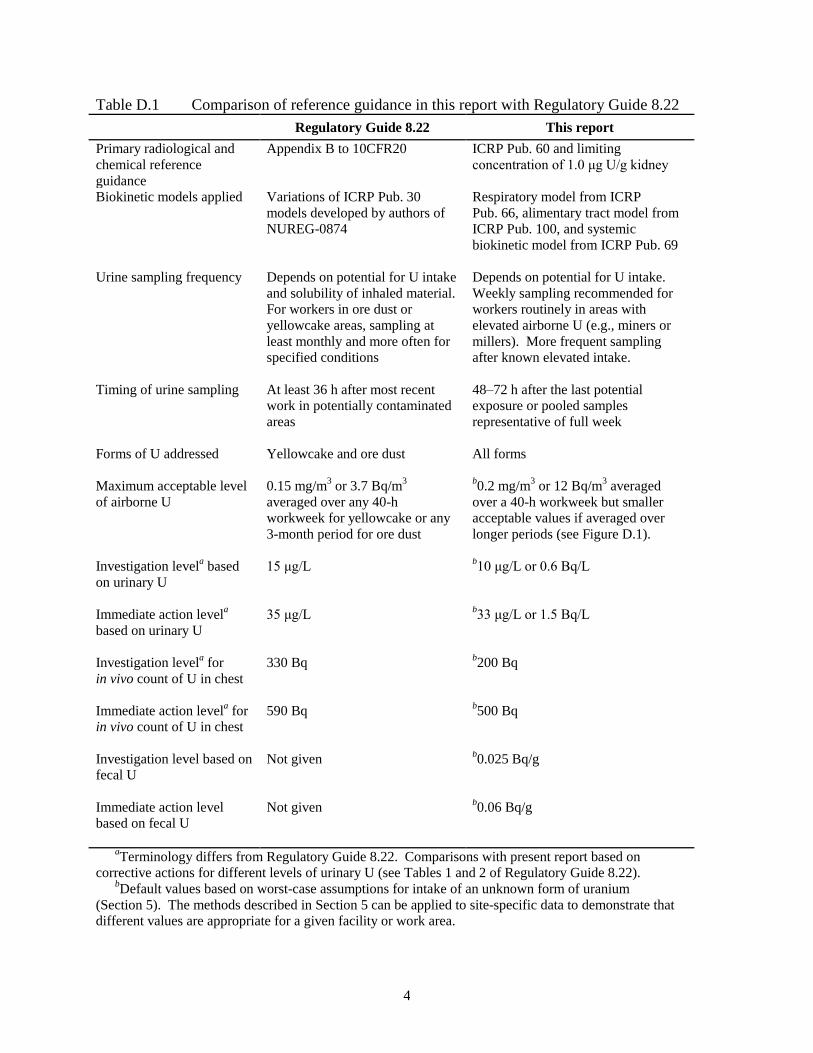
4
Table D.1 Comparison of reference guidance in this report with Regulatory Guide 8.22
Regulatory Guide 8.22 This report
Primary radiological and
chemical reference
guidance
Appendix B to 10CFR20 ICRP Pub. 60 and limiting
concentration of 1.0 μg U/g kidney
Biokinetic models applied
Variations of ICRP Pub. 30
models developed by authors of
NUREG-0874
Respiratory model from ICRP
Pub. 66, alimentary tract model from
ICRP Pub. 100, and systemic
biokinetic model from ICRP Pub. 69
Urine sampling frequency Depends on potential for U intake
and solubility of inhaled material.
For workers in ore dust or
yellowcake areas, sampling at
least monthly and more often for
specified conditions
Depends on potential for U intake.
Weekly sampling recommended for
workers routinely in areas with
elevated airborne U (e.g., miners or
millers). More frequent sampling
after known elevated intake.
Timing of urine sampling At least 36 h after most recent
work in potentially contaminated
areas
48–72 h after the last potential
exposure or pooled samples
representative of full week
Forms of U addressed
Yellowcake and ore dust All forms
Maximum acceptable level
of airborne U
0.15 mg/m3 or 3.7 Bq/m
3
averaged over any 40-h
workweek for yellowcake or any
3-month period for ore dust
b0.2 mg/m
3 or 12 Bq/m
3 averaged
over a 40-h workweek but smaller
acceptable values if averaged over
longer periods (see Figure D.1).
Investigation levela based
on urinary U
15 μg/L
b10 μg/L or 0.6 Bq/L
Immediate action levela
based on urinary U
35 μg/L b33 μg/L or 1.5 Bq/L
Investigation levela for
in vivo count of U in chest
330 Bq b200 Bq
Immediate action levela for
in vivo count of U in chest
590 Bq b500 Bq
Investigation level based on
fecal U
Not given b0.025 Bq/g
Immediate action level
based on fecal U
Not given b0.06 Bq/g
aTerminology differs from Regulatory Guide 8.22. Comparisons with present report based on
corrective actions for different levels of urinary U (see Tables 1 and 2 of Regulatory Guide 8.22). bDefault values based on worst-case assumptions for intake of an unknown form of uranium
(Section 5). The methods described in Section 5 can be applied to site-specific data to demonstrate that different values are appropriate for a given facility or work area.

5
Figure D.1 For an unknown form of uranium, reference guidance values given in this report
for the average concentration of uranium for different exposure periods. Regulatory Guide 8.22
limits the air concentration to 0.15 mg U/m3 or 3.7 Bq U/m
3 as an average over a 40-h workweek,
but for any number of repeated workweeks.
D.1.3. Appendix B to 10CFR20
D.1.3.1. Limitation of Radiation Doses
Appendix B to 10CFR20 provides Annual Limits on Intake (ALIs) and Derived Air
Concentrations (DACs) for radionuclides in the workplace or environment. The values are based
on radiological guidance given in ICRP Publication 26 (1977) and biokinetic and dosimetric
models of ICRP Publication 30 (1979, 1980, 1981, 1988).
The guidance in ICRP Publication 26 (1977) is based on the concept of committed effective dose
equivalent (CEDE), defined as a weighted sum of committed dose equivalents to radiosensitive
tissues. The tissue weighting factors (Column 2 of Table D.2) represent the relative contribution
of the different tissues to the total detriment for the case of uniform irradiation of the whole
body. Health effects are categorized as stochastic, meaning that the probability of occurrence is
a function of dose (e.g., cancer), or nonstochastic, meaning that the effect is expected to occur
when the dose reaches or exceeds a threshold value (e.g., cataracts). To prevent stochastic
effects, the effective dose from exposure in a year is limited to 0.05 Sv. To prevent
nonstochastic effects, the dose equivalent to organs from intakes in a year is limited to 0.5 Sv
except that the lens of the eye is limited to 0.15 Sv.

6
Table D.2 Tissue weighting factors given in ICRP Publications 26 (1977),
60 (1991), and 103 (2008)
Organ or tissue Tissue weighting factor (wT)
ICRP Pub. 26 ICRP Pub. 60 ICRP Pub. 103
Gonads 0.25 0.20 0.08 Bone marrow (red) 0.12 0.12 0.12 Colon -- 0.12 0.12 Lung 0.12 0.12 0.12 Stomach -- 0.12 0.12 Urinary bladder -- 0.05 0.04 Breast 0.15 0.05 0.12 Liver -- 0.05 0.04 Esophagus -- 0.05 0.04 Thyroid 0.03 0.05 0.04 Skin -- 0.01 0.01 Bone surface 0.03 0.01 0.01 Brain -- -- 0.01 Salivary glands -- -- 0.01 Remainder 0.30
a 0.05b 0.12
c aIn ICRP Pub. 26 the wT for Remainder is applied to the average dose to the five
remaining tissues receiving the highest dose, excluding the skin, lens of the eye, and
the extremities. bIn ICRP Pub. 60 the wT for Remainder is applied to the mass-weighted average
dose to adrenals, brain, extrathoracic airways, small intestine, kidneys, muscle,
pancreas, spleen, thymus, and uterus, except when the following “splitting rule”
applies: If one of these 10 tissues receives a dose greater than any of the 12
individual tissues for which weighting factors are specified, half of the weighting
factor (0.025) is applied to that tissue and the other half is applied to the
mass-weighted committed equivalent dose in the rest of the Remainder tissues. cIn ICRP Pub. 103 the wT for Remainder is applied to the arithmetic mean of
doses to adrenals, extrathoracic (ET) region, gallbladder, heart, kidneys, lymphatic
nodes, muscle, oral mucosa, pancreas, prostate, small intestine, spleen, thymus, and
uterus/cervix.
An occupational ALI for a radionuclide is defined in Appendix B of 10CFR20 as the annual
intake by a reference worker that would result in either a committed effective dose equivalent of
0.05 Sv or a committed dose equivalent of 0.5 Sv to an organ or tissue. An occupational DAC
for an inhaled radionuclide is the ALI divided by 2400 m3 as a reference value for annual intake
of air during work hours.
Footnotes to Appendix B of 10CFR20 provide rules for calculating limiting values for a mixture
of radionuclides based on the limiting values for individual radionuclides in the mixture. If the
identity and concentration of each radionuclide in a mixture are known, the limiting values are
derived as follows: For each radionuclide in the mixture, determine the ratio of the concentration
present in the mixture and the concentration tabulated in Appendix B for that individual
radionuclide. The sum of such ratios for all of the radionuclides in the mixture may not exceed
1.0. If the identity of each radionuclide in a mixture is known but the concentration of one or
more of the radionuclides in the mixture is not known, the DAC for the mixture is the most
restrictive of the limiting DACs for any radionuclide in the mixture.

7
Inhalation dose coefficients used to calculate the ALIs and DACs for occupational intake given
in 10CFR20 are based on a particle size of 1 µm AMAD, which is the default particle size
recommended in ICRP Publication 30. ALIs and DACs are given for each of three solubility
classes of radioactive material addressed in the respiratory model used in ICRP Publication 30:
Class D, Class W, and Class Y. These solubility classes represent material that is relatively
soluble, moderately soluble, and relatively insoluble, respectively, in the lungs and hence are
analogous to Types F, M, and S used in the ICRP’s current respiratory tract model. The letters
D, W, and Y refer to retention times of days, weeks, or years, respectively, in the pulmonary
region of the lung.
In the present report, guidance values developed to limit radiation doses to workers from
internally deposited uranium isotopes are based on primary radiological guidance given in ICRP
Publication 60 (1991), which superseded ICRP Publication 26 (1977). The biokinetic models
applied here are the respiratory tract model described in ICRP Publication 66 (1994a), the
alimentary tract model described in ICRP Publication 100 (2006), and the systemic biokinetic
model for uranium described in ICRP Publication 69 (1995a). The default particle size for
airborne material is 5 μm AMAD.
The primary guidance in ICRP Publication 60 is based on the concept of effective dose. This is
the same concept as the CEDE of ICRP Publication 26, but the tissue weighting factors
(Column 3 of Table D.2) and the limit on the effective dose differ from those of ICRP
Publication 26. The committed effective dose from occupational intakes during any 1-y period
(the “annual effective dose”) is limited to 0.02 Sv as an average over any 5-y period and to 0.05
Sv for any single year. Although ICRP Publication 60 provides guidance for prevention of non-
stochastic effects, the guidance for prevention of stochastic effects generally is more restrictive.
Thus, the ALI is calculated simply as Elimit/e(50), where Elimit is the limiting effective dose (0.02
Sv in this case) and e(50) is the committed effective dose coefficient (Sv/Bq). The DAC for
occupational intake is calculated as:
[ ] Eq. D. 1
ALIs and DACs are not applied explicitly in the present report, but radiation-based action levels
for uranium in air as defined in this report are conceptually the same as the DAC. These action
levels are calculated from Equation D.1, with Elimit = 0.02 Sv used to derive an investigation
level and Elimit = 0.05 Sv used to derive an action level.
Table D.3 compares action levels based on the methods and models of the present report with
DACs given in Appendix B to 10CFR20. Comparisons are made for relatively soluble,
moderately soluble, and relatively insoluble forms of each of the natural uranium isotopes. For
relatively soluble forms of uranium the DACs from 10CFR20 fall between the investigation and
immediate action levels based on present methods for all three isotopes. For moderately soluble
forms the DACs from 10CFR20 are close to the immediate action levels based on the present
methods. For relatively insoluble material the DACs from 10CFR20 are 40-50% lower than the
investigation levels based on the present methods.

8
Table D.3 Comparison of action levels for 234
U, 235
U, and 238
U in air derived
in this report with DACs from Appendix B of 10CFR20
Limiting air concentration (Bq/m3)
234
U 235U 238
U
Relatively soluble DAC (10CFR20, Class D, 1 μm) 19 22 22 Investigation level (This report, Type F, 5 μm) 13 14 14 Immediate action level (This report, Type F, 5 μm) 33 35 36 Moderately soluble DAC (10CFR20, Class W, 1 μm) 11 11 11 Investigation level (This report, Type M, 5 μm) 4.0 4.6 5.2 Immediate action level (This report, Type M, 5 μm) 9.9 12 13 Relatively insoluble DAC (10CFR20, Class Y, 1 μm) 0.74 0.74 0.74 Investigation level (This report, Type S, 5 μm) 1.2 1.4 1.5 Immediate action level (This report, Type S, 5 μm) 3.0 3.4 3.7
D.1.3.2. Avoidance of Chemical Toxicity
Appendix B to 10CFR20 (Footnote 3) states that chemical toxicity may be the limiting factor for
exposure to soluble mixtures of 234
U, 235
U, and 238
U in air. A limiting air concentration of
0.2 mg U/m3 is given for mixtures in which the
235U content is no greater than 5% by mass as an
average over a 40-h workweek. Footnote 3 of Appendix B also gives the following formula for
the specific activity of 235
U-enriched uranium (converted here from conventional units to SI
units):
( )( ) Eq. D. 2
where, E is the percentage of 235
U by weight and is ≥ 0.72. Equation D.2 can be used to
determine whether the DAC for a given level of 235
U enrichment is more restrictive than a mass
concentration limit of 0.2 mg U/m3. The same formula is applied in the present report to
depleted, natural, or enriched uranium except for the number of digits given for the first term of
the second factor [0.43 in Equation 5.2 compared with 0.4 in Equation D.2].
The action levels given in the present report in terms of the mass concentration of uranium in air
are more stringent overall than the limiting value given in 10CFR20, i.e., 0.2 mg U/m3 as an
average over a 40-h workweek. In 10CFR20 that value applies to the average air concentration
over any number of weeks per year, or over an entire career. The 40-h workweek simply
specifies the block of time over which the average should be calculated. In the present report the
same value is recommended as an immediate action level for an unknown form of airborne
uranium, but the recommended limit decreases with the length of the exposure period (i.e., the
averaging period) up to an exposure period of 3 mo. Immediate action to reduce exposure is
indicated if the average air concentration exceeds 0.2 mg U/m3 over a 40-h workweek,

9
0.15 mg U/m3 over two consecutive workweeks, 0.1 mg U/m
3 over a period of one month, or
0.05 mg U/m3 over 3 mo (Figure D.1). In each case the investigation level is 0.3 times the
immediate action level.
D.1.3.3. Sensitivity of the Committed Effective Dose to the Choice of Tissue
Weighting Factors
An action level as defined in the present report is the smaller of two derived values, one based on
primary guidance for avoidance of chemical toxicity and the other based on primary guidance for
limiting potential effects of radiation. Each of the radiologically based values is inversely
proportional to the committed effective dose coefficient for inhalation of a selected form of
uranium and a selected particle size and is based on a target dose of 0.02 Sv (annual committed
effective dose) for derivation of an investigation level and 0.05 Sv for derivation of an immediate
action level.
The committed effective dose coefficients used in this report are based on tissue weighting
factors recommended in ICRP Publication 60 (1991) (Column 3 of Table D.2). These tissue
weighting factors updated the weighting factors recommended in ICRP Publication 26 (1977)
and applied in the current version of 10CFR20 (Column 2 of Table D.2). The recently published
ICRP Publication 103 (2008) provides another update of the ICRP’s tissue weighting factors
(Column 4 of Table D.2). It could be argued that tissue weighting factors from ICRP Publication
26 should be used to develop guidance values for exposure to uranium in the workplace because
ALIs and DACs in the current version of 10CFR20 are based on those weighting factors. On the
other hand, an argument could be made for applying the ICRP’s most recently recommended
tissue weighting factors, i.e., those from ICRP Publication 103.
An analysis was performed to determine the sensitivity of committed effective dose coefficients
E for inhaled 234
U, 235
U, and 238
U to the set of tissue weighting factors applied. In the following,
the abbreviations E26, E60, and E103 are used for committed effective dose coefficients based on
tissue weighting factors given in ICRP Publications 26, 60, and 103, respectively, and the
biokinetic models applied in this report.
As illustrated in Table D.4 for inhaled 234
U, 235
U, or 238
U of Type F, M, or S and particle size
5 μm AMAD, committed effective dose coefficients for uranium isotopes are not highly sensitive
to the choice of tissue weighting factors. This is because the weighting factors in ICRP
Publications 26, 60, and 103 are reasonably similar for those tissues that tend to dominate E26,
E60, and E103 for uranium isotopes. For example, the lung dose largely determines E26, E60, and
E103 for inhalation of Type M or Type S material, and the lung is given the same weight (0.12) in
all three ICRP documents. The most important differences among the three sets of tissue
weights are the weights assigned to Bone surface (0.03 in ICRP Publication 26 and 0.01 in ICRP
Publications 60 and 103) and differences in the definitions and weights of Remainder tissues. In
ICRP Publication 26 the weight 0.3 is given to the dose to Remainder tissues, defined as the
average dose to the five remaining tissues receiving the highest doses. In ICRP Publication 60,
the weight 0.05 is applied to the mass-weighted average dose to adrenals, brain, extrathoracic
airways, small intestine, kidneys, muscle, pancreas, spleen, thymus, and uterus except when the
“splitting rule” applies. The splitting rule states that if one of the tissues in this Remainder group

10
receives a dose in excess of that received by any of the 12 tissues for which weighting factors are
specified (Table D.2), a weighting factor of 0.025 is applied to that tissue and 0.025 is applied to
the mass-averaged committed equivalent dose in the rest of the Remainder tissues. In ICRP
Publication 103, the weight 0.12 is applied to the average of doses to adrenals, extrathoracic (ET)
region, gallbladder, heart, kidneys, lymphatic nodes, muscle, oral mucosa, pancreas, prostate,
small intestine, spleen, thymus, and uterus/cervix. For inhaled 234
U, 235
U, or 238
U, differences in
the definitions of dose to Remainder tissues and the weighting factors for Remainder tissues
account for virtually all of the differences between E60 and E103.
Table D.4 Comparison of committed effective dose coefficients E26, E60, and E103
for inhaled 234
U, 235
U, or 238
U (5 μm AMAD) based on tissue weighting factors
from ICRP Publications 26, 60, and 103, respectivelya
Absorption type Ratio E26 : E60 Ratio E103 : E60 Ratio E26 : E103
234U
F 1.69 1.03 1.64 M 1.06 1.07 0.99 S 0.73 1.40 0.52
235U
F 1.69 1.03 1.64 M 1.06 1.07 0.99 S 0.72 1.41 0.51
238U
F 1.68 1.03 1.64 M 1.06 1.07 0.99 S 0.72 1.42 0.51
aThe biokinetic models described in Section 3 are applied in each case.
D.1.3.4. Title 10 Code of Federal Regulations (CFR) Part 20, Standards for
Protection Against Radiation
These Nuclear Regulatory Commission regulations include consideration of uranium chemical
toxicity at 10 CFR 20.1201 (e). Licensees are required to limit the soluble uranium intake by an
individual to 10 milligrams in a week in consideration of chemical toxicity. Assuming a 50
week work-year, this level would result in a limit of 500 mg U intake in a year. In this report we
calculate the intake rate of a soluble form of uranium that would result in an equilibrium
concentration of 0.3 μg U/g kidney (the investigation level) to be 36.5 mg U/y (Section 5.3.1), or
about a factor of 14 lower than the limiting value in 10 CFR 20. The reference immediate action
level of 1.0 µg U/g kidney corresponds to an inhalation rate of 120 mg U/y.
A limit on ingestion of soluble uranium implied by 10 CFR 20.1201 can be compared with the
present report also, by translating an ingestion intake of 10 mg U per week to an implied kidney
U concentration based on current biokinetic models for uranium. Fractional uptake from the

11
alimentary tract to blood is assumed to be 0.02 for relatively soluble forms of uranium in food or
drink (Section 3.2.4). From Table 3.9, continuous input to the blood of 1 µg U/d results in
approximately 0.01 µg U/g kidney after 100 days. Thus, the expected concentration in the
kidneys from ingestion at the 10 CFR 20.1201(e) limit, 10 mg U/week intake, and assuming a 5-
day workweek, results in a daily intake of 2,000 µg U. Scaling the results from Table 3.9 results
in 20 µg U/g kidney, which is twenty times the reference primary guidance level in this report.
D.2. U.S. Department of Energy Regulation and Technical Standard
D.2.1. 10 CFR 851.23 “Safety and Health Standards.”
In 10 CFR 851.23 (a) (3) and (9) DOE adopts the OSHA generated requirements for U. OSHA’s
uranium limits are given in 29 CFR 1910.1000 Table Z-1 and are summarized below in Section
D.3 of the present report. Specifically, the DOE regulations state:
(a) Contractors must comply with the following safety and health standards that are
applicable to the hazards at their covered workplace:
…(3) Title 29 CFR, Part 1910, “Occupational Safety and Health Standards,” excluding
29 CFR 1910.1096, “Ionizing Radiation.” [See Section D.3. below for quantitative
values.]
…(9) American Conference of Governmental Industrial Hygienists (ACGIH),
“Threshold Limit Values for Chemical Substances and Physical Agents and Biological
Exposure Indices,” (2005) (incorporated by reference, see §851.27) when the ACGIH
Threshold Limit Values (TLVs) are lower (more protective) than permissible exposure
limits in 29 CFR 1910. When the ACGIH TLVs are used as exposure limits,
contractors must nonetheless comply with the other provisions of any applicable
expanded health standard found in 29 CFR 1910.
D.3. U.S. Department of Labor, Occupational Safety and Health Administration (OSHA),
The Occupational Safety and Health Standards address toxic and hazardous substance, and, in
particular, limits for airborne uranium concentrations in air are listed in Table Z-1 Limits for air
contaminates at 29 CFR 1910.1000. For soluble uranium compounds the Permitted Exposure
Limit (PEL) is 0.05 mg/m3 for an 8-hour Time Weighted Average (TWA). For insoluble
uranium compounds the PEL is 0.25 mg/m3. These PELs are equal to 50 µg/m
3 and 250 µg/m
3,
respectively.
In this report the investigation levels for any mixture of 234
U, 235
U, and 238
U are 15 µg/m3 for
relatively soluble mixtures, 61 µg/m3 for moderately insoluble mixtures and 585 µg/m
3 for
insoluble mixtures, based on an average over a 1-y period (Table 5.2). Table 5.1 shows that the
air concentrations for investigation levels are not constant. Rather, they change from high to low
as the exposure time increases from one 40-hour work week to over 3 months. The constant
OSHA limits do not appear to account for the build-up of uranium in the kidneys as the exposure
time increases in an occupational setting.

12
D.4. American Conference of Governmental Industrial Hygienists (ACGIH) Threshold
Limit Values (TLVs) for chemical substances and physical agents and Biological Exposure
Indices (BEIs), 2011.
The TLV-TWA values are given for both soluble and insoluble uranium as 0.2 mg/m3, and the
ceiling is 0.6 mg/m3. These values are unchanged from the 2005 edition that was incorporated
into DOE regulations and are equal to 200 µg/m3 and 600 µg/m
3, respectively. The comments
on comparisons above under Section D.3., above, for OSHA apply here as well.


![Western Uranium Corporation [Type text]western-uranium.com/media/Western Uranium Corp...2015, Western Uranium acquired Black Range Minerals Ltd to acquire additional uranium assets](https://img.pdfslide.us/doc/110x75/5e9e2fdc39245c320521c248/western-uranium-corporation-type-textwestern-uranium-corp-2015-western-uranium.jpg)